 Vipin Tomar1,2*
 Daljit Singh3
 Guriqbal Singh Dhillon4
 Ravi Prakash Singh5
 Jesse Poland6
 Arun Kumar Joshi1,7
 Pawan Kumar Singh5
 Pradeep Kumar Bhati1
 Suneel Kumar1
 Mokhlesur Rahman8
 Budhi Sagar Tiwari2
 Uttam Kumar1,5*
- 1Borlaug Institute for South Asia, Ludhiana, India
- 2Institute of Advanced Research, Gandhinagar, Gujarat, India
- 3The Climate Corporation, Bayer Crop Science, Creve Coeur, MO, United States
- 4Department of Biotechnology, Thapar Institute of Engineering and Technology, Patiala, India
- 5Global Wheat Program, International Maize and Wheat Improvement Center (CIMMYT), Texcoco, Mexico
- 6Department of Plant Pathology, Kansas State University, Manhattan, KS, United States
- 7International Maize and Wheat Improvement Centre, New Delhi, India
- 8Wheat Research Center, Regional Agricultural Research Station, Bangladesh Agricultural Research Institute, Jamalpur, Bangladesh
Spot blotch disease caused by Bipolaris sorokiniana is a major constraint for wheat production in tropics and subtropics. The introgression of spot blotch resistance alleles to the disease susceptible lines is critical to securing the wheat production in these regions. Although genome-wide association studies (GWASs) for spot blotch were attempted earlier, the present study focused on identifying new quantitative trait loci (QTLs) for spot blotch under natural disease pressure in diverse field conditions. A total of 139 advanced spring wheat lines were evaluated in three environments (three years and two locations) in India and Bangladesh. The GWAS using 14,063 polymorphic genotyping-by-sequencing (GBS) markers identified eight QTLs associated with spot blotch disease resistance belonging to eight chromosomes across the wheat genome. Here, we report the identified marker–trait associations (MTAs), along with the allele effects associated with the disease. The functional annotation of the significant markers identified NBS-LRR, MADS-box transcription factor, and 34 other plant-related protein families across multiple chromosomal regions. The results indicate four promising new QTLs on chromosomes 1A (497.2 Mb), 1D (89.84 Mb), 2B (421.92 Mb), and 6D (6.84 Mb) associated with several disease resistance protein families. These results provide insights into new genomic regions associated with spot blotch disease, and with additional validation, could be utilized in disease resistance breeding efforts in wheat development.
Introduction
Wheat (Triticum aestivum L.) is the primary staple food for more than 35% of the world’s population (FAO, 2018). The pace of wheat improvement must accelerate to meet the projected global food demand by 2050. The Green Revolution played a crucial role in India, Pakistan, Nepal, and Bangladesh, ensuring food security in this densely populated region of the world (Joshi et al., 2007b). However, wheat production faces multiple threats via rapidly evolving pathogen variants, pests, and increased climate variability, which considerably jeopardizes crop productivity (Sharma et al., 2007b; Friesen et al., 2008; Gurung et al., 2009, 2012). Breeding wheat for climatic resilience and disease resistance combined with good agronomic value can potentially improve wheat productivity to meet future food demands (Mondal et al., 2016).
Spot blotch caused by Bipolaris sorokiniana is a major constraint in wheat production in tropics and subtropics (Dubin and Van Ginkel, 1991; van Ginkel and Rajaram, 1998). The pathogen has a worldwide dispersal, but it is predominantly aggressive under warm, high relative humidity, and high temperature associated conditions with imbalanced soil fertility. Major yield losses are observed in the fields with lower inputs and under late-sown conditions (Joshi et al., 2007b). B. sorokiniana acts as a causal agent for numerous diseases like head blight, seedling blight, foliar blight/spot blotch, common root rot, and black point of wheat, barley, other small cereal grains and grasses (Lennard, 1984). Therefore, spot blotch of wheat is considered as one of the most crucial diseases caused by this pathogen in the mega-environments characterized by temperature above 17°C and high humidity (van Ginkel and Rajaram, 1998).
It is often difficult to achieve the desired level of host resistance to several diseases through conventional breeding. In the case of wheat disease, resistance is inherited both qualitatively and quantitatively (Kumar et al., 2009, 2010; Marone et al., 2013; French et al., 2016). The genetic basis of spot blotch resistance has earlier been documented as eight major quantitative trait loci (QTLs), namely, QSb.bhu-2A, QSb.bhu-2B, QSb.bhu-2D, QSb.bhu-3B, QSb.bhu-5B, QSb.bhu-6D, QSb.bhu-7B, and QSb.bhu-7D (Kumar et al., 2009, 2010). Sharma et al. (2007a) reported three microsatellite markers (Xgwm67, Xgwm570, and Xgwm469) linked with spot blotch resistance. The QTL QSb.bhu-5B, QSb.bhu-7D, and QSb.bhu-3B have been designated as genes Sb1, Sb2, and Sb3, respectively, in further studies (Lillemo et al., 2013; Kumar et al., 2015; Lu et al., 2016). Lr34 and Lr46, the two broadly used genes conferring leaf rust resistance, have also been reported to contribute to spot blotch resistance. While the Lr34 gene has been reported to be the major locus on chromosome 7D explaining up to 55% phenotypic variation for spot blotch disease resistance, this locus was given the gene designation Sb1 (Lillemo et al., 2013). Nevertheless, in the past few years, several QTLs and genetic markers for spot blotch resistance have been identified in multiple studies in wheat (Gurung et al., 2014; Zhu et al., 2014; Singh et al., 2018).
Due to evolutionary changes in pathogen populations, resistance genes may lose their effectiveness over time. Given these challenges, identification and mapping of novel resistance genes would aid breeding for disease resistance in wheat. One of the approaches is to identify spot blotch resistance QTLs through association mapping. This approach leverages historical recombination and generally has better mapping resolution compared to biparental mapping (Zhu et al., 2008). The genome-wide association study (GWAS) using genotyping by sequencing (GBS) to identify QTLs for traits of interest provides advantage through better genome coverage compared to conventional marker systems like SSRs, AFLP, and CAPs. The GBS utilizes the advantage of high-throughput genotyping assays with relatively low data costs, which are much higher in genome sequencing and re-sequencing techniques (Elshire et al., 2011). A fundamental approach in GWAS is to have enough genome coverage so that functional alleles will be in linkage disequilibrium (LD) with at least one marker (Myles et al., 2009). The association studies for disease resistance, including spot blotch, have been reported in some of earlier studies (Maccaferri et al., 2010, 2015; Yu et al., 2011; Zegeye et al., 2014; Ayana et al., 2018).
There are limited reports where the same set of genotypes is exposed to natural disease pressure to identify genomic regions underpinning wheat spot blotch resistance. Thus, the main objective of this study was to establish marker–trait associations (MTAs) for spot blotch resistance using GBS markers in spring wheat specific to the South Asian regions, viz., India and Bangladesh, the well-known hot spots for this disease. We also aimed to identify novel QTLs and validated known genomic loci conferring spot blotch resistance in wheat.
Materials and Methods
Plant Material and Field Layout
The population was a collection of 139 advanced breeding lines of spring wheat (Supplementary Table S1) derived from the crosses where elite high-yield breeding lines were used as parents. The advanced lines were sent to South Asia as part of the CIMMYT wheat breeding program aiming to develop high-yielding varieties suitable for South Asia. They were carefully assembled to avoid the confounding effects of phenology after multiyear and multilocation trials. The lines were evaluated in two replicates at two field locations: Bangladesh Agricultural Research Institute (BARI), Jamalpur, Bangladesh (24°22′07.7″N, 88°39′42.0″E), during 2017 and Borlaug Institute for South Asia (BISA), Pusa (25°57′22.8″N, 85°40′13.1″E), in north India during 2019 and 2020 seasons in a randomized block design. For convenience, the different location–season combinations were termed as Env1 (Pusa19), Env2 (Pusa20), and Env3 (BARI17). Pusa, India, and Jamalpur, Bangladesh, are known hot spots for spot blotch disease (Sharma et al., 2007b). The trials were timely sown with full irrigation applied through gravity flood irrigation. The spreader rows of susceptible variety Sonalika were also planted for creating epiphytotic disease conditions. Besides, four auxiliary gravity flood irrigations were also given at regular intervals. All agronomic practices like fertilization and weeding were performed as recommended for each location.
Screening for Spot Blotch Disease Resistance
The material was evaluated under natural infection conditions in the field. Spot blotch response was evaluated thrice during the mid to advanced phases of disease development, i.e., between heading (Growth Stage 50 or GS50 on Zadoks scale) and grain filling stage (GS80) (Zadoks et al., 1974). The disease severity (SEV) was recorded visually on a 0–100 scale where 0 is complete resistance and 100 is completely susceptible.
Genotyping
Seeds of all lines were obtained from the CIMMYT genetic resource program, and genomic DNA was extracted from five bulked leaves using a modified CTAB procedure as described in Dreisigacker et al. (2016) in CIMMYT, Mexico. The DNA samples were sent to Kansas State University, United States, for GBS, described by Poland et al. (2012) and sequenced with Illumina HISeq2500. GBS-SNP markers were called with TASSEL v5.2 pipeline GBSv2 (Bradbury et al., 2007) and aligned to the reference Chinese Spring Wheat Assembly (RefSeq v1.0). The following SNP filtering criteria were applied on raw SNP calls: less than 30% missing markers, minimum 5% minor allele frequency (MAF), and less than 20% heterozygosity. The filtering step yielded 14,063 markers, and the remaining missing values were imputed using Beagle v4.1 (Browning and Browning, 2016).
Statistical Analysis
The experimental design in each environment was a randomized complete block design with two replications per environment/location. The best linear unbiased prediction (BLUP) values were obtained through META-R v6.03 (Alvarado et al., 2020), developed by CIMMYT, Mexico, using the following formula:
where Yik is the trait of interest, μ is the mean effect, Repi is the effect of the ith replicate, Genk is the effect of the kth genotype, ϵik is the error associated with the ith replication, and the kth genotype, which is assumed to be normally and independently distributed, with mean zero and homoscedastic variance σ2. For across environments, Yijk is the trait response,Envj is the jth environment, Repi(Envj) is the effect of ith replication in the jth environment, and Envj×Genk is the environment and genotype interaction. The resulting analysis produced the adjusted trait phenotypic values in the form of BLUP within and across environments. The BLUP model considers genotypes as random effects, minimizing the effect of screening time and other environmental effects on the spot blotch severity.
Besides, the components of the phenotypic variance of a given trait at an individual environment were also extracted to calculate broad-sense heritability using the formula as:
where and are the genotype and error variance components, respectively, is the genotype by environment interaction variance, n env is the number of environments, and n reps is the number of replicates. All effects are considered random for calculating the BLUP and broad-sense heritability. The BLUP phenotypic distributions of disease scores at each environment were plotted to check normality assumptions.
Principal Component Analysis and Linkage Disequilibrium
Principal component analysis (PCA) was performed using 14,063 SNPs and 139 genotypes in FarmCPU (Liu et al., 2016). The first two principal components were drawn to show the clustering among genotypes. The population structure (PC) and LD were estimated in TASSELv5.2 (Bradbury et al., 2007). The intra-chromosomal LD was calculated as the pairwise marker correlations (r2) between the SNP markers plotted against the physical distance for significant MTAs. The long-distance LD and spline were fitted to the LD-decay graph using r2 values of less than 0.99 using ggplot2 v3.30 in R v3.5.2 (R Core Team, 2019).
Genome-Wide Association Analysis
The FarmCPU (Liu et al., 2016) model of GAPIT 3.0 was used to test the MTA between the SNP markers and spot blotch disease severity (SEV) and to take advantage of the mixed linear model (MLM) and stepwise regression [fixed-effect model (FEM)]. This algorithm uses both the FEM and the random-effect model (REM) iteratively where FEM is employed to test m genetic markers, and associations or pseudo-quantitative trait nucleotides are included as covariates to control false positives in REM.
Subsequent GWAS analysis was performed using 14,063 SNPs scored on 139 lines with phenotypic data of disease score from the seasons 2017, 2019, and 2020. Given the exploratory nature of this study, we used a relatively less-stringent p-value threshold of 0.003 (–log10P = 2.5) to avoid removing true positive associations. To uncover the stable disease resistance QTLs, association signals that were significant across two or more environments were selected. The allelic effects were further investigated to identify significantly associated markers in lieu of phenotypic data for studying the importance of individual alleles in spot blotch disease resistance.
Gene Functional Annotations
Genome-wide association study results were further analyzed to test if the MTAs fall within the known genic regions using functional annotation from the reference genome assembly (IWGSC Ref Seq v1.0). Functional annotation of the genes either harboring significant SNPs or adjacent to the SNPs was retrieved and examined for their association with spot blotch resistance from the genome annotations provided by IWGSC. Subsequently, protein functions were literature mined from annotated information.
Physical Mapping
From the physical map prepared, we identified the most significant QTLs found on eight wheat chromosomes. A total of 29 SNPs were mapped and used from GWAS wherein a group was considered to be different if physical distance is more than 5 Mb. New QTLs of the present study and genes/markers associated with SB resistance from previous studies were plotted for physical mapping.
Results
Estimation of Heritability
The mean disease severity of the population ranged from 2.65 to 39.35 in three environments (2017, 2019, and 2020), including Pusa, India, and BARI, Bangladesh (Supplementary Table S2). The highest mean disease severity was recorded in Pusa20 (Env2) while the lowest was at BARI17 (Env3). The analysis of variance revealed the highest heritability in Env3 (0.82) and the lowest in Env1 (0.72). Based on the combined analysis of all environments, we observed high heritability (0.76). There were significant Genotype × Environment interactions (P < 0.0001; Table 1). The populations displayed significant phenotypic variation for spot blotch resistance with a nearly continuous distribution of lines in all environments (Figure 1).
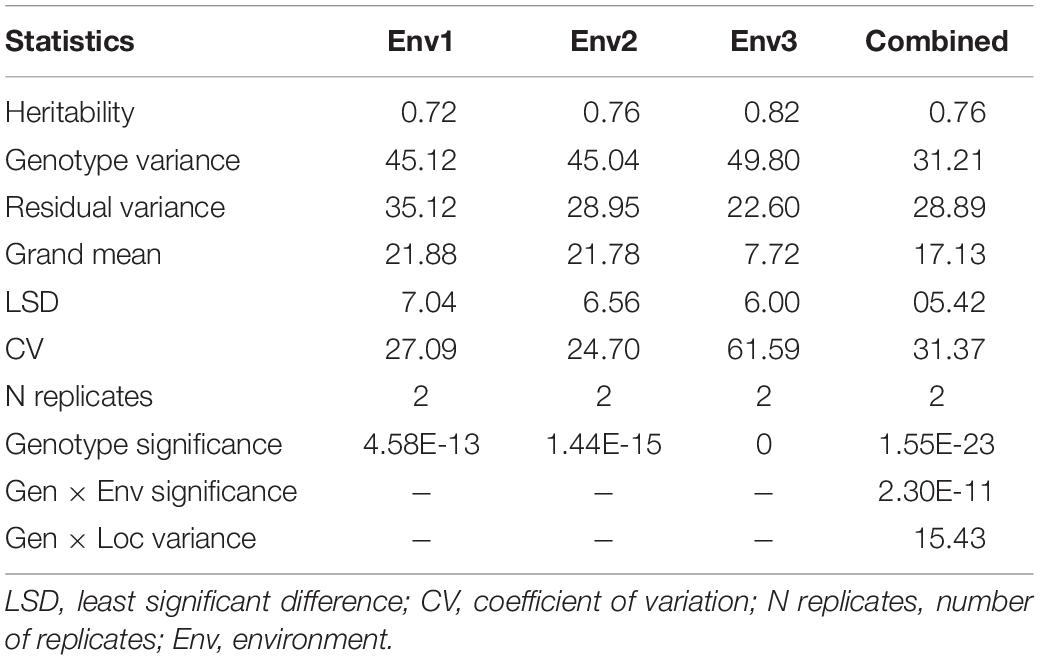
Table 1. Analysis of variance of 139 advanced lines evaluated for spot blotch disease resistance in four environments based on BLUP of disease severity recorded at GS 77 on Zadoks scale at BISA Pusa (India) and BARI, Jamalpur (Bangladesh).
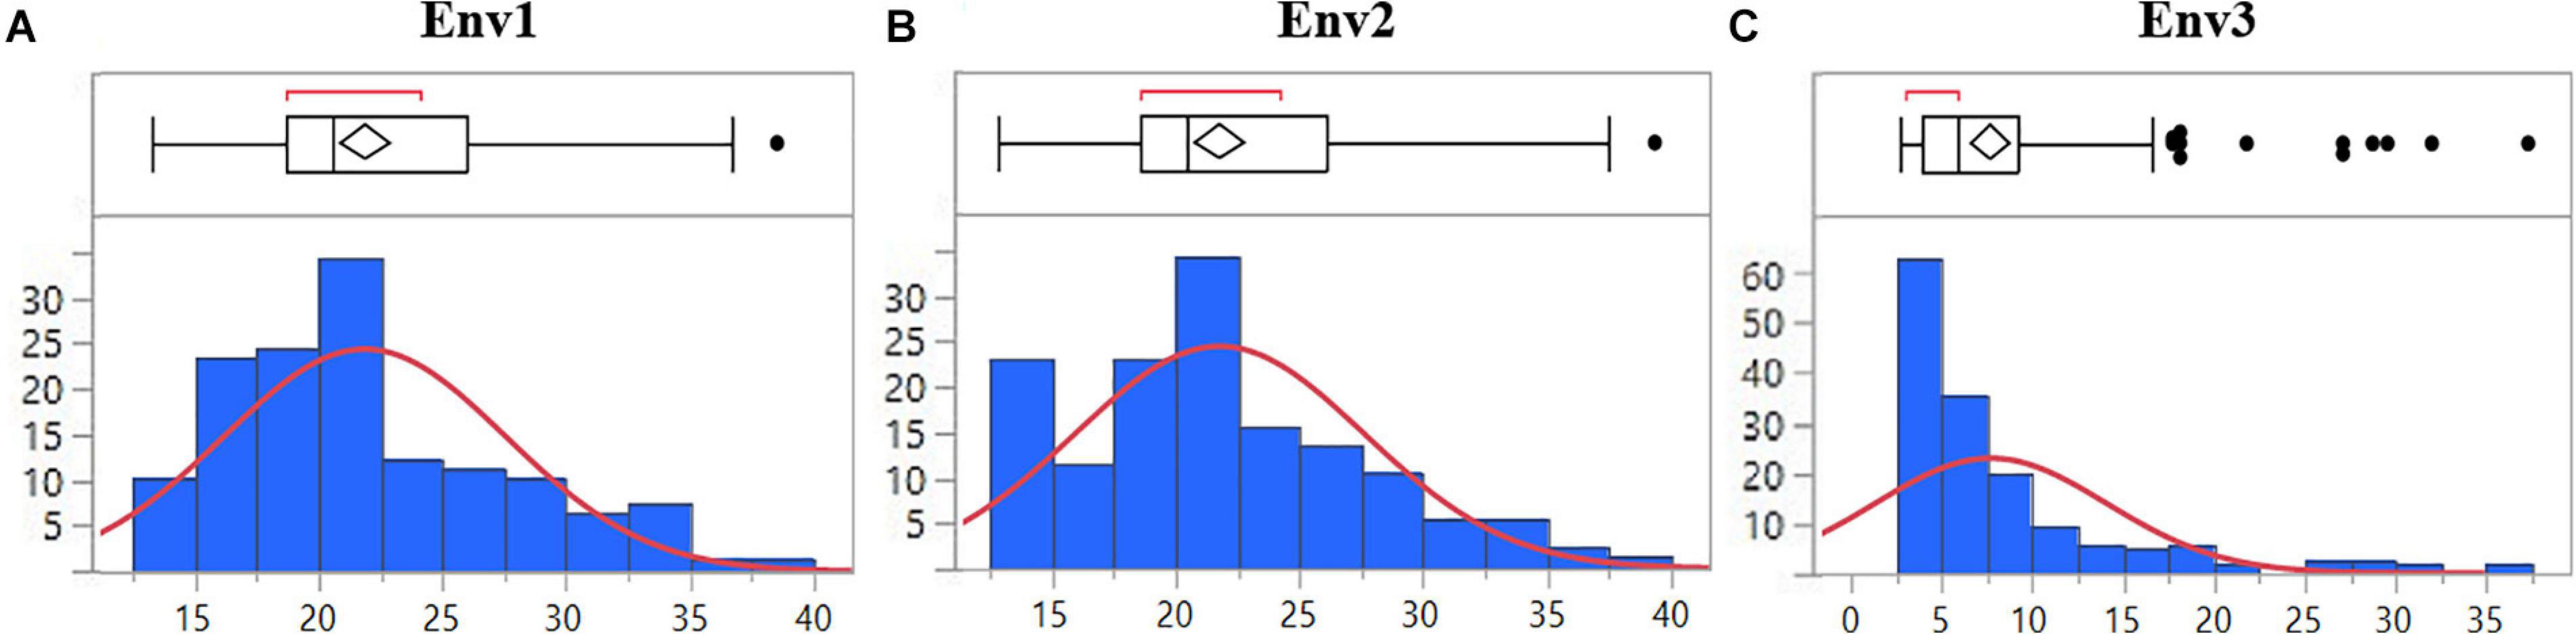
Figure 1. Distribution of 139 advanced wheat breeding lines for spot blotch severity (%) based on BLUPs in (A) Env1, (B) Env2, and (C) Env3 environments. The lines in the boxplot represent the median of the distribution and the diamond represents the model disease score, while the black dots are outliers.
SNP Density and Principal Component Analysis
Among polymorphic SNP markers, 40.9% (5754), 50.8% (7142), and 8.3% (1167) were from the A, B, and D genomes, respectively. With a genomic coverage of 13.9 GB and 14,063 markers across the genome, the average marker density was 1.9 Mb per marker. The lowest marker density 7.03 Mb per marker was at chromosome 4D while the highest 0.54 Mb per marker was observed at chromosome 2B. The average distance between markers for A, B, and D genomes was 0.89, 0.84, and 3.92 Mb, respectively (Figure 2).
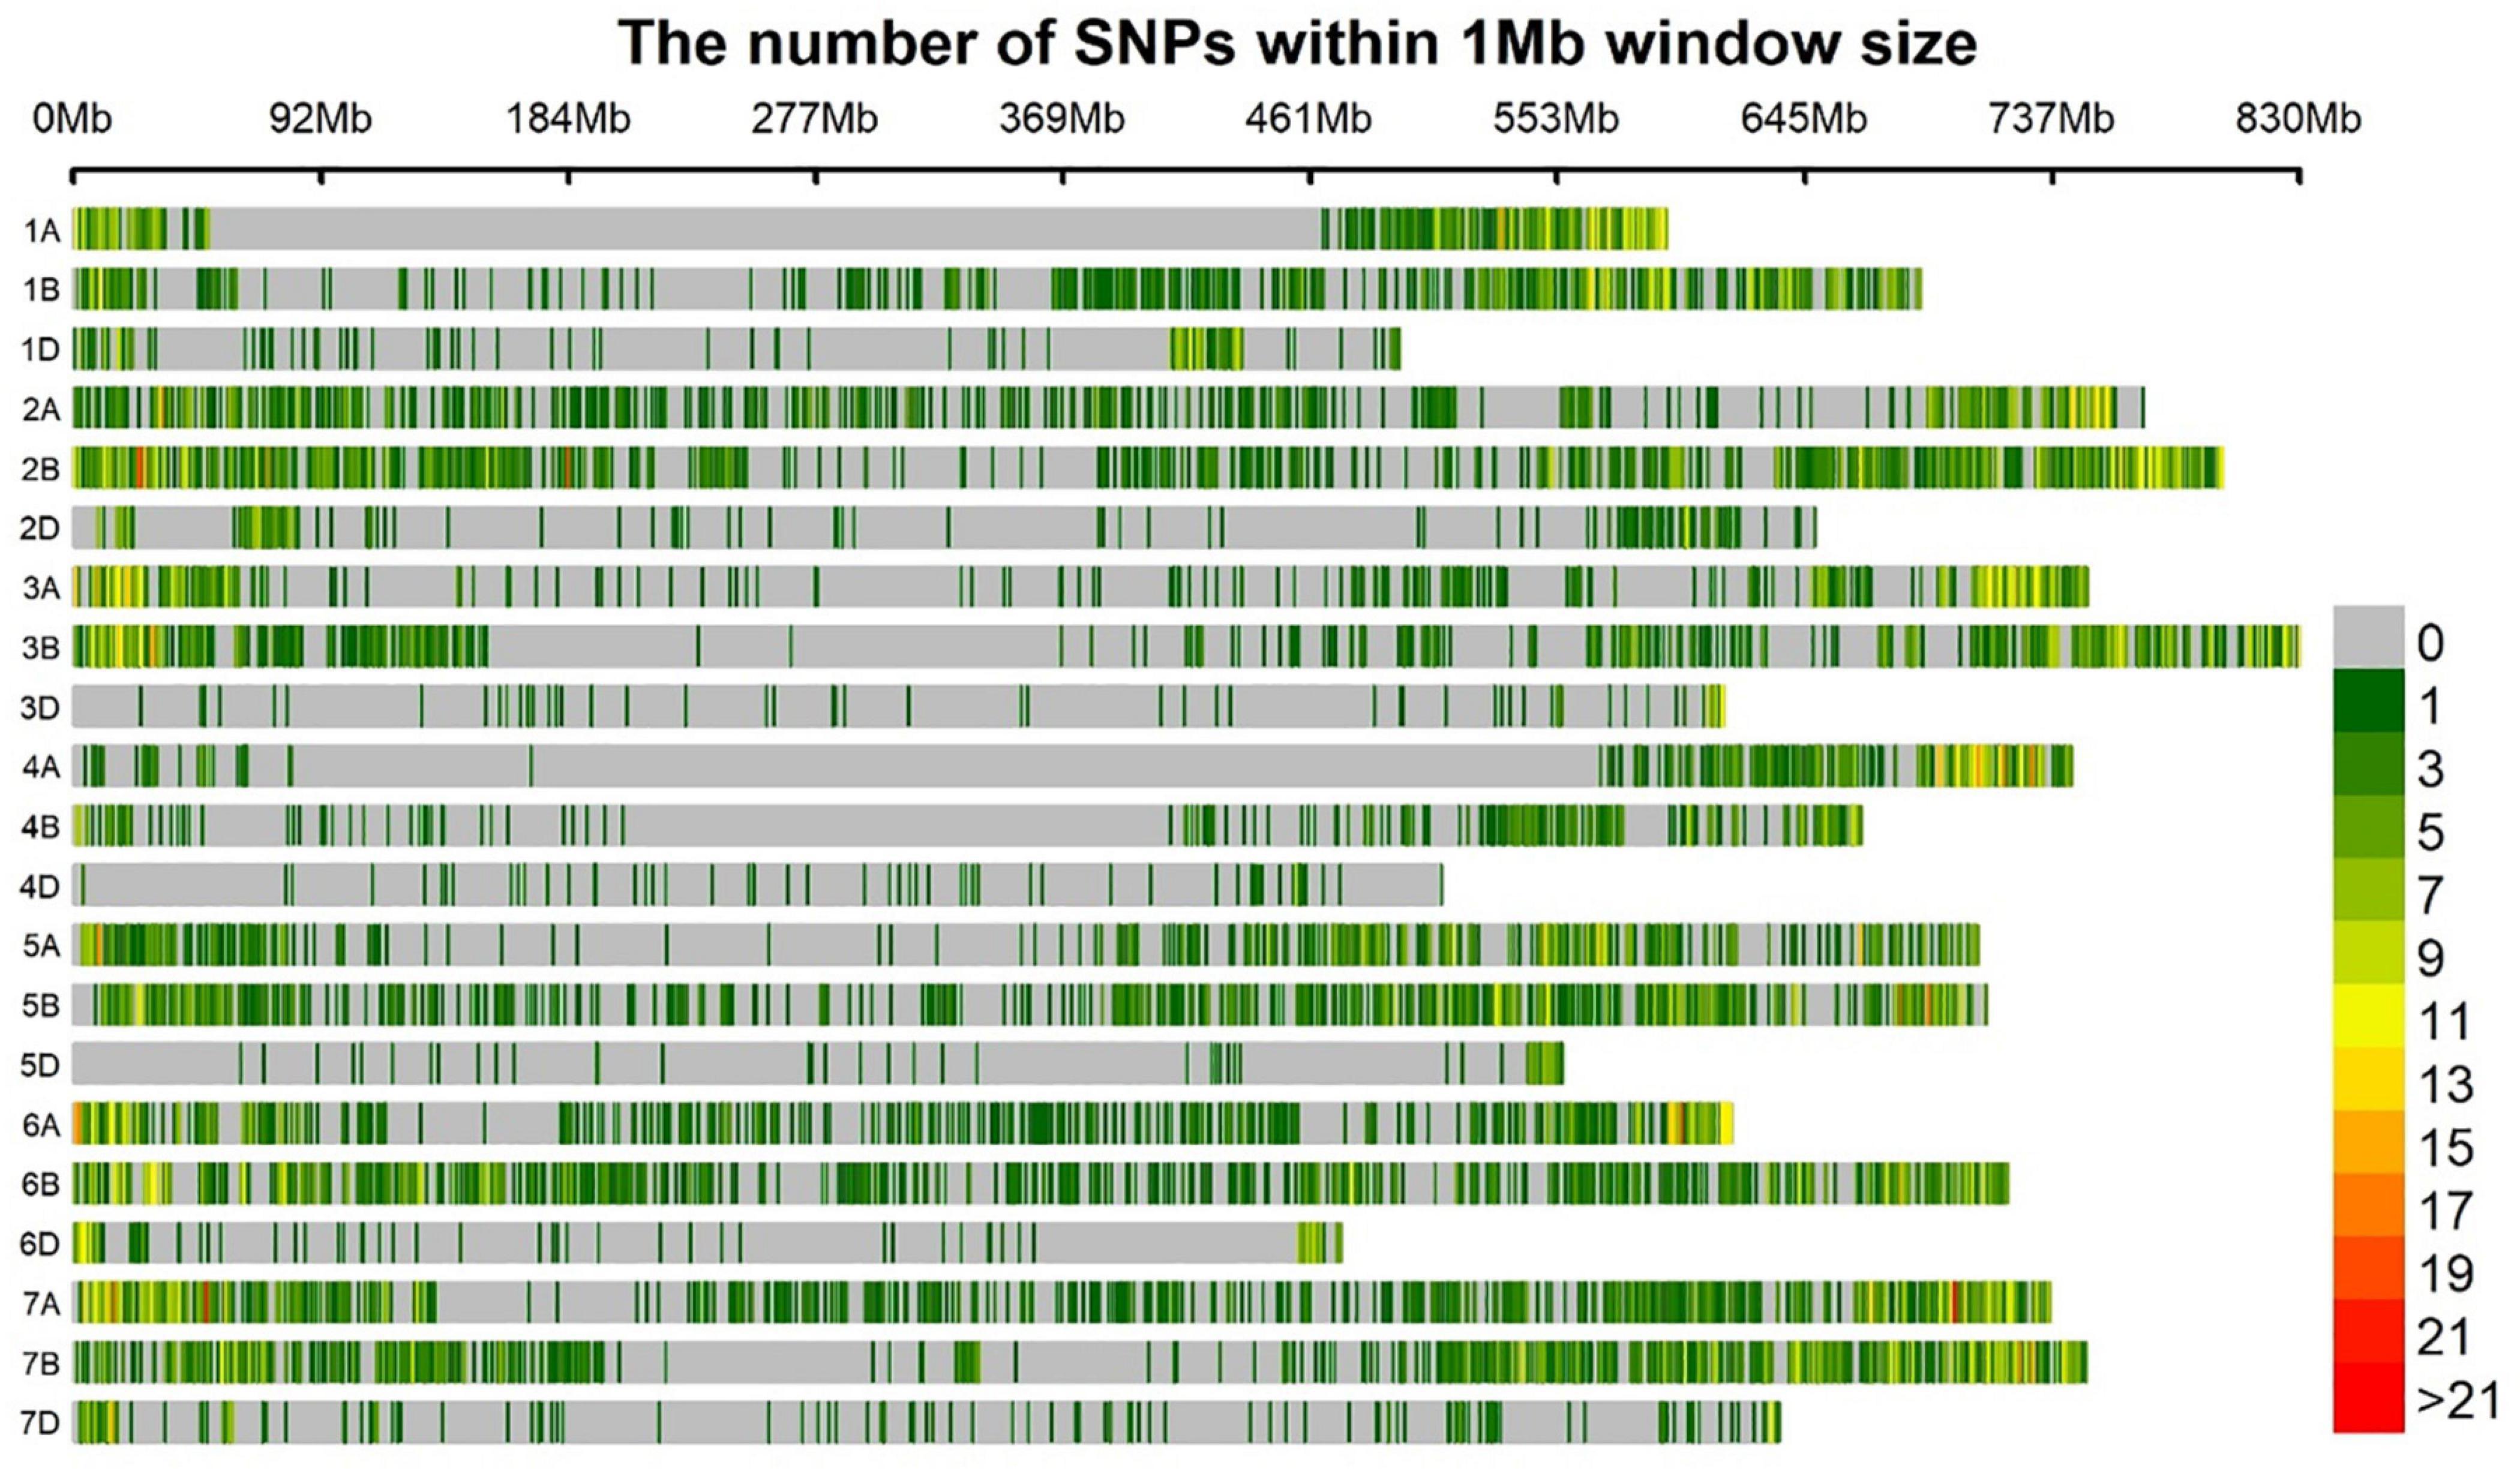
Figure 2. Bar plot showing the densities of 14,063 GBS markers on the 21 wheat chromosomes. The color key with marker densities indicates the number of markers within a window size of 1 Mb.
Population structure was determined using PCA, where genotypes were clustered into 12 groups using the Ward method in JMP v.14 (Figure 3). Group 1 (G–I) consisted of nine lines, including the resistant check HD2733. Group G–X consisted of a maximum of 16 lines, while the minimum number of lines is in the group G–XI (six lines). Based on pedigree information, most of the lines in a group shared allele descended from common parents. The lines without common parents or less than three sibs per family were classified as group G-XII. The largest group (G–X) consisted of lines with mixed pedigrees, including TEPOKA, TRCH, SAUAL, WBLL#1, Kachu#1, BAV92//IRENA/KAUZ, FRANCOLIN#1, AMUR, ROLF07, FRET2, BABAX, and BORL14. The parental line SAUAL was the most common parent in group G–IV. The parental lines with TRCH/SRTU//KACHU cross in their genetic backgrounds dominated group G–V.
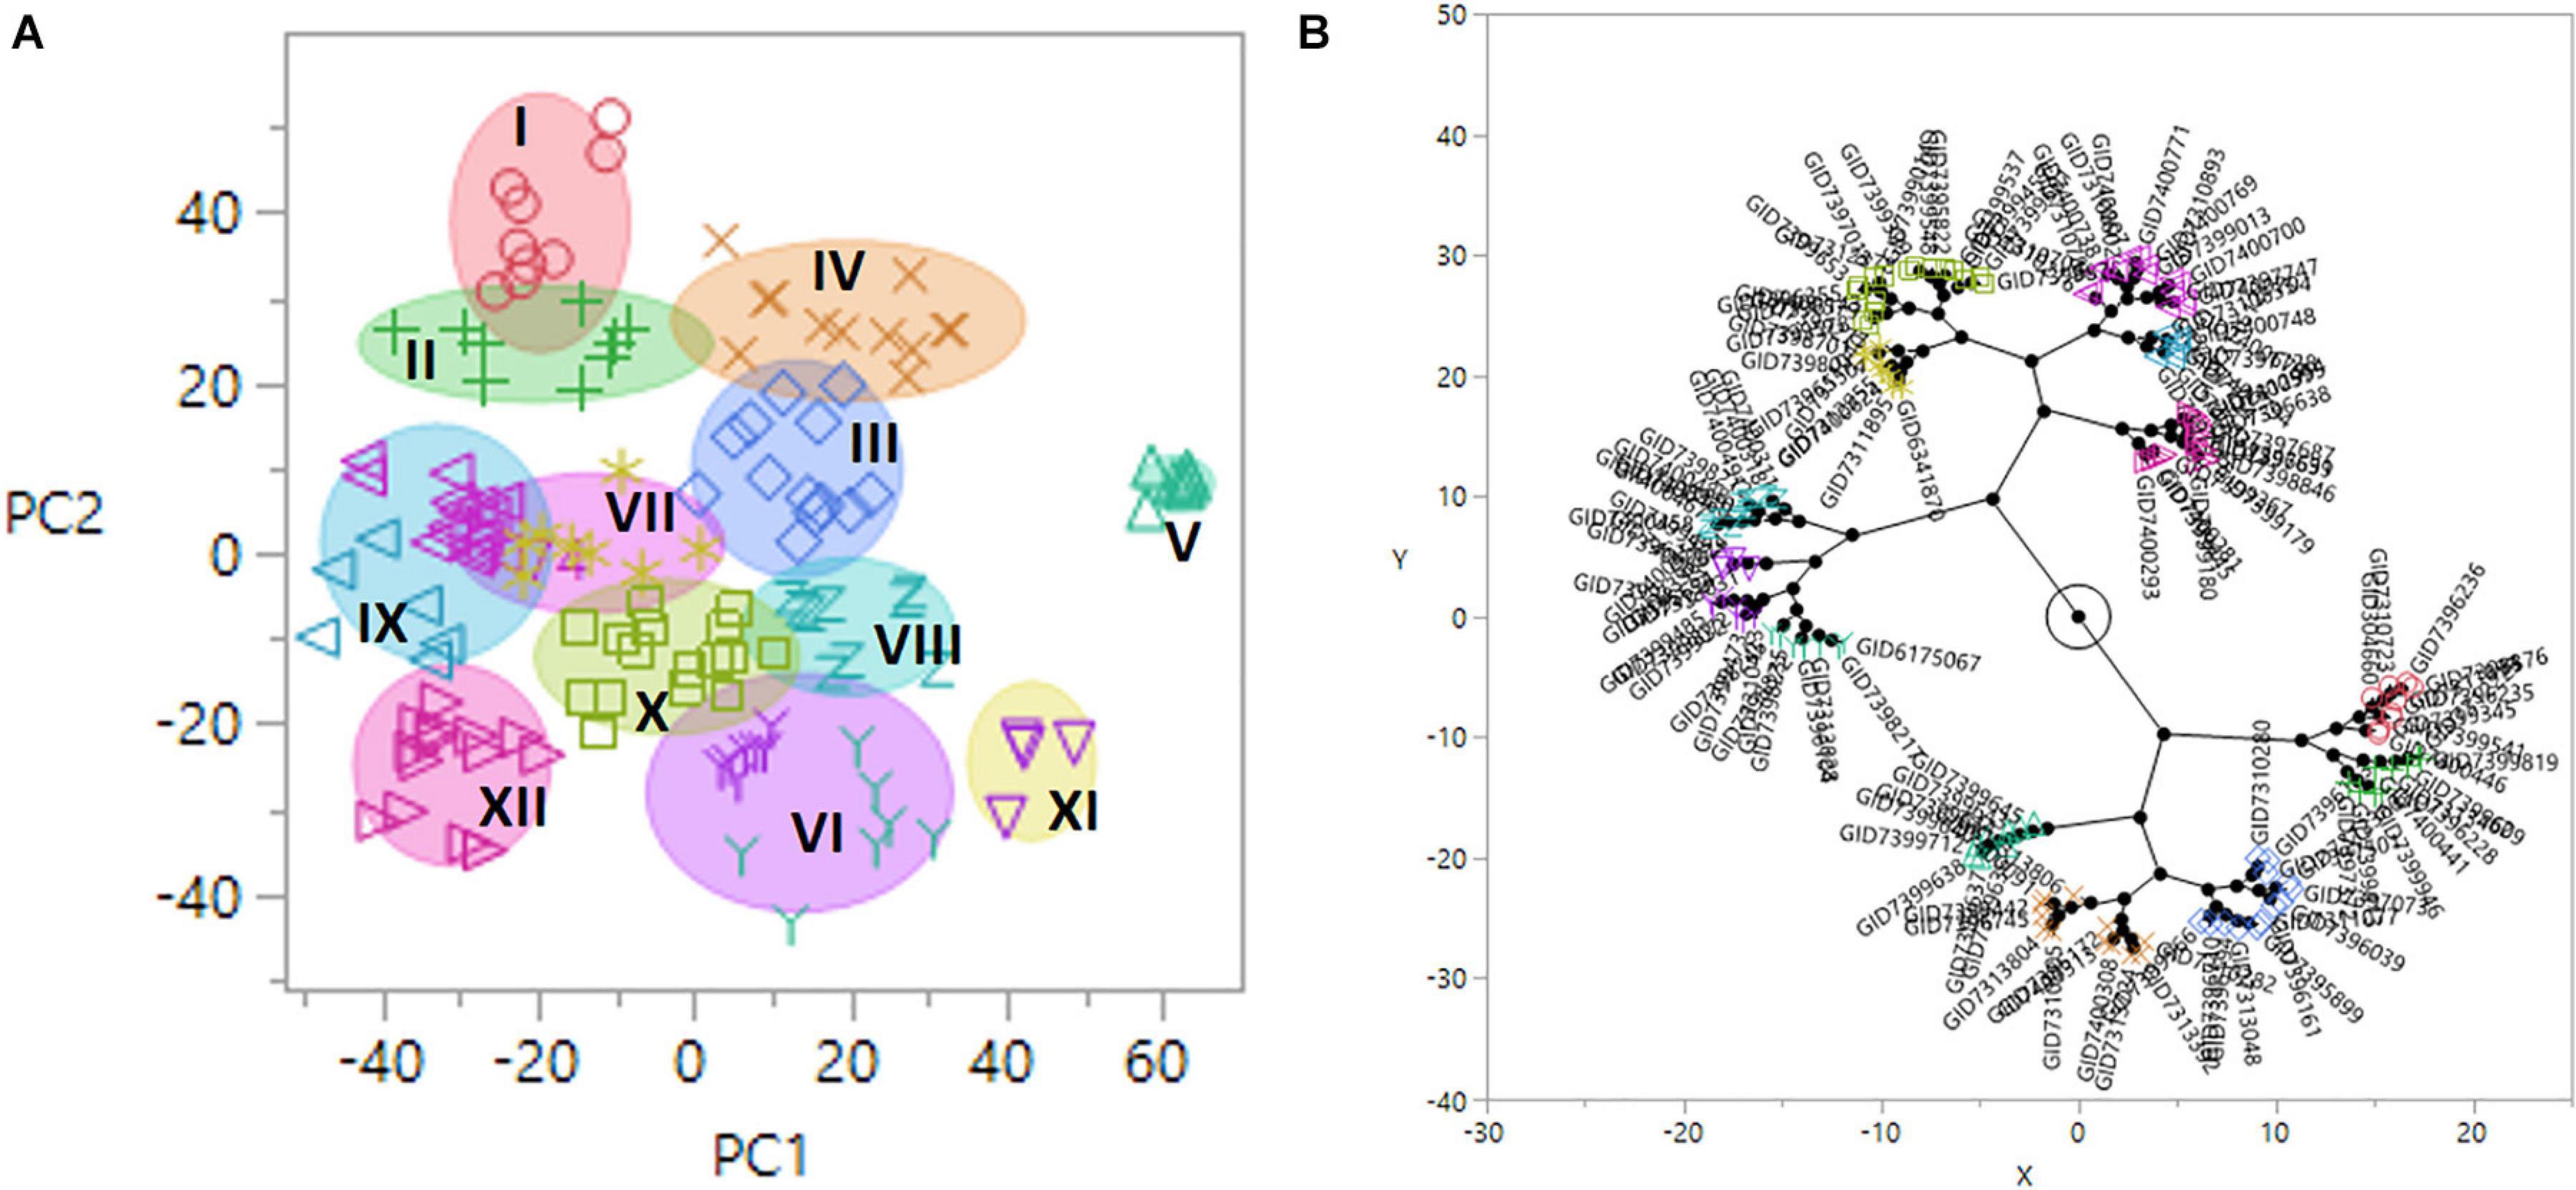
Figure 3. (A) Diagram of principal component (PC) 1 and 2 vectors calculated by the principal component analysis (PCA) of 14,063 genotyping-by-sequencing (GBS) single-nucleotide polymorphism (SNP) markers in 139 advanced wheat breeding lines, plotted in 12 population groups (I–XII). The x-axis and y-axis represent projections of the PC1 and PC2, respectively. (B) Constellation plot using the Ward method in JMP v.14.
Marker–Trait Associations of Spot Blotch
The GWAS of spot blotch resistance was performed based on the disease scores collected at adult plant stages. A p-value < 0.003 was used as a threshold to identify significant MTAs. The GWAS results from three environments are given in Figure 4. A total of 29 significant MTAs appeared in a minimum of two environments belonging to eight QTLs on chromosome 1A, 1B, 1D, 2A, 2B, 4A, 5B, and 6D (Figure 5). The allele effects of those QTLs ranged from −31.37% (Env1) to 30.67% (Env2) while the allele effects for individual environments ranged from −31.37 to 30.07%, −22.83 to 30.67%, and −23.30 to 23.24% in Env1, Env2, and Env3, respectively (Table 2). The largest allele effect is explained by the SNP S2B_422983662 located on chromosome 2B in Env2 (30.67%) (Table 2). The allele effects for alternative alleles from each of the associated SNP markers were plotted (Figure 6). We detected a significant variance in the mean values of the favorable alleles that led to an increase in resistance varying from 12.5 to 70% for spot blotch. The “Kruskal–Wallis” test was used to determine whether there are significant differences between the mean values of two alleles. Major alleles have lower mean values compared to minor alleles except for two QTLs (Q.Sb.bisa-1D and Q.Sb.bisa-5B), where minor alleles are found to be effective (Figure 6 and Table 2).
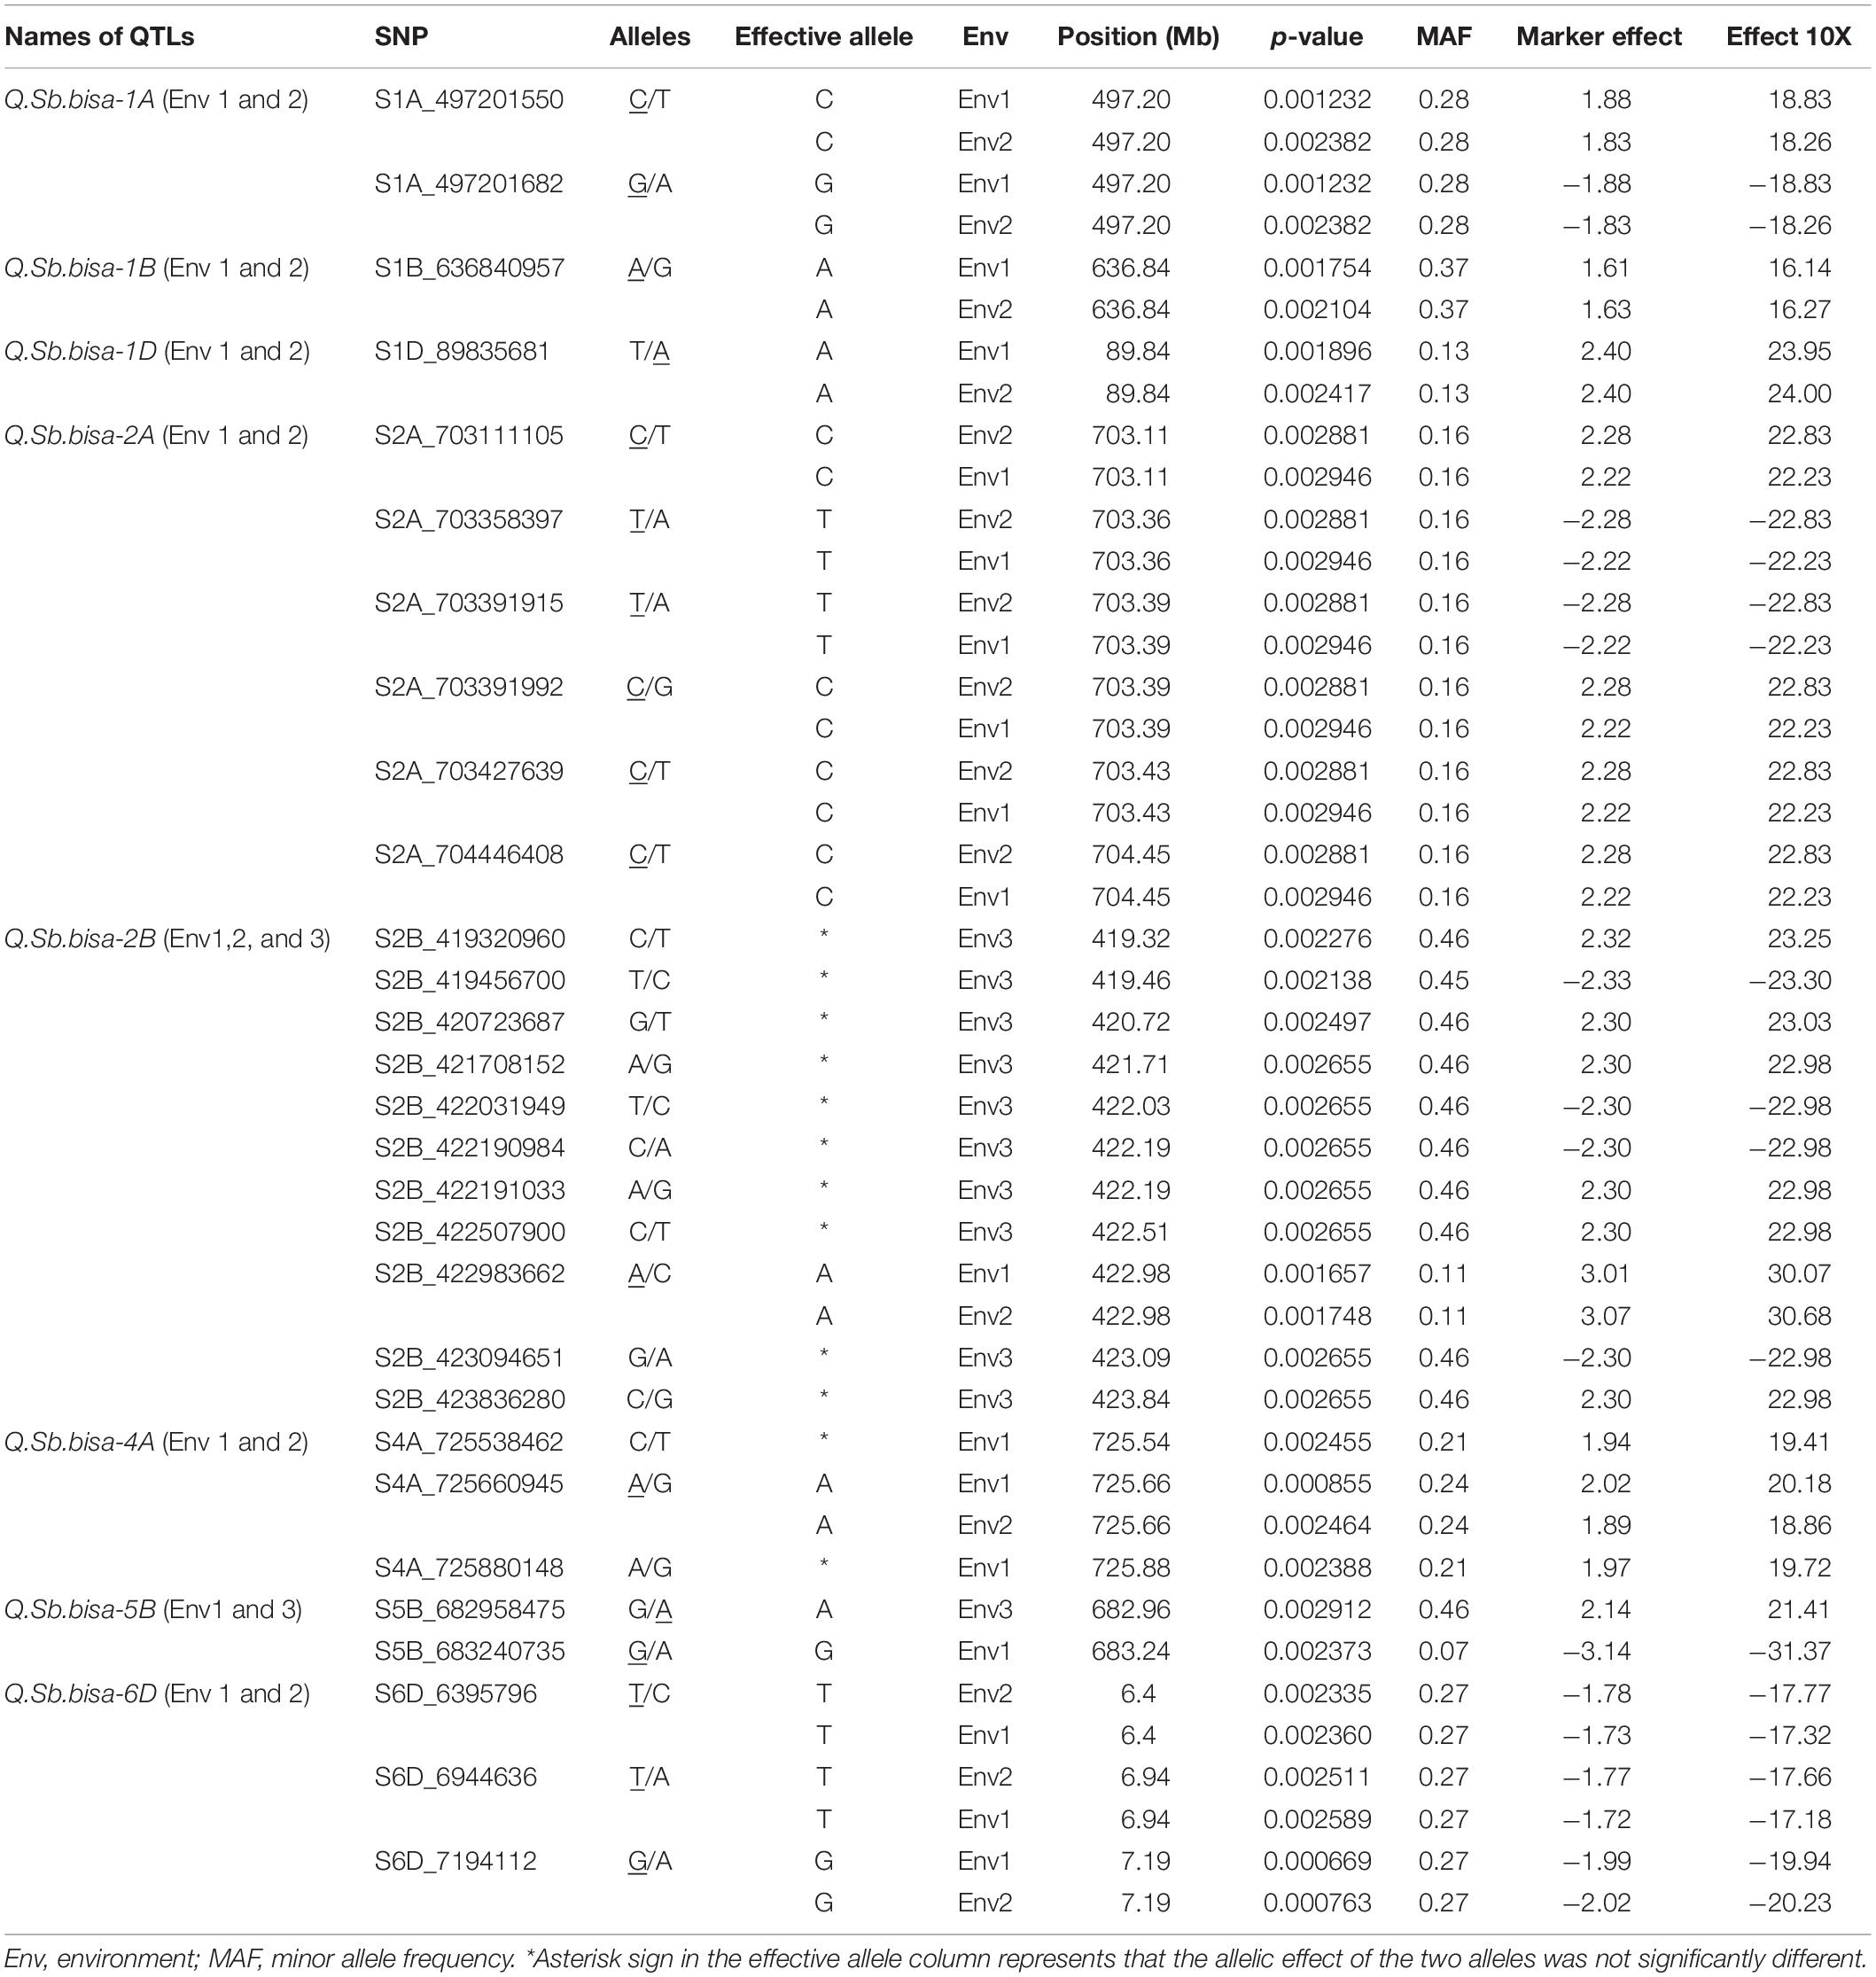
Table 2. Summary of the significant SNPs associated with spot blotch resistance.
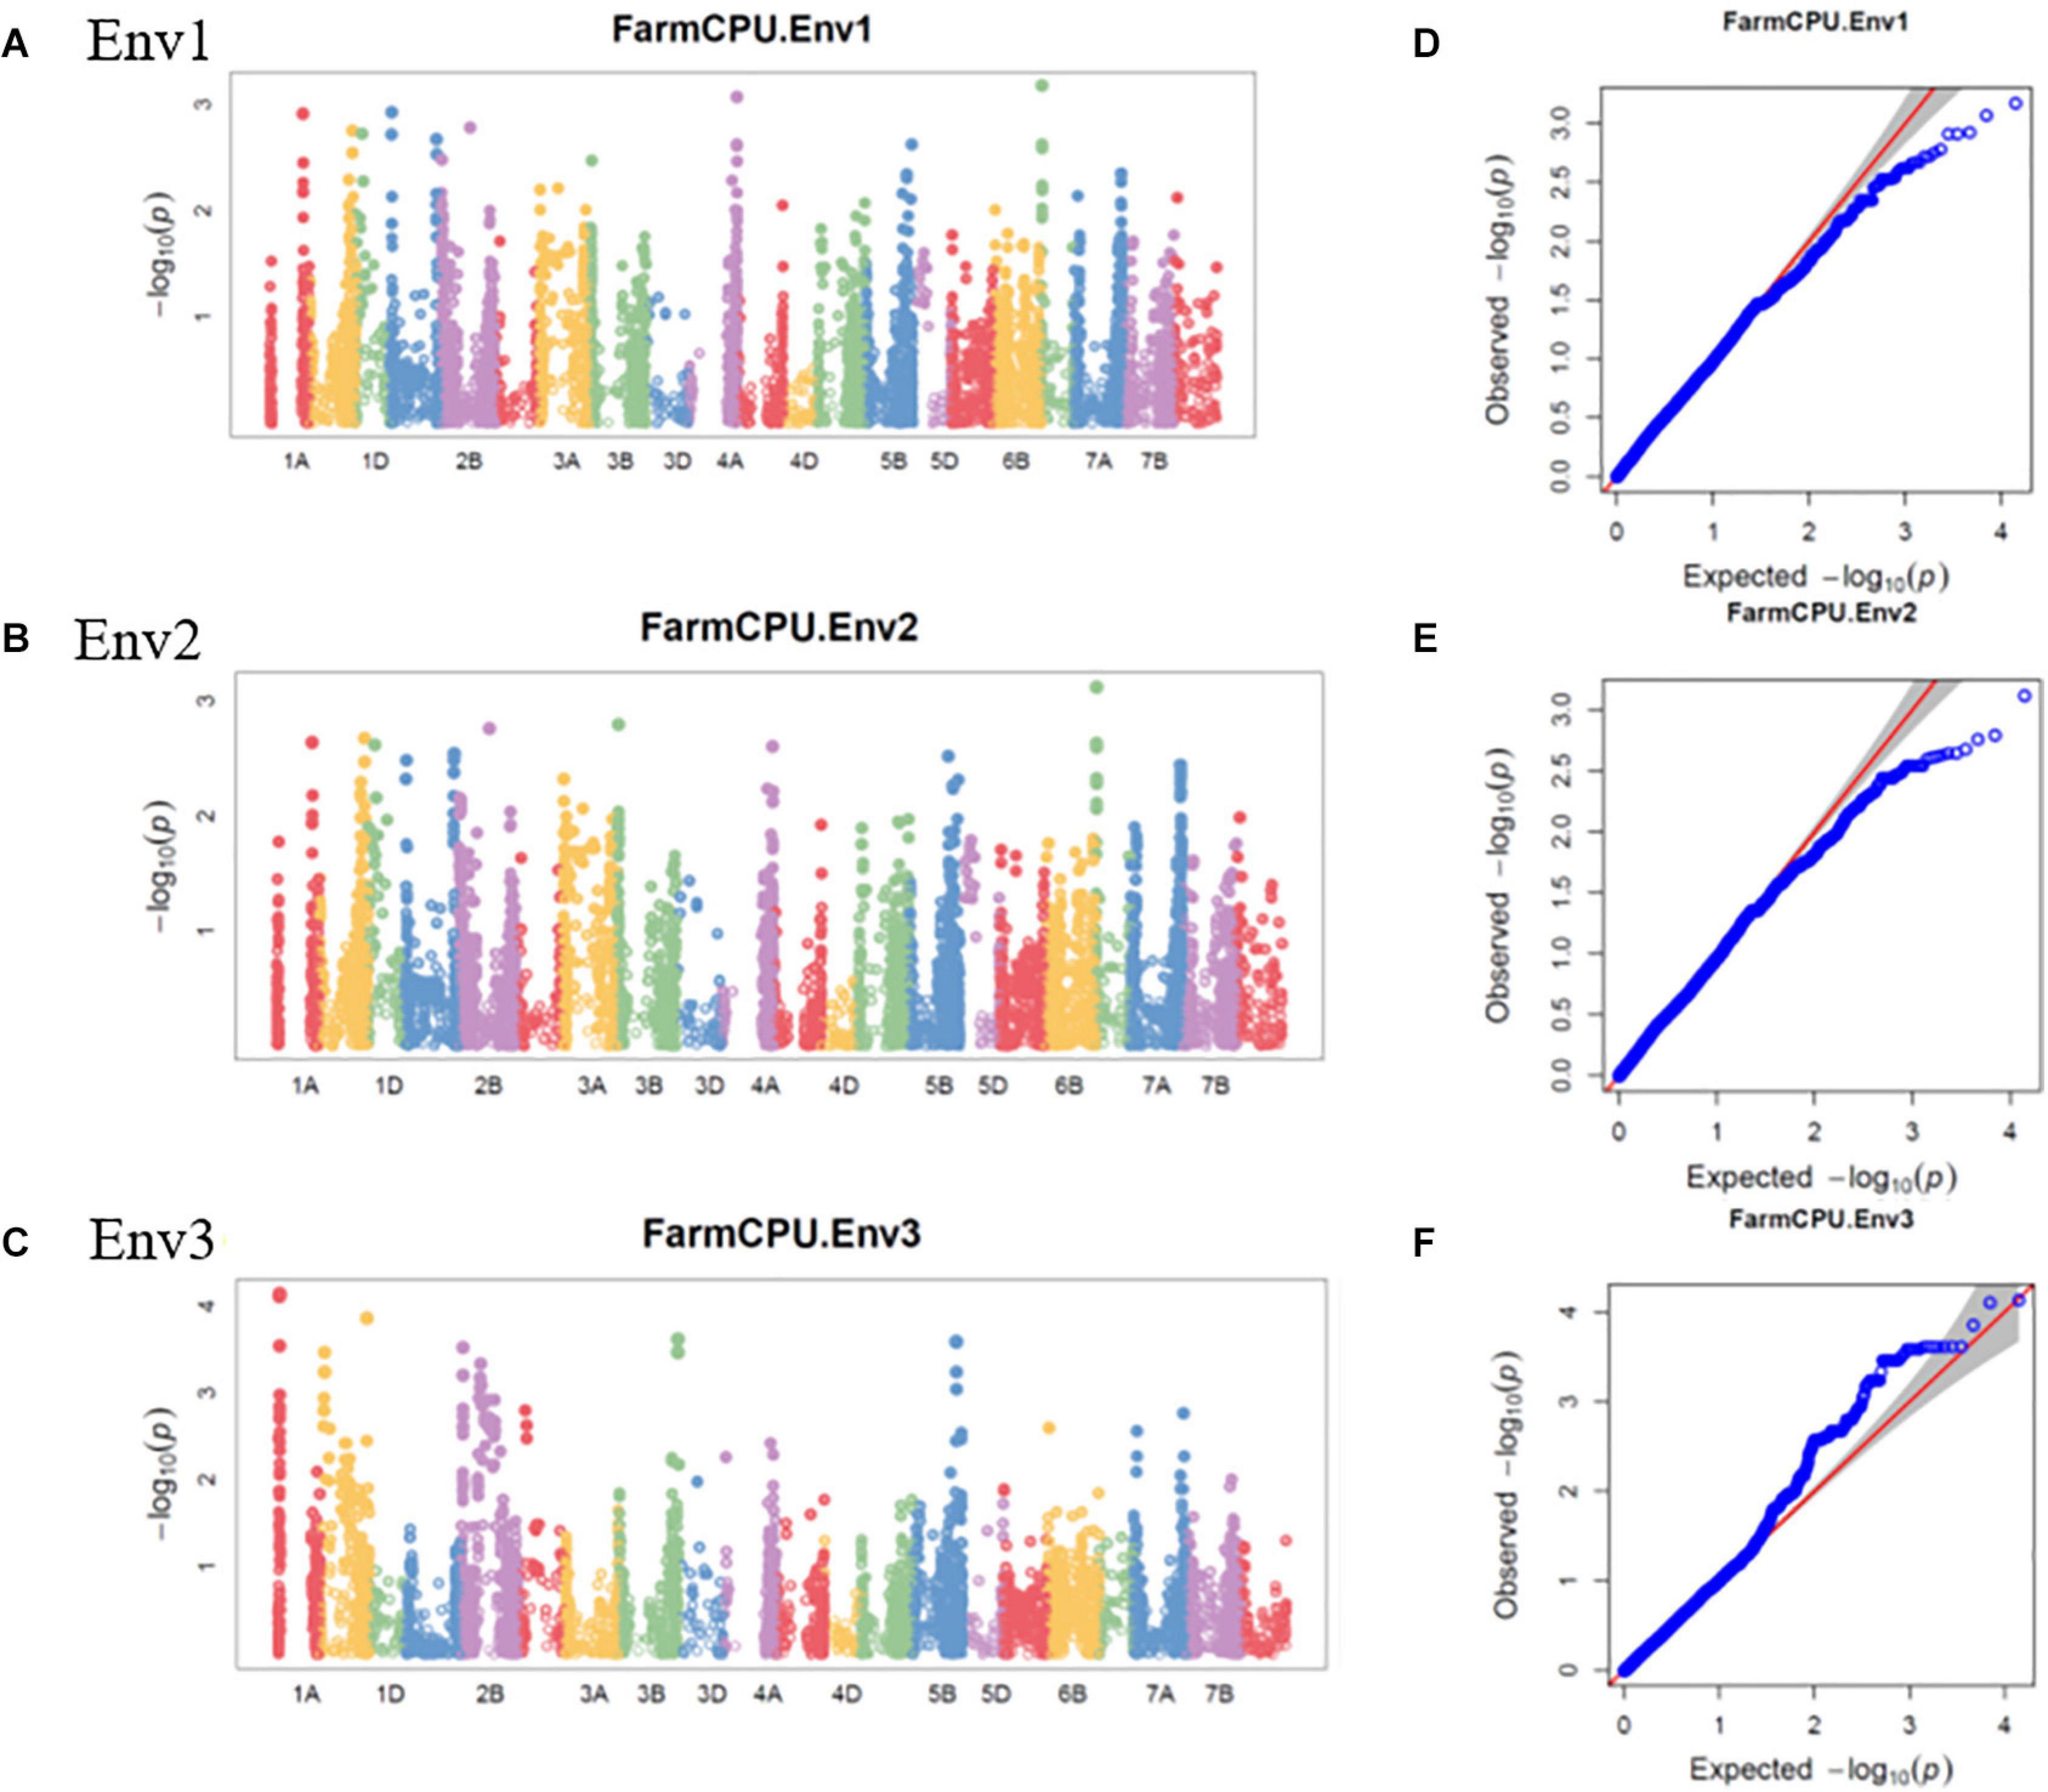
Figure 4. Manhattan plots representing 21 chromosomes showing the significant markers detected by FarmCPU model using BLUP values for spot blotch in (A) Env1, (B) Env2, and (C) Env3 environments. Quantile–quantile (Q–Q) plots for spot blotch in Env1 (D), Env2 (E), and Env3 (F) environments showing expected null distribution of p-values, assuming no associations, represented as a red solid line v/s; distribution of p-values observed using FarmCPU model represented as the blue dots.
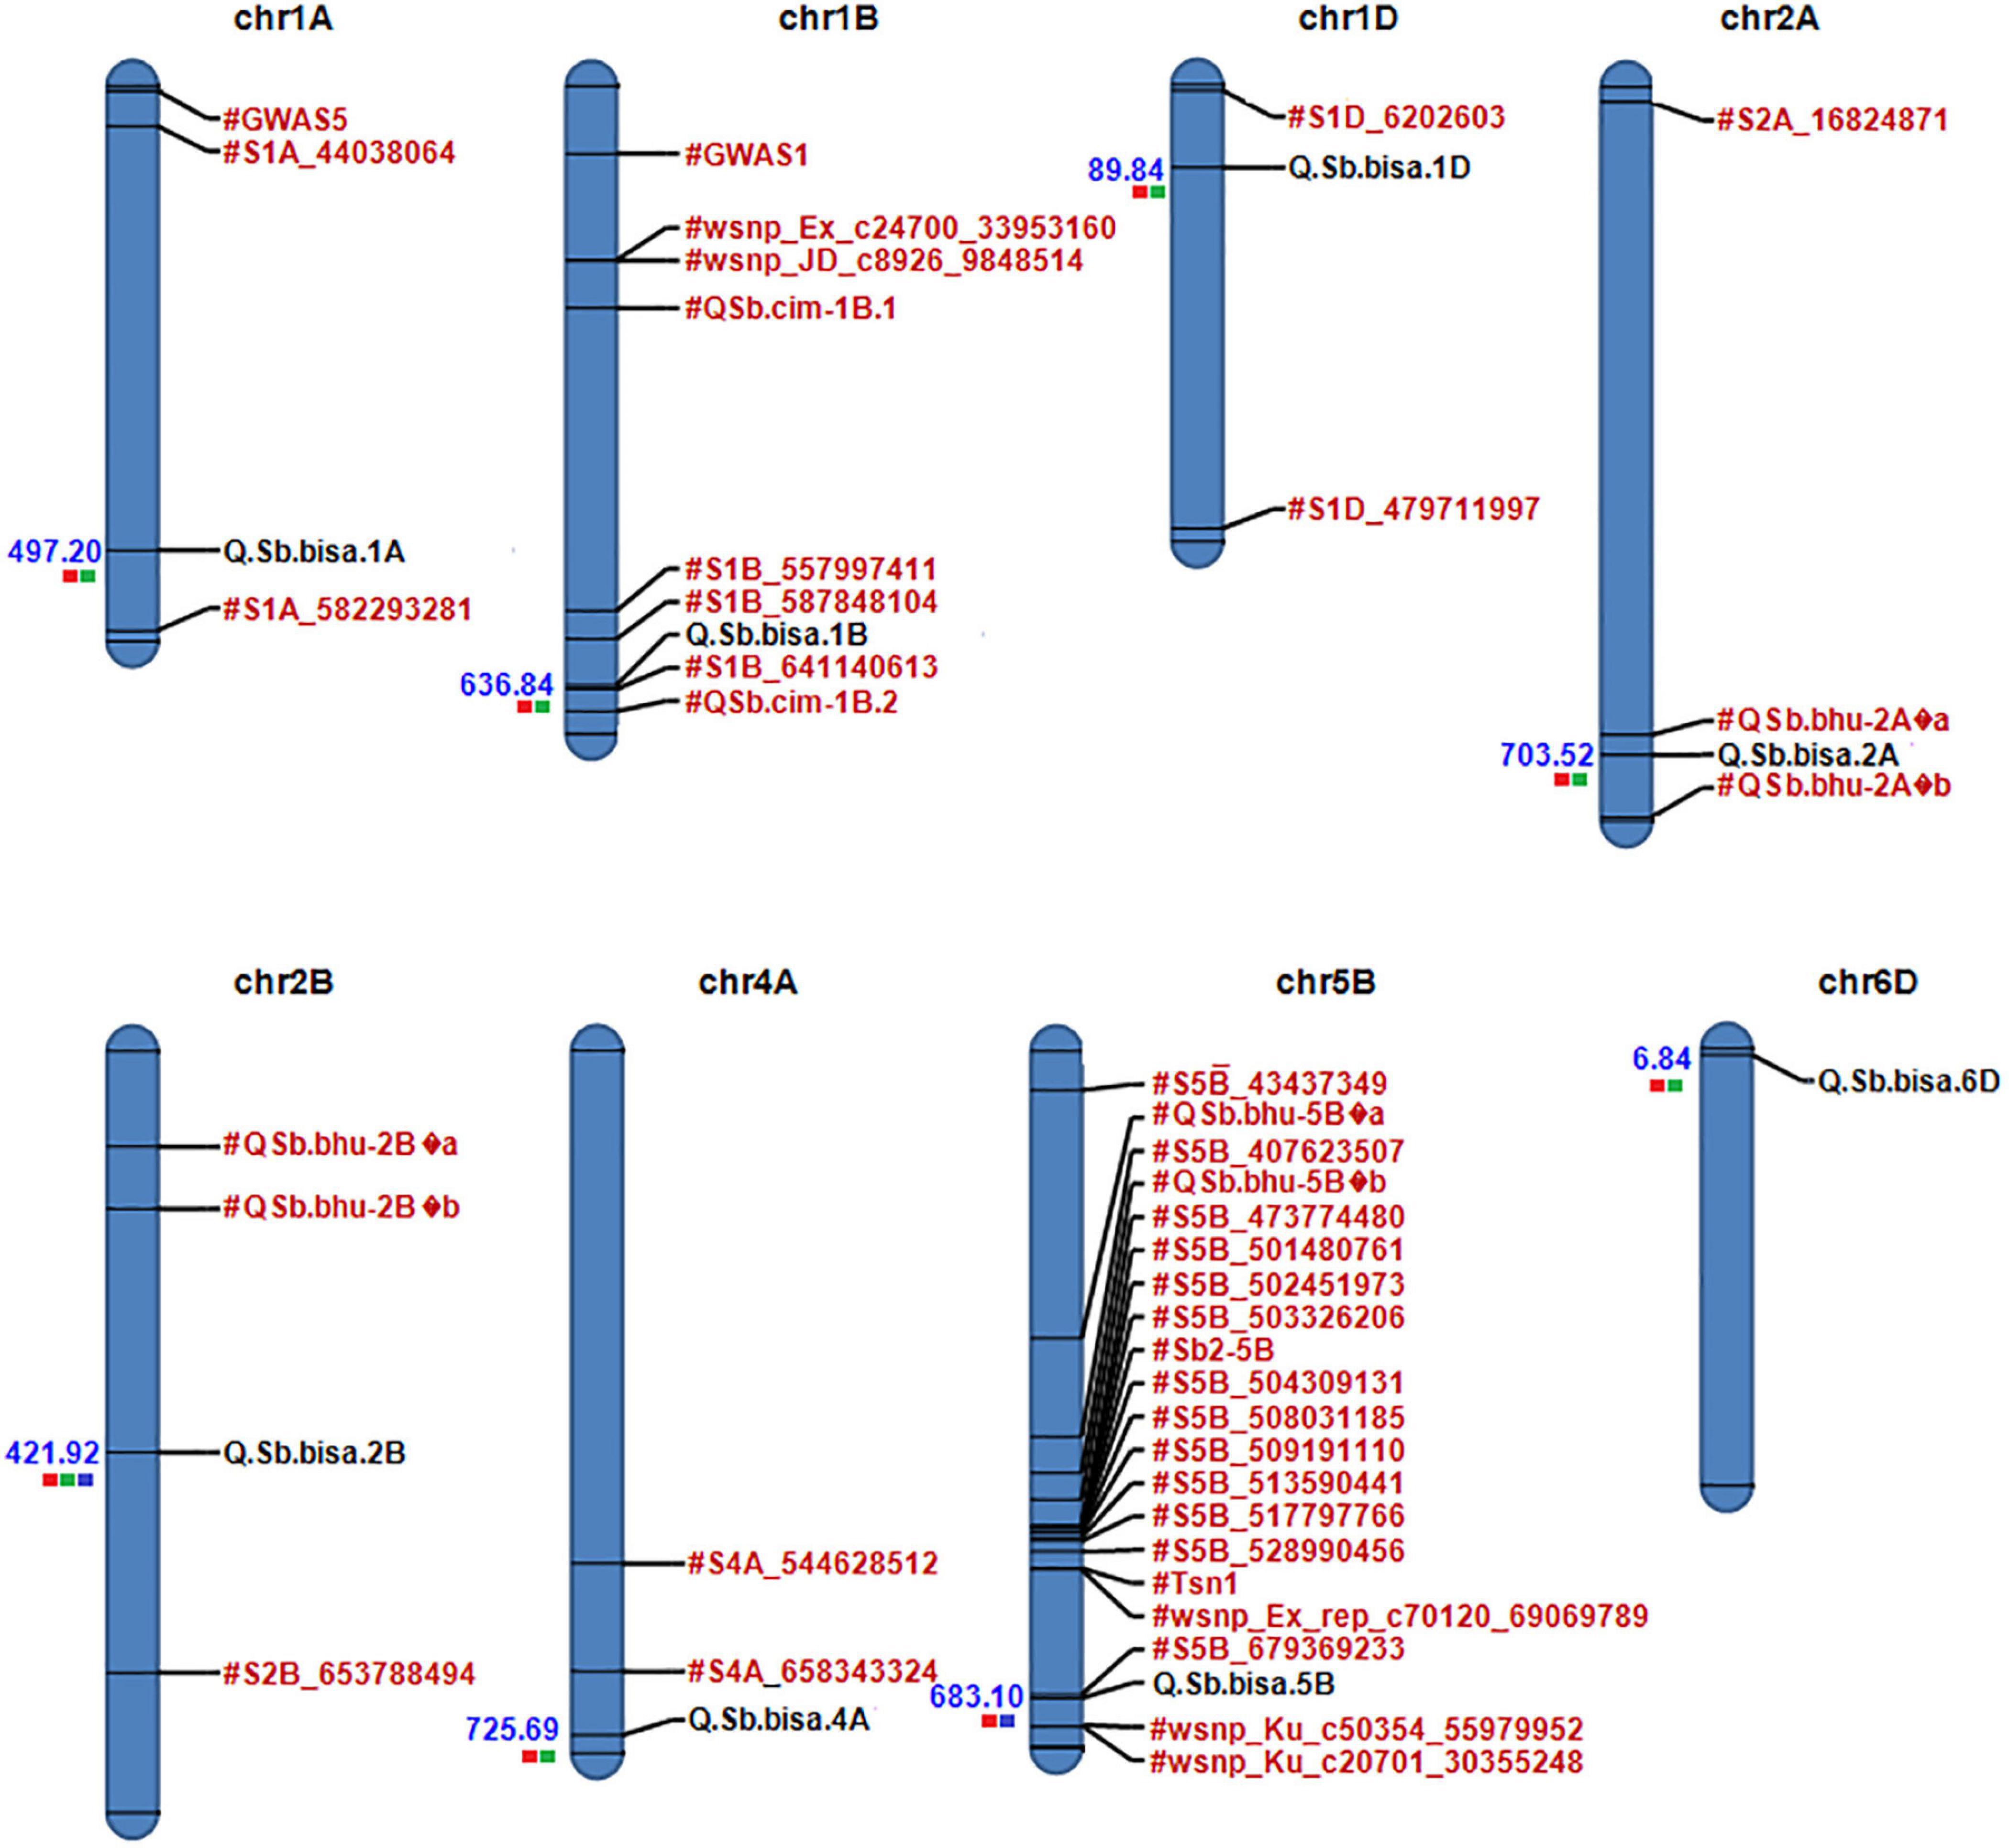
Figure 5. Physical map of candidate QTLs on 1A, 1B,1D, 2A, 2D, 4A, 5B, and 6D chromosomes. Significant QTLs/associated with spot blotch are highlighted in black, while previously reported QTLs/markers are labeled in red (the red color box next to QTLs for Env1, green for Env2, and blue for Env3). The physical position is based on IWGSC 2018 (RefSeq v1.0).
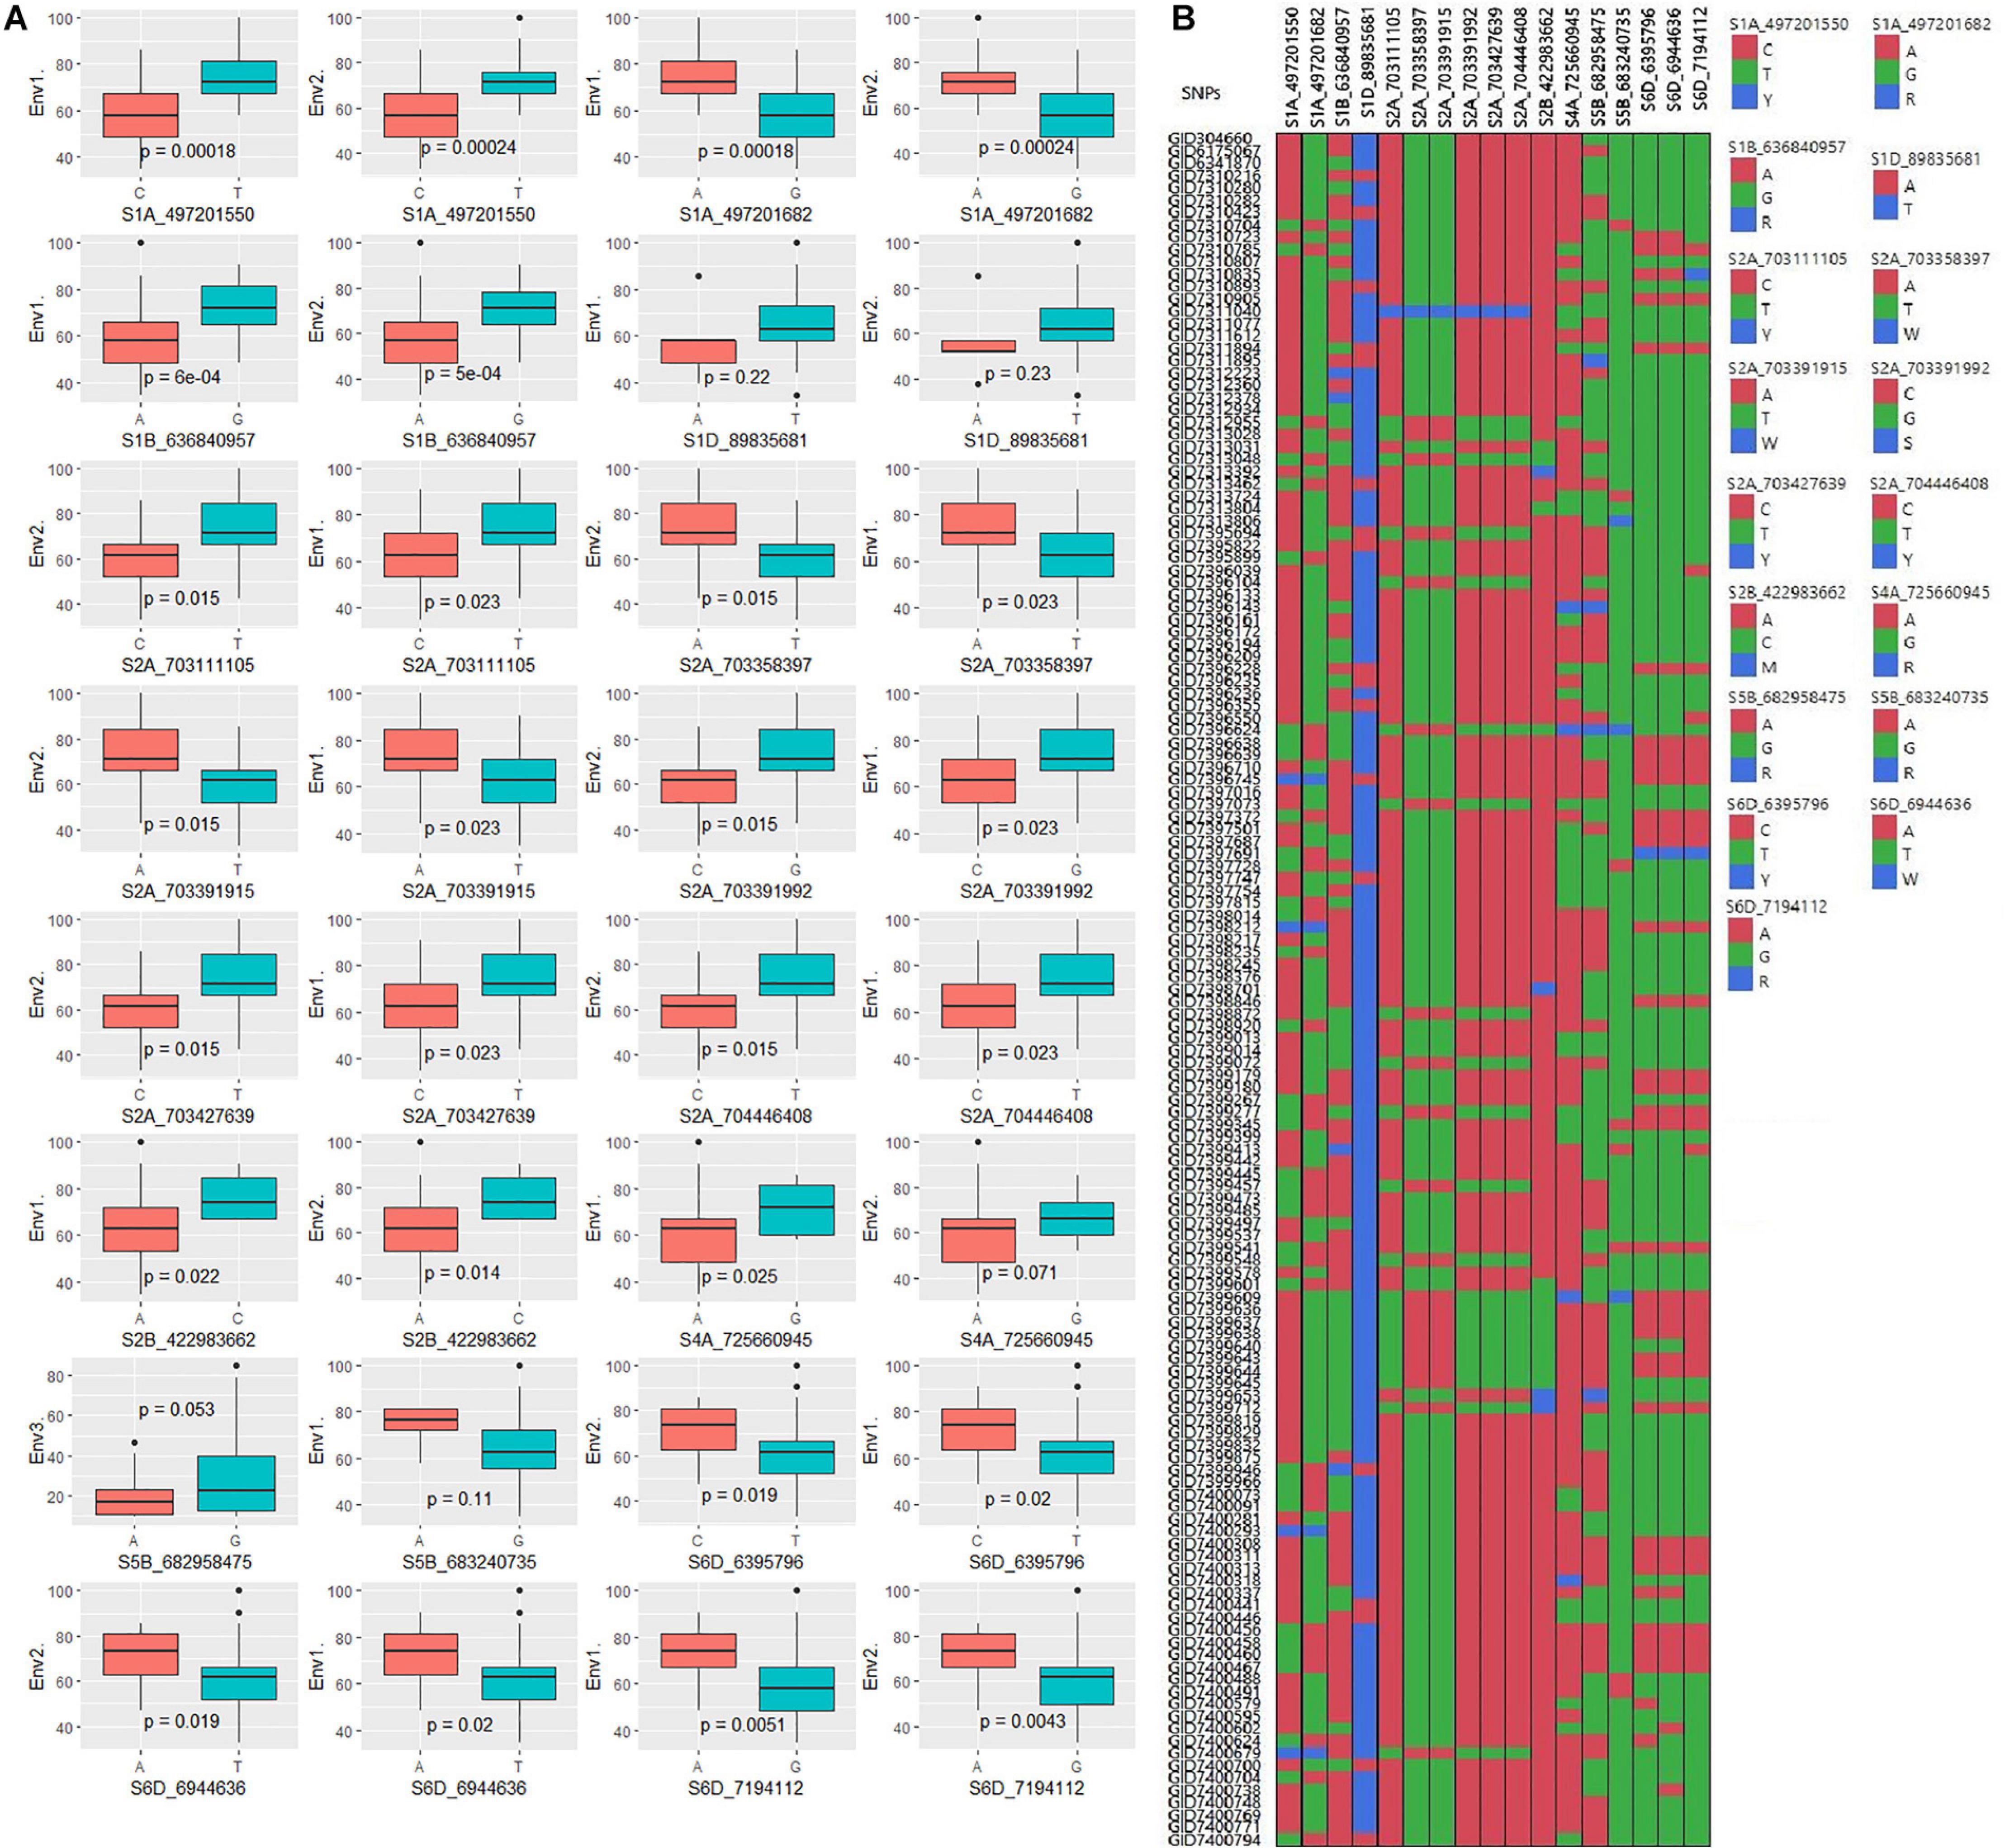
Figure 6. (A) Boxplots showing the effect of phenotypic variation between the two alleles of the SNPs for disease score of bread wheat; the Kruskal–Wallis test was used to determine the significant differences between the mean values of two alleles. (B) Cell plot of the distribution of the different alleles of significant SNPs in the advanced wheat breeding lines.
Physical Mapping
A physical map was prepared using the most significant QTLs placed on eight hexaploid wheat chromosomes. The significant QTLs were clustered into eight linkage groups (Figure 5). A group was considered to be different based on critical LD (r2 ∼ 0.2) (Figure 7). We observed one linkage group on each of 1A, 1B, 1D, 2A, 2B, 4A, and 6D. The maximum number of significant MTAs in two environments (six MTAs) is observed on chromosome 2A (Table 2).
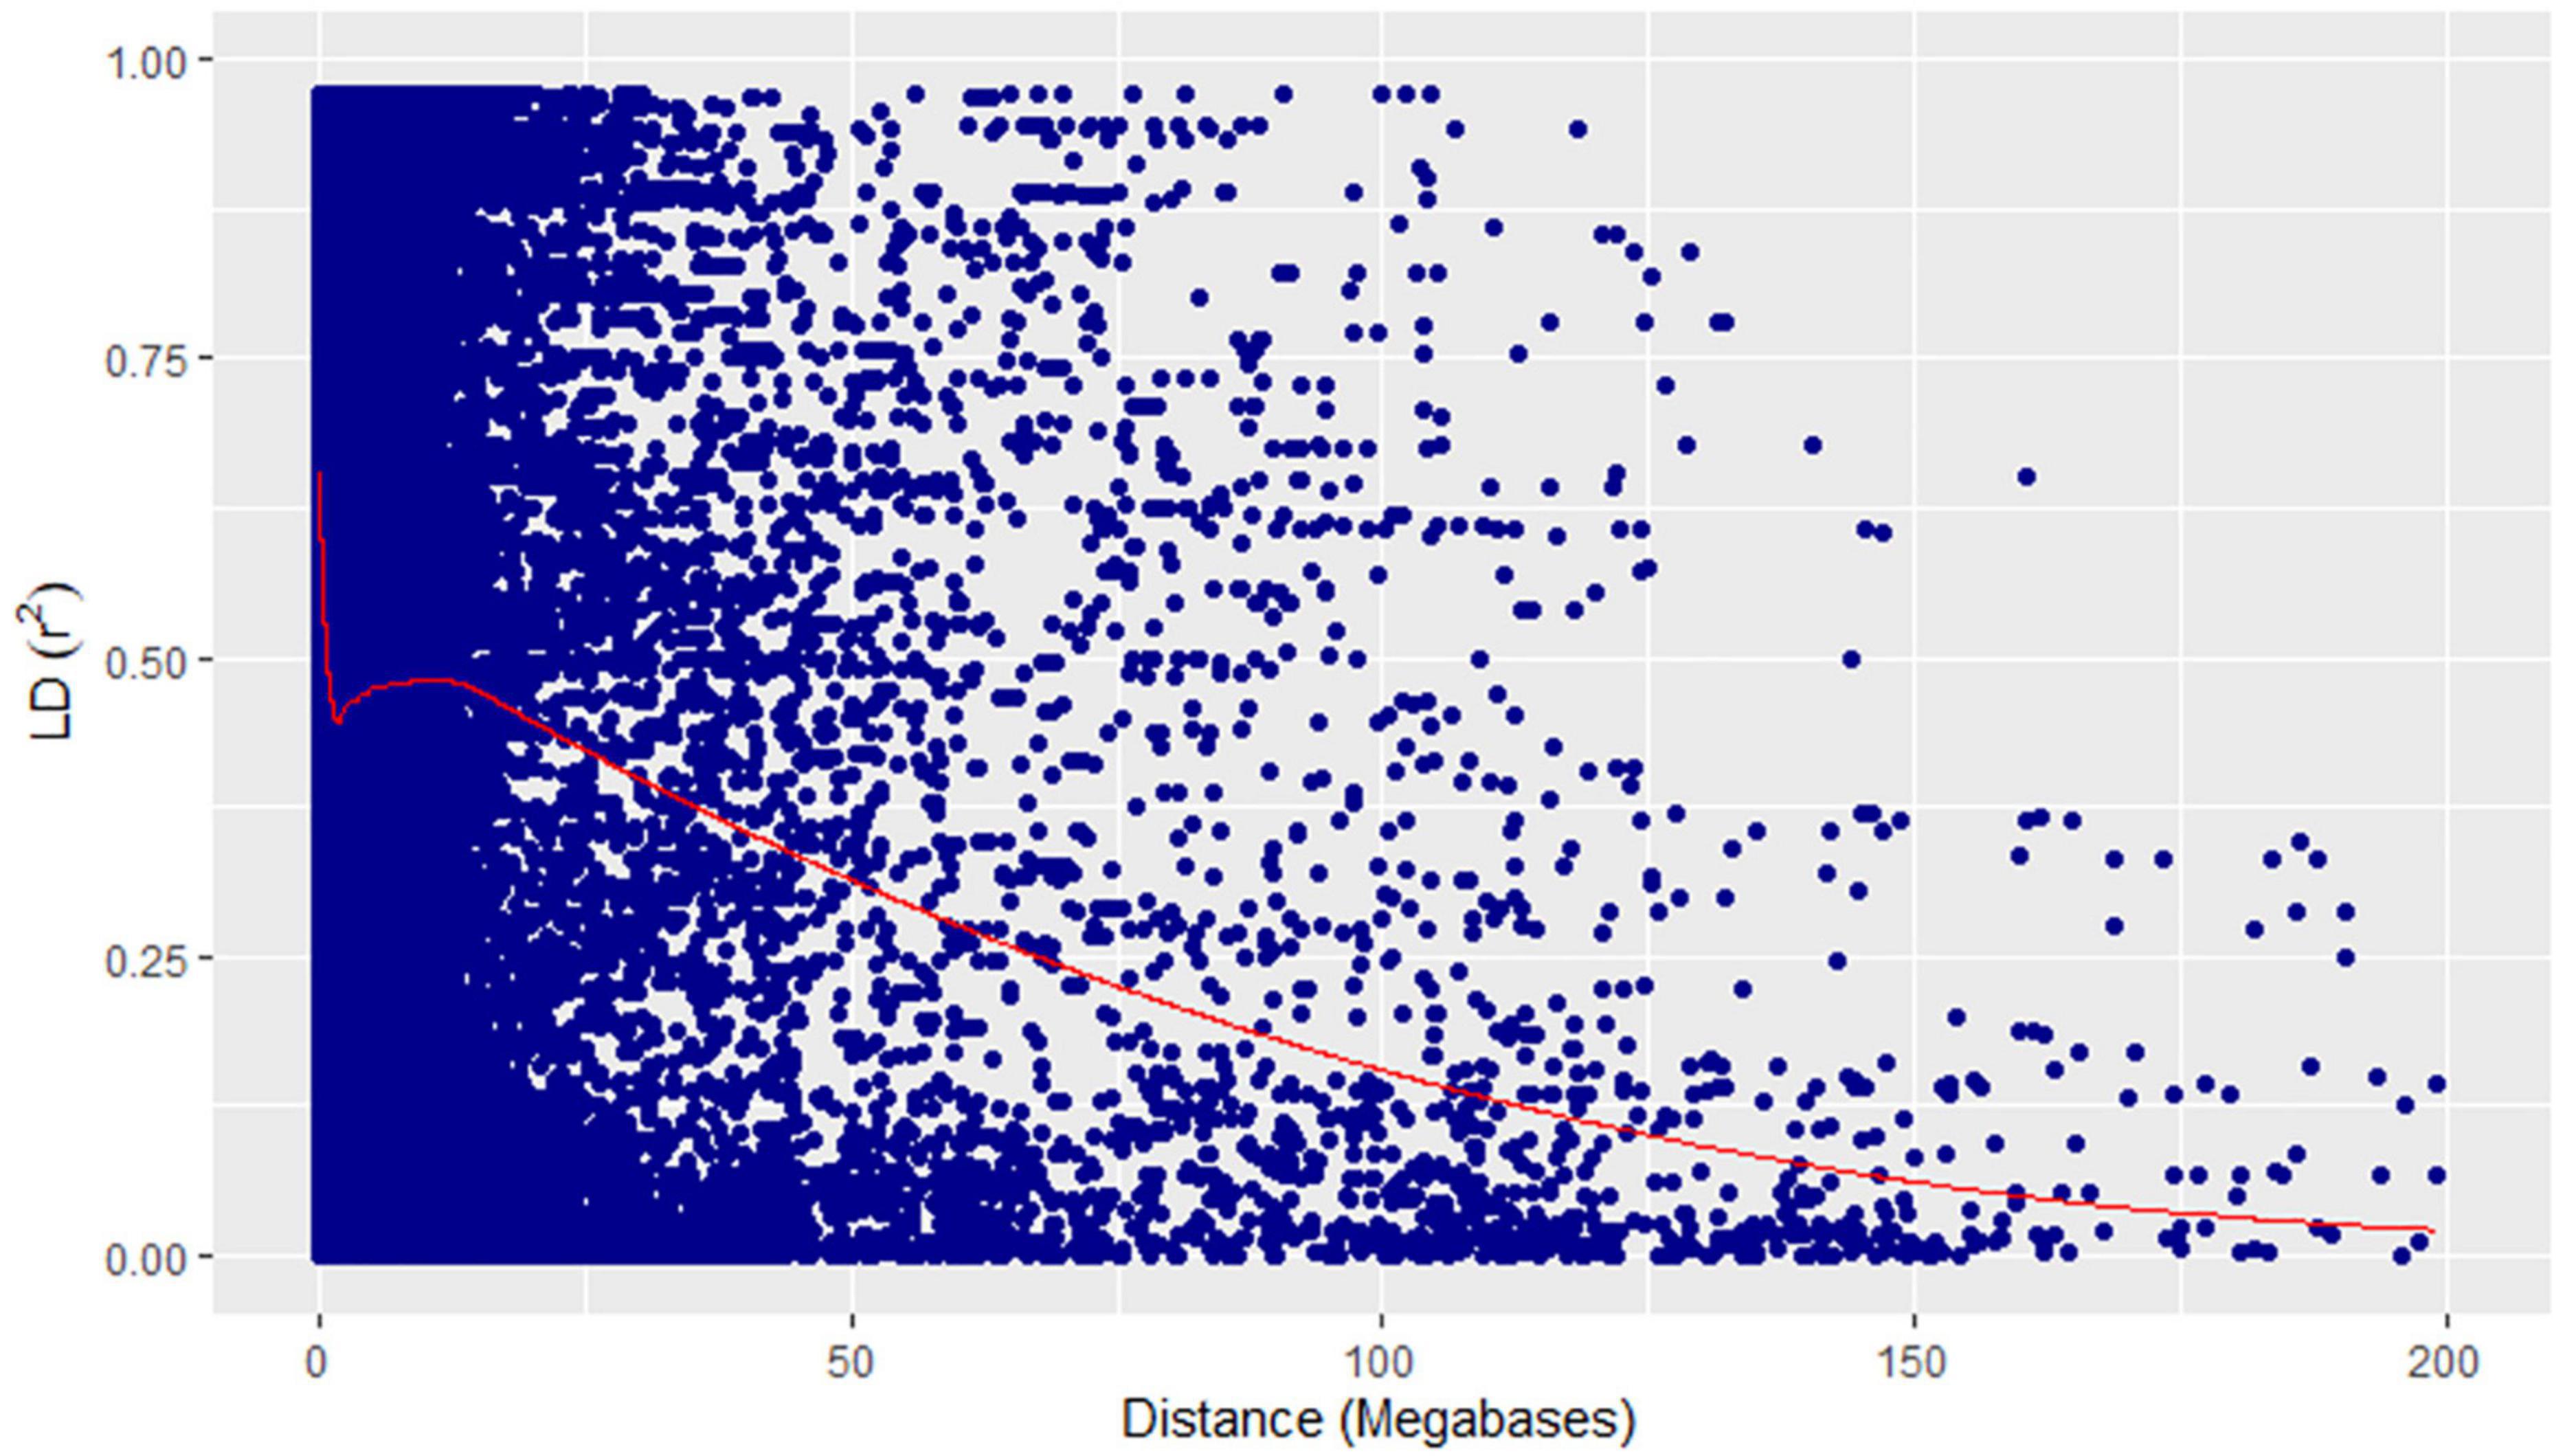
Figure 7. Linkage disequilibrium decay plot (pairwise) showing squared allele-frequency correlation (r2) vs the megabase pair distance (Mbp) between the pairs of GBS markers showing in blue dots. Megabase pair distances are shown on the x-axis and coefficient of determination (r2) on the y-axis. The red line represents the loess curve fitted on the decay plot.
Putative Candidate Genes and Annotations
The significant QTLs identified from the GWAS analysis were further studied for the known candidate genes relevant to disease resistance using the recently annotated wheat reference sequence (RefSeq V1.0). We identified NBS-LRR, MADS transcription factor, and 34 other plant protein families across chromosomal regions associated with significant QTLs in the study. The SNP S1A_497201550 associated with Q.Sb.bisa-1A identified in Env1 and Env2 on chromosome 1A was located between the TraesCS1A01G303600, a gene that encodes LURP-one-like protein, and TraesCS1A01G303700, the gene encoding GTP cyclohydrolase 1. Similarly, the SNP S1B_636840957 belongs to Q.Sb.bisa-1B identified in Env1 and Env2 on chromosome 1B with GeneID TraesCS1B01G409800 that encodes 60S ribosomal protein L35a-like protein and TraesCS1B01G40900 encoding transmembrane protein (Table 3). The SNP S1D_89835681, which belongs to the Q.Sb.bisa-1D identified in Env1 and Env2, was located close to TraesCS1D01G101800 associated with Pre-rRNA-processing protein TSR2 and TraesCS1D01G101900 encoding glucan 1,3 beta-glucosidase. Similarly, the annotation of Q.Sb.bisa-2A with SNPs S2A_703111105, S2A_703358397, S2A_703391915, S2A_703391992, and S2A_703427639 revealed that the associated genes encode the proteins related to senescence-associated family protein.
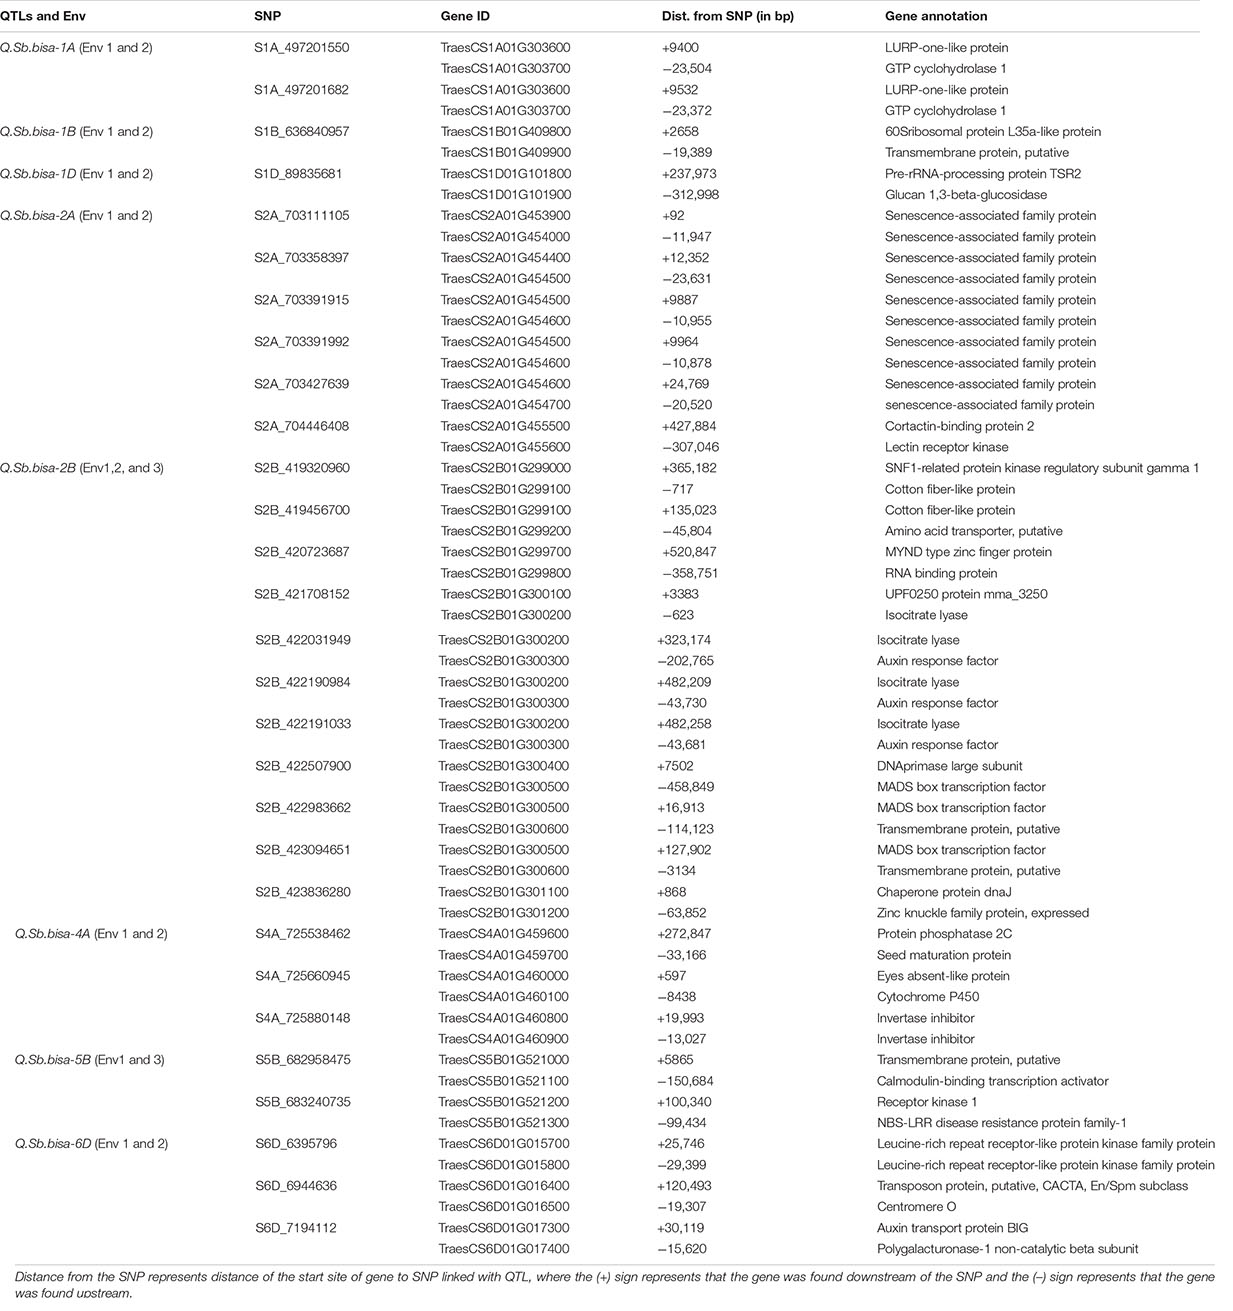
Table 3. SNPs with the corresponding proteins and possible function elucidated based on the gene annotation using wheat reference sequence (RefSeq V1.0) annotation database.
Interestingly Q.Sb.bisa-2B was detected in all three environments. The Gene IDs of S2B_422983662 from Q.Sb.bisa-2B encode MADS-box gene (TraesCS2B01G300500), and TraesCS2B01G300600 encodes a transmembrane protein. The Q.Sb.bisa-4A on chromosome 4A with SNP S4A_725660945 encodes TraesCS4A01G460000 Eyes absent-like protein and (TraesCS4A01G460100) Cytochrome P450. The Q.Sb.bisa-5B carrying SNP S5B_682958475 and SNP S5B_683240735. Gene IDs (TraesCS5B01G521000 and TraesCS5B01G521100) from SNP S5B_682958475 encode transmembrane protein and calmodulin-binding transcription. SNP S5B_683240735 mapped between TraesCS5B01G521200 and TraesCS5B01G521300 encodes receptor kinase 1 and NBS-LRR disease resistance protein family-1, respectively. The Q.Sb.bisa-6D of SNP S6D_6395796 detected in Env1 and Env2 lies between TraesCS6D01G015700 and TraesCS6D01G015800. Those genes encode Leucine-rich repeat receptor-like protein kinase associated with TaWRKY76 and TaWRKY62. The largest allele effect was explained by the QTL located on chromosome 2B in the gene region that encodes the MADS-box transcription factor and transmembrane protein. However, the QTLs at 1A, 1B, 1D, 2A, 2B, 4A, 5B, and 6D chromosomes are found to be involved directly in the disease resistance mechanism (Table 3).
Discussion
Phenotypic Evaluation for Spot Blotch
The field trials were conducted at BISA research farm, Pusa, in India for two consecutive crop seasons 2019 (Env1) and 2020 (Env2). The spot blotch data recorded at BARI, Jamalpur, in Bangladesh during the 2017 crop season was included in the analysis and named Env3. Both the locations fall under the traditional, warmer wheat-growing regions belonging to Mega-Environment 5, characterized by hot and humid conditions as per CIMMYT’s system for classifying wheat-growing environments in developing countries (van Ginkel and Rajaram, 1993). The average temperature during the wheat plant reproductive phase at Jamalpur and Pusa is higher than 19°C, with high relative humidity, and serves as a congenial environment for the pathogen (Supplementary Table S3). The spot blotch disease incidence was recorded as a percentage of the infected leaf area at three different growth stages to minimize the chances of disease escape. Since the susceptible parent displayed the highest disease severity at GS77 on the Zadoks scale (Zadoks et al., 1974), the scoring at this stage (GS77) was used in further data analysis. Although the testing sites are considered as hot spots for spot blotch (Sharma et al., 2007b), to avoid escaping of genotypes from the pathogen, the highly susceptible cultivar Sonalika was planted in alleys. The BLUPs of disease severity in three environments ranged from 2.65 to 39.35 among advanced wheat breeding lines. The right-tailed skewness of the data in Env3 highlights a likely impact of low disease pressure under natural infection without inoculation in Bangladesh. The nearly continuous distribution of disease scores in all environments indicates the quantitative nature of resistance being caused by the additive effect of various QTLs/genes. A similar trend was reported in some of the earlier findings, where more than two genes (Joshi et al., 2004; Kumar et al., 2007, 2009) and multiple alleles with minor effects (Neupane et al., 2007; Ayana et al., 2018; Singh et al., 2018) were found to be controlling the spot blotch disease resistance.
We observed significant genetic variation for disease susceptibility in the population. The genetic variances and high heritabilities for spot blotch were comparable with earlier findings in wheat (Sharma et al., 1997; Joshi et al., 2004). Despite significant genotype × environment interactions, we observed high broad-sense heritability for disease across environments (Table 1), highlighting the considerable genetic variation germane for further genetic dissection. The environmental interactions might ascribe to temperature differences at the time of disease development or the difference in the pathogen isolates prevalent in the North Eastern Plains Zone (NEPZ) of India and Bangladesh as well as the varied weather conditions within the location (Supplementary Table S3).
Principal Component Analysis
Twelve groups formed in the phylogeny were genetically distinct based on PCA (Figure 3). It shows that the advanced lines used in the current study had considerable diversity to identify multiple alleles due to the higher number of resistance sources. Common parent TRCH/SRTU//KACHU are found in group G–V, while the largest group (G–X) consists of lines with mixed pedigrees dominated by TEPOKA, TRCH, SAUAL, WBLL#1, KACHU#1, BAV92//IRENA/KAUZ, FRANCOLIN#1, AMUR, ROLF07, FRET2, BABAX, and BORL14, providing the clues for the resistant genetic resources. Wheat accessions FRANCOLIN, MUCUY, TACUPETO F2001, NADI, BOKOTA, KAUZ, ROLF07, and KACHU were the major contributors to the parentage of most of the genotypes. These results confirm the notion that some elite cultivars have been frequently utilized in the pedigree of germplasm.
SNP Effects in Different Environments of Spot Blotch
Several spot blotch resistance QTLs have been reported on different chromosomes (Neupane et al., 2007; Sharma et al., 2007a; Gonzalez-Hernandez et al., 2009; Kumar et al., 2009, 2010, 2015; Adhikari et al., 2012; Lillemo et al., 2013; Zhuang et al., 2013; Gurung et al., 2014; Lu et al., 2016). However, only four major QTLs designated as Sb1 on 7D (Lillemo et al., 2013), Sb2 on 5B (Kumar et al., 2015), Sb3 on 3B (Lu et al., 2016), and Sb4 on 4BL (Zhang et al., 2020) are well described. We also observed consistent chromosomal regions on 2B and 5B, which were detected in two or all three environments (Table 2). Regardless of phenotypic effects explained by an allele, most of the wheat chromosomes have been reported for their contribution to spot blotch disease resistance (Sharma et al., 2007a; Kumar et al., 2009, 2010; Adhikari et al., 2012; Lillemo et al., 2013; Gurung et al., 2014; Zhu et al., 2014; Lu et al., 2016; Gupta et al., 2017; Ayana et al., 2018; Singh et al., 2018; Zhang et al., 2020). The broad range of environmental conditions at our field-testing sites allowed us to capture considerable genetic variation underlying spot blotch resistance. After GWAS analysis, significant SNP markers on eight chromosomes harboring QTL regions forming eight QTLs were physically mapped and used for further analysis. The previously reported genes and markers linked to spot blotch resistance were physically mapped along with the most significant SNPs detected in this study to identify if any new regions were uncovered (Figure 5).
To study the importance of significant SNPs in disease resistance, we annotated all SNPs using the wheat reference genome annotation (IWGSC Ref Seq v1.0). The literature was mined intensively to look for the putative functions of those genes/proteins. We found that the functions of several genes were strongly associated with disease resistance across the year and environments (Table 3). Two significant chromosomal regions/QTLs on 2B and 5B were consistent between Pusa, India, and Jamalpur, Bangladesh. This may be due to the prevalence of the most aggressive isolate of spot blotch pathogen (isolate no. ICMP 13584, Auckland, New Zealand) common in South Asia (Chaurasia et al., 2000). Although we were able to capture large allelic effects ranging from −31.4% (Env1-5B) to 30.7% (Env2-2B) for spot blotch disease severity, some genomic regions of small effect may remain undetected due to the multiple testing criteria of GWAS.
In our study, eight diverse genomic regions were found to be associated with chromosomes 1A, 1B, 1D, 2A, 2B, 4A, 5B, and 6D. The present study not only reports the region on 1A elucidating up to 18.8% of phenotypic variation but also provides insight on the markers S1A_497201550 and S1A_497201682 by gene annotation. The previous studies (Adhikari et al., 2012; Jamil et al., 2018; Bainsla et al., 2020) on spot blotch reported the chromosomal region on 1A explained 2.1–10% of phenotypic variation. Both SNP markers (S1A_497201550 and S1A_497201682) were associated with LURP-one-like protein that mediates resistance by coordinated transcriptional upregulation of plant defense genes (Knoth et al., 2009). It is noteworthy that the SNP marker S1B_636840957 on chromosome 1B was associated with spot blotch severity, where the annotation study revealed that S1B_636840957 is close to transmembrane protein, which regulates fungal development and pathogenicity via the MAPK module (Gu et al., 2015). Another significant marker S1D_8983568 accounted for 24.0% of the allelic effect, consistent with the earlier studies (Bainsla et al., 2020). However, the QTL reported in our study and Bainsla et al. (2020) was more than 83 Mb apart at chromosome 1D.
The Q.Sb.bisa-2A at chromosome 2A between the region (703.11–704.44 Mb) was found to be linked with the senescence-associated family protein. For instance, if one allele is involved with senescence, then the alternate allele is involved with the “stay-green” trait in wheat. Stay-green has been reported to be associated with spot blotch disease resistance (Joshi et al., 2007a; Rosyara et al., 2008). The present results and other independent studies also indicated the importance of this chromosome region in spot blotch disease resistance (Joshi et al., 2007a; Rosyara et al., 2008; Bainsla et al., 2020).
Kumar et al. (2010) analyzed two bi-parental mapping populations and reported four QTLs for SB resistance including chromosomes 2AS explaining up to 22.7% of phenotypic variation. The other interesting Q.Sb.bisa-2B lie between MADS-box genes that were reported to be differentially expressed in response to stripe rust pathogen in wheat (Guo et al., 2013) and transmembrane protein, which regulates fungal development and pathogenicity via the MAPK module (Gu et al., 2015). Similar to 1D, the Q.Sb.bisa-2B on 2B mapped nearly 231 Mb apart from the QTL reported by Kumar et al. (2010) and Bainsla et al. (2020). The SNP S4A_725660945 of Q.Sb.bisa-4A is associated with wheat Cytochrome P450 family protein. This protein enhances resistance to mycotoxin, namely, deoxynivalenol (DON) and grain yield (Gunupuru et al., 2018). This QTL is in agreement with the earlier finding of Ayana et al. (2018) which was mapped in the same chromosomal region but physically a few Mb away. Since QTL mapping is based on recombination frequency, the possibility of both the QTLs/SNPs being in the same chromosomal region may not be ruled out.
The markers of Q.Sb.bisa-5B QTL (S5B_682958475 and S5B_683240735) were associated with calmodulin-binding transcription activator, receptor kinase 1, and NBS-LRR disease resistance protein family-1 which are involved in the defense response of wheat to Puccinia triticina (Wang Y. et al., 2019) and fungal pathogen Zymoseptoria tritici. On the other hand, the NBS-LRR disease resistance protein family is well known to contribute to fungal disease resistance (He et al., 2018). The QTL on 5B, named the Sb2 gene, has been studied in detail (Lu et al., 2016), known to interact with the Tsn1 gene, conferring susceptible reaction to tan spot and Septoria nodorum blotch (McDonald et al., 2018). The gene ToxA virulent to Tsn1 exists in both Pyrenophora tritici-repentis and Parastagonospora nodorum which confer susceptible reaction to tan spot and S. nodorum blotch, respectively (Singh et al., 2018). Friesen et al. (2018) demonstrated the major effects of the Tsn1 locus on chromosome 5B. However, the importance of Tsn1 in spot blotch disease resistance under field conditions is not known. Another QTL for spot blotch resistance was mapped earlier in the same region by Jamil et al. (2018).
The Q.Sb.bisa-6D carrying SNP S6D_6395796 on chromosome 6D had an allelic effect of −17.8% with the stable response in two environments and annotated to be located close to a gene that synthesizes Leucine-rich repeat receptor-like protein kinase family protein, which plays an important role in disease resistance. The LRR-Like kinase gene associated with TaWRKY76 and TaWRKY62 plays a positive role in wheat high-temperature plant resistance to Puccinia striiformis f. sp. tritici (Wang J. et al., 2019). The 6D chromosome has earlier been identified to impart resistance against spot blotch in QTL mapping but via different genomic regions, i.e., near the centromeric region (Kumar et al., 2009, 2010) and proximal region of 6DS (Singh et al., 2018). The exact physical regions of these QTLs could not be estimated as they were either based on SSR markers or a genetic map. The consistency of SNPs on eight chromosomes (1A, 1B, 1D, 2A, 2B, 4D, 5B, and 6D) in a minimum of two or all environments indicates their potential significance in the breeding of disease-resistant varieties. Further, the resistance mechanism through protein annotation was confirmed where the same or common gene/protein family was identified independently in different environments (Figure 8). With additional validation, these genetic regions reported in this study can potentially be used in fine mapping and map-based cloning to further characterize the mechanisms of spot blotch disease resistance.
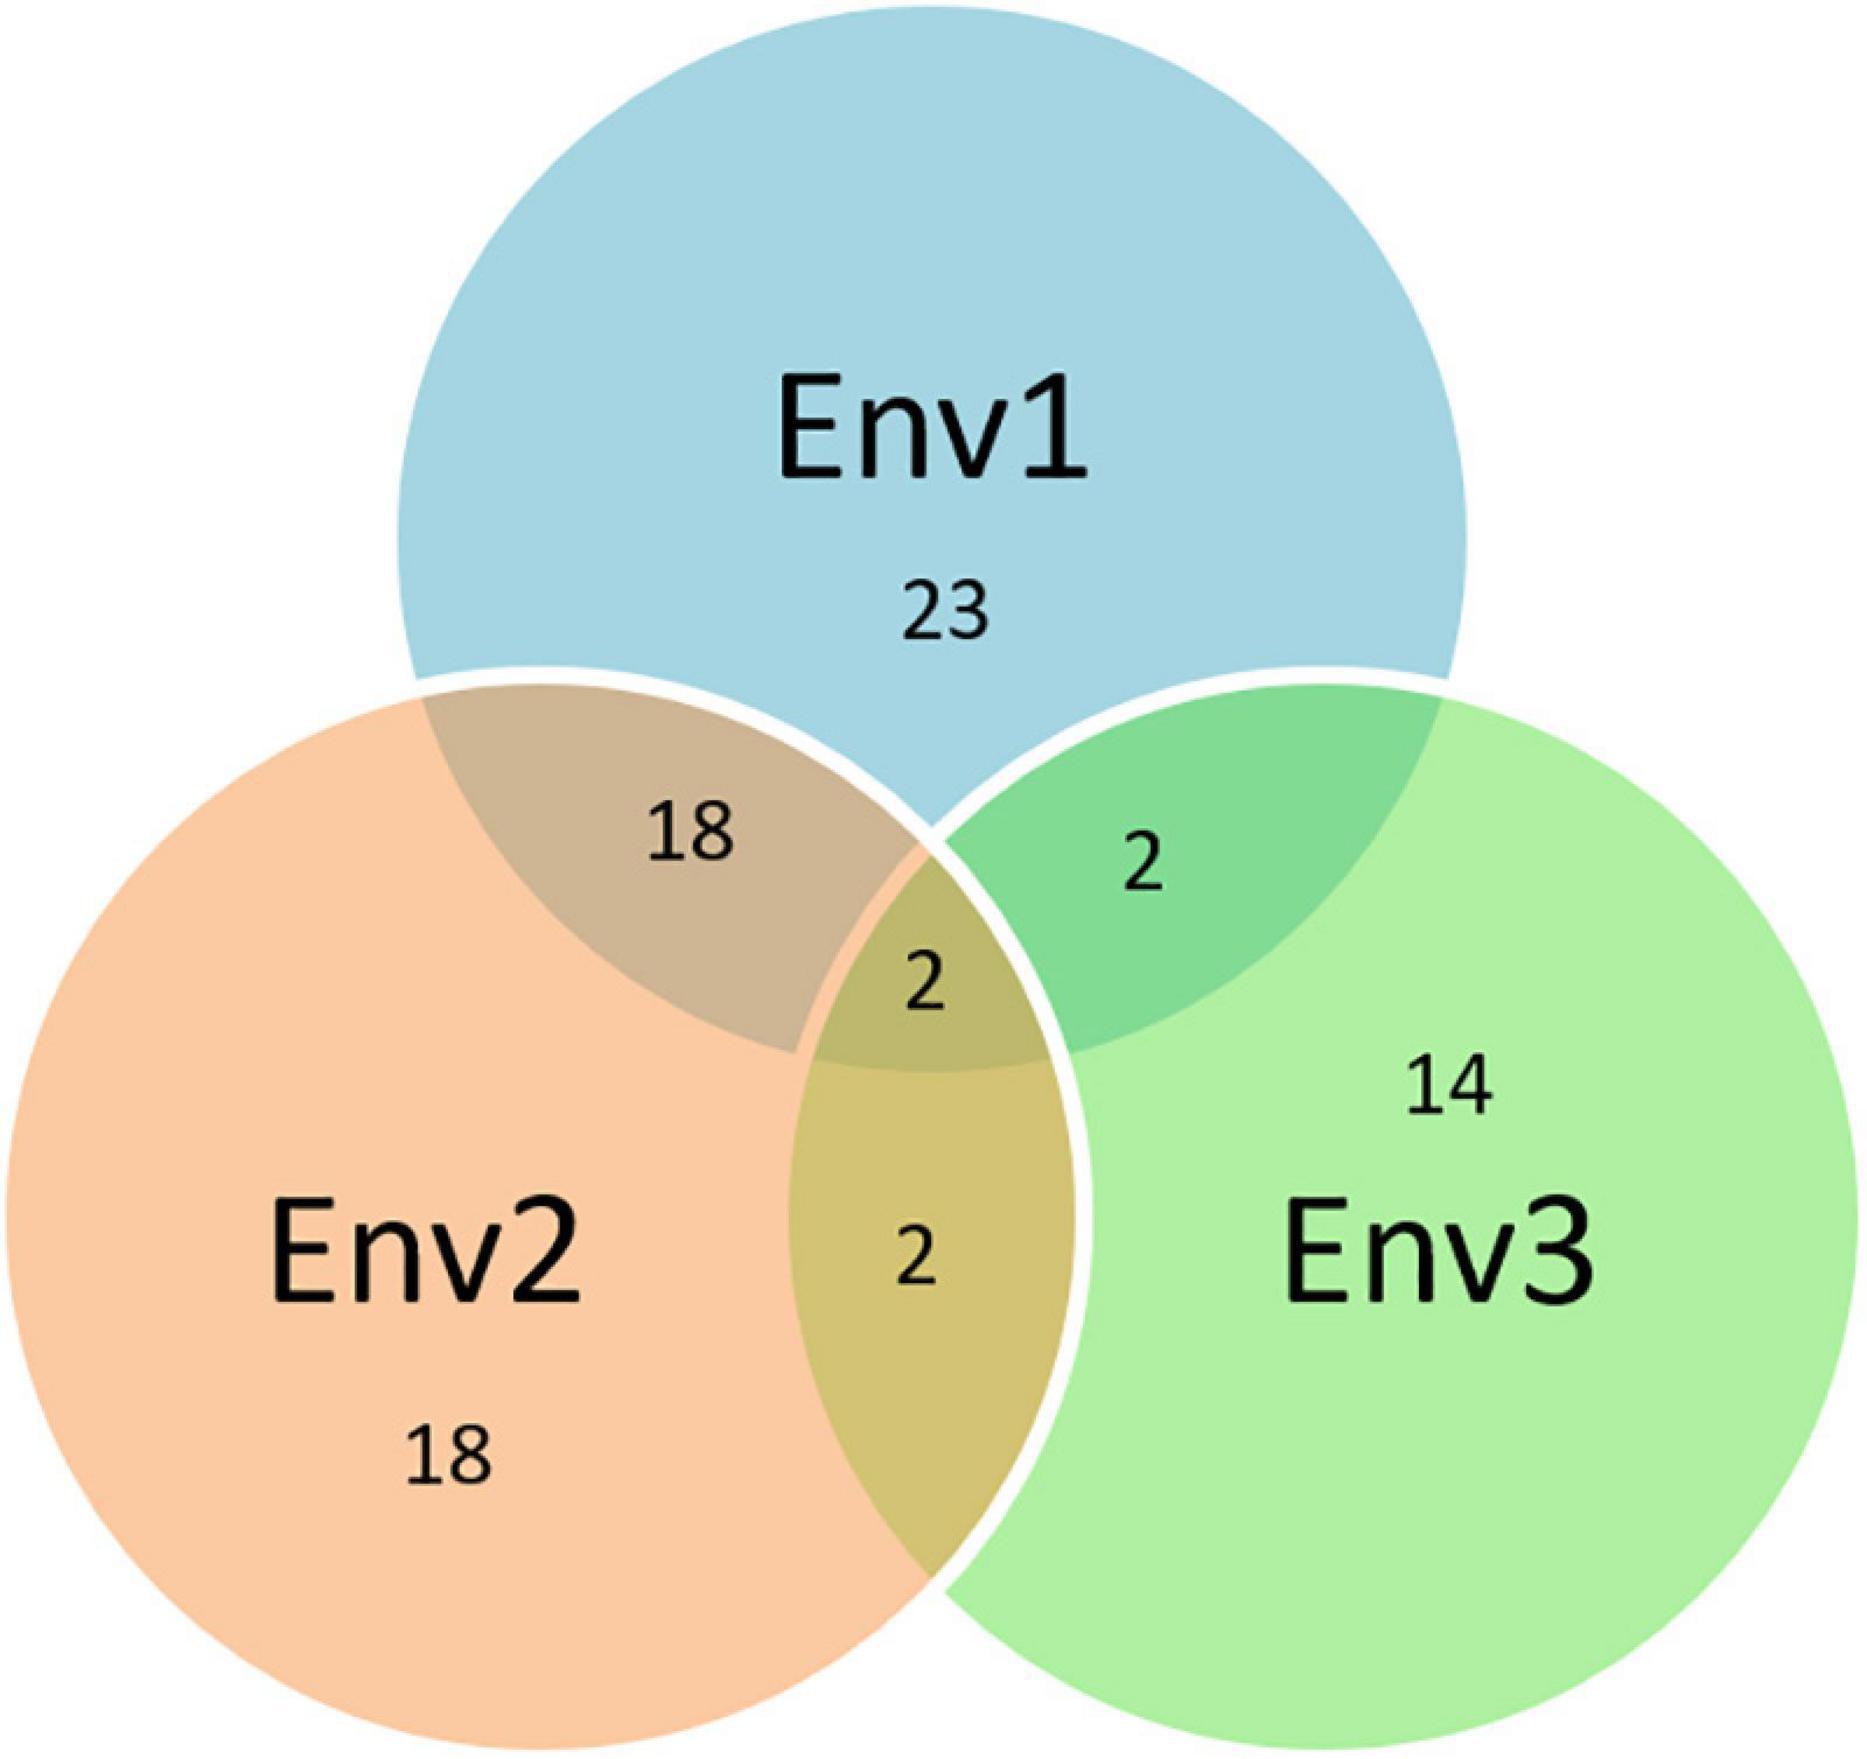
Figure 8. Venn diagram based on the common protein synthesized by the same genes associated with different SNPs over years (the numbers in the circle represent the total numbers of proteins in the respective environments and the numbers at intersects represent the common proteins between the environments).
Conclusion
We identified genetic regions underlying spot blotch resistance in the elite spring wheat genotypes. The variable conditions at three field environments in India and Bangladesh allowed us to capture the considerable phenotypic variation for spot blotch disease with the GWAS resulting in a total of eight QTLs belonging to eight wheat chromosomes. The literature mining of the functional gene annotations of identified SNPs encoding the single protein or protein family directly or indirectly involved in disease resistance has led to the identification of putative target genes and functions to identify the disease-resistance mechanism. The new QTLs appeared on chromosomes 1A (497.2), 1D (89.84), 2B (421.92), and 6D (6.84) associated with many disease resistance family proteins. The SNP on chromosome 2A was found to be associated with a known gene that encodes “senescence-associated family protein” and is directly involved in spot blotch resistance. The results are of importance for the breeders in developing spot blotch-resistant varieties targeting the South Asian wheat-growing regions. Given the aggressive pathogen spread and food security concerns, the breeding programs in South Asia could benefit from the present study. The mapping of favorable alleles can facilitate introgression of the alleles into present-day elite cultivars to impart disease resistance. It is apparent from the results that some individual alleles cumulatively contributed as high as 70% for spot blotch disease resistance. Additional investigations are underway, which would further confirm the importance of these chromosomal regions/genes associated with spot blotch.
Data Availability Statement
The datasets presented in this study can be found in Supplementary Material.
Author Contributions
VT wrote the initial draft of the manuscript. VT, DS, and GD analyzed the data. RS provided the breeding material. JP provided genotyping data. VT and MR managed field trials and recorded phenotypic data. PB, SK, and PS provided scientific inputs during the initial manuscript drafting. VT, DS, UK, GD, and BT revised the manuscript. UK designed the experiment. UK, AJ, and BT supervised the research project. All authors read and approved the final manuscript.
Funding
This work was supported by the US Agency for International Development (USAID) Feed the Future Innovation Lab for Applied Wheat Genomics grant (Cooperative Agreement No. AID-OAA-A-13-00051).
Conflict of Interest
The authors declare that the research was conducted in the absence of any commercial or financial relationships that could be construed as a potential conflict of interest.
Acknowledgments
The technical support provided by Manish Kumar, Dr. Prashanth N. Suravajhala, and Dr. Raj Kumar Jat is duly acknowledged. This manuscript has been released as a pre-print at (https://www.researchsquare.com/article/rs-13392/v1), [Tomar et al. (2020) Genome-wide association study and genomic prediction of spot blotch disease in wheat (Triticum aestivum L.). doi: 10.21203/rs.2.22818/v1]. However, the current manuscript has considerable updates compared to the pre-print (additional year data have been used and some of the data and analysis have been removed).
Supplementary Material
The Supplementary Material for this article can be found online at: https://www.frontiersin.org/articles/10.3389/fgene.2020.613217/full#supplementary-material
Supplementary Table 1 | List of 139 genotypes with clustering information used in the present study.
Supplementary Table 2 | Statistical analysis of spot blotch incidence in 139 wheat genotypes evaluated at two locations in three environments.
Supplementary Table 3 | Monthly average, minimum, and maximum temperatures at BISA, Pusa in India.
References
Adhikari, T. B., Gurung, S., Hansen, J. M., Jackson, E. W., and Bonman, J. M. (2012). Association mapping of quantitative trait loci in spring wheat landraces conferring resistance to bacterial leaf streak and spot blotch. Plant Genome. 5, 1–16. doi: 10.3835/plantgenome2011.12.0032
Alvarado, G., Rodríguez, F. M., Pacheco, A., Burgueño, J., Crossa, J., Vargas, M., et al. (2020). META-R: A software to analyze data from multi-environment plant breeding trials. Crop J. 8, 745–756. doi: 10.1016/j.cj.2020.03.010
Ayana, G. T., Ali, S., Sidhu, J. S., Gonzalez Hernandez, J. L., Turnipseed, B., and Sehgal, S. K. (2018). Genome-wide association study for spot blotch resistance in hard winter wheat. Front. Plant Sci. 9:926. doi: 10.3389/fpls.2018.00926
Bainsla, N. K., Phuke, R. M., He, X., Gupta, V., Bishnoi, S. K., Sharma, R. K., et al. (2020). Genome-wide association study for spot blotch resistance in Afghan wheat germplasm. Plant Pathol. 69, 1161–1171. doi: 10.1111/ppa.13191
Bradbury, P. J., Zhang, Z., Kroon, D. E., Casstevens, T. M., Ramdoss, Y., and Buckler, E. S. (2007). TASSEL: software for association mapping of complex traits in diverse samples. Bioinformatics 23, 2633–2635. doi: 10.1093/bioinformatics/btm308
Browning, B. L., and Browning, S. R. (2016). Genotype Imputation with Millions of Reference Samples. Am. J. Hum. Genet. 98, 116–126. doi: 10.1016/j.ajhg.2015.11.020
Chaurasia, S., Chand, R., and Joshi, A. K. (2000). Relative dominance of Alternaria triticina Pras. et Prab. and Bipolaris sorokiniana (Sacc.) shoemaker in different growth stages of wheat (T. aestivum L.). Z. Pflanzenkr. Pflanzenschutz. 107, 176–181.
Dreisigacker, S., Deepmala, S., Jaimez, R. A., Luna-Garrid, B., Muñoz-Zavala, S., Núñez-Ríos, C., et al. (2016). CIMMYT Wheat Molecular Genetics: Laboratory Protocols and Applications to Wheat Breeding. Mexico, DF: CIMMYT.
Dubin, H. J., and Van Ginkel, M. (1991). “The status of wheat diseases and disease research in warmer areas,” in Proceeding of the International Conference, Wheat for non traditional warmer areas, ed. D. A. Saunders (Mexico: CIMMYT), 125–145.
Elshire, R. J., Glaubitz, J. C., Sun, Q., Poland, J. A., Kawamoto, K., Buckler, E. S., et al. (2011). A robust, simple genotyping-by-sequencing (GBS) approach for high diversity species. PLoS One 6:e19379. doi: 10.1371/journal.pone.0019379
FAO (2018). Statistical Pocketbook 2018. World Food and Agriculture. Rome: FAO, doi: 978-92-5-108802-9
French, E., Kim, B. S., and Iyer-Pascuzzi, A. S. (2016). Mechanisms of quantitative disease resistance in plants. Semin. Cell Dev. Biol. 56, 201–208. doi: 10.1016/j.semcdb.2016.05.015
Friesen, T. L., Holmes, D. J., Bowden, R. L., and Faris, J. D. (2018). ToxA is present in the U.S. bipolaris sorokiniana population and is a significant virulence factor on wheat harboring Tsn1. Plant Dis. 102, 2446–2452. doi: 10.1094/PDIS-03-18-0521-RE
Friesen, T. L., Xu, S. S., and Harris, M. O. (2008). Stem rust, tan spot, stagonospora nodorum blotch, and hessian fly resistance in langdon durum-Aegilops tauschii synthetic hexaploid wheat lines. Crop. Sci. 48, 1062–1070. doi: 10.2135/cropsci2007.08.0463
Gonzalez-Hernandez, J. L., Singh, P. K., Mergoum, M., Adhikari, T. B., Kianian, S. F., Simsek, S., et al. (2009). A quantitative trait locus on chromosome 5B controls resistance of Triticum turgidum (L.) var. diccocoides to Stagonospora nodorum blotch. Euphytica 159, 167–179. doi: 10.1007/s10681-008-9825-z
Gu, Q., Chen, Y., Liu, Y., Zhang, C., and Ma, Z. (2015). The transmembrane protein FgSho1 regulates fungal development and pathogenicity via the MAPK module Ste50-Ste11-Ste7 in Fusarium graminearum. New Phytol. 206, 315–328. doi: 10.1111/nph.13158
Gunupuru, L. R., Arunachalam, C., Malla, K. B., Kahla, A., Perochon, A., Jia, J., et al. (2018). A wheat cytochrome P450 enhances both resistance to deoxynivalenol and grain yield. PLoS One 13:e0204992. doi: 10.1371/journal.pone.0204992
Guo, J., Shi, X. X., Zhang, J. S., Duan, Y. H., Bai, P. F., Guan, X. N., et al. (2013). A type I MADS-box gene is differentially expressed in wheat in response to infection by the stripe rust fungus. Biol. Plant. 57, 540–546. doi: 10.1007/s10535-012-0297-6
Gupta, P. K. K., Chand, R., Vasistha, N. K. K., Pandey, S. P. P., Kumar, U., Mishra, V. K. K., et al. (2017). Spot blotch disease of wheat: the current status of research on genetics and breeding. Plant Pathol. 67, 508–531. doi: 10.1111/ppa.12781
Gurung, S., Bonman, J. M., Ali, S., Patel, J., Myrfield, M., Mergoum, M., et al. (2009). New and diverse sources of multiple disease resistance in wheat. Crop. Sci. 49, 1655–1666. doi: 10.2135/cropsci2008.10.0633
Gurung, S., Hansen, J. M., Michael Bonman, J., Gironella, A. I. N., and Adhikari, T. B. (2012). Multiple disease resistance to four leaf spot diseases in winter wheat accessions from the USDA national small grains collection. Crop. Sci. 52:1640. doi: 10.2135/cropsci2011.08.0408
Gurung, S., Mamidi, S., Bonman, J. M., Xiong, M., Brown-Guedira, G., and Adhikari, T. B. (2014). Genome-wide association study reveals novel quantitative trait loci associated with resistance to multiple leaf spot diseases of spring wheat. PLoS One 9:e108179. doi: 10.1371/journal.pone.0108179
He, H., Zhu, S., Zhao, R., Jiang, Z., Ji, Y., Ji, J., et al. (2018). Pm21, encoding a typical CC-NBS-LRR protein, confers broad-spectrum resistance to wheat powdery mildew disease. Mol. Plant. 11, 879–882. doi: 10.1016/j.molp.2018.03.004
Jamil, M., Ali, A., Gul, A., Ghafoor, A., Ibrahim, A. M. H., and Mujeeb-Kazi, A. (2018). Genome-wide association studies for spot blotch (Cochliobolus sativus) resistance in bread wheat using genotyping-by-sequencing. Phytopathology 108, 1307–1314. doi: 10.1094/PHYTO-02-18-0047-R
Joshi, A. K., Kumar, S., Chand, R., and Ortiz-Ferrara, G. (2004). Inheritance of resistance to spot blotch caused by Bipolaris sorokiniana in spring wheat. Plant Breed. 123, 213–219. doi: 10.1111/j.1439-0523.2004.00954.x
Joshi, A. K., Kumari, M., Reddy, V. P. S., Kumar, S., Rane, J., Chand, R., et al. (2007a). Stay green trait: variation, inheritance and its association with spot blotch resistance in spring wheat (Triticum aestivum L.). Euphytica 153, 59–71. doi: 10.1007/s10681-006-9235-z
Joshi, A. K., Mishra, B., Chatrath, R., Ortiz Ferrara, G., and Singh, R. P. (2007b). Wheat improvement in India: present status, emerging challenges and future prospects. Euphytica 157, 431–446. doi: 10.1007/s10681-007-9385-7
Knoth, C., Salus, M. S., Girke, T., and Eulgem, T. (2009). The synthetic elicitor 3,5-dichloroanthranilic acid induces NPR1-dependent and npr1-independent mechanisms of disease resistance in arabidopsis. Plant Physiol. 150, 333–347. doi: 10.1104/pp.108.133678
Kumar, S., Prasad, L. C., Kumar, U., Tyagi, K., Balasubramaniyam, A., and Joshi, A. K. (2007). “Inheritance and allelic relationship of resistance genes to spot blotch of wheat caused by bipolaris sorokiniana,” in Wheat Production in Stressed Environments Wheat Production in Stressed Environments, eds H. T. Buck et al. (Berlin: Springer), 113–118. doi: 10.1007/1-4020-5497-1_15
Kumar, S., Röder, M. S., Tripathi, S. B., Kumar, S., Chand, R., Joshi, A. K., et al. (2015). Mendelization and fine mapping of a bread wheat spot blotch disease resistance QTL. Mol. Breed. 35:218. doi: 10.1007/s11032-015-0411-5
Kumar, U., Joshi, A. K., Kumar, S., Chand, R., and Röder, M. S. (2009). Mapping of resistance to spot blotch disease caused by bipolaris sorokiniana in spring wheat. Theor. Appl. Genet. 118, 783–792. doi: 10.1007/s00122-008-0938-5
Kumar, U., Joshi, A. K., Kumar, S., Chand, R., and Röder, M. S. (2010). Quantitative trait loci for resistance to spot blotch caused by bipolaris sorokiniana in wheat (T. aestivum L.) lines “Ning 8201” and “Chirya 3.”. Mol. Breed. 26, 477–491. doi: 10.1007/s11032-009-9388-2
Lennard, J. H. (1984). Common Diseases of Small Grain Cereals: A Guide to Identification. By F. J. Zillinsky. Mexico: CIMMYT (1983), pp. 141. Cambridge: Cambridge University Press, doi: 10.1017/s0014479700017695
Lillemo, M., Joshi, A. K., Prasad, R., Chand, R., and Singh, R. P. (2013). QTL for spot blotch resistance in bread wheat line Saar co-locate to the biotrophic disease resistance loci Lr34 and Lr46. Theor. Appl. Genet. 126, 711–719. doi: 10.1007/s00122-012-2012-6
Liu, X., Huang, M., Fan, B., Buckler, E. S., and Zhang, Z. (2016). Iterative usage of fixed and random effect models for powerful and efficient genome-wide association studies. PLoS Genet. 12:e1005767. doi: 10.1371/journal.pgen.1005767
Lu, P., Liang, Y., Li, D., Wang, Z., Li, W., Wang, G., et al. (2016). Fine genetic mapping of spot blotch resistance gene Sb3 in wheat (Triticum aestivum). Theor. Appl. Genet. 129, 577–589. doi: 10.1007/s00122-015-2649-z
Maccaferri, M., Sanguineti, M. C., Mantovani, P., Demontis, A., Massi, A., Ammar, K., et al. (2010). Association mapping of leaf rust response in durum wheat. Mol. Breed. 26, 189–228. doi: 10.1007/s11032-009-9353-0
Maccaferri, M., Zhang, J., Bulli, P., Abate, Z., Chao, S., Cantu, D., et al. (2015). A genome-wide association study of resistance to stripe rust (Puccinia striiformis f. sp. tritici) in a worldwide collection of hexaploid spring wheat (Triticum aestivum L.). G3 5, 449–465. doi: 10.1534/g3.114.014563
Marone, D., Russo, M. A., Laidò, G., De Vita, P., Papa, R., Blanco, A., et al. (2013). Genetic basis of qualitative and quantitative resistance to powdery mildew in wheat: from consensus regions to candidate genes. BMC Genomics 14:562. doi: 10.1186/1471-2164-14-562
McDonald, M. C., Ahren, D., Simpfendorfer, S., Milgate, A., and Solomon, P. S. (2018). The discovery of the virulence gene ToxA in the wheat and barley pathogen bipolaris sorokiniana. Mol. Plant Pathol. 19, 432–439. doi: 10.1111/mpp.12535
Mondal, S., Rutkoski, J. E., Velu, G., Singh, P. K., Crespo-Herrera, L. A., Guzman, C., et al. (2016). Harnessing diversity in wheat to enhance grain yield, climate resilience, disease and insect pest resistance and nutrition through conventional and modern breeding approaches. Front. Plant Sci. 7:991. doi: 10.3389/fpls.2016.00991
Myles, S., Peiffer, J., Brown, P. J., Ersoz, E. S., Zhang, Z., Costich, D. E., et al. (2009). Association mapping: critical considerations shift from genotyping to experimental design. Plant Cell. 21, 2194–2202. doi: 10.1105/tpc.109.068437
Neupane, R. B., Sharma, R. C., Duveiller, E., Ortiz-Ferrara, G., Ojha, B. R., Rosyara, U. R., et al. (2007). Major gene controls of field resistance to spot blotch in wheat genotypes “Milan/Shanghai #7” and “Chirya.3.”. Plant Dis. 91, 692–697. doi: 10.1094/PDIS-91-6-0692
Poland, J. A., Brown, P. J., Sorrells, M. E., and Jannink, J. L. (2012). Development of high-density genetic maps for barley and wheat using a novel two-enzyme genotyping-by-sequencing approach. PLoS One 7:e32253. doi: 10.1371/journal.pone.0032253
Rosyara, U. R., Khadka, K., Subedi, S., Sharma, R. C., and Duveiller, E. (2008). Heritability of stay green traits and association with spot blotch resistance in three spring wheat populations. J. Genet. Breed. 62, 75–82.
Sharma, R. C., Dubin, H. J., Devkota, R. N., and Bhatta, M. R. (1997). Heritability estimates of field resistance to spot blotch in four spring wheat crosses. Plant Breed. 116, 64–68. doi: 10.1111/j.1439-0523.1997.tb00976.x
Sharma, R. C., Duveiller, E., and Jacquemin, J. M. (2007a). Microsatellite markers associated with spot blotch resistance in spring wheat. J. Phytopathol. 155, 316–319. doi: 10.1111/j.1439-0434.2007.01238.x
Sharma, R. C., Duveiller, E., and Ortiz-Ferrara, G. (2007b). Progress and challenge towards reducing wheat spot blotch threat in the Eastern Gangetic Plains of South Asia: is climate change already taking its toll? F. Crop. Res. 103, 109–118. doi: 10.1016/j.fcr.2007.05.004
Singh, P. K., He, X., Sansaloni, C. P., Juliana, P., Dreisigacker, S., Duveiller, E., et al. (2018). Resistance to spot blotch in two mapping populations of common wheat is controlled by multiple QTL of minor effects. Int. J. Mol. Sci. 19:4054. doi: 10.3390/ijms19124054
Tomar, V., Singh, R. P., Poland, J., Singh, D., Joshi, A. K., Singh, P. K., et al. (2020). Genome-Wide Association Study and Genomic Prediction of Spot Blotch Disease in Wheat (Triticum aestivum L.) using Genotyping by Sequencing. Durham, NC: Research Square, doi: 10.21203/rs.2.22818/v1
van Ginkel, M., and Rajaram, S. (1993). “Breeding for durable resistance to diseases in wheat an additional perspective,” in Durability of Disease Resistance, eds T. Jacobes and J. E. Parlevliet (Dordrecht: Kluwer Academic Publishers), 259–272. doi: 10.1007/978-94-011-2004-3_28
van Ginkel, M., and Rajaram, S. (1998). “Breeding for resistance to spot blotch in wheat: a global perspective,” in Helminthosporium Blights of Wheat: Spot Blotch and Tan Spot, eds E. Duveiller, H. J. Dubin, J. Reeves, and A. McNab (Mexico DF: CIMMYT), 162–170.
Wang, J., Wang, J., Shang, H., Chen, X., Xu, X., and Hu, X. (2019). TaXa21, a leucine-rich repeat receptor-like kinase gene associated with TaWRKY76 and TaWRKY62, plays positive roles in wheat high-temperature seedling plant resistance to puccinia striiformis f. sp. tritici. Mol. Plant Microbe Interact. 32, 1526–1535. doi: 10.1094/MPMI-05-19-0137-R
Wang, Y., Wei, F., Zhou, H., Liu, N., Niu, X., Yan, C., et al. (2019). TaCAMTA4, a calmodulin-Interacting protein, involved in defense response of wheat to Puccinia triticina. Sci. Rep. 9:641. doi: 10.1038/s41598-018-36385-1
Yu, L. X., Lorenz, A., Rutkoski, J., Singh, R. P., Bhavani, S., Huerta-Espino, J., et al. (2011). Association mapping and gene-gene interaction for stem rust resistance in CIMMYT spring wheat germplasm. Theor. Appl. Genet. 123, 1257–1268. doi: 10.1007/s00122-011-1664-y
Zadoks, J. C., Chang, T. T., and Konzak, C. F. (1974). A decimal code for the growth stages of cereals. Weed Res. 14, 415–421. doi: 10.1111/j.1365-3180.1974.tb01084.x
Zegeye, H., Rasheed, A., Makdis, F., Badebo, A., and Ogbonnaya, F. C. (2014). Genome-wide association mapping for seedling and adult plant resistance to stripe rust in synthetic hexaploid wheat. PLoS One 9:e105593. doi: 10.1371/journal.pone.0105593
Zhang, P., Guo, G., Wu, Q., Chen, Y., Xie, J., Lu, P., et al. (2020). Identification and fine mapping of spot blotch (Bipolaris sorokiniana) resistance gene Sb4 in wheat. Theor. Appl. Genet. 133, 2451–2459. doi: 10.1007/s00122-020-03610-3
Zhu, C., Gore, M., Buckler, E. S., and Yu, J. (2008). Status and prospects of association mapping in plants. Plant Genome 1, 5–20. doi: 10.3835/plantgenome2008.02.0089
Zhu, X., Qi, L., Liu, X., Cai, S., Xu, H., Huang, R., et al. (2014). The wheat ethylene response factor transcription factor PATHOGEN-INDUCED ERF1 mediates host responses to both the necrotrophic pathogen rhizoctonia cerealis and freezing stresses. Plant Physiol. 164, 1499–1514. doi: 10.1104/pp.113.229575
Keywords: GWAS, GBS, spot blotch, QTLs, BLUPs, wheat
Citation: Tomar V, Singh D, Dhillon GS, Singh RP, Poland J, Joshi AK, Singh PK, Bhati PK, Kumar S, Rahman M, Tiwari BS and Kumar U (2021) New QTLs for Spot Blotch Disease Resistance in Wheat (Triticum aestivum L.) Using Genome-Wide Association Mapping. Front. Genet. 11:613217. doi: 10.3389/fgene.2020.613217
Received: 01 October 2020; Accepted: 10 December 2020;
Published: 14 January 2021.
Edited by:
Ajay Kumar, North Dakota State University, United StatesReviewed by:
Rohit Kumar, Clemson University, United StatesShyam Solanki, Washington State University, United States
Jason Fiedler, United States Department of Agriculture (USDA), United States
Copyright © 2021 Tomar, Singh, Dhillon, Singh, Poland, Joshi, Singh, Bhati, Kumar, Rahman, Tiwari and Kumar. This is an open-access article distributed under the terms of the Creative Commons Attribution License (CC BY). The use, distribution or reproduction in other forums is permitted, provided the original author(s) and the copyright owner(s) are credited and that the original publication in this journal is cited, in accordance with accepted academic practice. No use, distribution or reproduction is permitted which does not comply with these terms.
*Correspondence: Uttam Kumar, dS5rdW1hckBjZ2lhci5vcmc=; Vipin Tomar, dmlvbWljc0BnbWFpbC5jb20=