 Mateusz Garbulowski1*
 Karolina Smolinska1
 Klev Diamanti2
 Gang Pan2
 Khurram Maqbool2Lars Feuk2
 Jan Komorowski1,3,4,5*
- 1Science for Life Laboratory, Department of Cell and Molecular Biology, Uppsala University, Uppsala, Sweden
- 2Science for Life Laboratory, Department of Immunology, Genetics and Pathology, Uppsala University, Uppsala, Sweden
- 3Swedish Collegium for Advanced Study, Uppsala, Sweden
- 4Institute of Computer Science, Polish Academy of Sciences, Warsaw, Poland
- 5Washington National Primate Research Center, Seattle, WA, United States
Autism spectrum disorder (ASD) is a heterogeneous neuropsychiatric disorder with a complex genetic background. Analysis of altered molecular processes in ASD patients requires linear and nonlinear methods that provide interpretable solutions. Interpretable machine learning provides legible models that allow explaining biological mechanisms and support analysis of clinical subgroups. In this work, we investigated several case-control studies of gene expression measurements of ASD individuals. We constructed a rule-based learning model from three independent datasets that we further visualized as a nonlinear gene-gene co-predictive network. To find dissimilarities between ASD subtypes, we scrutinized a topological structure of the network and estimated a centrality distance. Our analysis revealed that autism is the most severe subtype of ASD, while pervasive developmental disorder-not otherwise specified and Asperger syndrome are closely related and milder ASD subtypes. Furthermore, we analyzed the most important ASD-related features that were described in terms of gene co-predictors. Among others, we found a strong co-predictive mechanism between EMC4 and TMEM30A, which may suggest a co-regulation between these genes. The present study demonstrates the potential of applying interpretable machine learning in bioinformatics analyses. Although the proposed methodology was designed for transcriptomics data, it can be applied to other omics disciplines.
Introduction
Autism spectrum disorder (ASD) is a neurodevelopmental disorder that has been extensively studied over the past decades (Cox et al., 1999; Marshall et al., 2008; Lord et al., 2018; Ozonoff and Iosif, 2019). The highly heterogeneous neurodevelopmental changes in ASD commonly lead to challenges in social interactions and communication and contribute to restricted and repetitive behaviors (Sharma et al., 2018). Diagnosis of ASD and its severity is typically performed with interviews of the proband and their family (Sharma et al., 2018). Epidemiological studies have shown that ASD has high heritability, but the genetic etiology is complex and heterogeneous (Tick et al., 2016; Feliciano et al., 2019). Transcriptomics studies have found that gene expression changes in blood of ASD subjects are linked to specific risk factors that may support the diagnosis (Gregg et al., 2008; Xiong et al., 2019).
Despite the fact that ASD is associated with the central nervous system, blood is frequently used for ASD research (Ansel et al., 2017). Although brain tissue samples are more relevant to explore ASD biomarkers, it is difficult to obtain samples from living subjects; thus, they are usually extracted postmortem. Recent studies (Fiorentino et al., 2016; Kealy et al., 2018) have shown that the blood-brain barrier (BBB) is altered in patients with psychiatric disorders, including ASD. Furthermore, one of the major effects of BBB dysfunctions is changes in the immune system. It has been shown that the gene expression profile of NK cells was altered in peripheral blood of children with ASD (Enstrom et al., 2009). Another transcriptomics data analysis of ASD subjects demonstrated similarities in functional enrichment between brain and blood (He et al., 2019). The study revealed significant enrichment in terms of immune response, mitochondrion-related functions, and oxidative phosphorylation. In addition, various advantages of using blood to study ASD individuals have been well-described by Ansel et al. (2017).
Clinicians have discerned several subtypes of ASD that share common behaviors (Witwer and Lecavalier, 2008). Commonly diagnosed ASD subtypes are (i) pervasive developmental disorder-not otherwise specified (PDD-NOS), (ii) Asperger syndrome (AS), and (iii) autism. Earlier studies have investigated similarities among ASD subtypes. In Walker et al. (2004), comparison of autistic symptoms revealed that PDD-NOS is less severe than autism and AS. In addition, AS and PDD-NOS were also shown to be closely related in terms of social functioning level. A comparative study by Li et al. (2019) tested genetic components and gene expression patterns of the ASD subtypes. These studies have shown that autism and PDD-NOS share broad similarity, while AS exhibits distinct patterns.
In recent years, different machine learning approaches have been successfully applied to mine knowledge from various types of omics (Oh et al., 2017; Chand et al., 2020; Maros et al., 2020). These analyses have assisted in biomarker identification and better understanding of the underlying biological processes for various inherited disorders. As numerous studies have produced large datasets, there is a need to efficiently merge information from multiple sources to increase its statistical power and interpretability (Lagani et al., 2016; Dong and Rekatsinas, 2018; Fajarda et al., 2020). In bioinformatics, machine learning is a powerful technique for data integration and analysis (Li et al., 2018). However, most of the commonly used algorithms are black-box approaches that frequently lead to poor interpretability of the classifier (Rudin and Radin, 2019). Various studies (Ali et al., 2018; Orange et al., 2018; Gao et al., 2019; Matsui et al., 2020; Sinkala et al., 2020) performed a machine learning analysis on disease subtype classification by constructing models that its internal structure is difficult to explain. Herein, we proposed the utilization of interpretable machine learning (IML; Molnar, 2020) to perform an integrative analysis on multiple transcriptomics datasets. IML algorithms allow for visibility of the internal decisions made by the system. In this work, interpretability is intrinsically determined by a set of IF-THEN rules that constitute a rule-based model. More importantly, such IML models can be visualized in various graphical forms (Bornelöv et al., 2012; Anyango, 2016). Therefore, we focused on graphic representations of IML models as a co-predictive undirected network that allowed us to explore dissimilarities among clinical subgroups.
In this study, we examined dissimilarities of ASD subtypes identified from IML modeling using three transcriptomics cohorts. Herein, we assumed interpretability of the IML modeling over its performance. We showed that IML modeling is capable of single-view integrative analysis of predefined ASD subtypes (Figure 1). Visualization of the ASD-control studies in a single network revealed a strong co-predictive mechanism between EMC4 and TMEM30A and other mechanisms. To analyze ASD subtypes, we measured the distance among subnetworks representing ASD subtypes and established dissimilarities between autism, AS, PDD-NOS, and control. Based on the network structure and node connection parameters, we found that AS is a milder form of ASD and autism is the most severe form of ASD. Finally, we performed functional profiling of the genes used for IML modeling to examine functional information in various databases. The results from this study showed that rule-based IML can be applied on an integrative analysis and to estimate co-predictors of ASD. Furthermore, based on co-predictive genes, rule-based modeling can be used for describing dissimilarities between ASD subtypes and control.
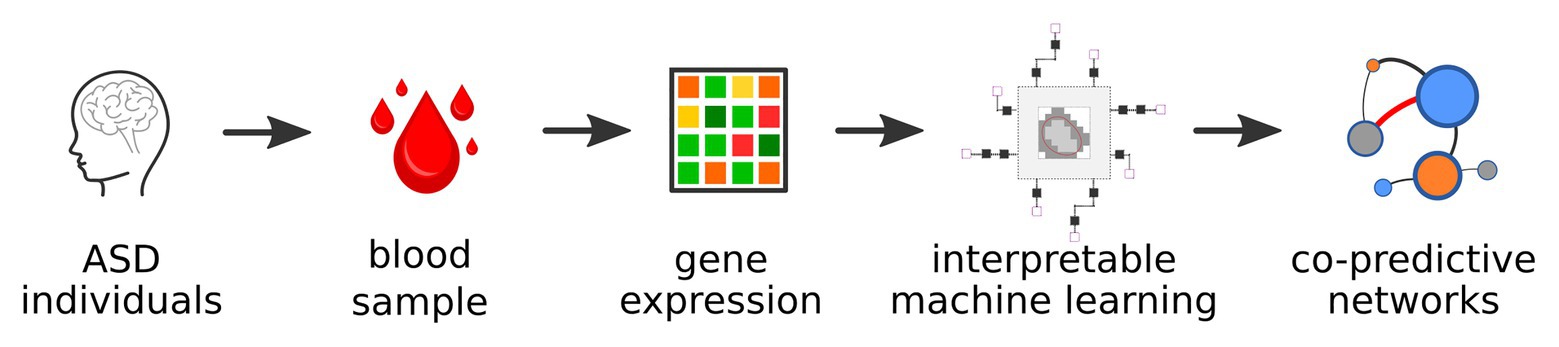
Figure 1. General workflow of the analysis.
Materials and Methods
Overview of the Workflow
Our methodology was designed to construct and analyze unbiased IML models. A schematic overview of the pipeline we employed to construct and visualize the IML model is shown in Figure 2. This methodology can be applied to data from any omics discipline that can be transformed into a decision table, e.g., RNA-seq, DNA methylation, or mass spectrometry proteomics. Details of the analysis are described in the subsections below.
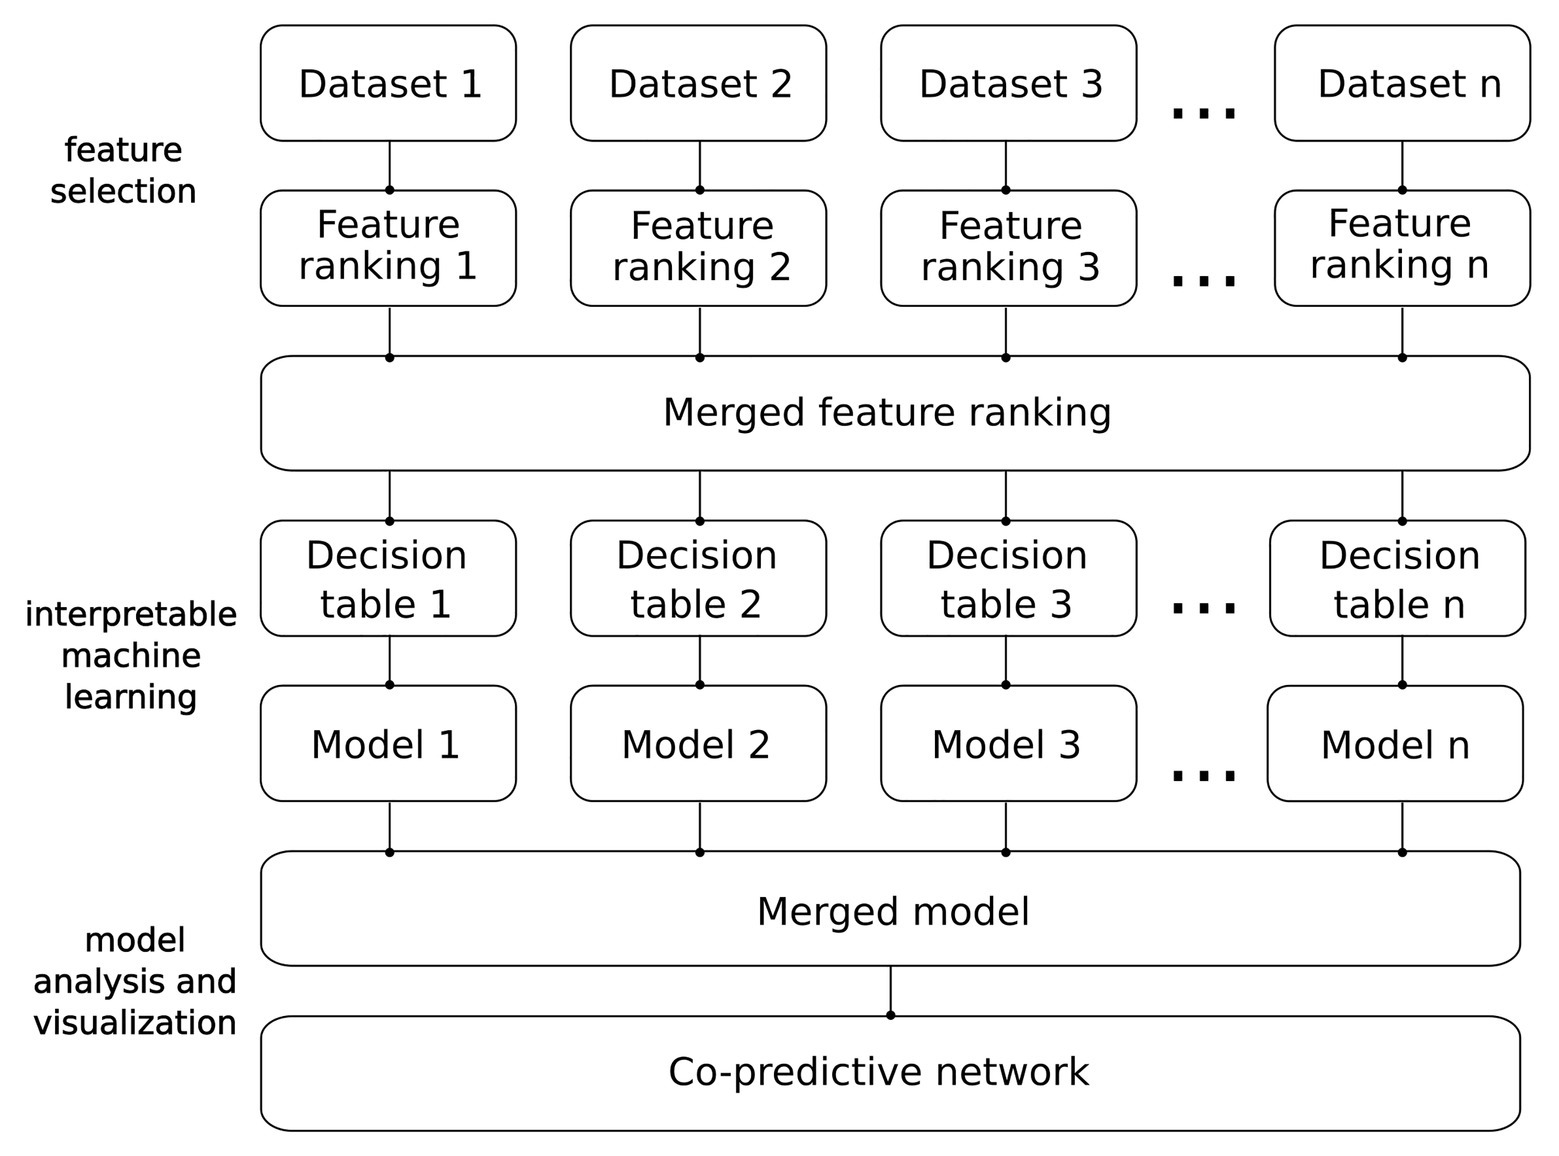
Figure 2. From data to network. Detailed pipeline of the analysis.
Datasets Description and Preprocessing
We collected three datasets of case-control studies of ASD that we named DS1 (Kong et al., 2012), DS2 (Kong et al., 2012), and DS3 (Alter et al., 2011). These three datasets contained gene expression levels measured with Affymetrix arrays. Datasets were selected based on sampling tissue being peripheral blood, contain a relatively high number of samples for IML modeling (more than 30 per decision class) and are publicly available in the Gene Expression Omnibus (GEO) repository. In total, 431 samples were collected and analyzed (Table 1).
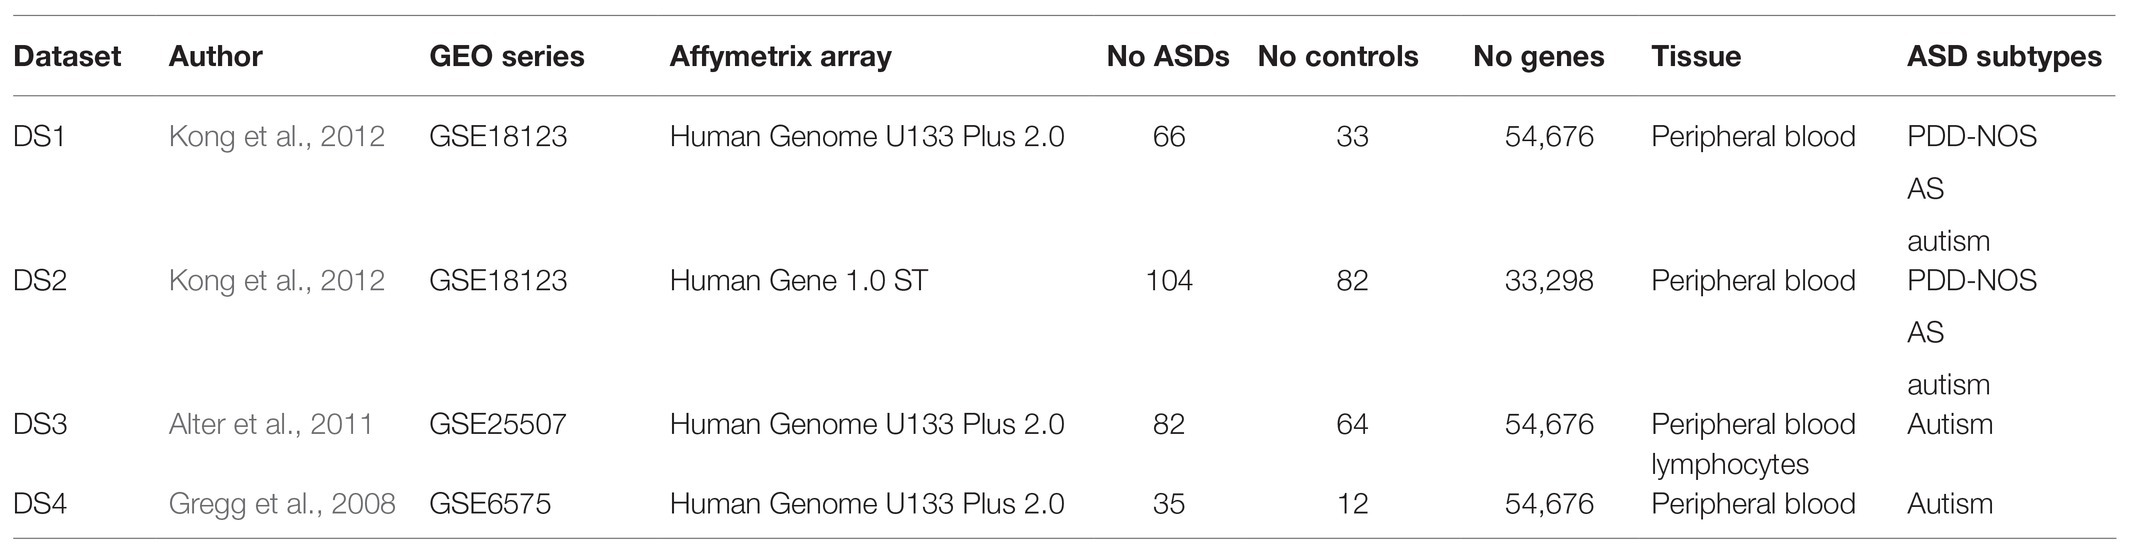
Table 1. Overview and accession numbers of the datasets used in the analysis.
Raw gene expression data were imported with the recent versions of R packages affy (DS1 and DS3) and oligo (DS2; Gautier et al., 2004; Carvalho and Irizarry, 2010). We performed Robust Multi-array Average (RMA) normalization and background correction on the datasets. Furthermore, each of the datasets was investigated for known and latent batch effects (Supplementary Figure S1). We performed a principal component analysis (PCA) and inspected the impact of clinical variables such as age, sex, or other unknown sources. We found that DS3 may be affected by the age disproportionality of the subjects and the data was corrected for this factor using ComBat (Leek et al., 2012). To detect latent batch effects, we estimated surrogate variables. As a consequence, DS1 and DS2 were corrected for unknown biases with 2 and 17 significant surrogate variables, respectively. To adjust for detected biases, we used the sva and limma packages (Smyth, 2005; Leek et al., 2012). To evaluate highly ranked co-prediction mechanism in ASD, we introduced DS4 (Gregg et al., 2008), which was preprocessed using the same approaches as for other datasets (Supplementary Figure S2). DS4 was excluded from IML modeling due to small sample size of the control class (Table 1). Thus, control samples from DS4 were not used for validation of co-predictors. In addition, one of the control samples from DS4 was distinguished as an outlier (Supplementary Figures S2A,C) and removed.
Feature Selection
Microarray gene expression data measure the expression levels of up to about 60,000 genes. However, the considerably smaller number of samples introduces an ill-defined problem that we solved employing feature selection. To reduce the high dimensionality of the data, we performed Monte Carlo feature selection (MCFS) that ranks the features based on their estimated relative importance (RI) from decision trees (Dramiński et al., 2008). To generate the ranking of the most important genes and exclude redundant signals, we used the R package rmcfs (Dramiński and Koronacki, 2018). In order to avoid overfitting, we used the results from rmcfs of all datasets in a cross-validation (CV) manner (Krawczuk and Łukaszuk, 2016). To select the top features estimated by MCFS, we chose a critical angle thresholding method (Supplementary Figure S3). Other methods for the selection of the RI threshold included mean, k-means, and the permutation-based approach. The permutation-based method is the default for rmcfs; however, for DS2 and DS3 it returned only one feature, making it non-feasible to perform learning (Supplementary Figure S3A). In contrast, mean and k-means chose very relaxed thresholds which resulted in a very large number of features potentially introducing noise to the learning process (Supplementary Figure S3B). On the other hand, critical angle showed consistency by selecting a similar number of features across datasets (Supplementary Figure S3A). Finally, we constructed a merged feature ranking (FR) of the most relevant features sorted by their RI.
FR Adjustment
To correct for inconsistency between feature selection and classification techniques, we adjusted the number of the most relevant features given by the MCFS. To account for the diversity between rmcfs and R.ROSETTA algorithms, we introduced correction of the threshold of the most important features. To find the new number of features, we estimated accuracy and area under the ROC curve (AUC) for several models using diverse numbers of top features (Supplementary Figure S4). By taking the original FRs from rmcfs, we iteratively added features, one by one, with respect to their decreasing RI. The process started with the number of features given by a critical angle threshold from rmcfs and proceeded until the ranking reached 50 features. Each FR was used to construct a decision table and perform rule-based classification. Finally, to avoid overestimation we chose the number of top features from the model with the nearest local maximum of the highest model quality (Supplementary Figure S4). As a result of FR adjusting, the final models gained slightly more features relevant from the rule-based modeling perspective. The final FR consisted of 50 genes.
Rule-Based Classification
In this work, we based the IML approach on the rough set theory (Pawlak, 1982; Pawlak and Skowron, 2007). In the rough set theory, the data universe consists of examples, which may also be called objects or samples, and variables also called attributes or features. By marking the last attribute as a decision class, the structure called a decision table is constructed (Pawlak, 2002). The rough set-based approach assumes that examples with exactly the same information are indiscernible (Skowron and Dutta, 2018). In this study, objects are represented by the ASD samples and attributes by the set of the most informative genes selected from adjusted FRs. Importantly, rough set-based models estimate reducts that determine minimal sets of attributes (Komorowski, 1999). Moreover, reducts are the main components for estimating rules that represent a co-predictive mechanism of features. In this type of IML, the set of rules constitutes the model legibility. A single rule is represented as an IF-THEN formula in natural language. Specifically, IF certain conditions are fulfilled THEN a prediction is made. Rules are often accredited by the fundamental measures of support, coverage and accuracy (Tsumoto, 2002; Molnar, 2020). The rule support (RS) is the number of samples that fulfill the rule conditions or prediction. We discern between the left-hand site rule support (RSLHS) that corresponds to the IF-part of the rule (conditions) and the right-hand site rule support (RSRHS) that corresponds to the THEN-part of the rule (prediction). The rule coverage (RC) is decision class-specific fraction of samples that match the rule. For example, if 30 out of 100 samples fulfill the THEN-part of the rule then RCRHS of such rule is 0.3. The RC is defined as support divided by the total number of samples for a given decision class that is represented as:
The rule accuracy (RA) describes the predictive power of the rule based on RS. For example, if the IF-part of the rule corresponds to 10 samples and THEN-part corresponds to 9 then RA is 0.9. Specifically, RA is calculated as:
Based on these basic measurements, other statistical values can be estimated, such as rule value of p (Garbulowski et al., 2020). Additionally, the length of a rule is also an important factor. If the rule consists of two or more conditions, then a co-predictive mechanism occurs for these features. Herein, we used rule-statistic measures for pruning and assessing the IML model quality.
To construct legible classifiers, we used a rule-based framework that receives a decision table as input and generates IML model as output. The modeling was performed with R package R.ROSETTA, which is a wrapper of the ROSETTA system (Øhrn and Komorowski, 1997; Garbulowski et al., 2020). The IML modeling was performed using 10-fold CV and the standard voting method. The datasets were discretized using equal frequency binning with three levels on the training set, and subsequently the cuts were applied to the test set. The Johnson reduction method was used to generate the reducts and rules for the models. Furthermore, we used undersampling to account for uneven distribution of samples in each class across datasets. After balancing the data, R.ROSETTA recalculated all the statistical values for rules according to the information from nonsampled examples. The result of recalculation allowed finding the exact samples that correspond to rules, known as support sets. These were further used to link rules with their clinical subgroups.
The final rule-based models were constructed from the merged FR sets. However, due to differences between microarray platforms (Table 1) the overlap between sets of genes was incomplete. Thus, two genes were not used for classification in DS1 and DS3, and nine genes were not used for classification in DS2 (Table 2).
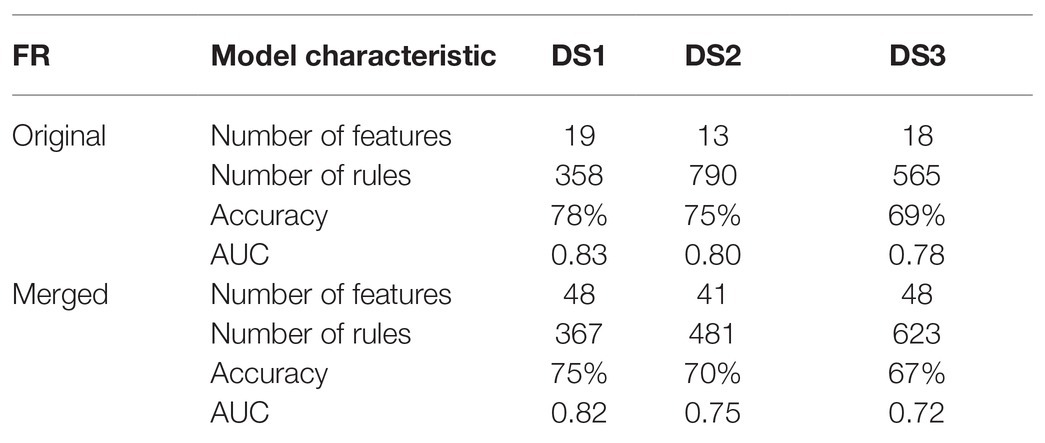
Table 2. Characteristics and results of IML models built on the original and merged FRs.
Merging Datasets
The main advantage of IML-based analysis is to obtain legible models that can be easily analyzed. Data integration is an important task that unifies different datasets and increases the statistical power of the analysis (Lenzerini, 2002). In this study, we proposed two merging steps for (i) the most important features and (ii) IML models (Figure 2). Respective adjusted FRs were merged into a single FR that consisted of all the important features selected by MCFS. As datasets were produced with different microarray platforms, we compared the positions of probes and remapped probe IDs across platforms. The positions were compared using the R package GenomicRanges (Lawrence et al., 2013) and the UCSC Genome Browser (Kent et al., 2002). To merge IML models, we aggregated rules from all models. For rules that occurred multiple times its RS and support sets were summed up. In consequence, RA, RC, values of p, and other statistics measures of rules were normalized to merged cohorts and recalculated. The result of the pipeline (Figure 2) that included these merging steps is a single model built from multiple datasets. The model was further used to create the rule-based networks.
Co-predictive Network
In this step, we visualized the merged IML model of ASD as a rule-based network using the VisuNet R package (Anyango, 2016; Smolinska, 2021). The network displays co-predictive mechanisms of features that are defined as nodes and edges. Each node is described by the RS or RC and its connection parameter. The filtration methods in VisuNet help show the most relevant elements of the network. Furthermore, VisuNet allows presenting gene expression levels with predefined colors of nodes. Thus, it assists toward better interpretation of the IML models. Herein, such a graphic representation was used to display co-predictive genes for the merged ASD model.
The two main points of interest while analyzing rule-based networks are hubs and large nodes. A hub is a node that connects to multiple other nodes, and it is marked with a thick blue border. The interpretation of a hub may suggest a feature that frequently participates in co-prediction, in other words, a feature that is a good predictor in combination with many other features. Large nodes represent features that are supported by many samples.
Network Comparison
Network Structure
To analyze the network structure, we investigated the connection parameter. For an edge that connects two nodes, a connection value is defined as:
The connection value for the edge is unity-based normalized. For nodes, the connection is defined as the sum of all connections between the given node and all other connected nodes. Herein, the connection can be interpreted as a nonlinear association between two or more genes. To examine the contribution of genes for discerning among ASD subtypes, we used node connection values for clustering. As the connection values were not normally distributed, we performed clustering with Kendall correlation metrics (Abdi, 2007). We scaled all connection values between 0 and 1, and then, for clustering, we selected all the nodes that describe genes on their discrete expression levels.
In-Between-Network Distance
To characterize dissimilarities between clinical subgroups, we linked rules from the merged model with various clinical variables such as ASD subtypes, age, and sex (Supplementary Table S1). Using the R.ROSETTA package, we recalculated the model and extracted support sets for each rule that were further translated to the particular clinical subgroup. Dissimilarities between subgroups were based on estimating the centrality distance for the networks (Borgatti and Everett, 2006; Roy et al., 2014). In particular, centrality betweenness distance is estimated based on the shortest path between two given nodes. We tested several approaches of estimating in-between graph distance with the NetworkDistance R package (You, 2020). To validate our findings, we performed a permutation test by shuffling the decision of the rules for each network 500 times. Additionally, as the proportion of the recalculated rules among the decision classes was imbalanced, we iteratively sampled equal numbers of rules 20 times and averaged the distance for balanced networks. We assumed that the distance for random networks cannot be greater than the distance for original networks; thus, we estimated left-tailed values of p.
Functional Profiling
The functional profiling of the genes from merged FR was performed with the web-based toolset g:Profiler that performs enrichment analysis (Reimand et al., 2007). We used a large collection of sources for sets of gene including gene ontology (GO) for molecular function, cellular component and biological processes, Kyoto Encyclopedia of Genes and Genomes (KEGG), Reactome, TRANSFAC, miRTarBase, Human Protein Atlas, CORUM protein complexes, human phenotype ontology, and WikiPathways. The functional enrichment analysis was performed using g:GOSt with the false discovery rate (FDR) set to 5%. The profiling could be executed for the set of 40 out of 50 genes that were identified by the tool (Supplementary Table S2).
Additionally, we evaluated the results of the functional profiling for specific ASD subtypes. We selected top co-predictors from the network by estimating thresholds using the k-means method from R package mmand (Clayden et al., 2020). Specifically, thresholds were estimated based on the node connection values from the rule-based networks. The list of estimated top co-predictors can be found in Supplementary Table S3. In the next step, we calculated the fraction of genes that correspond to selected terms. For example, if 5 out of 10 top co-predictors intersected with genes included in a given term, the fraction is 0.5. Terms were selected according to ASD-associated terms found in literature. These include alterations related to the immune system (Ormstad et al., 2018), calcium (Guan et al., 2020), metabolism (Shmais et al., 2012; Frye et al., 2013), mitochondrion (Rossignol and Frye, 2012), metal ions (Hagmeyer et al., 2015), and membrane (Kitagishi et al., 2015).
Results
IML Modeling and Visualization
Following the pipeline (Figure 2), we first applied MCFS and created a merged FR from the original FRs of the respective datasets. As mentioned in the FR adjustment subsection, the thresholds for selecting features were adjusted in order to increase the number of genes associated with the rule-based classification. While merging, we found no overlapping genes between FRs. Next, we compared the difference in model quality introduced by merging FRs from the individual datasets. Models that were built on FRs computed from the same dataset resulted in a reasonable quality (Table 2). The average accuracy was 74%, and the average AUC was 0.80. After introducing the merged FR for modeling, we observed a moderate drop in quality. The latter suggests a reduction on the bias introduced by employing features applied on the IML of the same dataset. Models for DS1 and DS3 based on the set of merged FRs resulted in an increase in the number of rules as compared to the ones that were based on the dataset-specific FR, while the opposite occurred for DS2 suggesting overfitting in the original model (Table 2). Additionally, we observed that DS3 resulted in the lowest quality across models. It suggests that the quality of this dataset may be lower than DS1 and DS2. Importantly, DS3 consisted only of autistic male subjects; thus, the data variability may be lower than for DS1 and DS2. Despite the fact that each dataset obtained a unique set of the most important features, contribution of all features from merged FRs has been observed in IML modeling and further in networks (Supplementary Figure S5). The weakest contribution has been observed from DS3 for ASD samples (Supplementary Figure S5A). For control, genes contributed equally in modeling (Supplementary Figure S5B).
The final IML model contained 1,448 rules (693 for ASD and 755 for control) that covered all samples and important genes from DS1, DS2, and DS3. A graphic representation of the IML model demonstrated the co-predictive mechanisms of genes for different expression levels toward ASD (Figure 3). Interestingly, a few hub nodes were distinguished on the network that corresponded to EMC4, GAS5|SNORD76, HERC4, and TMEM30A. This suggested that these genes were highly relevant co-predictors that discern between ASD and control subjects. Further analysis on the edges of the network highlighted a strong connection between low expression of EMC4 and high expression of TMEM30A (Figure 3) that we explored in detail below.
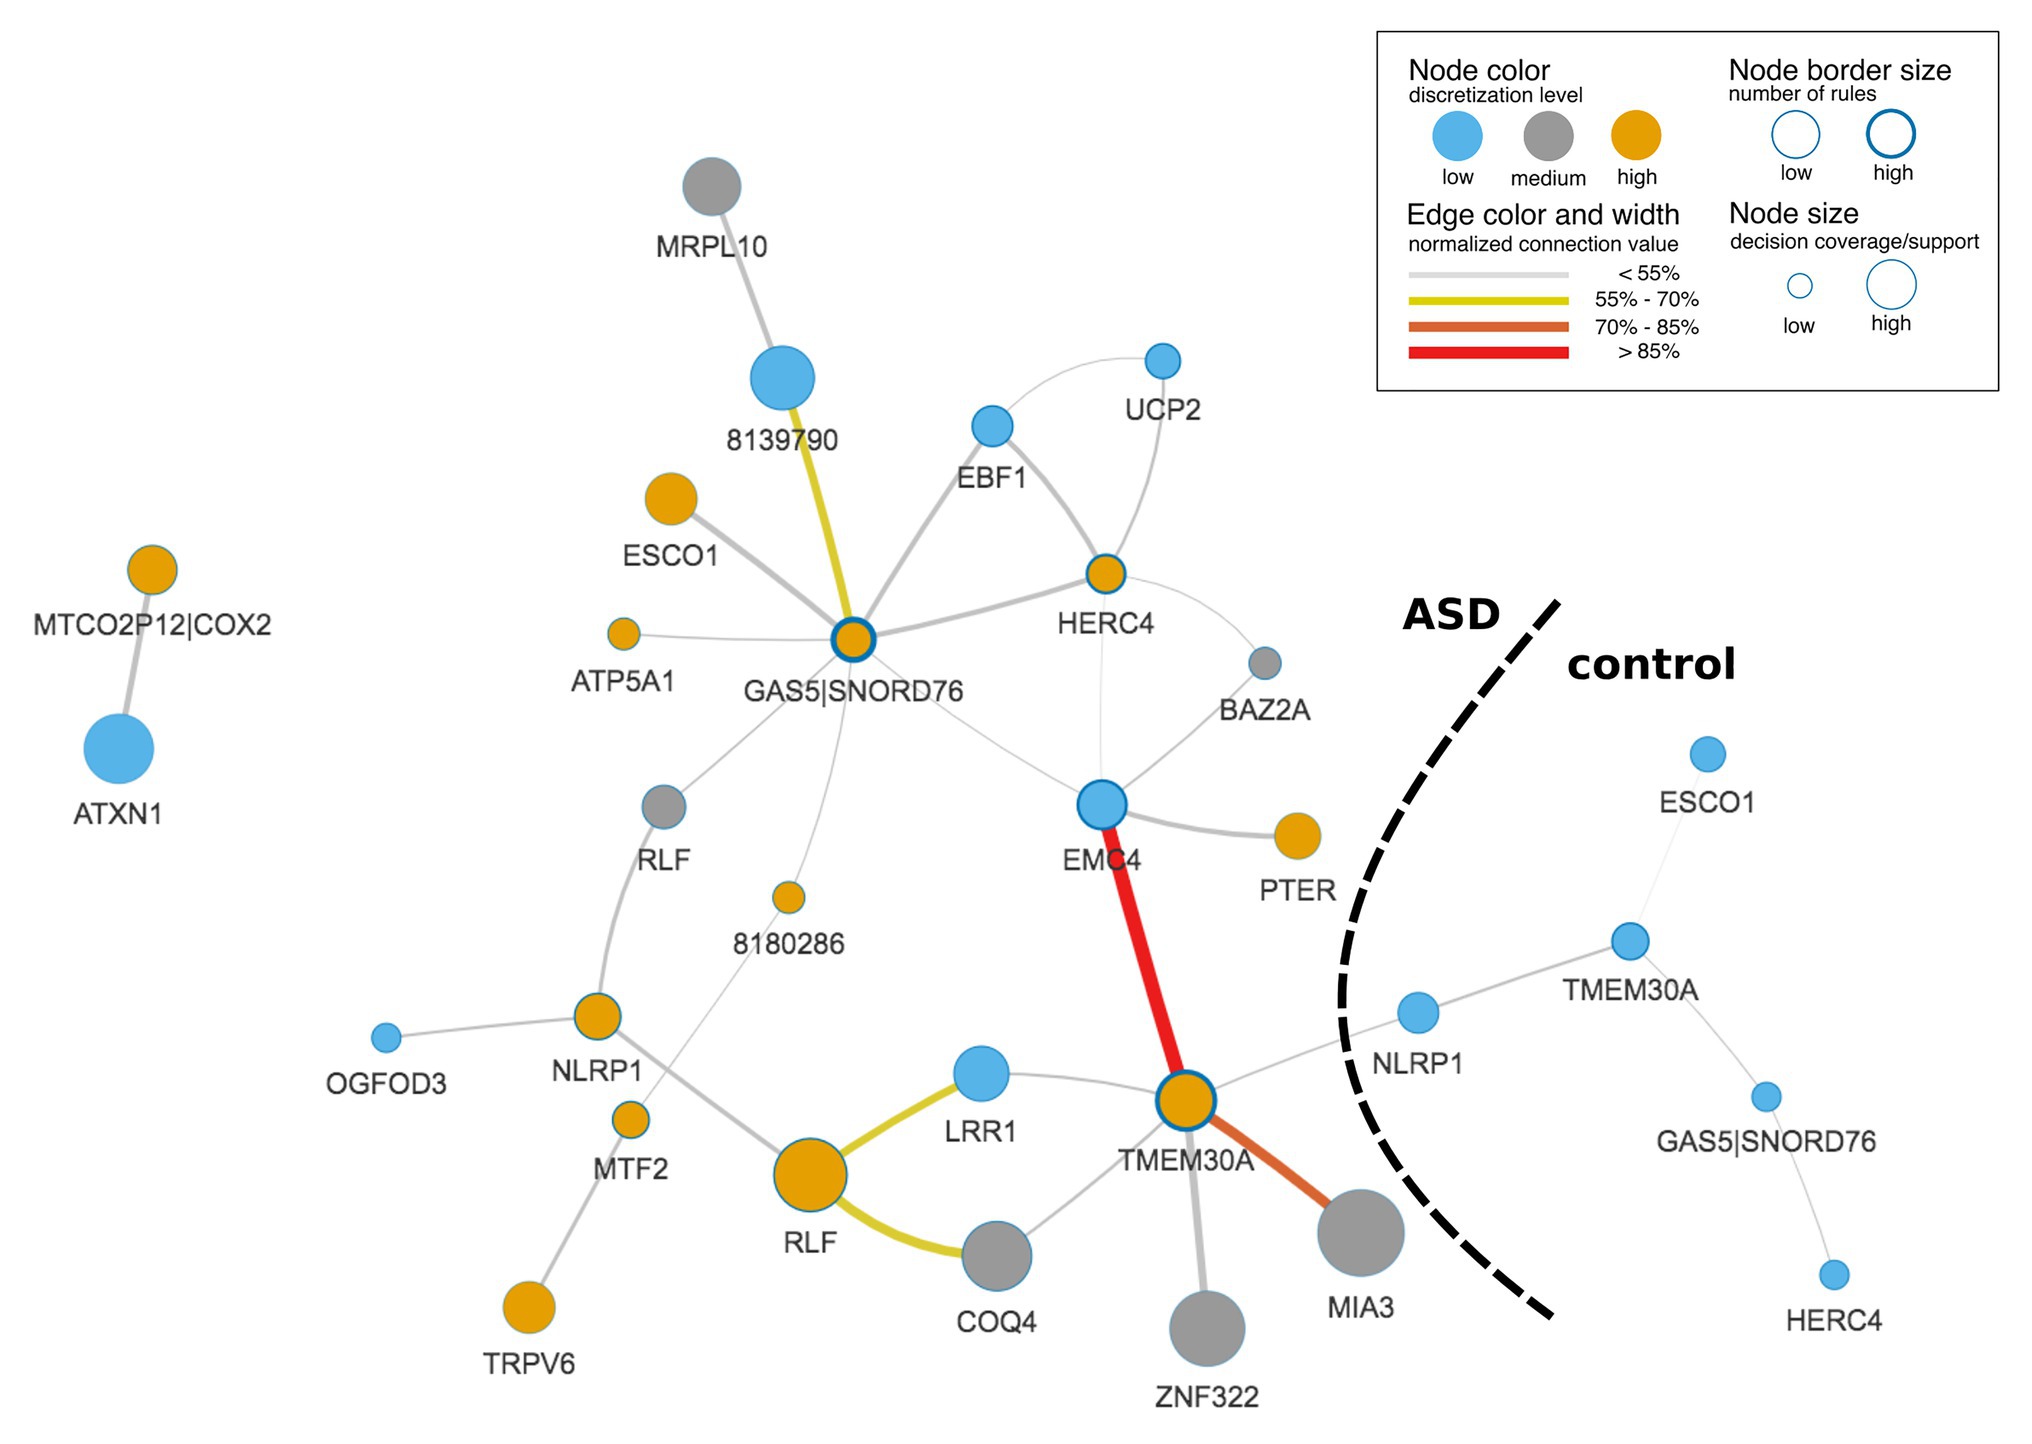
Figure 3. Rule-based network displaying top co-predictions of an IML model of case-control studies for autism spectrum disorder (ASD). The network was built with significant rules (false Discovery Rate, FDR-corrected p ≤ 0.05) for both classes together and illustrates top 5% of the 30 most strongly connected nodes. Edge and node connection values represent strength of the co-predictors in the classification procedure. Black dashed line divides network into subnetworks that correspond to ASD and control classes.
Co-predictive Mechanisms
Most prominent is a co-regulation between EMC4 and TMEM30A (Figure 3, Supplementary Figure S6). In control samples of DS1 and DS2, their correlation was close to 0 (Supplementary Figures S6A,B), while they were co-regulated in ASD samples for DS1 and DS2 (Supplementary Figures S6D,E). In contrast, we did not observe significant differences in DS3 (Supplementary Figures S6C,F). It may be due to a lower quality of the IML model built from DS3. This in silico-identified co-predictive mechanism suggested that this dependency may consist a co-expression mechanism. Additionally, we performed a statistical analysis on the particular genes in order to validate their expression changes between ASD and control (Supplementary Figures S6G–I). We observed that expression of both genes was significantly changed in DS1 (Supplementary Figure S6G) and DS2 (Supplementary Figure S6H). Furthermore, the respective studies, DS1 and DS2, also found TMEM30A as a differentially expressed gene that was further confirmed with qRT-PCR (Kong et al., 2012). We also evaluated other co-predictive mechanisms that were visible in the network (Figure 3). These include MIA3-TMEM30A, LRR1-RLF, and RLF-COQ4 (Supplementary Figures S7–S9). These co-predictions were detected for DS1 and DS2 and validated with DS4 (Supplementary Figure S10). To investigate ASD subtypes for these co-predictive mechanisms, we evaluated their support sets and its percentage distribution normalized to the total amount of ASD subtypes (Figure 4).
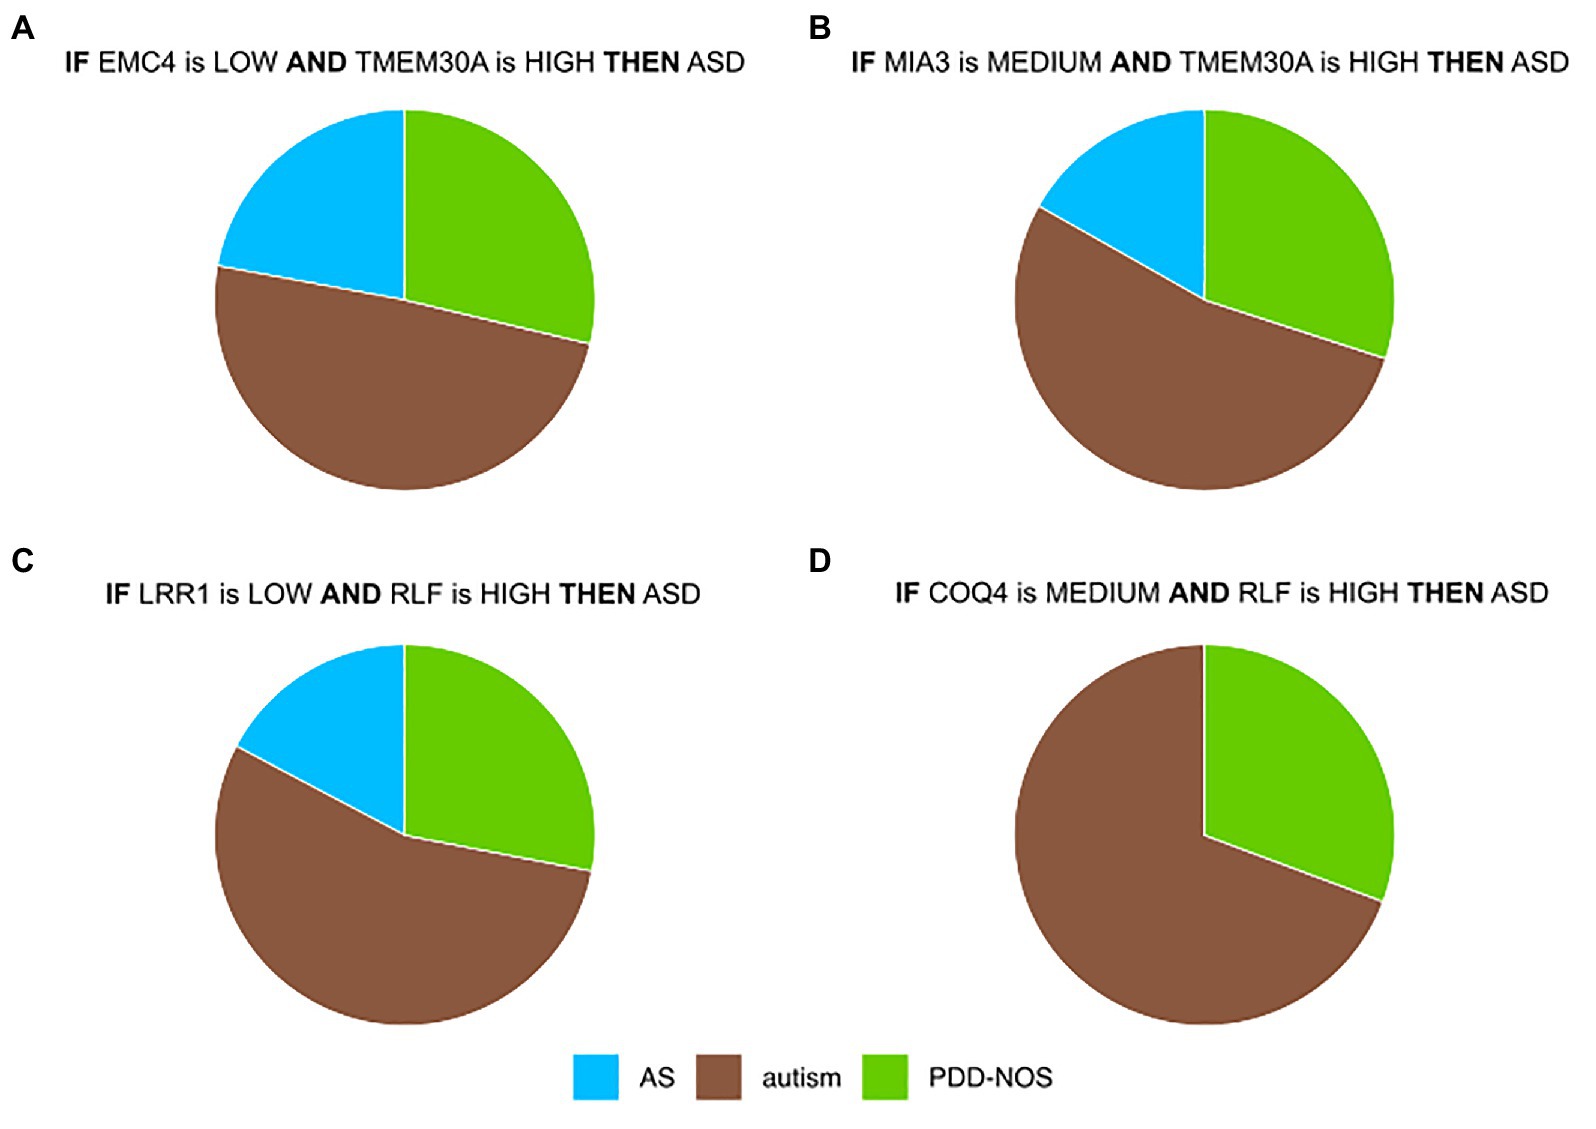
Figure 4. Top co-predictors derived from the ASD-control network. (A) Distributions of ASD subtypes of selected co-predictive mechanisms for (A) EMC4-TMEM30A (B) MIA3-TMEM30A (C) LRR1-RLF, and (D) COQ4-RLF. Values were normalized to the total amount of objects for each ASD subtype.
Dissimilarities of ASD Subtypes
We assumed that the concept of rule-based networks follows the same principles as any other undirected network. Thus, node‐ or edge-oriented properties can be analyzed and the distance for networks can be estimated (Entringer et al., 1976). Previous studies have shown that measuring the distance between networks can assist on bioinformatics analysis (Notebaart et al., 2008;Chen et al., 2018). Since a rule-based network is a more descriptive way of evaluating IML models, we used its topological structure to perform an analysis on ASD clinical subgroups. To provide the dissimilarity values between the subgroups, we measured centrality distances for the networks and performed a permutation test (Borgatti and Everett, 2006; van Borkulo et al., 2015). Among other methods (You, 2020), we found that only betweenness centrality distance resulted in significant values of p from permutation tests.
We first recalculated the model according to the clinical subgroups (cf. section Materials and Methods) that allowed creating clinical subgroup-specific subnetworks. To validate if the network structure could be used for finding differences between subgroups, we used node and edge connection values, which represent the connection power. Modeled distributions showed varying differences between subgroups; therefore, this confirmed that the network structure was capable of discerning subgroups (Figures 5A,B). To obtain an intuitive measure of these differences, we estimated the betweenness centrality among pairs of subnetworks and confirmed the robustness of the distances using permuted sets of networks (Figure 5C, Supplementary Figure S11).
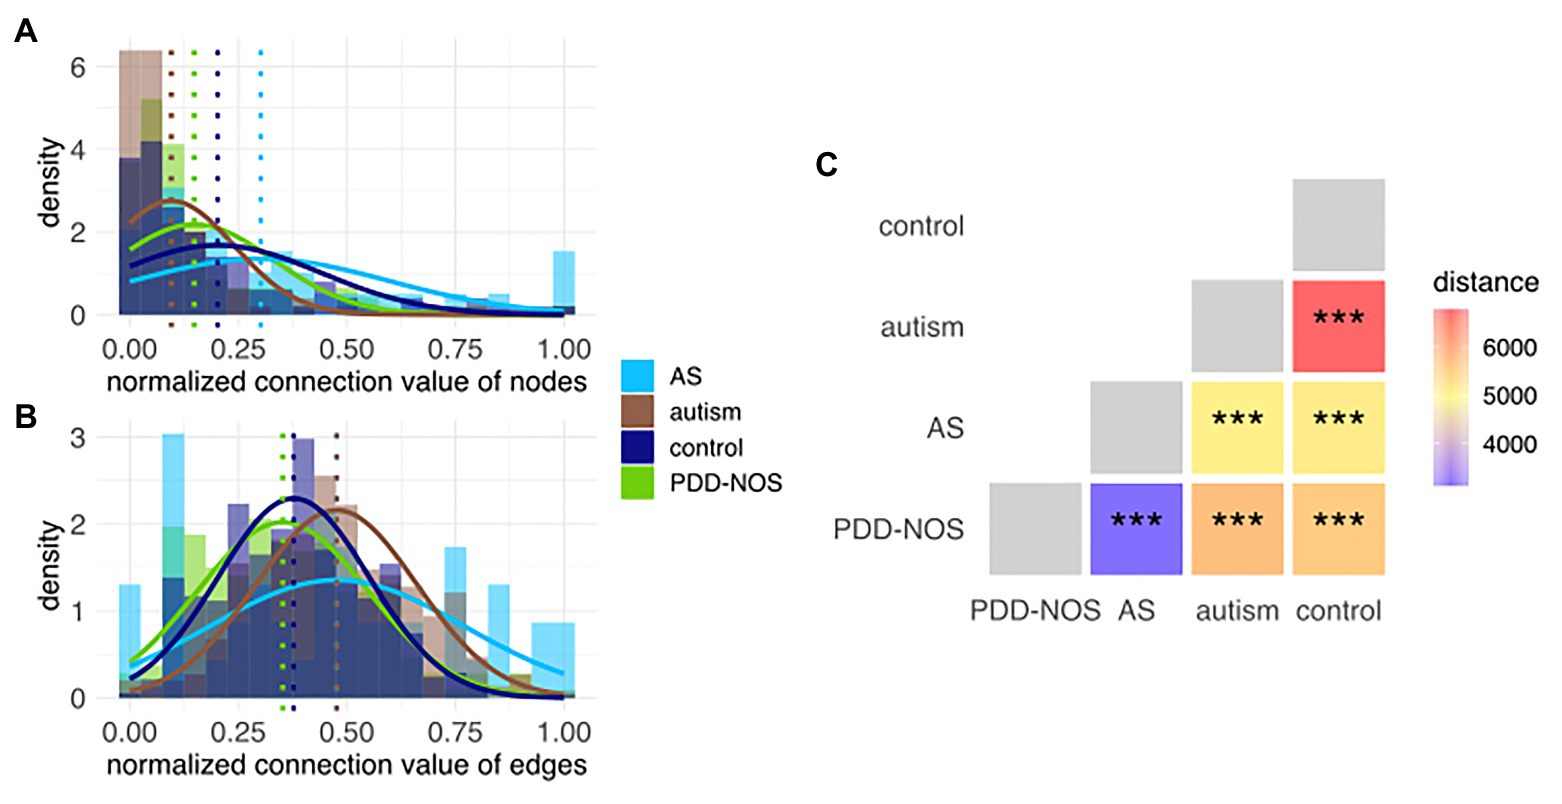
Figure 5. Histogram of the connection values for (A) nodes and (B) edges. Each histogram represents subnetworks that correspond to the particular ASD subtype and control. Modeled distributions were marked for each subgroup. Dotted lines represent the average values for each distribution. (C) In-between-network dissimilarity estimated as a centrality betweenness distance. Values of p were marked as ns (p > 0.05), *(p ≤ 0.05), **(p ≤ 0.01), and ***(p ≤ 0.001).
Autism and control were the most dissimilar subgroups based on their subnetwork distances (Figure 5C). Comparison among all pairs of phenotypes sorted ASD subtypes in a decreasing fashion based on the distance from control, that is, autism, PDD-NOS, and AS (Figure 5C). The latter suggested that autism was the most severe form of ASD, PDD-NOS is milder than autism, while AS is the mildest form of ASD. This result is consistent with previous studies (Walker et al., 2004). Furthermore, network-based distance analysis suggested that PDD-NOS and AS are closely related subtypes (Figure 5C). In addition, we investigated age and sex subgroups; however, the permutation test resulted in nonsignificant (p > 0.05) associations (Supplementary Figures S12–S15).
We pruned subnetworks for various phenotypes to identify genes that discern between ASD subtypes and control (Figures 6A–D). We observed genes that were shared across the subgroups such as UCP2 (control, PDD-NOS, autism, and AS) or highly expressed MTF2 (PDD-NOS and AS). We also observed unique genes for specific subgroups such as TRPV6 for autism or ATXN1 for AS. Furthermore, we identified ASD subgroup-specific hubs, for example, GAS5|SNORD76 and MTF2 for PDD-NOS or BAZ2A and MTCO2P12|COX2 for autism. To evaluate topological similarities of networks, centrality betweenness distance finds the shortest path between the given pair of nodes. For example, interactions for MTF2-ESCO1-DYNLL2 (Figure 6C) and MTF2-DYNLL2 (Figure 6B) shall be considered as similar structures between PDD-NOS and AS.
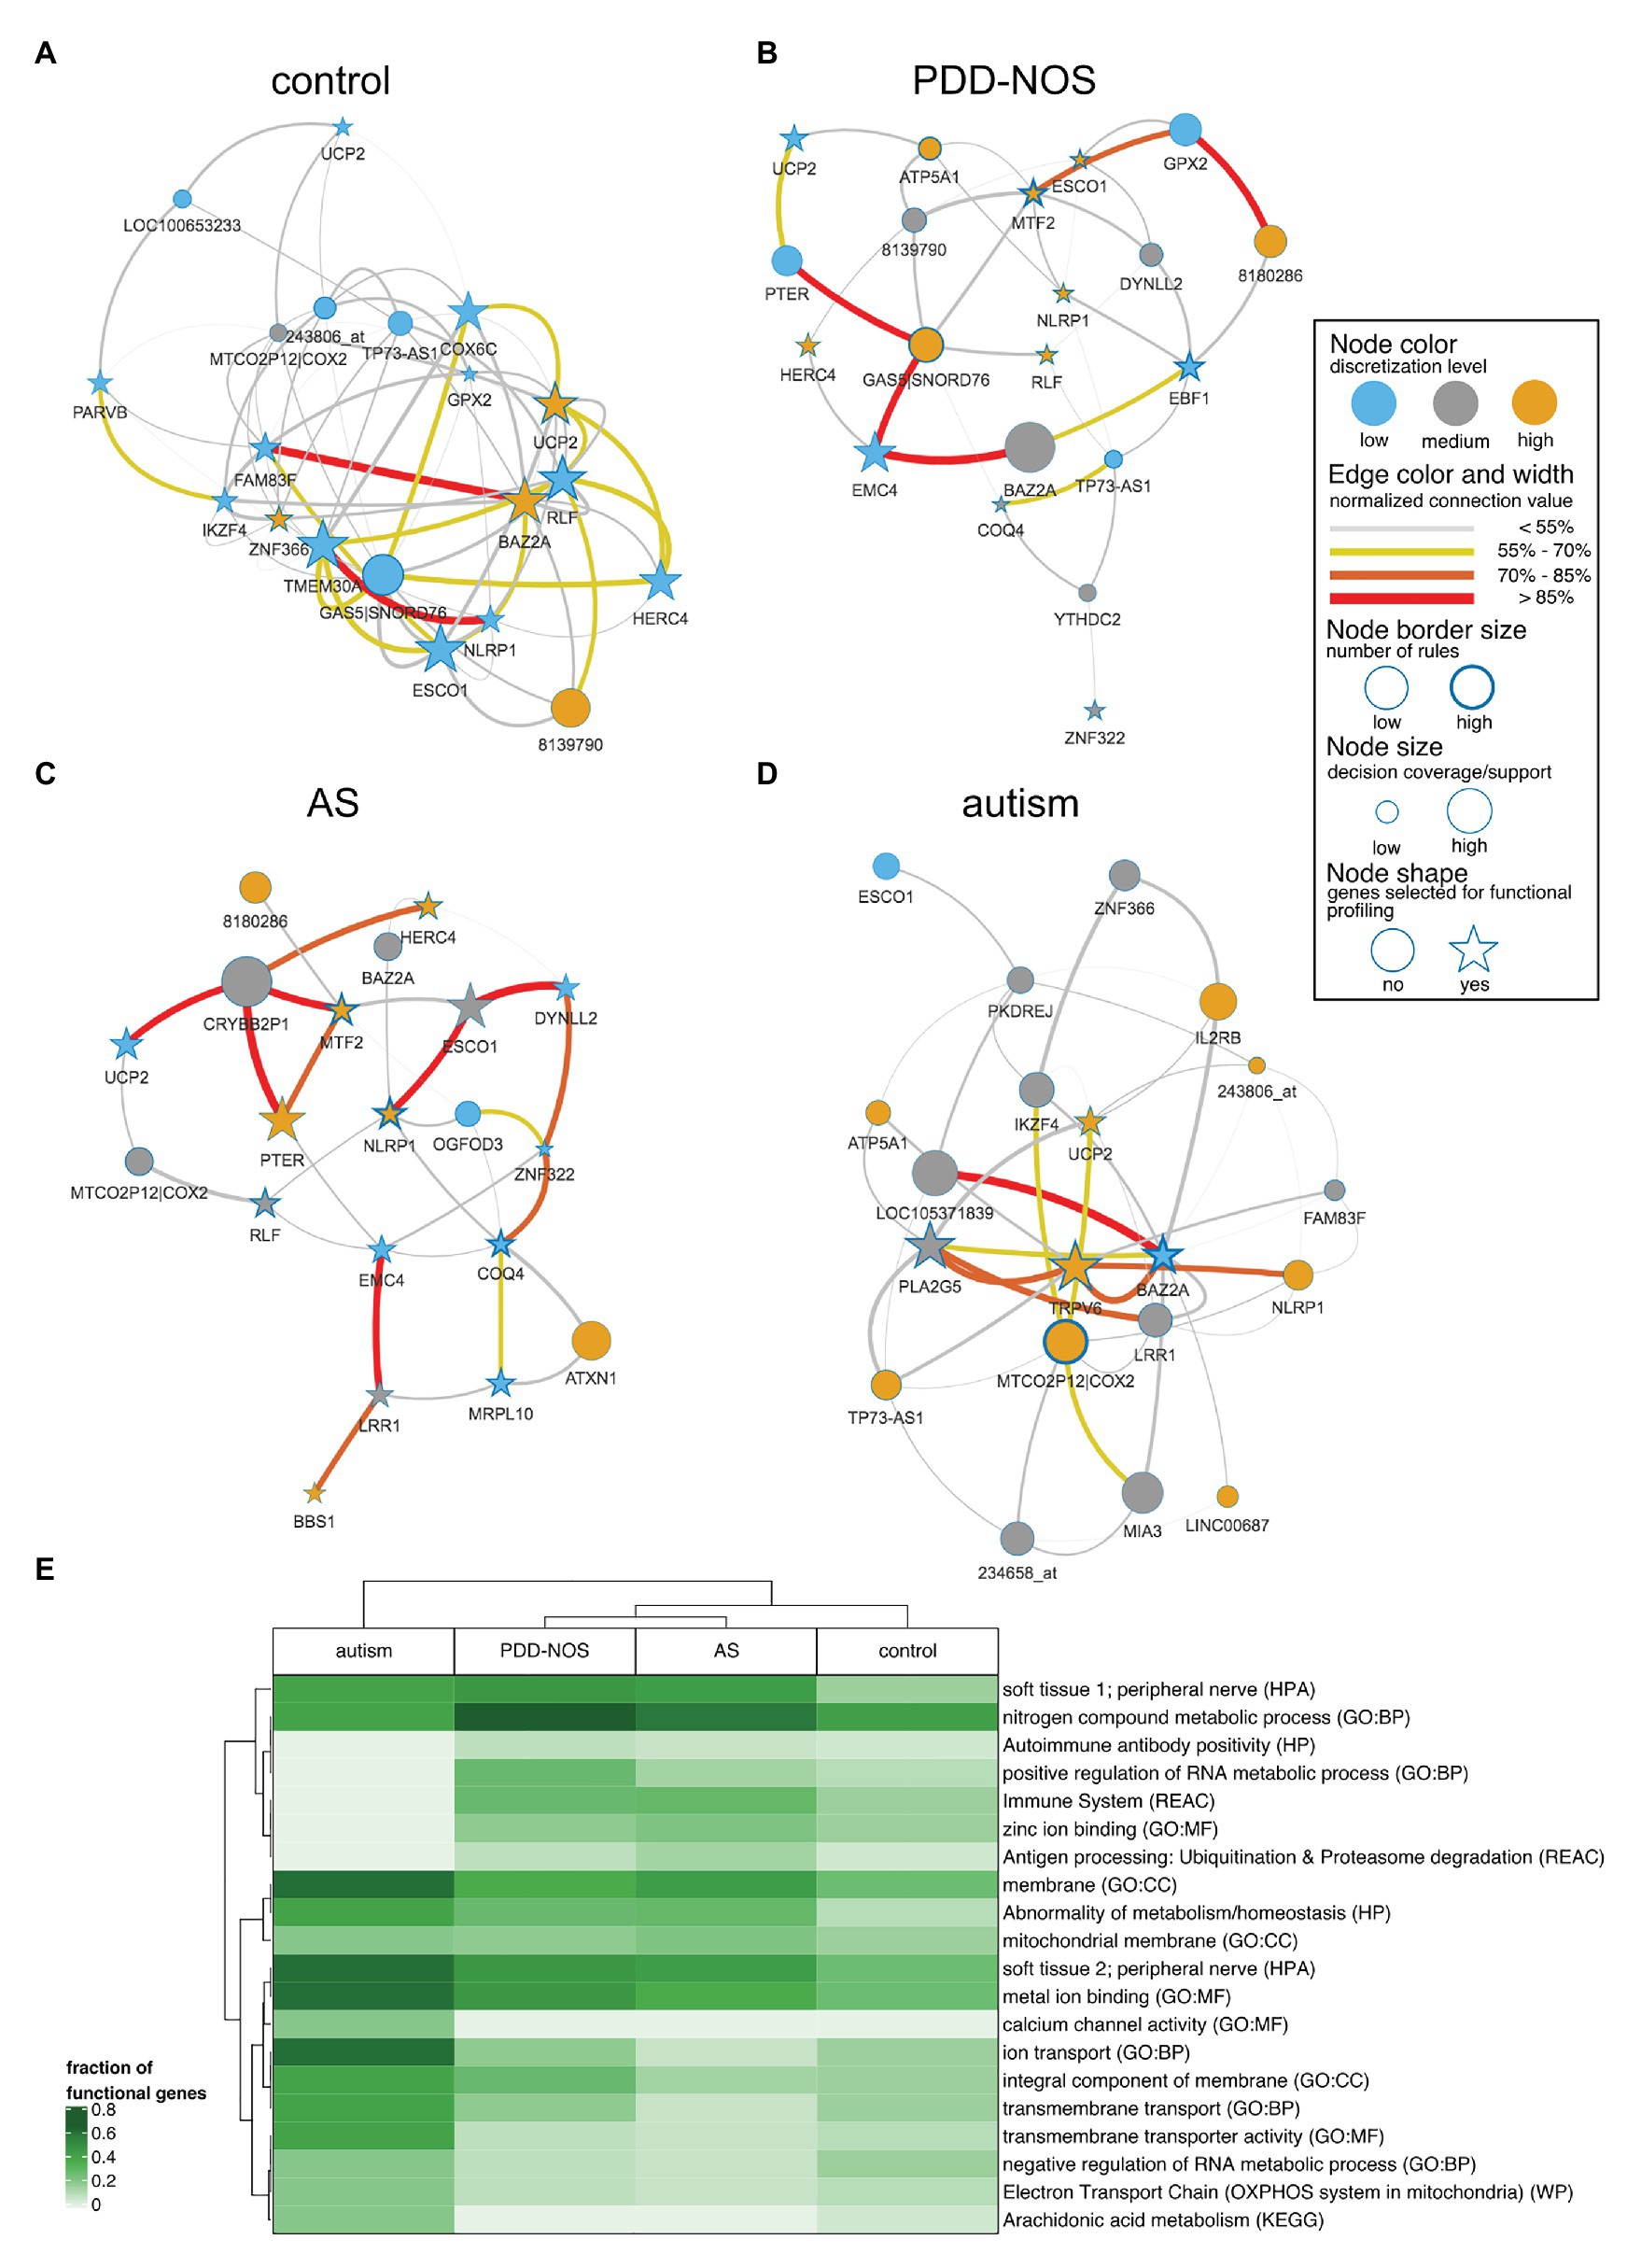
Figure 6. Network representation for particular ASD subtypes and control. To simplify the interpretation, subnetworks were pruned for the most strongly connected 20 nodes. Stars represent the strongest nodes estimated with the k-means algorithm based on node connection. A figure displays subnetworks for (A) control, (B) AS, (C), PDD-NOS, and (D) autism. (E) Heat map of the fraction of genes included in functional terms related to ASD. Terms were presented for following databases: gene ontology – biological process (GO:BP), gene ontology – cellular component (GO:CC), gene ontology – molecular function (GO:MF), Human Phenotype Ontology (HP), Human Protein Atlas (HPA), Kyoto Encyclopedia of Genes and Genomes (KEGG), Reactome (REAC) and WikiPathways (WP).
To examine all genes that discerned among subgroups, we clustered ASD subtypes by node connection values. Patterns of co-predictive mechanisms grouped ASD subtypes and confirmed our previous findings (Figure 7). The control group was well-separated from the ASD subtypes. Furthermore, PDD-NOS and AS were clustered together, which again suggested a degree of similarity between subtypes. We observed that genes (rows) were divided into four main branches that marked different gene groups, named 1, 2, 3, and 4 (Figure 7). Groups of genes in these branches could be described as follows: (1) majority of highly connected genes for AS and stronger connections shared between PDD-NOS and AS; (2) majority of highly connected and lowly expressed genes for control; (3) majority of highly connected genes for autism and lowly connected genes for control, PDD-NOS and AS; and (4) majority of highly connected genes for PDD-NOS. Specifically, genes from group 4 indicate a few shared patterns between control, PDD-NOS, and AS, while genes from group 2 show no connections for AS.
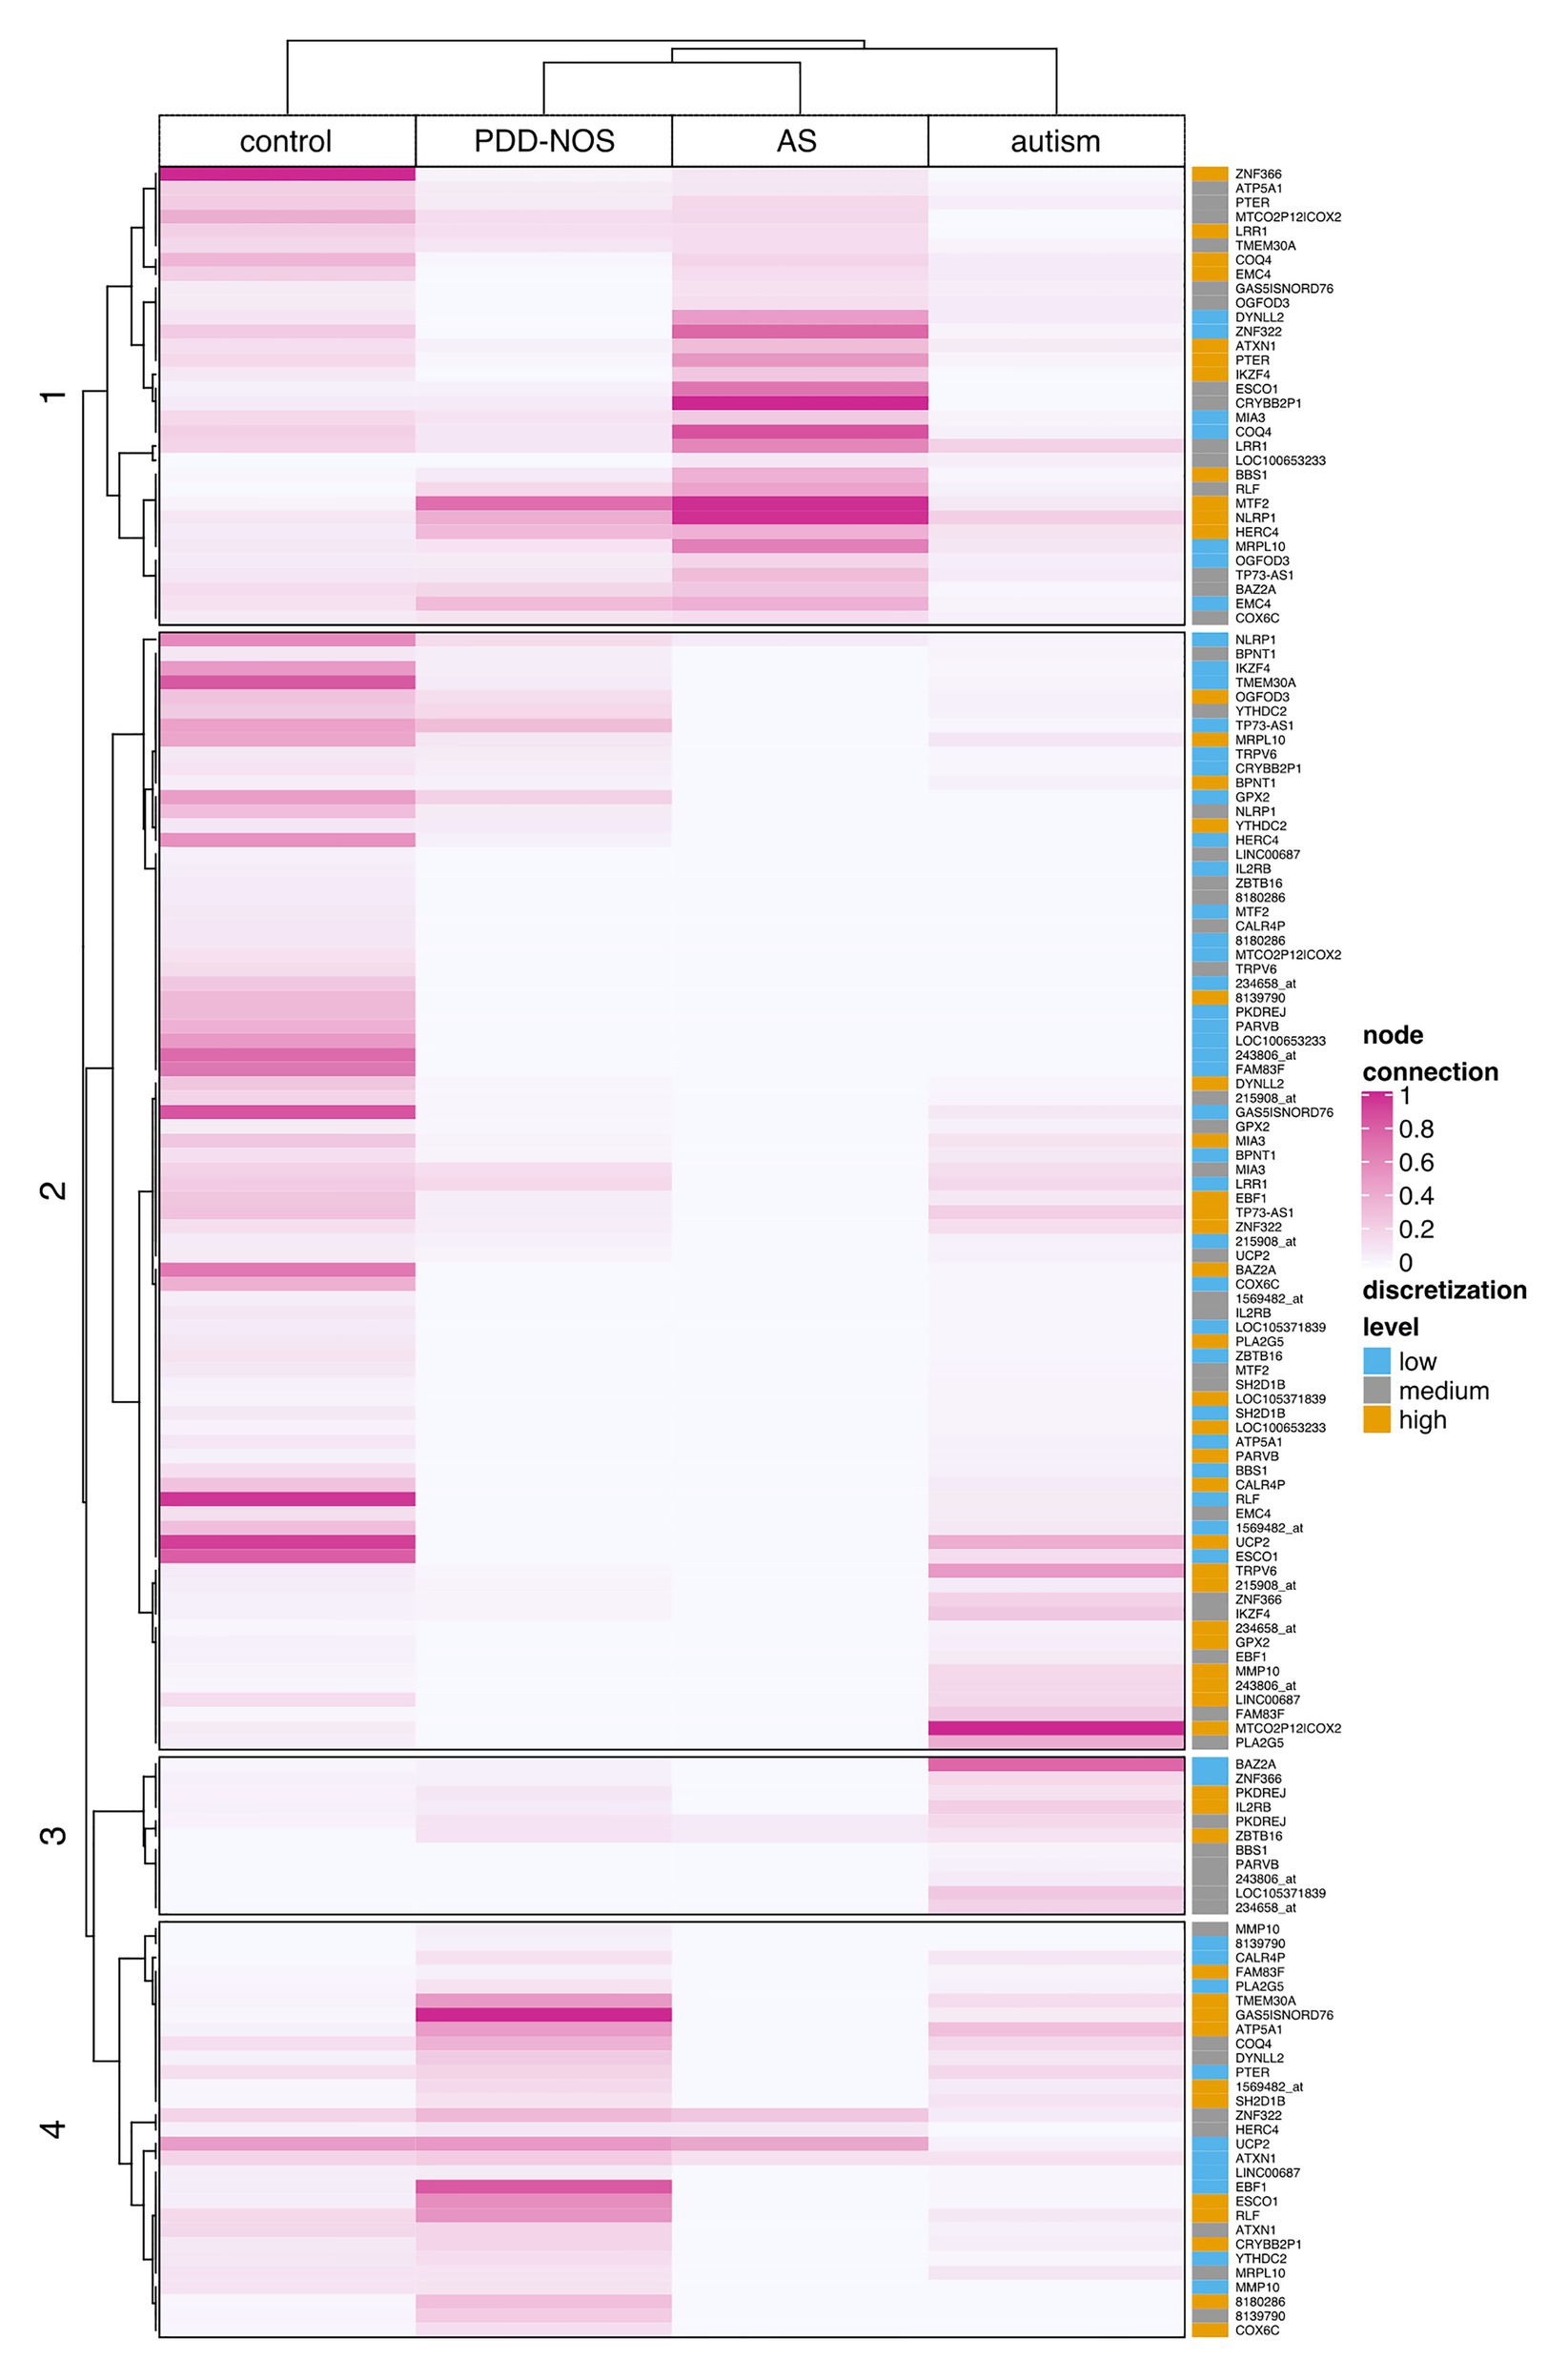
Figure 7. Clustering of the node connection values based on Kendal correlation. A heat map displays the result of clustering for particular ASD subtypes and control. Values were scaled between 0 and 1 column-wise. The rightmost panel shows discretization levels for gene expression values. A dark pink color indicates nodes with many connections (hubs), while light pink or white indicates weak connection or lack of the connection, respectively.
Functional Profiling
To evaluate functions of the genes included for IML modeling, we performed functional profiling using g:Profiler for GO terms and biological pathways. From the GO annotations for molecular functions, we observed enrichment for binding molecules, such as metals, cations, ions, DNA nucleic acids, transcription factors, and zinc (FDR-corrected p < 0.01). Additionally, enriched GO biological processes highlight transmembrane transport and metabolic processes. The GO enrichment analysis for cellular components led to general terms related to membranes and cellular structures. From the Human Protein Atlas, we observed that LRR1, ATXN1, TMEM30A, YTHDC2, EMC4, BPNT1, ZNF322, UCP2, ESCO1, and TRPV6 marked peripheral nerve as an enriched (FDR-corrected p < 0.01) term, which agrees with the hypothesis that BBB is altered and brain-related genes can be picked up in blood. The most significant term (p < 0.01) for the Reactome pathway database was the immune system and was driven by genes including NLRP1, LRR1, TMEM30A, DYNLL2, HERC4, IL2RB, ZBTB16, and SH2D1B. The enriched term agreed with previous findings supporting that the immune system is disrupted in ASD patients. A full list of terms can be found in Supplementary Table S2. To evaluate functional profiling for specific subtypes, we selected top co-predictors (cf. section Materials and Methods) and visualized a fraction of functional genes in a heat map (Figure 6E). The analysis revealed that autism is again clearly distinguishable among other subtypes (Figure 6E) and was marked by membrane/transmembrane, metal ion binding, calcium channel activity, and ion transport. Furthermore, milder subtypes of ASD and control clustered together. Accordingly, PDD-NOS and AS were clustered together (Figure 6E) and annotated by terms related to the immune system, zinc ion binding, and nitrogen metabolic process. We also observed a high fraction of genes related to the peripheral nerve for all ASD subtypes (Figure 6E).
Discussion
This study performed an IML analysis on multiple cohorts of control-case studies of ASD. Using the rule-based approach, we detected gene co-predictors that allowed to estimate dissimilarities between ASD subtypes and control. In total, we found 50 genes that were strong ASD predictors and were significantly enriched for functional pathways including the peripheral nerve and immune system. Results suggested that autism is the most severe form of ASD, while PDD-NOS is milder than autism and AS is the mildest form of ASD subtypes. Additionally, we found that PDD-NOS and AS are the most similar ASD subtypes. Furthermore, our analysis revealed a strong co-prediction mechanism between EMC4 and TMEM30 in the blood of ASD subjects.
Biomarkers that were detected in this analysis showed a satisfactory co-predictive power and distinguished ASD subtypes. One of the co-predictive mechanisms was the interaction between EMC4 and TMEM30A, which interestingly are primarily involved in phospholipid transportation (Chen et al., 2011; Lahiri et al., 2014). The results of functional profiling uncovered that EMC4 and TMEM30A are also associated with the peripheral nerve. Discovering peripheral nerve-related genes in blood samples supports the statement that BBB is altered in ASD (Fiorentino et al., 2016; Kealy et al., 2018). Interestingly, two of the main hubs, HERC4 and TMEM30A, were included in immune system pathways. These findings suggested that core ASD co-predictors are linked to responses of the immune system and its signal can be detected in blood, as it has been reported earlier (Enstrom et al., 2009; He et al., 2019). To examine nonlinear and linear associations, we compared the most highly ranked co-predictors to the co-expression profiles. In the case of EMC4-TMEM30A and MIA3-TMEM30A, a co-regulation was notable (Supplementary Figures S6, S7, S10A,B). For LRR1-RLF and COQ4-RLF, the co-expression was weak; however, local strong evidence of co-prediction may not be evident from linear co-expression analysis (Supplementary Figures S8, S9, S10C,D). To confirm that suggested co-predictors reflect true biological interactions, these shall be further tested experimentally. Moreover, we observed that these co-predictive mechanisms are supported with various ASD subtypes. However, autism was the most supportive subtype (Figure 4).
The rule including EMC4 and TMEM30A was significant in the IML models for DS1 and DS2 (FDR-corrected p < 0.05). TMEM30A encodes one of the β subunits that forms heterodimer with P4-ATPases and takes part in the process termed as lipid flipping (Chen et al., 2011). This process, which generates and maintains the phospholipid asymmetry in membranes, plays pivotal roles in membrane stability, vesicle trafficking, cell polarity and migration, and cell signaling (Yang et al., 2018). As one of the heterodimer partners of P4-ATPases, TMEM30A is required for the P4-ATPases to exit the endoplasmic reticulum (ER) and undergo transit to specific subcellular locations (Yang et al., 2018). TMEM30A has recently been demonstrated to play an essential role in the central nervous system (Yang et al., 2018). TMEM30A deficiency in the cerebellum results in protein folding and transport defects, which further induced ER stress response and apoptotic cell death. EMC4 encodes a subunit of the conserved ER membrane protein complex (EMC), which is involved in phospholipid synthesis in the ER and in transfer-synthesized phospholipid from the ER to mitochondria (Lahiri et al., 2014). Recently, EMC has been proved to be a transmembrane domain insertase that inserts various proteins into membranes (Guna et al., 2018). The various protein substrates that failed insertion properly due to malfunctioning EMC probably contribute to many of EMC’s reported phenotypes, such as ER stress, aberrant membrane protein trafficking or degradation, and altered lipid homeostasis (Guna et al., 2018). All these EMC-related phenotypes have also been proved to be tightly related to proper function of the nervous system and contributed to ASD (Tamiji and Crawford, 2010; Kitagishi et al., 2015; Kawada and Mimori, 2018). The observed increased expression of TMEM30A together with the decreased expression of EMC4 in ASD patients might contribute to the morphology changes of the cell membrane in the red blood cells of ASD subjects (Giacometti et al., 2017). Whether TMEM30A and EMC4 could be further utilized in molecular diagnosing of ASD patients warrants further investigation.
Machine learning can provide novel insights into medical and biological questions, but it is not a panacea (Rajkomar et al., 2019; Roscher et al., 2020). In this study, we focused on patterns that describe potential molecular mechanisms for ASD subtypes, rather than only on the estimation of high-quality models. Thus, in order to perform high-quality learning, we encourage employment of other techniques such as deep learning (LeCun et al., 2015). To generate highly accurate IML models, we paid special attention to data preprocessing and important classification aspects such as removing batch effects and balancing the data, removing feature selection bias, adjusting FRs thresholds, and using CV for feature selection and classification. To test our methodology, we used three datasets. However, the pipeline is not limited by the number of datasets and it would be interesting to add more transcriptomics datasets. The methodology can be used with any omics-based data that can be represented as a decision table. For example, analysis on multiple DNA methylation datasets could be also performed. Moreover, the pipeline is flexible so it can be executed using other feature selection methods and rule-based algorithms. Furthermore, recent studies have highlighted the importance of using machine learning algorithms for multi-omics data analysis (Lin and Lane, 2017; Nicora et al., 2020). Herein, we demonstrated that the legibility of rule-based models can be utilized for integrative analysis of single-type omics data. Thus, the results of our analysis established the backbone for designing a multi-omics pipeline in the future.
There are some limitations in this study. In IML, the continuous space of the data is converted into a discrete space; thus, some information is lost. However, converting the data into a discrete space is a crucial step for rough set-based modeling. On the other hand, the discrete character of the data may prevent outliers from introducing bias to the analysis. Another limitation is that our analysis focused on existing ASD subgroups. In recent years, various studies (Ali et al., 2018; Orange et al., 2018; Gao et al., 2019; Matsui et al., 2020; Sinkala et al., 2020) aimed at finding novel disease subtypes that were characterized with specific molecular patterns. Thus, it would be interesting to modify the pipeline to allow identification of novel clinical subgroups, which would be especially interesting for PDD-NOS which is a subtype of unspecified ASD cases.
Our study aims at finding local and supervised co-regulation mechanisms; therefore, it is hardly comparable with co-expression mechanisms that frequently work in unsupervised and global way. In contrast, the concept of co-expression networks, for example, weighted correlation network analysis (Langfelder and Horvath, 2008), differs largely from the co-predictive networks in various aspects. The main difference is that co-predictive networks estimate dependencies in a supervised way, i.e., for a specific group of subjects in a given decision class. Thus, the rule-based approach reveals local dependencies. Unlike the rule-based approach, co-expression algorithms investigate global dependencies in an unsupervised manner (Butte and Kohane, 1999). Another aspect is that the co-expression approach investigates all genes to find dependencies and then the threshold is estimated to select the most co-expressed genes from the network. In a co-predictive approach, only the most relevant genes are investigated and their contribution to the supervised learning process is estimated. Thus, the interpretability of co-predictive networks is specified by the IML model. Additionally, a single rule can detect two or more dependencies and its statistics are based on supervised measurements. Ultimately, co-predictive and co-expression networks may both suggest co-regulation; however, their definitions are not interchangeable and their statistics are not comparable.
In summary, we showed that rule-based IML is a powerful technique for merging datasets and estimating dissimilarities between clinical subgroups. Our findings proved that IML rule-based modeling is a powerful method for integrating datasets, finding significant co-predictive mechanisms and revealing dissimilarities between clinical subgroups. To our knowledge, no other studies have performed IML modeling with the rule-based approach for merging the omics data and applied co-predictive networks for estimating subgroups dissimilarities. Thus, we believe that our methodology and results shed light for a novel approach of interpreting classification mechanisms for bioinformatics analyses. We hope that our pipeline will support clinicians and researchers for better diagnosis and analysis of ASD and other inherited disorders in the future.
Data Availability Statement
Publicly available datasets were analyzed in this study. This data can be found at Gene Expression Omnibus: GSE18123 (https://www.ncbi.nlm.nih.gov/geo/query/acc.cgi?acc=GSE18123), GSE25507 (https://www.ncbi.nlm.nih.gov/geo/query/acc.cgi?acc=GSE25507) and GSE6575 (https://www.ncbi.nlm.nih.gov/geo/query/acc.cgi?acc=GSE6575).
Author Contributions
MG and KS contributed conception, data collection of the study, and wrote the first draft of the manuscript. MG, KS, KD, KM, LF, and JK contributed design of the study. MG performed the data analyses. GP and KD wrote sections of the manuscript. All authors contributed to critical revision and approved the final version of the manuscript for publication.
Funding
This research was supported in part by the Uppsala University, Sweden, and the ESSENCE grant to JK, MG, KS, and KD. LF is supported by the Swedish Research Council, grant 2017-01861.
Conflict of Interest
The authors declare that the research was conducted in the absence of any commercial or financial relationships that could be construed as a potential conflict of interest.
Acknowledgments
We would like to thank all the members of Jan Komorowski’s and Claes Wadelius’s research teams for their insightful and inspiring discussions. We would like to also thank the reviewers for insightful comments and suggestions.
Supplementary Material
The Supplementary Material for this article can be found online at: https://www.frontiersin.org/articles/10.3389/fgene.2021.618277/full#supplementary-material
References
Abdi, H. (2007). The Kendall rank correlation. Encyclopedia of measurement and statistics. Vol. 1. ed. N. J. Salkind (Thousand Oaks, CA: Sage Publications), 509–510. doi: 10.4135/9781412952644.n239
Ali, M. A., Zhuang, H., Ibrahim, A., Rehman, O., Huang, M., and Wu, A. (2018). A machine learning approach for the classification of kidney cancer subtypes using mirna genome data. Appl. Sci. 8:2422. doi: 10.3390/app8122422
Alter, M. D., Kharkar, R., Ramsey, K. E., Craig, D. W., Melmed, R. D., Grebe, T. A., et al. (2011). Autism and increased paternal age related changes in global levels of gene expression regulation. PLoS One 6:e16715. doi: 10.1371/journal.pone.0016715
Ansel, A., Rosenzweig, J. P., Zisman, P. D., Melamed, M., and Gesundheit, B. (2017). Variation in gene expression in autism spectrum disorders: an extensive review of transcriptomic studies. Front. Neurosci. 10:601. doi: 10.3389/fnins.2016.00601
Anyango, S. O. O. (2016). VisuNet: Visualizing Networks of feature interactions in rule-based classifiers (Uppsala University).
Borgatti, S. P., and Everett, M. G. (2006). A graph-theoretic perspective on centrality. Soc. Networks 28, 466–484. doi: 10.1016/j.socnet.2005.11.005
Bornelöv, S., Enroth, S., and Komorowski, J. (2012). “Visualization of rules in rule-based classifiers,” in Intelligent decision technologies; May 22–25, 2012; Springer. 329–338.
Butte, A. J., and Kohane, I. S. (1999). Unsupervised knowledge discovery in medical databases using relevance networks. Proc. AMIA Symp. 711–715.
Carvalho, B. S., and Irizarry, R. A. (2010). A framework for oligonucleotide microarray preprocessing. Bioinformatics 26, 2363–2367. doi: 10.1093/bioinformatics/btq431
Chand, G. B., Dwyer, D. B., Erus, G., Sotiras, A., Varol, E., Srinivasan, D., et al. (2020). Two distinct neuroanatomical subtypes of schizophrenia revealed using machine learning. Brain 143, 1027–1038. doi: 10.1093/brain/awaa025
Chen, R., Brady, E., and McIntyre, T. M. (2011). Human TMEM30a promotes uptake of antitumor and bioactive choline phospholipids into mammalian cells. J. Immunol. 186, 3215–3225. doi: 10.4049/jimmunol.1002710
Chen, X., Wang, L.-Y., and Huang, L. (2018). NDAMDA: network distance analysis for Mi RNA-disease association prediction. J. Cell. Mol. Med. 22, 2884–2895. doi: 10.1111/jcmm.13583
Clayden, J. (2020). Package ‘mmand’. Available at: https://cran.r-project.org/web/packages/mmand
Cox, A., Klein, K., Charman, T., Baird, G., Baron-Cohen, S., Swettenham, J., et al. (1999). Autism spectrum disorders at 20 and 42 months of age: stability of clinical and ADI-R diagnosis. J. Child Psychol. Psychiatry 40, 719–732.
Dong, X. L., and Rekatsinas, T. (2018). “Data integration and machine learning: a natural synergy,” in Proceedings of the 2018 international conference on management of data; June 10–15, 2018; 1645–1650.
Dramiński, M., and Koronacki, J. (2018). rmcfs: an R package for Monte Carlo feature selection and interdependency discovery. J. Stat. Softw. 85, 1–28. doi: 10.18637/jss.v085.i12
Dramiński, M., Rada-Iglesias, A., Enroth, S., Wadelius, C., Koronacki, J., and Komorowski, J. (2008). Monte Carlo feature selection for supervised classification. Bioinformatics 24, 110–117. doi: 10.1093/bioinformatics/btm486
Enstrom, A. M., Lit, L., Onore, C. E., Gregg, J. P., Hansen, R. L., Pessah, I. N., et al. (2009). Altered gene expression and function of peripheral blood natural killer cells in children with autism. Brain Behav. Immun. 23, 124–133. doi: 10.1016/j.bbi.2008.08.001
Entringer, R. C., Jackson, D. E., and Snyder, D. A. (1976). Distance in graphs. Czechoslov. Math. J. 26, 283–296.
Fajarda, O., Duarte-Pereira, S., Silva, R. M., and Oliveira, J. L. (2020). Merging microarray studies to identify a common gene expression signature to several structural heart diseases. BioData Min. 13, 1–20. doi: 10.1186/s13040-020-00217-8
Feliciano, P., Zhou, X., Astrovskaya, I., Turner, T. N., Wang, T., Brueggeman, L., et al. (2019). Exome sequencing of 457 autism families recruited online provides evidence for autism risk genes. NPJ Genom. Med. 4, 1–14. doi: 10.1038/s41525-019-0093-8
Fiorentino, M., Sapone, A., Senger, S., Camhi, S. S., Kadzielski, S. M., Buie, T. M., et al. (2016). Blood–brain barrier and intestinal epithelial barrier alterations in autism spectrum disorders. Mol. Autism. 7:49. doi: 10.1186/s13229-016-0110-z
Frye, R. E., Delatorre, R., Taylor, H., Slattery, J., Melnyk, S., Chowdhury, N., et al. (2013). Redox metabolism abnormalities in autistic children associated with mitochondrial disease. Transl. Psychiatry 3:e273. doi: 10.1038/tp.2013.51
Gao, F., Wang, W., Tan, M., Zhu, L., Zhang, Y., Fessler, E., et al. (2019). DeepCC: a novel deep learning-based framework for cancer molecular subtype classification. Oncogenesis 8, 1–12. doi: 10.1038/s41389-019-0157-8
Garbulowski, M., Diamanti, K., Smolińska, K., Baltzer, N., Stoll, P., Bornelöv, S., et al. (2020). R. ROSETTA: an interpretable machine learning framework. bioRxiv 625905. [Preprint].
Gautier, L., Cope, L., Bolstad, B. M., and Irizarry, R. A. (2004). affy—analysis of Affymetrix GeneChip data at the probe level. Bioinformatics 20, 307–315. doi: 10.1093/bioinformatics/btg405
Giacometti, G., Ferreri, C., Sansone, A., Chatgilialoglu, C., Marzetti, C., Spyratou, E., et al. (2017). High predictive values of RBC membrane-based diagnostics by biophotonics in an integrated approach for autism spectrum disorders. Sci. Rep. 7, 1–9. doi: 10.1038/s41598-017-10361-7
Gregg, J. P., Lit, L., Baron, C. A., Hertz-Picciotto, I., Walker, W., Davis, R. A., et al. (2008). Gene expression changes in children with autism. Genomics 91, 22–29. doi: 10.1016/j.ygeno.2007.09.003
Guan, J., Lin, Y., and Ji, G. (2020). Cell type-specific gene network-based analysis depicts the heterogeneity of autism spectrum disorder. Front. Cell. Neurosci. 14:59. doi: 10.3389/fncel.2020.00059
Guna, A., Volkmar, N., Christianson, J. C., and Hegde, R. S. (2018). The ER membrane protein complex is a transmembrane domain insertase. Science 359, 470–473. doi: 10.1126/science.aao3099
Hagmeyer, S., Mangus, K., Boeckers, T. M., and Grabrucker, A. M. (2015). Effects of trace metal profiles characteristic for autism on synapses in cultured neurons. Neural Plast. 2015:985083. doi: 10.1155/2015/985083
He, Y., Zhou, Y., Ma, W., and Wang, J. (2019). An integrated transcriptomic analysis of autism spectrum disorder. Sci. Rep. 9, 1–9. doi: 10.1038/s41598-019-48160-x
Kawada, K., and Mimori, S. (2018). Implication of endoplasmic reticulum stress in autism spectrum disorder. Neurochem. Res. 43, 147–152. doi: 10.1007/s11064-017-2370-1
Kealy, J., Greene, C., and Campbell, M. (2018). Blood-brain barrier regulation in psychiatric disorders. Neurosci. Lett. 726:133664. doi: 10.1016/j.neulet.2018.06.033
Kent, W. J., Sugnet, C. W., Furey, T. S., Roskin, K. M., Pringle, T. H., Zahler, A. M., et al. (2002). The human genome browser at UCSC. Genome Res. 12, 996–1006. doi: 10.1101/gr.229102
Kitagishi, Y., Minami, A., Nakanishi, A., Ogura, Y., Matsuda, S., and Haussler, D. (2015). Neuron membrane trafficking and protein kinases involved in autism and ADHD. Int. J. Mol. Sci. 16, 3095–3115. doi: 10.3390/ijms16023095
Komorowski, J., Pawlak, Z., Polkowski, L., and Skowron, A. (1999). Rough sets: A tutorial. Rough fuzzy hybridization: A new trend in decision-making, eds. S. K. Pal and A. Skowron (Singapore: Springer Verlag), 3–98.
Kong, S. W., Collins, C. D., Shimizu-Motohashi, Y., Holm, I. A., Campbell, M. G., Lee, I.-H., et al. (2012). Characteristics and predictive value of blood transcriptome signature in males with autism spectrum disorders. PLoS One 7:e49475. doi: 10.1371/journal.pone.0049475
Krawczuk, J., and Łukaszuk, T. (2016). The feature selection bias problem in relation to high-dimensional gene data. Artif. Intell. Med. 66, 63–71. doi: 10.1016/j.artmed.2015.11.001
Lagani, V., Karozou, A. D., Gomez-Cabrero, D., Silberberg, G., and Tsamardinos, I. (2016). A comparative evaluation of data-merging and meta-analysis methods for reconstructing gene-gene interactions. BMC Bioinform. 17. (Suppl 5):S194. doi: 10.1186/s12859-016-1038-1
Lahiri, S., Chao, J. T., Tavassoli, S., Wong, A. K. O., Choudhary, V., Young, B. P., et al. (2014). A conserved endoplasmic reticulum membrane protein complex (EMC) facilitates phospholipid transfer from the ER to mitochondria. PLoS Biol. 12:e1001969. doi: 10.1371/journal.pbio.1001969
Langfelder, P., and Horvath, S. (2008). WGCNA: an R package for weighted correlation network analysis. BMC Bioinform. 9:559. doi: 10.1186/1471-2105-9-559
Lawrence, M., Huber, W., Pagès, H., Aboyoun, P., Carlson, M., Gentleman, R., et al. (2013). Software for computing and annotating genomic ranges. PLoS Comput. Biol. 9:e1003118. doi: 10.1371/journal.pcbi.1003118
LeCun, Y., Bengio, Y., and Hinton, G. (2015). Deep learning. Nature 521, 436–444. doi: 10.1038/nature14539
Leek, J. T., Johnson, W. E., Parker, H. S., Jaffe, A. E., and Storey, J. D. (2012). The sva package for removing batch effects and other unwanted variation in high-throughput experiments. Bioinformatics 28, 882–883. doi: 10.1093/bioinformatics/bts034
Lenzerini, M. (2002). “Data integration: A theoretical perspective,” in Proceedings of the twenty-first ACM SIGMOD-SIGACT-SIGART symposium on Principles of database systems; June 3–5, 2002; 233–246.
Li, J., Hu, S., Zhang, K., Shi, L., Zhang, Y., Zhao, T., et al. (2019). A comparative study of the genetic components of three subcategories of autism spectrum disorder. Mol. Psychiatry 24, 1720–1731. doi: 10.1038/s41380-018-0081-x
Li, Y., Wu, F.-X., and Ngom, A. (2018). A review on machine learning principles for multi-view biological data integration. Brief. Bioinform. 19, 325–340. doi: 10.1093/bib/bbw113
Lin, E., and Lane, H.-Y. (2017). Machine learning and systems genomics approaches for multi-omics data. Biomark. Res. 5: 2. doi: 10.1186/s40364-017-0082-y
Lord, C., Elsabbagh, M., Baird, G., and Veenstra-Vanderweele, J. (2018). Autism spectrum disorder. Lancet 392, 508–520. doi: 10.1016/S0140-6736(18)31129-2
Maros, M. E., Capper, D., Jones, D. T. W., Hovestadt, V., von Deimling, A., Pfister, S. M., et al. (2020). Machine learning workflows to estimate class probabilities for precision cancer diagnostics on DNA methylation microarray data. Nat. Protoc. 15, 479–512. doi: 10.1038/s41596-019-0251-6
Marshall, C. R., Noor, A., Vincent, J. B., Lionel, A. C., Feuk, L., Skaug, J., et al. (2008). Structural variation of chromosomes in autism spectrum disorder. Am. J. Hum. Genet. 82, 477–488. doi: 10.1016/j.ajhg.2007.12.009
Matsui, Y., Matsui, Y., Maruyama, T., Nitta, M., Saito, T., Tsuzuki, S., et al. (2020). Prediction of lower-grade glioma molecular subtypes using deep learning. J. Neuro-Oncol. 146, 321–327. doi: 10.1007/s11060-019-03376-9
Nicora, G., Vitali, F., Dagliati, A., Geifman, N., and Bellazzi, R. (2020). Integrated multi-omics analyses in oncology: a review of machine learning methods and tools. Front. Oncol. 10:1030. doi: 10.3389/fonc.2020.01030
Notebaart, R. A., Teusink, B., Siezen, R. J., and Papp, B. (2008). Co-regulation of metabolic genes is better explained by flux coupling than by network distance. PLoS Comput. Biol. 4:e26. doi: 10.1371/journal.pcbi.0040026
Oh, D. H., Kim, I. B., Kim, S. H., and Ahn, D. H. (2017). Predicting autism spectrum disorder using blood-based gene expression signatures and machine learning. Clin. Psychopharmacol. Neurosci. 15:47. doi: 10.9758/cpn.2017.15.1.47
Øhrn, A., and Komorowski, J. (1997). “Rosetta--a rough set toolkit for analysis of data,” Proc. Third International Joint Conference on Information Sciences (Citeseer); March 1–5, 1997.
Orange, D. E., Orange, D. E., Agius, P., DiCarlo, E. F., Robine, N., Geiger, H., et al. (2018). Identification of three rheumatoid arthritis disease subtypes by machine learning integration of synovial histologic features and RNA sequencing data. Arthritis Rheumatol. 70, 690–701. doi: 10.1002/art.40428
Ormstad, H., Bryn, V., Saugstad, O. D., Skjeldal, O., and Maes, M. (2018). Role of the immune system in autism spectrum disorders (ASD). CNS Neurol. Disord. Drug Targets 17, 489–495. doi: 10.2174/1871527317666180706123229
Ozonoff, S., and Iosif, A.-M. (2019). Changing conceptualizations of regression: what prospective studies reveal about the onset of autism spectrum disorder. Neurosci. Biobehav. Rev. 100, 296–304. doi: 10.1016/j.neubiorev.2019.03.012
Pawlak, Z. (2002). Rough sets and intelligent data analysis. Inf. Sci. 147, 1–12. doi: 10.1016/S0020-0255(02)00197-4
Pawlak, Z., and Skowron, A. (2007). Rough sets: some extensions. Inf. Sci. 177, 28–40. doi: 10.1016/j.ins.2006.06.006
Rajkomar, A., Dean, J., and Kohane, I. (2019). Machine learning in medicine. N. Engl. J. Med. 380, 1347–1358. doi: 10.1056/NEJMra1814259
Reimand, J., Kull, M., Peterson, H., Hansen, J., and Vilo, J. (2007). g: Profiler—a web-based toolset for functional profiling of gene lists from large-scale experiments. Nucleic Acids Res. 35(suppl.2), W193–W200. doi: 10.1093/nar/gkm226
Roscher, R., Bohn, B., Duarte, M. F., and Garcke, J. (2020). Explainable machine learning for scientific insights and discoveries. IEEE Access 8, 42200–42216. doi: 10.1109/ACCESS.2020.2976199
Rossignol, D. A., and Frye, R. E. (2012). Mitochondrial dysfunction in autism spectrum disorders: a systematic review and meta-analysis. Mol. Psychiatry 17, 290–314. doi: 10.1038/mp.2010.136
Roy, M., Schmid, S., and Tredan, G. (2014). “Modeling and measuring graph similarity: The case for centrality distance,” in Proceedings of the 10th ACM international workshop on Foundations of mobile computing; August 11, 2014; 47–52.
Rudin, C., and Radin, J. (2019). Why are we using black box models in AI when we don’t need to? A lesson from an explainable AI competition. Harvard Data Sci. Rev. doi: 10.1162/99608f92.5a8a3a3d
Sharma, S. R., Gonda, X., and Tarazi, F. I. (2018). Autism spectrum disorder: classification, diagnosis and therapy. Pharmacol. Ther. 190, 91–104. doi: 10.1016/j.pharmthera.2018.05.007
Shmais, G. A. A., Al-Ayadhi, L. Y., Al-Dbass, A. M., and El-Ansary, A. K. (2012). Mechanism of nitrogen metabolism-related parameters and enzyme activities in the pathophysiology of autism. J. Neurodev. Disord. 4:4. doi: 10.1186/1866-1955-4-4
Sinkala, M., Mulder, N., and Martin, D. (2020). Machine learning and network analyses reveal disease subtypes of pancreatic cancer and their molecular characteristics. Sci. Rep. 10, 1–14. doi: 10.1038/s41598-020-58290-2
Skowron, A., and Dutta, S. (2018). Rough sets: past, present, and future. Nat. Comput. 17, 855–876. doi: 10.1038/s41598-020-58290-2
Smolinska, K. (2021). Package ‘VisuNet’: Available at: https://github.com/komorowskilab/VisuNet
Smyth, G. K. (2005). “Limma: linear models for microarray data” in Bioinformatics and computational biology solutions using R and bioconductor. eds. R. Gentleman, V. J. Carey, W. Huber, R. A. Irizarry, and S. Dudoit (New York, NY: Springer), 397–420. doi: 10.1007/0-387-29362-0_23
Tamiji, J., and Crawford, D. A. (2010). The neurobiology of lipid metabolism in autism spectrum disorders. Neurosignals 18, 98–112. doi: 10.1159/000323189
Tick, B., Bolton, P., Happé, F., Rutter, M., and Rijsdijk, F. (2016). Heritability of autism spectrum disorders: a meta-analysis of twin studies. J. Child Psychol. Psychiatry 57, 585–595. doi: 10.1111/jcpp.12499
Tsumoto, S. (2002). “Accuracy and coverage in rough set rule induction,” in International Conference on Rough Sets and Current Trends in Computing; October 14–16, 2002; (Springer), 373–380.
van Borkulo, C., Boschloo, L., Borsboom, D., Penninx, B. W. J. H., Waldorp, L. J., and Schoevers, R. A. (2015). Association of symptom network structure with the course of depression. JAMA psychiatry. 72, 1219–1226.
Walker, D. R., Thompson, A., Zwaigenbaum, L., Goldberg, J., Bryson, S. E., Mahoney, W. J., et al. (2004). Specifying PDD-NOS: a comparison of PDD-NOS, Asperger syndrome, and autism. J. Am. Acad. Child Adolesc. Psychiatry 43, 172–180. doi: 10.1097/00004583-200402000-00012
Witwer, A. N., and Lecavalier, L. (2008). Examining the validity of autism spectrum disorder subtypes. J. Autism Dev. Disord. 38, 1611–1624. doi: 10.1007/s10803-008-0541-2
Xiong, J., Chen, S., Pang, N., Deng, X., Yang, L., He, F., et al. (2019). Neurological diseases with autism spectrum disorder: role of ASD risk genes. Front. Neurosci. 13:349. doi: 10.3389/fnins.2019.00349
Yang, Y., Yang, Y., Sun, K., Liu, W., Zhang, L., Peng, K., et al. (2018). Disruption of Tmem30a results in cerebellar ataxia and degeneration of Purkinje cells. Cell Death Dis. 9, 1–13. doi: 10.1038/s41419-018-0938-6
Keywords: autism spectrum disorder, interpretable machine learning, transcriptomics, rule-based classification, autism spectrum disorder subtypes, data integration, gene expression
Citation: Garbulowski M, Smolinska K, Diamanti K, Pan G, Maqbool K, Feuk L and Komorowski J (2021) Interpretable Machine Learning Reveals Dissimilarities Between Subtypes of Autism Spectrum Disorder. Front. Genet. 12:618277. doi: 10.3389/fgene.2021.618277
Edited by:
Tze Meng Low, Carnegie Mellon University, United StatesReviewed by:
Yin Liu, University of Texas Health Science Center at Houston, United StatesYing Zhu, Fudan University, China
Copyright © 2021 Garbulowski, Smolinska, Diamanti, Pan, Maqbool, Feuk and Komorowski. This is an open-access article distributed under the terms of the Creative Commons Attribution License (CC BY). The use, distribution or reproduction in other forums is permitted, provided the original author(s) and the copyright owner(s) are credited and that the original publication in this journal is cited, in accordance with accepted academic practice. No use, distribution or reproduction is permitted which does not comply with these terms.
*Correspondence: Mateusz Garbulowski, bWF0ZXVzei5nYXJidWxvd3NraUBpY20udXUuc2U=; Jan Komorowski, amFuLmtvbW9yb3dza2lAaWNtLnV1LnNl