 Ibrahim Hossain Sajal
 Swati Biswas
- Department of Mathematical Sciences, University of Texas at Dallas, Richardson, TX, United States
In genetic association studies, the multivariate analysis of correlated phenotypes offers statistical and biological advantages compared to analyzing one phenotype at a time. The joint analysis utilizes additional information contained in the correlation and avoids multiple testing. It also provides an opportunity to investigate and understand shared genetic mechanisms of multiple phenotypes. Bivariate logistic Bayesian LASSO (LBL) was proposed earlier to detect rare haplotypes associated with two binary phenotypes or one binary and one continuous phenotype jointly. There is currently no haplotype association test available that can handle multiple continuous phenotypes. In this study, by employing the framework of bivariate LBL, we propose bivariate quantitative Bayesian LASSO (QBL) to detect rare haplotypes associated with two continuous phenotypes. Bivariate QBL removes unassociated haplotypes by regularizing the regression coefficients and utilizing a latent variable to model correlation between two phenotypes. We carry out extensive simulations to investigate the performance of bivariate QBL and compare it with that of a standard (univariate) haplotype association test, Haplo.score (applied twice to two phenotypes individually). Bivariate QBL performs better than Haplo.score in all simulations with varying degrees of power gain. We analyze Genetic Analysis Workshop 19 exome sequencing data on systolic and diastolic blood pressures and detect several rare haplotypes associated with the two phenotypes.
1 Introduction
Information on multiple phenotypes is often collected in health-related studies to obtain a bigger picture of patients’ health conditions (Teixeira-Pinto and Normand, 2009). Studies have found variants at numerous genetic loci to be associated with these phenotypes (Solovieff et al., 2013). Sometimes, a genetic variant is associated with more than one phenotype, a phenomenon known as pleiotropy. Recent studies have confirmed the widespread presence of pleiotropy in the human genome, thus showing the underlying common genetic mechanisms of numerous traits (Solovieff et al., 2013; Gratten and Visscher, 2016; Buniello et al., 2019; Watanabe et al., 2019). Investigating and understanding pleiotropy can uncover additional associations, redefine disease classification, and expand our understanding of the genetic basis of complex diseases with wide-ranging implications for healthcare (Hackinger and Zeggini, 2017; Lee et al., 2019; Lee et al., 2021).
The most common way of the testing trait–variant association is to consider one phenotypic trait at a time and test its association with genotypic variants under study. However, such a univariate statistical approach ignores valuable additional information contained in the joint distribution of the phenotypes. Even more importantly, such an approach amounts to a lost opportunity to investigate potential pleiotropy and shared genetic mechanisms. It may also result in a loss of power, especially with multiplicity adjustment, for performing multiple univariate tests. Therefore, considering a multivariate framework to model the phenotypes jointly is appealing from both biological and statistical perspectives.
Several methods have been proposed that utilize a multivariate framework to jointly model multiple correlated phenotypes, including some recent gene-based approaches (Klei et al., 2008; O’Reilly et al., 2012; Van der Sluis et al., 2015; Ray et al., 2016; Hackinger and Zeggini, 2017; Kaakinen et al., 2017; Lee et al., 2017; Ray and Basu, 2017; Deng et al., 2020). However, most of these studies consider single-nucleotide polymorphisms (SNPs) or variants (SNVs) as a genetic unit obtained from genome-wide association studies (GWAS) or next-generation sequencing (NGS) studies. Thus, when rare variants are of interest, one has to rely on SNVs obtained from NGS as rare SNPs are not usually genotyped in GWAS. Yet, most NGS data lack the adequate sample size required for multivariate analysis of correlated phenotypes. Hence, an alternative approach to multiple trait–rare variant association tests that does not necessarily rely on NGS data is warranted.
Haplotype-based tests are powerful alternatives to SNP-based genetic association tests (Bader, 2001; Wang and Lin, 2015). Haplotypes are more biologically meaningful genetic variants as compared to SNPs, which are not inherited independently. Moreover, common SNPs can make up a rare haplotype in a haplotype block, providing avenues to investigate the common disease rare variant (CDRV) hypothesis. Thus, rare variants can also be investigated using GWAS data through haplotype-based tests, allowing the use of data from much larger sample sizes than those of NGS. Several tests have been proposed to investigate the CDRV hypothesis through haplotype-based tests (Guo and Lin, 2009; Li et al., 2010; Li et al., 2011; Biswas and Lin, 2012; Lin et al., 2013), among which logistic Bayesian LASSO (LBL) is a well-studied and powerful method (Biswas and Lin, 2012; Biswas and Papachristou, 2014; Datta and Biswas, 2016; Papachristou and Biswas, 2020). LBL was extended to incorporate gene–environment interactions (Zhang et al., 2017a; Zhang et al., 2017b; Papachristou and Biswas, 2020), data generated using complex sampling designs (Zhang et al., 2017a), and family data (Wang and Lin, 2014; Datta et al., 2018). LBL was also adapted to accommodate two phenotypes, namely, bivariate LBL-2B for binary phenotypes and bivariate LBL-BC for binary and continuous phenotypes (Yuan and Biswas, 2019; Yuan and Biswas, 2021). LBL and its extensions utilize regularization to decrease the unassociated effects close to zero, which, in turn, helps the effect of an associated haplotype, especially if it is a rare one, to stand out. Bivariate LBL-2B and LBL-BC model the dependency between two phenotypes via a latent variable. Notably, there is another haplotype-based bivariate genetic association test for correlated quantitative traits; it uses the haplotype trend regression approach (Pei et al., 2009). However, it is only applicable for testing associations with common haplotypes and hence cannot be used for the CDRV hypothesis.
There is no haplotype-based association test currently available that can detect rare haplotypes associated with multiple quantitative phenotypes jointly. To fill this gap, we propose a new method, bivariate quantitative Bayesian LASSO (QBL) to jointly model two correlated continuous phenotypes. We borrow the well-studied framework of bivariate LBL and make appropriate modifications to accommodate quantitative traits. The properties of bivariate QBL are investigated using extensive simulations under various association scenarios, sample sizes, and the number of haplotypes. We also compare its performance to a standard univariate haplotype-based association test, Haplo.score (Schaid et al., 2002). Finally, we apply our proposed method to exome sequencing data from Genetic Analysis Workshop (GAW) 19. We analyze haplotype blocks in several genes of interest (as per literature) and detect rare haplotypes associated with systolic and diastolic blood pressures (SBP and DBP) jointly.
2 Methods
2.1 Likelihood formulation
We closely follow the framework of bivariate LBL-2B and LBL-BC and accordingly the notations used therein. Consider a sample of
where
2.1.1 Modeling of
A haplotype pair
2.1.2 Modeling
We model
For a given haplotype pair
where
2.2 Prior distributions
There are many choices of shrinkage priors to regularize the regression coefficients, such as LASSO, ridge, Student’s t-test, horseshoe, and spike and slab. However, their performances are rather similar when the number of predictors (haplotypes) is smaller than the sample size, as is the case in this study (Van Erp et al., 2019). We choose Bayesian LASSO to regularize the regression coefficients for its ease of implementation, following previous LBL versions. Specifically, the prior for each slope parameter in
The prior for the frequency vector f is set to be non-informative Dirichlet (1, …, 1) consisting of m values. We consider a uniform prior for d. However, given that
2.3 Posterior distributions
The joint posterior distribution of all parameters can be obtained by combining the likelihood and prior distributions as follows:
where
2.4 Association testing
We use the posterior distributions of regression coefficients for testing the association of haplotypes with the two phenotypes jointly. In particular, to test the association of the
where we set
To carry out this test, we calculated the Bayes factor (BF), which is the ratio of the posterior odds to the prior odds in favor of the alternative hypothesis. The prior odds can be found in Supplementary Appendix A2.
The posterior odds are obtained from the estimated posterior distributions. Once the BF for each haplotype in a block is obtained, their maximum BF is recorded. If this maximum BF exceeds a certain threshold, we conclude that the haplotype block is associated with at least one of the two phenotypes. We calculated the appropriate threshold following Yuan and Biswas (2019) and Yuan and Biswas (2021)—to be described in detail in the Simulation study and Application sections.
We compare the performance of bivariate QBL with a standard haplotype association test, Haplo.score (Schaid et al., 2002). We use the R package Haplo.stats to apply Haplo.score twice to the two continuous phenotypes individually (Sinnwell and Schaid, 2022).
3 Simulation study
3.1 Data generation
We generate data under two haplotype settings and five association scenarios to examine the properties of bivariate QBL and compare with Haplo.score. The two haplotype settings consist of 6 and 12 haplotypes (in a haplotype block under this study), as shown in Table 1. Following the simulation studies conducted previously for investigating univariate and bivariate LBL methods, we formed each haplotype by combining five SNPs (to allow easy comparison across various LBL versions). However, we note that, in principle, bivariate QBL can handle haplotype blocks with a larger number of SNPs at the expense of an increased computational burden (this issue is discussed in the Discussion section). Under each setting, the causal haplotype is 11011, a rare haplotype of frequency 1%. This target haplotype can be associated with one or both phenotype(s) and its effect(s), i.e., the corresponding
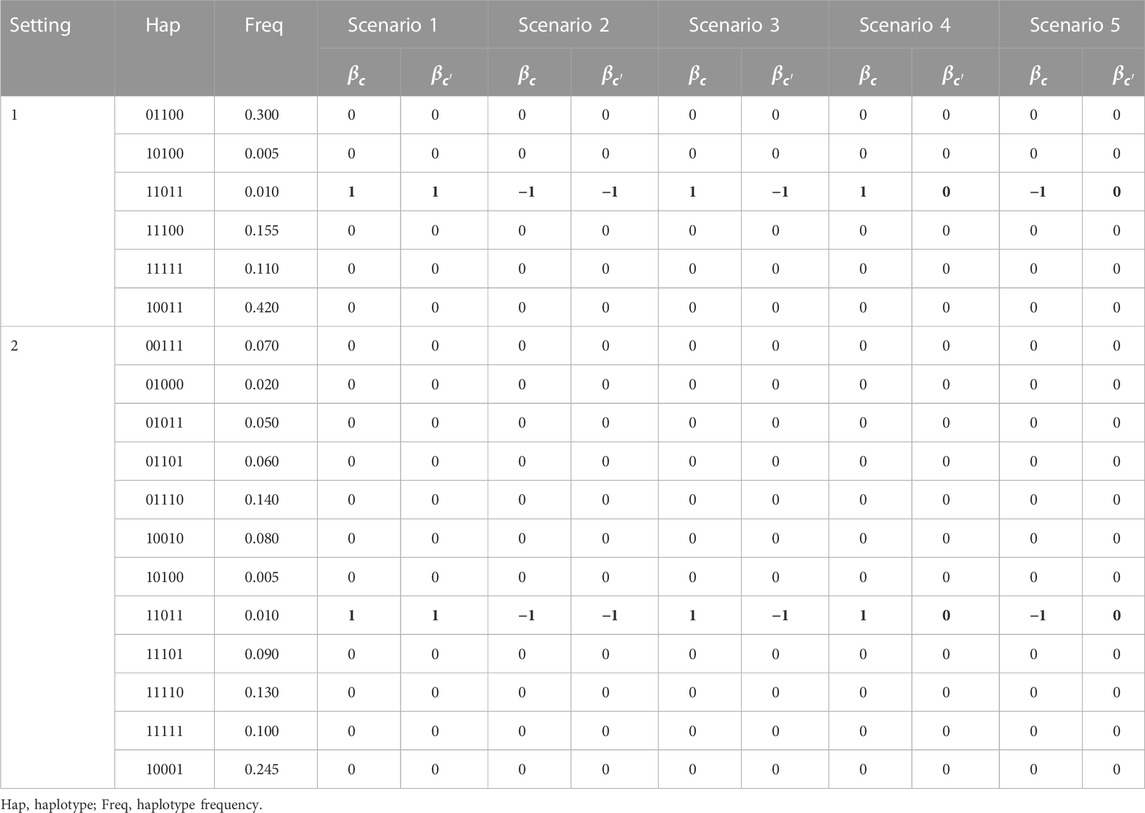
TABLE 1. Haplotype settings and association scenarios (the effect of target haplotype is shown in boldface).
To generate a haplotype pair for a subject, we use the haplotype frequencies, as shown in Table 1. Using those frequencies and assuming HWE, the probabilities of all possible haplotype pairs can be calculated. Based on those probabilities, we randomly generate one haplotype pair, say Z, for each subject in the sample, which corresponds to a design row vector
where
We generate samples of sizes 500 and 1,000. For each sample size and simulation setup, resulting from a combination of a haplotype setting, a non-null association scenario, and a fixed
3.2 Calculation of cutoffs
The cutoffs for bivariate QBL are calculated in the following way. For each sample, we obtain one BF value per haplotype. We record the maximum of those BFs. Thus, we obtain 1,000 maximum BF values from the 1,000 null scenario replicates. We sort these 1,000 values in a descending order and obtain the cutoff for a specific type I error rate to be the corresponding percentile. It is to be noted that by taking the maximum overall BF values from a haplotype block, we adjust for multiple testing within that block.
We calculate cutoffs for Haplo.score in a slightly different way because it is applied to each phenotype. For each sample, we obtain two (global) p-values from two Haplo.score analyses. Then, we record the minimum of these two p-values. Similar to bivariate QBL, we obtain 1,000 minimum p-values from the 1,000 null samples. We sort them in an ascending order and obtain the cutoff of Haplo.score for a specific type I error rate by taking the relevant bottom percentile.
Once the cutoffs are obtained in the aforementioned manner, we use these cutoffs to calculate power for the corresponding non-null setups described previously. The type I error rates and power obtained by varying the cutoffs for a p-value (for Haplo.score) and BF (bivariate QBL) are then plotted against each other to obtain receiver operating characteristic (ROC)-type curves. For Haplo.score, the power is shown for detecting associations with at least one of the two phenotypes, as well as with each phenotype separately (in scenarios 1–3, where the target haplotype is associated with both phenotypes).
3.3 Results
The results for settings 1 (six haplotypes) and 2 (12 haplotypes), sample sizes 500 and 1,000, and correlation coefficients 0.1, 0.5, and 0.9 are shown in Figures 1–12. Notably, bivariate QBL outperforms Haplo.score in all figures even though the margin of difference varies depending on the combination of association scenarios and
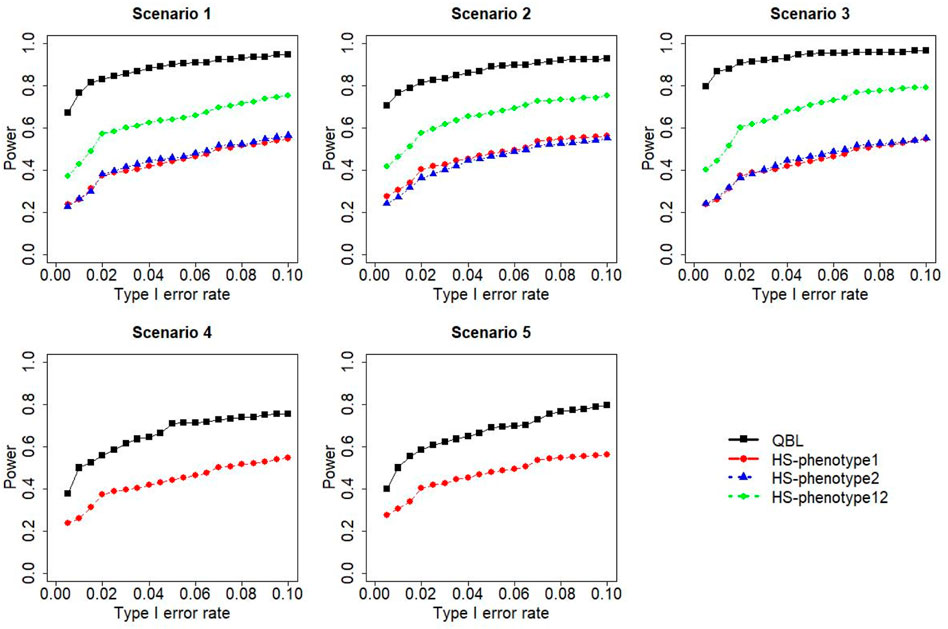
FIGURE 1. Simulation results under sample size 500, setting 1 (six haplotypes), and ρ = 0.1. Scenarios are shown in Table 1. HS, Haplo.score; phenotype12, phenotype 1 or 2.
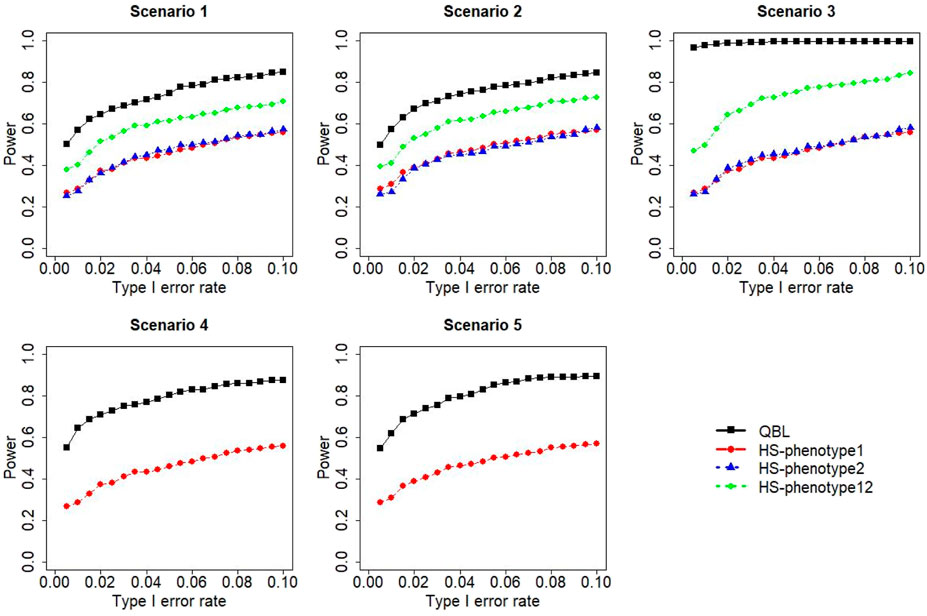
FIGURE 2. Simulation results under sample size 500, setting 1 (six haplotypes), and ρ = 0.5. Scenarios are shown in Table 1. HS, Haplo.score; phenotype12, phenotype 1 or 2.
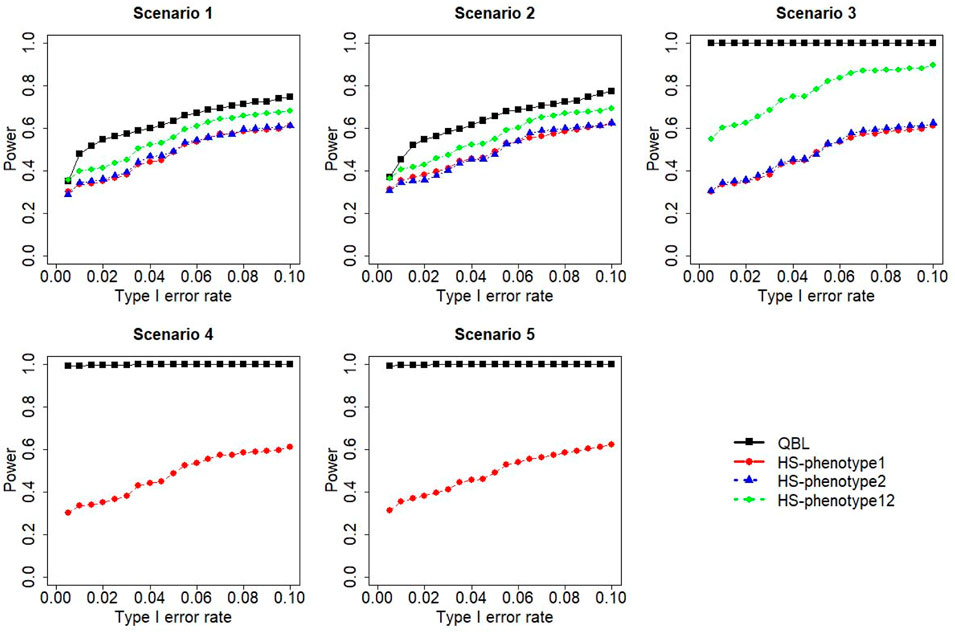
FIGURE 3. Simulation results under sample size 500, setting 1 (six haplotypes), and ρ = 0.9. Scenarios are shown in Table 1. HS, Haplo.score; phenotype12, phenotype 1 or 2.
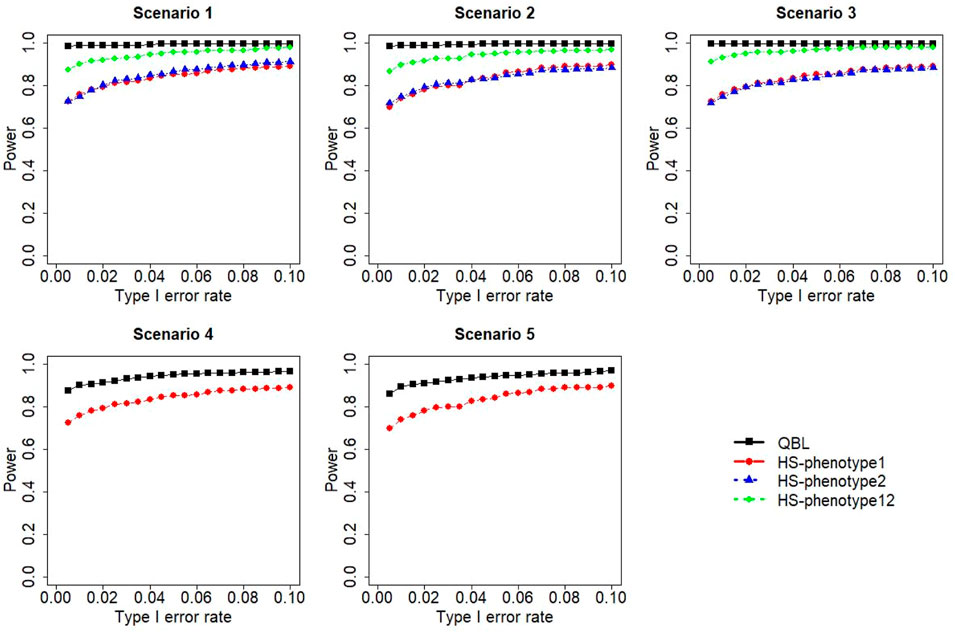
FIGURE 4. Simulation results under sample size 1,000, setting 1 (six haplotypes), and ρ = 0.1. Scenarios are shown in Table 1. HS, Haplo.score; phenotype12, phenotype 1 or 2.
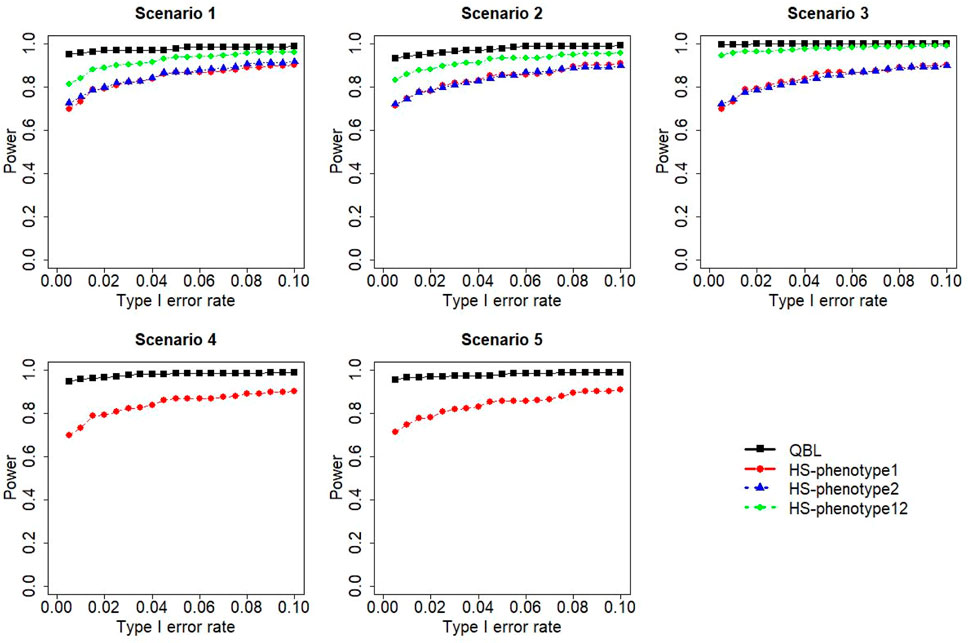
FIGURE 5. Simulation results under sample size 1,000, setting 1 (six haplotypes), and ρ = 0.5. Scenarios are shown in Table 1. HS, Haplo.score; phenotype12, phenotype 1 or 2.
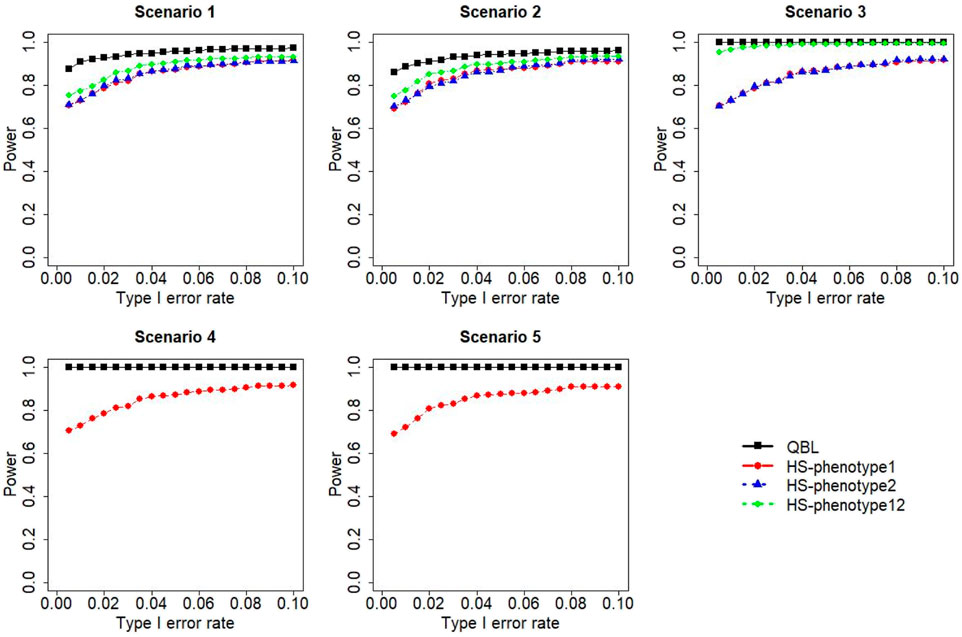
FIGURE 6. Simulation results under sample size 1,000, setting 1 (six haplotypes), and ρ = 0.9. Scenarios are shown in Table 1. HS, Haplo.score; phenotype12, phenotype 1 or 2.
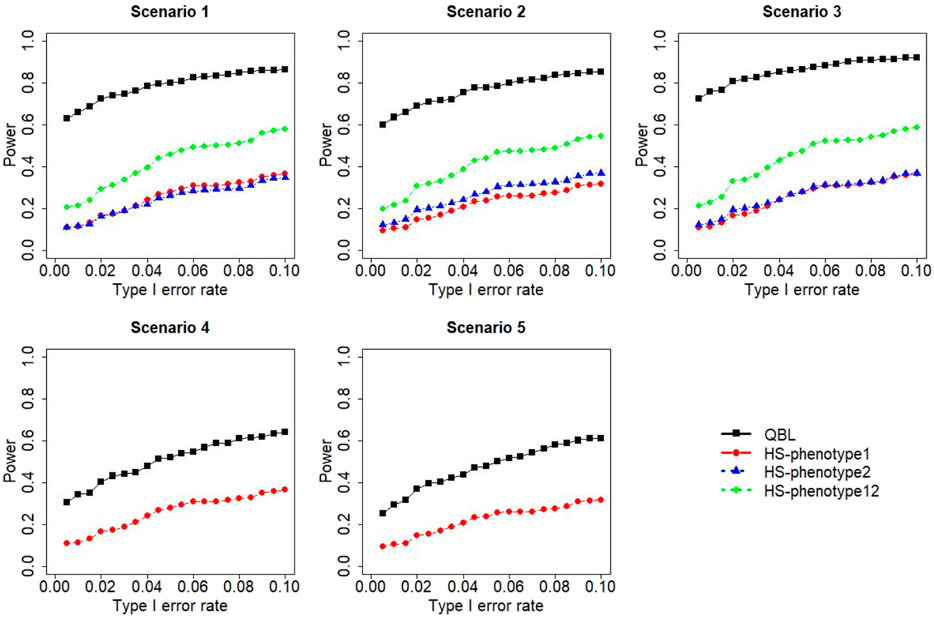
FIGURE 7. Simulation results under sample size 500, setting 2 (12 haplotypes), and ρ = 0.1. Scenarios are shown in Table 1. HS, Haplo.score; phenotype12, phenotype 1 or 2.
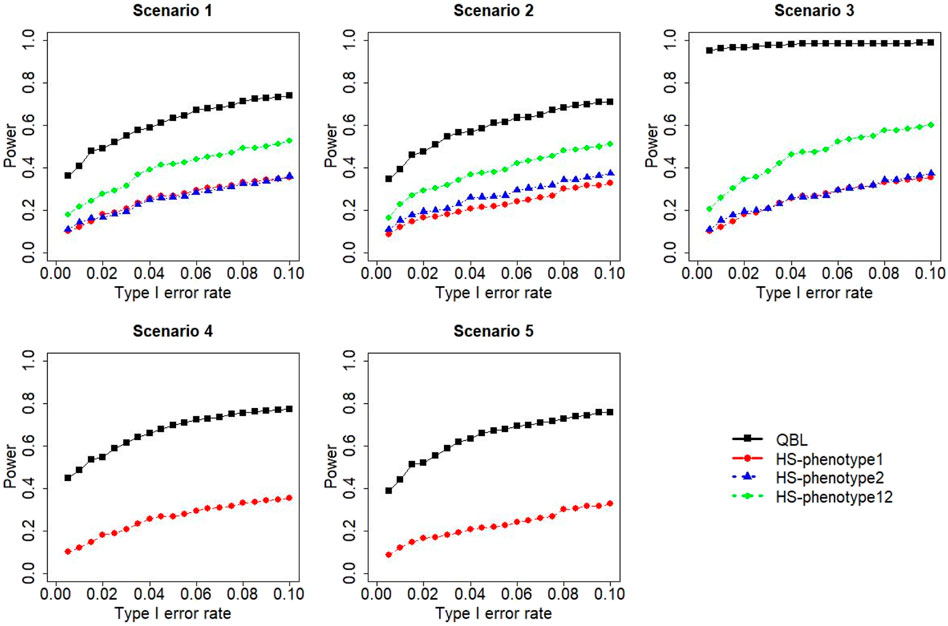
FIGURE 8. Simulation results under sample size 500, setting 2 (12 haplotypes), and ρ = 0.5. Scenarios are shown in Table 1. HS, Haplo.score; phenotype12, phenotype 1 or 2.
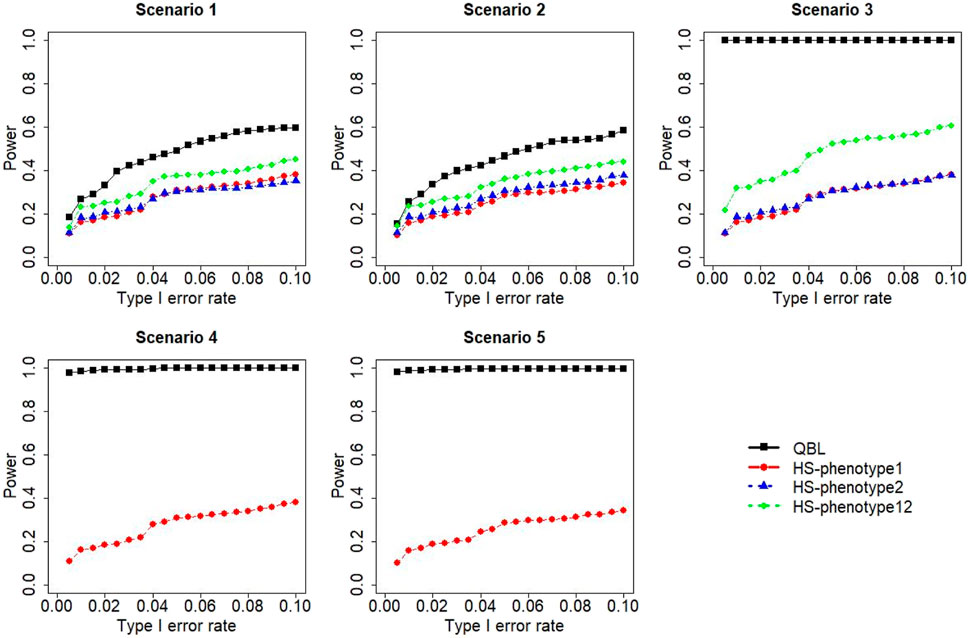
FIGURE 9. Simulation results under sample size 500, setting 2 (12 haplotypes), and ρ = 0.9. Scenarios are shown in Table 1. HS, Haplo.score; phenotype12, phenotype 1 or 2.
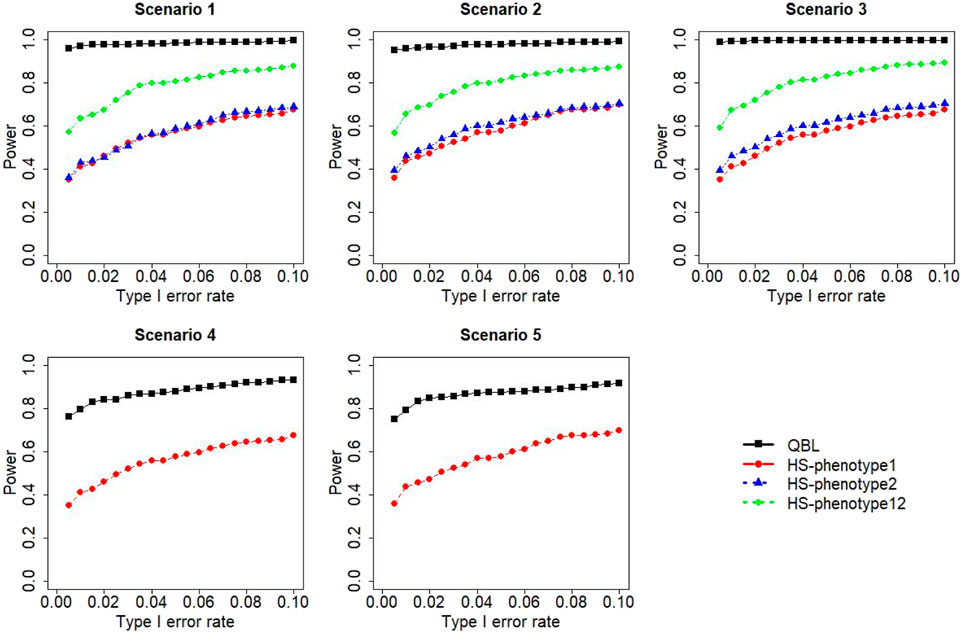
FIGURE 10. Simulation results under sample size 1,000, setting 2 (12 haplotypes), and ρ = 0.1. Scenarios are shown in Table 1. HS, Haplo.score; phenotype12: phenotype 1 or 2.
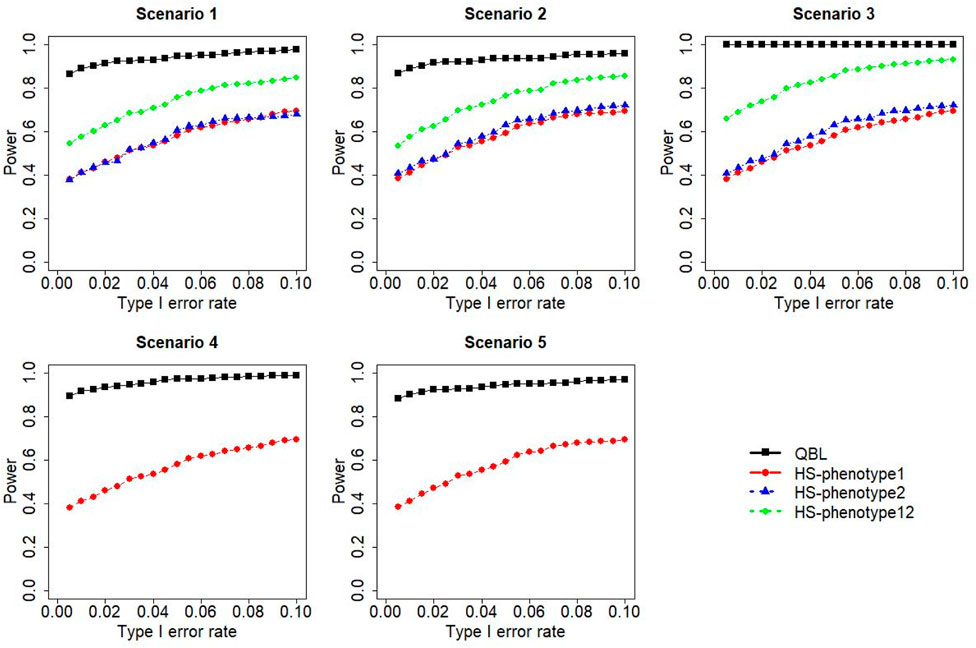
FIGURE 11. Simulation results under sample size 1,000, setting 2 (12 haplotypes), and ρ = 0.5. Scenarios are shown in Table 1. HS, Haplo.score; phenotype12: phenotype 1 or 2.
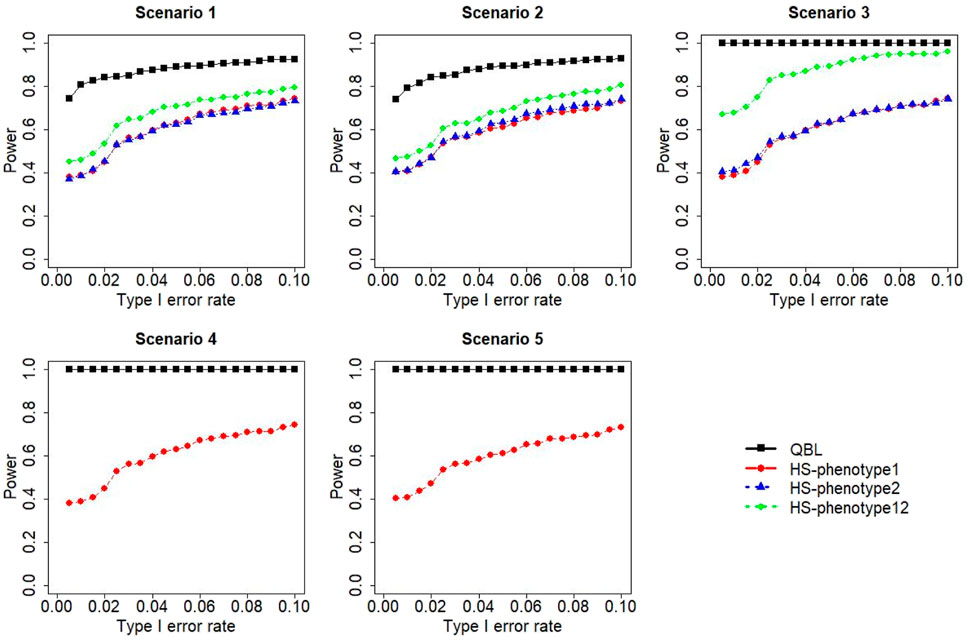
FIGURE 12. Simulation results under sample size 1,000, setting 2 (12 haplotypes), and ρ = 0.9. Scenarios are shown in Table 1. HS, Haplo.score; phenotype12, phenotype 1 or 2.
The performances of bivariate QBL and Haplo.score are the closest in the first two scenarios only when the correlation coefficient is high, i.e., 0.9, as shown in Figures 3, 6, 9. However, Figure 12 shows that even with
4 Application to GAW 19 data
We consider two continuous phenotypes, SBP and DBP, available in these data. They are moderately correlated (sample correlation coefficient = 0.55) and likely share a common genetic mechanism (Schillert and Konigorski, 2016). Typically, SBP and DBP are combined to create a single binary phenotype referred to as hypertension. More specifically, clinical thresholds are used for each BP to classify it as high blood pressure (BP); a subject is a case of hypertension if one of them is high (Datta and Biswas, 2016). However, converting a quantitative phenotype to a binary phenotype leads to a loss of information. Furthermore, combining them into one binary phenotype is a lost opportunity to investigate pleiotropy. As bivariate QBL can analyze the two continuous phenotypes jointly, it can potentially provide additional insight into these data.
There are 1,851 subjects in these data after discarding the missing values. Following Yuan and Biswas (2019), we analyze eight genes, namely, FBN3, HRH1, INMT, MAP4, SAT2, SHBG, ULK4, and ZNF280D. There are 28 SNVs in FBN3, 10 in HRH1, 18 in INMT, 18 in MAP4, 7 in SAT2, 15 in SHBG, 70 in ULK4, and 30 in ZNF280D. We combine five successive SNVs, starting from the first SNV, and create sliding haplotype blocks covering the whole gene, that is, on each gene, the first haplotype block consists of SNVs 1–5, second block consists of SNVs 2–6, and so on. For example, ULK4 has 66 haplotype blocks and MAP4 has 14 blocks.
We apply bivariate QBL to each haplotype block with both phenotypes jointly and Haplo.score to the same haplotype block twice with SBP and DBP separately. We calculate appropriate (and more general purpose) cutoffs for bivariate QBL and Haplo.score based on both simulated data and permutating the GAW19 phenotypes, as described in the following. We simulate 1,200 null samples, following setting 2 of Table 1. To match the GAW19 data more closely, we generate sample sizes of 1,851 with the correlation coefficient (between SBP and DBP) set to 0.55. As GAW19 data are exome sequence and have far more rare haplotypes than those considered in our simulations, we complement 1,200 simulated null samples by GAW19 data with permutated phenotype values. In particular, we permute the phenotypes of all subjects while retaining the pairing between SBP and DBP. Then, we combine the permuted phenotypes with genotypes in the ULK4 gene to create a null sample. We repeat this process 10 times to obtain 660 (66 × 10) blocks or null samples. Similarly, the permuted phenotypes are also combined with genotypes from MAP4 gene and repeated 10 times to provide 140 (14 × 10) blocks or null samples. The results from 800 null samples obtained using permutations are combined with those from 1,200 simulated null samples to calculate cutoffs.
The cutoffs based on 2000 null samples are calculated in the same manner, as described in the simulation study section for both bivariate QBL and Haplo.score. The cutoffs for type I error rates of 1% and 2.5% are found to be BFs of 10.91 and 4.65 for bivariate QBL and p-values of 0.0004 and 0.0058 for the Haplo.score global test, respectively.
The haplotype blocks found to be significantly associated at a type I error rate of 2.5% using at least one of the methods are shown in Table 2. Bivariate QBL found a larger number of haplotype blocks to be significant, and the findings are consistent with the literature (Datta et al., 2016; Yuan and Biswas, 2019). For example, Haplo.score could not detect the haplotype in FBN3, whose
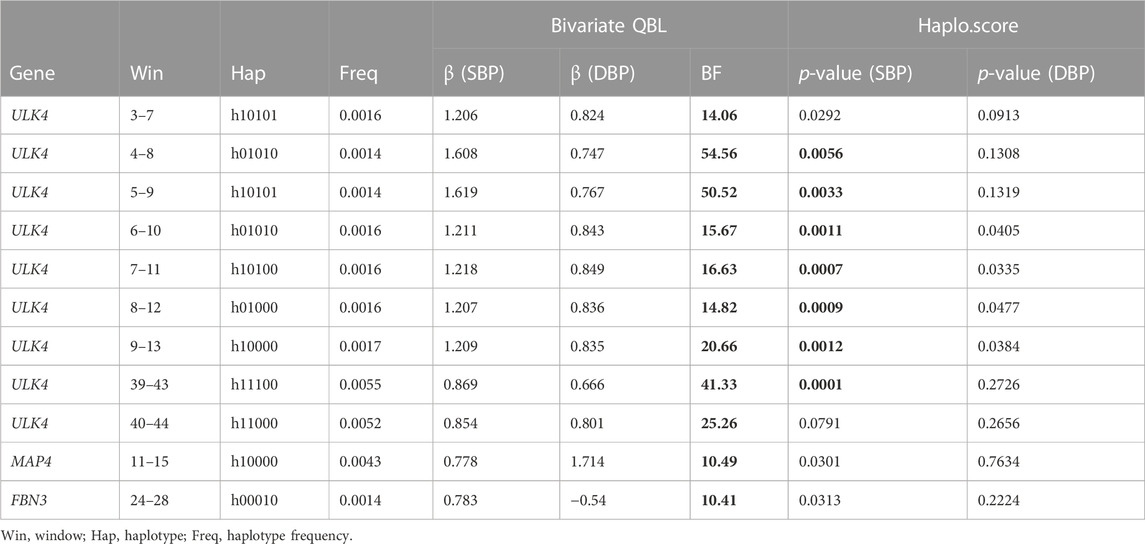
TABLE 2. Haplotype blocks significant at the 2.5% level on ULK4, MAP4, and FBN3 genes using the bivariate QBL or Haplo.score (significant BF or p-value is shown in boldface).
5 Discussion
Health-related studies usually collect multiple outcomes to better assess patients’ health, understand complex diseases/traits, and inter-connection between them, which, in turn, can help in developing effective prevention and treatment strategies. These outcomes are often correlated and may share a common genetic etiology. A commonly used practice in genetic association studies is to analyze these outcomes in a one-at-a-time manner. Such a univariate approach essentially ignores the additional information contained in the joint distribution of the outcomes. Also, it is a missed chance to investigate the possibility of pleiotropy among these outcomes. Therefore, it is statistically and biologically more beneficial to adopt a multivariate approach to analyze the outcomes jointly. Moreover, analyzing haplotypes as genetic variants is advantageous because they are biologically interpretable, and haplotype-based tests can be performed on both NGS and GWAS data. There is no haplotype-based association test available that can detect rare variants associated with multiple continuous phenotypes yet. To fill this void, we propose bivariate QBL to detect the association of two quantitative traits with rare (and common) haplotypes. Our findings from the simulation study show that the method performs better than Haplo.score in all simulation setups that we considered.
Bivariate QBL performs best when the two outcomes have high positive correlation between them, and the target haplotype has discordant effects on the two phenotypes, i.e., one positive
The performance of Haplo.score is close to that of bivariate QBL only when both outcomes are highly correlated and the target haplotype affects both outcomes in the same direction, i.e., scenarios 1 and 2. In these scenarios, the power of bivariate QBL increases as the correlation decreases. In the terminology of Galesloot et al. (2014), this means when both genetic correlation and residual correlation are of the same sign, the power of bivariate QBL decreases as the positive residual correlation increases. This phenomenon of bivariate QBL is also consistent with other multivariate genetic association tests that exist in the literature (Liu et al., 2009a; Ferreira and Purcell, 2009). In practice, it is unlikely that two phenotypes will have a very high correlation. On the other hand, we note that bivariate QBL estimates haplotype frequencies (f) jointly with the haplotype effects and other parameters. Haplotype frequencies are estimated very well by bivariate QBL, especially due to the fact that we set the starting values of f in the MCMC algorithm to its maximum likelihood estimate (obtained from the hapassoc package) (Burkett et al., 2006; Burkett et al., 2015). Thus, there is practically no impact of haplotype frequency estimation on type I error and power of the method.
In GAW19 data, SBP and DBP are moderately correlated (0.55) (Datta et al., 2016; Yuan and Biswas, 2019). As another example, Liu et al. (2009b) observed a correlation between the body mass index and bone mineral density of 0.384 and 0.257, respectively, in two datasets. When there is a weak-to-moderate correlation, bivariate QBL outperforms Haplo.score by a substantial margin. In our GAW19 data application, we detected several rare haplotype blocks to be associated with SBP and DBP jointly. Specifically, nine blocks were detected in ULK4, one in MAP4, and another in FBN3. These results agree with the findings from previous studies (Levy et al., 2009; International Consortium for Blood Pressure Genome-Wide Association Studies Ehret et al., 2011; Ehret and Caulfield, 2013). Notably, the correlation between SBP and DBP is moderate and as per our simulation results, bivariate QBL is far more powerful than Haplo.score in this situation. However, many of those haplotype blocks could not be detected by Haplo.score. This indicates that bivariate QBL can help establish multiple trait–variant associations and identify potential pleiotropic effects for further investigation.
Bivariate QBL has a limitation in terms of computing time. In our simulation study, for a sample size of 500, bivariate QBL takes 86 and 166 s to finish 2,00,000 MCMC iterations for 6 and 12 haplotypes, respectively. This is for a machine with 3.50-GHz Milan processor with 128 cores under the Linux operating system and 256 GB RAM. However, it is faster than both bivariate LBL-2B and LBL-BC. Bivariate QBL can handle a larger number of SNPs in a haplotype at the expense of an increased computational burden. The runtime of bivariate QBL almost doubles when we increase the number of SNPs in a haplotype block from 5 (86 s) to 10 (158 s). Another limitation is that the method can only accommodate two continuous phenotypes at a time. We plan to extend the framework of bivariate QBL (and LBL) to accommodate many correlated continuous and/or binary phenotypes jointly. We also plan to extend the framework to investigate gene–environment interactions and develop a computationally efficient version of this method.
Despite these limitations, we believe bivariate QBL is an important addition to the existing genetic association tests, especially because there is currently no rare haplotype association test available that can analyze two correlated continuous phenotypes jointly.
6 Software
An R package implementing the proposed bivariate QBL method will be made available at https://www.utdallas.edu/∼swati.biswas/ and https://github.com/ihsajal/ as part of the existing package LBL.
Data availability statement
The data analyzed in this study are subject to the following licenses/restrictions: The data are from Genetic Analysis Workshop 19. Participants of the workshop have access to these de-identified data for secondary analysis. Requests to access these datasets should be directed at https://bmcproc.biomedcentral.com/articles/10.1186/s12919-016-0007-z.
Author contributions
SB conceived the study. IS and SB developed the methodology. IS carried out all simulations and data analyses under the supervision of SB. Both authors participated in interpreting the results and writing the manuscript. Both authors approved the final version of the manuscript.
Funding
This work was partially supported by the National Cancer Institute under grant number R03CA171011. Genetic Analysis Workshops are supported by the NIH grant R01 GM031575. The GAW19 whole-genome sequencing data were provided by the T2D-GENES Consortium, which is supported by NIH grants U01 DK085524, U01 DK085584, U01 DK085501, U01 DK085526, and U01 DK085545.
Acknowledgments
The authors would like to thank the Texas Advanced Computing Center at the University of Texas at Austin for their allocation of computing times.
Conflict of interest
The authors declare that the research was conducted in the absence of any commercial or financial relationships that could be construed as a potential conflict of interest.
Publisher’s note
All claims expressed in this article are solely those of the authors and do not necessarily represent those of their affiliated organizations, or those of the publisher, the editors, and the reviewers. Any product that may be evaluated in this article, or claim that may be made by its manufacturer, is not guaranteed or endorsed by the publisher.
Supplementary material
The Supplementary Material for this article can be found online at: https://www.frontiersin.org/articles/10.3389/fgene.2023.1104727/full#supplementary-material
References
Bader, J. S. (2001). The relative power of SNPs and haplotype as genetic markers for association tests. Pharmacogenomics 2 (1), 11–24. doi:10.1517/14622416.2.1.11
Biswas, S., and Lin, S. (2012). Logistic Bayesian LASSO for identifying association with rare haplotypes and application to age-related macular degeneration. Biometrics 68 (2), 587–597. doi:10.1111/j.1541-0420.2011.01680.x
Biswas, S., and Papachristou, C. (2014). Evaluation of logistic Bayesian LASSO for identifying association with rare haplotypes. BMC Proc. 8, S54. doi:10.1186/1753-6561-8-S1-S54
Buniello, A., MacArthur, J. A. L., Cerezo, M., Harris, L. W., Hayhurst, J., Malangone, C., et al. (2019). The NHGRI-EBI GWAS Catalog of published genome-wide association studies, targeted arrays and summary statistics 2019. Nucleic acids Res. 47 (D1), D1005–D1012. doi:10.1093/nar/gky1120
Burkett, K., Graham, J., and McNeney, B. (2006). hapassoc: Software for likelihood inference of trait associations with SNP haplotypes and other attributes. J. Stat. Softw. 16, 1–19. doi:10.18637/jss.v016.i02
Datta, A. S., and Biswas, S. (2016). Comparison of haplotype-based statistical tests for disease association with rare and common variants. Briefings Bioinforma. 17 (4), 657–671. doi:10.1093/bib/bbv072
Datta, A. S., Lin, S., and Biswas, S. (2018). A family-based rare haplotype association method for quantitative traits. Hum. Hered. 83 (4), 175–195. doi:10.1159/000493543
Datta, A. S., Zhang, Y., Zhang, L., and Biswas, S. (2016). Association of rare haplotypes on ULK4 and MAP4 genes with hypertension. BMC Proc. 10 (7), 363–369. doi:10.1186/s12919-016-0057-2
Deng, Y., He, T., Fang, R., Li, S., Cao, H., and Cui, Y. (2020). Genome-wide gene-based multi-trait analysis. Front. Genet. 11, 437. doi:10.3389/fgene.2020.00437
International Consortium for Blood Pressure Genome-Wide Association Studies Ehret, G. B., Munroe, P. B., Rice, K. M., Bochud, M., Johnson, A. D., Pihur, V., et al. (2011). Genetic variants in novel pathways influence blood pressure and cardiovascular disease risk. Nature 478 (7367), 103–109. doi:10.1038/nature10405,
Ehret, G. B., and Caulfield, M. J. (2013). Genes for blood pressure: An opportunity to understand hypertension. Eur. heart J. 34 (13), 951–961. doi:10.1093/eurheartj/ehs455
Ferreira, M. A., and Purcell, S. M. (2009). A multivariate test of association. Bioinformatics 25 (1), 132–133. doi:10.1093/bioinformatics/btn563
Galesloot, T. E., Van Steen, K., Kiemeney, L. A., Janss, L. L., and Vermeulen, S. H. (2014). A comparison of multivariate genome-wide association methods. PloS one 9 (4), e95923. doi:10.1371/journal.pone.0095923
Gelman, A., Carlin, J., Stern, H., and Rubin, D. (2003). Bayesian data analysis. 2 ed. Florida: CRC Press.
Gratten, J., and Visscher, P. M. (2016). Genetic pleiotropy in complex traits and diseases: Implications for genomic medicine. Genome Med. 8 (1), 78. doi:10.1186/s13073-016-0332-x
Guo, W., and Lin, S. (2009). Generalized linear modeling with regularization for detecting common disease rare haplotype association. Genet. Epidemiol. 33 (4), 308–316. doi:10.1002/gepi.20382
Hackinger, S., and Zeggini, E. (2017). Statistical methods to detect pleiotropy in human complex traits. Open Biol. 7 (11), 170125. doi:10.1098/rsob.170125
Kaakinen, M., Mägi, R., Fischer, K., Heikkinen, J., Järvelin, M.-R., Morris, A. P., et al. (2017). Marv: A tool for genome-wide multi-phenotype analysis of rare variants. BMC Bioinforma. 18 (1), 110–118. doi:10.1186/s12859-017-1530-2
Klei, L., Luca, D., Devlin, B., and Roeder, K. (2008). Pleiotropy and principal components of heritability combine to increase power for association analysis. Genet. Epidemiol. 32 (1), 9–19. doi:10.1002/gepi.20257
Lee, P. H., Anttila, V., Won, H., Feng, Y.-C. A., Rosenthal, J., Zhu, Z., et al. (2019). Genomic relationships, novel loci, and pleiotropic mechanisms across eight psychiatric disorders. Cell. 179 (7), 1469–1482. doi:10.1016/j.cell.2019.11.020
Lee, P. H., Feng, Y.-C. A., and Smoller, J. W. (2021). Pleiotropy and cross-disorder genetics among psychiatric disorders. Biol. psychiatry 89 (1), 20–31. doi:10.1016/j.biopsych.2020.09.026
Lee, S., Won, S., Kim, Y. J., Kim, Y., Consortium, T. D. G., Kim, B. J., et al. (2017). Rare variant association test with multiple phenotypes. Genet. Epidemiol. 41 (3), 198–209. doi:10.1002/gepi.22021
Levy, D., Ehret, G. B., Rice, K., Verwoert, G. C., Launer, L. J., Dehghan, A., et al. (2009). Genome-wide association study of blood pressure and hypertension. Nat. Genet. 41 (6), 677–687. doi:10.1038/ng.384
Li, J., Zhang, K., and Yi, N. (2011). A Bayesian hierarchical model for detecting haplotype-haplotype and haplotype-environment interactions in genetic association studies. Hum. Hered. 71 (3), 148–160. doi:10.1159/000324841
Li, Y., Byrnes, A. E., and Li, M. (2010). To identify associations with rare variants, just WHaIT: Weighted haplotype and imputation-based tests. Am. J. Hum. Genet. 87 (5), 728–735. doi:10.1016/j.ajhg.2010.10.014
Lin, W. Y., Yi, N., Lou, X. Y., Zhi, D., Zhang, K., Gao, G., et al. (2013). Haplotype kernel association test as a powerful method to identify chromosomal regions harboring uncommon causal variants. Genet. Epidemiol. 37 (6), 560–570. doi:10.1002/gepi.21740
Liu, J., Pei, Y., Papasian, C. J., and Deng, H. W. (2009). Bivariate association analyses for the mixture of continuous and binary traits with the use of extended generalized estimating equations. Genet. Epidemiol. 33 (3), 217–227. doi:10.1002/gepi.20372
Liu, Y.-Z., Pei, Y.-F., Liu, J.-F., Yang, F., Guo, Y., Zhang, L., et al. (2009). Powerful bivariate genome-wide association analyses suggest the SOX6 gene influencing both obesity and osteoporosis phenotypes in males. PloS one 4 (8), e6827. doi:10.1371/journal.pone.0006827
O’Reilly, P. F., Hoggart, C. J., Pomyen, Y., Calboli, F. C., Elliott, P., Jarvelin, M.-R., et al. (2012). MultiPhen: Joint model of multiple phenotypes can increase discovery in GWAS. PloS one 7 (5), e34861. doi:10.1371/journal.pone.0034861
Papachristou, C., and Biswas, S. (2020). Comparison of haplotype-based tests for detecting gene–environment interactions with rare variants. Briefings Bioinforma. 21 (3), 851–862. doi:10.1093/bib/bbz031
Pei, Y. F., Zhang, L., Liu, J., and Deng, H. W. (2009). Multivariate association test using haplotype trend regression. Ann. Hum. Genet. 73 (4), 456–464. doi:10.1111/j.1469-1809.2009.00527.x
Ray, D., and Basu, S. (2017). A novel association test for multiple secondary phenotypes from a case-control GWAS. Genet. Epidemiol. 41 (5), 413–426. doi:10.1002/gepi.22045
Ray, D., Pankow, J. S., and Basu, S. (2016). Usat: A unified score-based association test for multiple phenotype-genotype analysis. Genet. Epidemiol. 40 (1), 20–34. doi:10.1002/gepi.21937
Schaid, D. J., Rowland, C. M., Tines, D. E., Jacobson, R. M., and Poland, G. A. (2002). Score tests for association between traits and haplotypes when linkage phase is ambiguous. Am. J. Hum. Genet. 70 (2), 425–434. doi:10.1086/338688
Schillert, A., and Konigorski, S. (2016). Joint analysis of multiple phenotypes: Summary of results and discussions from the genetic analysis workshop 19. BMC Genet. 17. doi:10.1186/s12863-015-0317-6
Sinnwell, J. P., and Schaid, D. J. (2022). Package ‘haplo. stats’. In (Version 1.8.9) [R Package]. Available at: https://analytictools.mayo.edu/research/haplo-stats/.
Solovieff, N., Cotsapas, C., Lee, P. H., Purcell, S. M., and Smoller, J. W. (2013). Pleiotropy in complex traits: Challenges and strategies. Nat. Rev. Genet. 14 (7), 483–495. doi:10.1038/nrg3461
Teixeira-Pinto, A., and Normand, S. L. T. (2009). Correlated bivariate continuous and binary outcomes: Issues and applications. Statistics Med. 28 (13), 1753–1773. doi:10.1002/sim.3588
Van der Sluis, S., Dolan, C. V., Li, J., Song, Y., Sham, P., Posthuma, D., et al. (2015). Mgas: A powerful tool for multivariate gene-based genome-wide association analysis. Bioinformatics 31 (7), 1007–1015. doi:10.1093/bioinformatics/btu783
Van Erp, S., Oberski, D. L., and Mulder, J. (2019). Shrinkage priors for Bayesian penalized regression. J. Math. Psychol. 89, 31–50. doi:10.1016/j.jmp.2018.12.004
Wang, M., and Lin, S. (2015). Detecting associations of rare variants with common diseases: Collapsing or haplotyping? Briefings Bioinforma. 16 (5), 759–768. doi:10.1093/bib/bbu050
Wang, M., and Lin, S. (2014). FamLBL: Detecting rare haplotype disease association based on common SNPs using case-parent triads. Bioinformatics 30 (18), 2611–2618. doi:10.1093/bioinformatics/btu347
Watanabe, K., Stringer, S., Frei, O., Umićević Mirkov, M., de Leeuw, C., Polderman, T. J., et al. (2019). A global overview of pleiotropy and genetic architecture in complex traits. Nat. Genet. 51 (9), 1339–1348. doi:10.1038/s41588-019-0481-0
Yuan, X., and Biswas, S. (2019). Bivariate logistic Bayesian LASSO for detecting rare haplotype association with two correlated phenotypes. Genet. Epidemiol. 43 (8), 996–1017. doi:10.1002/gepi.22258
Yuan, X., and Biswas, S. (2021). Detecting rare haplotype association with two correlated phenotypes of binary and continuous types. Statistics Med. 40 (8), 1877–1900. doi:10.1002/sim.8877
Zhang, Y., Hofmann, J. N., Purdue, M. P., Lin, S., and Biswas, S. (2017). Logistic Bayesian LASSO for genetic association analysis of data from complex sampling designs. J. Hum. Genet. 62 (9), 819–829. doi:10.1038/jhg.2017.43
Keywords: diastolic blood pressure (DBP), Genetic Analysis Workshop 19, Markov chain Monte Carlo (MCMC), regularization, systolic blood pressure (SBP)
Citation: Sajal IH and Biswas S (2023) Bivariate quantitative Bayesian LASSO for detecting association of rare haplotypes with two correlated continuous phenotypes. Front. Genet. 14:1104727. doi: 10.3389/fgene.2023.1104727
Received: 21 November 2022; Accepted: 21 February 2023;
Published: 09 March 2023.
Edited by:
Simon Charles Heath, Center for Genomic Regulation (CRG), SpainReviewed by:
Yuehua Cui, Michigan State University, United StatesHimel Mallick, Merck, United States
Zakariya Yahya Algamal, University of Mosul, Iraq
Copyright © 2023 Sajal and Biswas. This is an open-access article distributed under the terms of the Creative Commons Attribution License (CC BY). The use, distribution or reproduction in other forums is permitted, provided the original author(s) and the copyright owner(s) are credited and that the original publication in this journal is cited, in accordance with accepted academic practice. No use, distribution or reproduction is permitted which does not comply with these terms.
*Correspondence: Swati Biswas, c3dhdGkuYmlzd2FzQHV0ZGFsbGFzLmVkdQ==