- 1Department of Radiotherapy, Air Force Medical Center, Air Force Medical University, Beijing, China
- 2Department of Radiotherapy, Peking University Shougang Hospital, Beijing, China
Purpose: Metabolic reprogramming plays a crucial role in multiple malignant features of pancreatic cancer (PC). However, few studies have comprehensively examined metabolic features of PC and provided guidance for their treatment.
Methods: This study tried to identify metabolism-associated hub genes based on metabolic phenotypic levels through weighted gene co-expression network analysis, and constructed a risk model for PC, then verified its accuracy and explored the potential mechanisms.
Results: We screened out five metabolic hub and prognostic genes (DLX3, HMGA2, SPRR1B, MYEOV, and FAM111B) and constructed a novel metabolism-associated gene signature to predict the prognosis of PC. The model was verified efficacy and demonstrated with good performance through analysis of Kaplan-Meier plotter, receiver operating characteristic curves, comparing with reported models, application in predicting drug sensitivity and constructing a nomogram model. Correlation analysis revealed a close association between the levels of risk score and DNA damage response (DDR, correlation coefficient: 0.41, P < 0.001). Enrichment analysis indicated that risk scores were derived from multiple metabolic or proliferative pathways, providing further evidence that metabolism may mediate DDR to affect PC survival.
Conclusion: Through bioinformatics analysis, we identified five prognostic relevant differentially expressed genes highlighting the role of metabolism-associated factors in pancreatic cancer, which reveals a strong correlation ship with DDR, offering new insights into treatment strategies that combine metabolism with DDR.
1 Introduction
Pancreatic cancer (PC) is one of the most lethal malignancies, accounting for 4.8% of all cancer-related deaths globally (Bray et al., 2024). Furthermore, the incidence and mortality rate of PC are increasing simultaneously. PC is predicted to become the second leading cause of cancer-related deaths worldwide by 2030 (Rahib et al., 2014). The standard treatment regimens for PC mainly include surgery, chemotherapy, radiotherapy. Despite recent advancements in these approaches, the prognosis for PC remains poor. This poor prognosis can be attributed to its aggressive nature, which leads to late-stage diagnosis, early metastases, and therapy resistance (Singhi et al., 2019). Therefore, gaining a comprehensive understanding of the aggressive features is crucial for investigating effective therapies in PC.
The invasiveness of PC is primarily determined by biological features such as extensive dense desmoplasia, hypoperfusion, and immune suppression (Hruban et al., 2019). Accumulating evidence suggests that metabolic alterations play a vital role in these malignant features and have emerged as a key hallmark of cancer. Malignant cells can alter their material and energy metabolism patterns to meet the requirements for survival and rapid proliferation (Hönigova et al., 2022); this process is known as metabolic reprogramming. The main metabolic pathways currently being studied include “Warburg effect”, “Glutamine addiction” and lipid metabolism (Chang et al., 2022; Xu et al., 2020; Man et al., 2020). The tricarboxylic acid (TCA) cycle and nucleic acid metabolism are intermediate and ultimate processes that link different metabolic patterns. Metabolic pathways determine cellular plasticity of changing and adapting to different microenvironments (Uddin et al., 2024). DNA damage repair (DDR) serves as maintaining genome integrity and is closely associated with metabolism (Li et al., 2022). Targeting nucleotide or amino acid metabolism can enhance the sensitivities of anti-tumor therapy by restricting DDR response (Falcone et al., 2022; Helleday and Rudd, 2022; Fu et al., 2019). A range of metabolic inhibitors has been developed and demonstrated promising anti-tumor potential in preclinical studies. For instance, the glycolysis inhibitor Lonidamine and the amino acid transporter inhibitor JHP 203 can synergistically enhance the therapeutic effect when combined with chemotherapy and radiotherapy, respectively (Tufail et al., 2024). However, challenges such as metabolic plasticity and the need for combination therapies persist, highlighting the urgency for continued research in this dynamic field.
However, the metabolism of PC is complex and interacts. Bioinformatics research provides an efficient means of interpreting clinical outcomes from metabolic mechanisms. A study attempted to demonstrate the complex plasticity mechanism of PC through a comprehensive analysis of genomics, transcriptomics, and proteomics, demonstrating the complex plasticity mechanism of PC, provides a case for us (Cancer Genome Atlas Research NetworkCancer Ge nome Atlas Research Network, 2017). Recently, several studies have reported the construction of metabolism-related models for PC, including from hypoxia, immunity, neuroendocrine, lactate, or lipid metabolism, suggested a link between metabolism and survival (Ma et al., 2021; Ye et al., 2021; Huang et al., 2023; Zhang et al., 2023; Yang et al., 2024; Peng et al., 2024). However, the methods used to screen genes for constructing these models only considered molecular-level factors and did not incorporate individual metabolic functional phenotypes.
This study aimed to apply weighted gene coexpression network analysis (WGCNA) to identify metabolism-associated hub genes and construct a metabolic risk model for PC and explore its potential mechanisms. Our study findings will enhance our understanding of the metabolic features of PC and facilitate the exploration of new therapeutic strategies combining with metabolism.
2 Materials and methods
2.1 Data collection and processing
The training and investigation dataset was obtained from the Cancer Genome Atlas (TCGA) database (https://portal.gdc.cancer.gov). Two additional datasets were obtained from the Gene Expression Omnibus (GEO; GSE62452) (https://www.ncbi.nlm.nih.gov/gds/) and International Cancer Genome Consortium (ICGC; https://icgc.org/) databases that served as external validation sets (Figure 1). All three datasets are publicly available and accessible online. The reasons for selecting these datasets for study were that they originated from PC patients, encompassed survival and transcriptional information, and boasted a sufficient sample size. After downloading the data, the following three steps were performed during the initial data processing: Patients with missing or zero overall survival (OS) were excluded, the transcriptome data from TCGA and ICGC databases were unified as log2 (x+1), and gene IDs were converted to gene symbols.
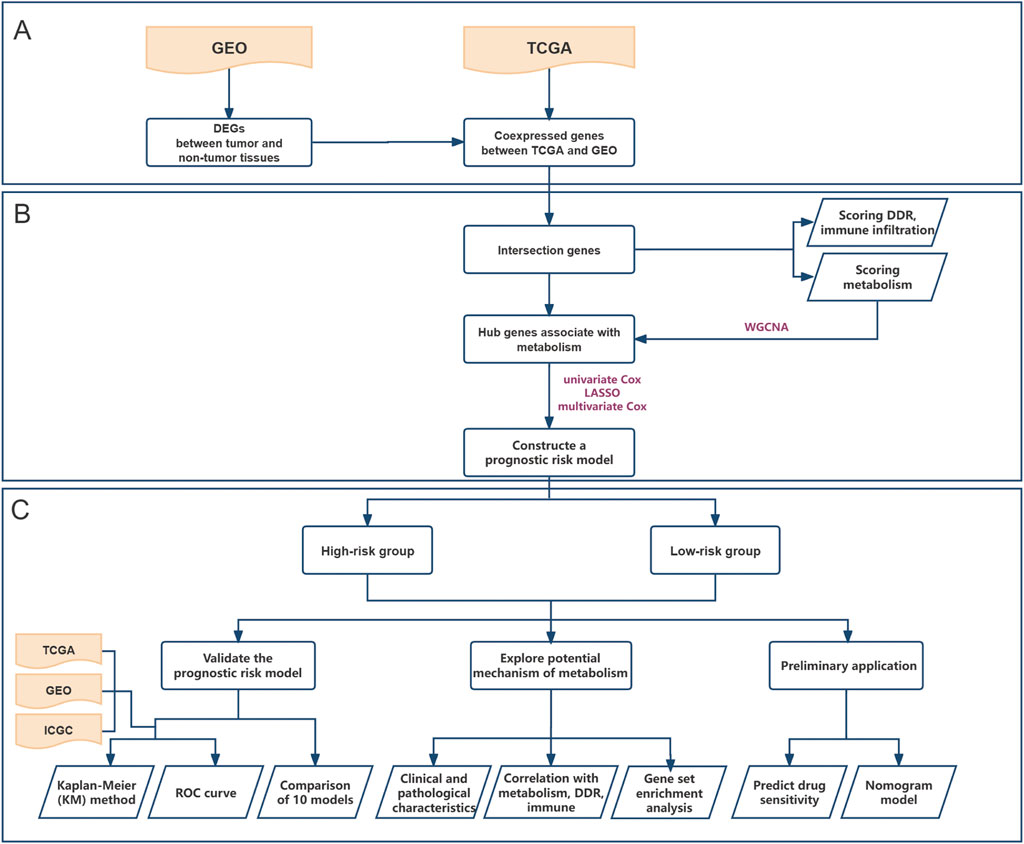
Figure 1. Flowchart depicting the whole study. (A) Screen for differentially expressed genes in pancreatic cancer based on GEO cohort and select a gene set that is co-expressed with TCGA; (B) Identify a metabolism-associated hub genes through WGCNA and construct a prognostic risk model; (C) Validate the model’s performance, explore underlying mechanisms, and further evaluate its application based on drug sensitivity analysis and clinical nomogram model.
2.2 Scoring metabolism, DDR, and immune infiltration features
To assess the activity of different phenotypes, co-expressed genes were initially selected both in TCGA and GEO. To eliminate non-significant genes, DEGs between tumor and non-tumor tissues were then screened using the “limma” package in GEO, with a false discovery rate (FDR) < 0.05 as the cutoff. The intersection gene dataset, both in co-expressed genes and DEGs, was taken for subsequent analysis. The activities of different metabolic pathways and DDR for each sample were scored using the single-sample gene set enrichment of the R package GSVA in TCGA, utilizing the expression data of the intersection gene dataset. The metabolic signature gene set, which includes seven metabolic pathways (lipid, carbohydrate, amino acid, integrated energy, nucleotide, vitamin cofactor, and TCA), was previously reported (Sung and Cheong, 2021). In total, 276 DDR gene sets were obtained from previous studies and used for the knowledge-based curation of DDR pathways (Li et al., 2022). Immune infiltration analysis included the immune cell profiling (ICI) and estimate algorithm with the intersection gene dataset. ICI involved 22 types of immune cells using the “CIBERSORT” package, while the estimate algorithm included four types of scoring for immune, stromal, estimate, and tumor purity using the “ESTIMATE” package (Liu et al., 2022).
2.3 Identification of hub genes associated with metabolic phenotypic features using WGCNA
WGCNA was used to identify potential hub genes that share similar functions by constructing a co-expression network analysis and mining modules (Su et al., 2021). We applied WGCNA to define gene modules associated with metabolic phenotypic features derived from the intersection gene dataset in TCGA. Specifically, samples with outliers were removed first, and the function power estimate was used to define the optimal soft threshold. The subsequent steps and parameters of WGCNA included constructing correlation networks, setting the maximun number of gene modules to 30, and calculating the dissimilarity of the module eigengenes. The similarity cutoff was set to 0.75, and the modules with the top three high correlation coefficients were considered most relevant to metabolic features. These modules were merged for downstream analysis (Xiao et al., 2022).
2.4 Construction and performance analysis of prognostic risk model
For the training set, we used patient data from TCGA, whereas the validation sets consisted of data from GEO and ICGC. Univariate Cox regression using the “survival” package was employed to preliminarily filter the genes linked to the prognosis from the aforementioned metabolism-associated hub genes, with a p-value <0.001. Subsequently, LASSO regression with the “glmnet” package was used to address overfitting among the survival-related hub genes. Multivariate Cox stepwise regression was applied using the “survival” package to construct the prognostic model with the highest discriminatory ability for predicting OS. The equation for the risk score, which predicts prognosis based on metabolic hub genes, is shown in Figure 3A. The acquired formula for calculating the risk score was as follows: Risk score = (expression of DLX3 × 0.114) + (expression of HMGA2 × 0.144) + (expression of SPRR1B × 0.071) + (expression of MYEOV × 0.104) + (expression of FAM111B × 0.173).
Each patient was assigned a risk score and then categorized into high- and low-risk groups based on the median value independently within each cohort. To validate the accuracy of the model, survival curves were generated using the Kaplan–Meier (KM) method for the two groups separately in three cohorts. Additionally, the receiver operating characteristic (ROC) curve and area under the curve (AUC) values were calculated using the “survival ROC” package to evaluate the time-dependent predictive ability of the model. Furthermore, we compared our model with nine reported models from the literature in terms of their ability to predict 1-year survival, using ROC and AUC analysis (Ma et al., 2021; Ye et al., 2021; Huang et al., 2023; Zhang et al., 2023; Ren et al., 2021; Liu et al., 2021; Yan et al., 2020; Yan et al., 2022; Zhou et al., 2019).
2.5 Characteristics between the two risk groups
We compared the differences between the two groups in terms of available characteristics, including age, stage, tumor site, therapies, alcohol history, and the expression of the five indicative genes in TCGA. The comparison results were presented using boxplots or heatmaps generated by the “ggpubr” and “Complex Heatmap” packages.
2.6 Correlation analysis between risk score and phenotypic features
To explore the underlying mechanism of the risk score, we analyzed the association between risk scores and phenotypic features, including metabolism, DDR, and immune infiltration. This analysis involved comparing the differences in seven metabolic pathways, 22 immune cell infiltrations, and four types of estimates between the two different risk groups. Additionally, we analyzed the correlation between significantly different phenotypic features. The results were visualized using violin charts, beeswarm plots, or correlation heatmaps generated by the “ggplot2,” “ggbeeswarm,” and “corrplot” packages.
2.7 Gene set enrichment analysis
To further investigate the implied mechanisms of the risk score, gene set enrichment analysis (GSEA) was performed on DEGs between two risk groups. The DEGs were initially screened using the “DESeq2” package, with a |log2FC| > 1 and an adjusted FDR <0.05 as the cutoffs. The direction of regulation (up or down) for the DEGs was plotted using the “ggplot2” package. DEGs with an adjusted FDR <0.05 were then used for GSEA. Gene Ontology (GO) enrichment analysis, Kyoto Encyclopedia of Genes and Genomes (KEGG) pathway analysis, and GSEA were performed using the “Clusterprofiler” package with reference to “org.Hs.eg.db” (Carlson M, 2019. org.Hs.eg.db: Genome wide annotation for Human. R package version 3.8.2.). An adjusted p-value <0.05 was selected as the cutoff criteria for considering significant results in GO terms, KEGG pathway, and GSEA.
2.8 Drug sensitivity analysis and validation
The drug sensitivity of patients was predicted using the half-maximal inhibitory (IC50) calculated with the “pRRophetic” package. We selected several recommended or associated drugs for drug sensitivity analysis based on the clinical guidelines of PC. The difference between the two groups was assessed and displayed using columnar beeswarm plots created with the “ggbeeswarm” and “customLayout” packages. Additionally, we downloaded data on patient response to gemcitabine in TCGA using the “TCGAbiolinks” package, as reported by Nicolle, and validated it between the two groups (Nicolle et al., 2021).
2.9 Construction of a clinical nomogram
To demonstrate the practical application, a clinical nomogram model combining the risk score and clinical parameters was constructed using the “survival” and “RMS” packages. Owing to the large number of missing values for clinical parameters in TCGA, only variables (age, stage, radiotherapy, and pharmatherapy) with a sufficient number of samples and high relevance to survival were included. The nomogram was used to evaluate the 1-, 2-, and 3-year survival rates of patients in TCGA. Calibration curves and the C-index were used to assess the consistency between the predicted and actual survival rates.
2.10 Statistical analysis
Statistical analysis was performed using GraphPad Prism (version 9.0.0 for Windows) and R software (version 4.2.1 for Windows). In GraphPad Prism, t-tests or Wilcoxon signed-rank tests were used to compare measured differences between groups, and the chi-square test was used to analyze associations between categorical variables. Other statistical analyses were primarily conducted using R software, as described earlier, including scoring each feature, identifying DEGs and hub genes, GSEA, calculating drug sensitivity, and constructing the nomogram. The correlation coefficient between phenotypic features was evaluated using Pearson’s correlation. Statistical significance was set at P < 0.05.
3 Results
3.1 Identification of metabolism-associated hub genes in PC
We obtained transcriptome and clinical data from 178 PC patients (via TCGA) in this study for constructing models and exploring mechanisms. Furthermore, we obtained an additional 159 PC cases (69 in GSE62452 and 90 in ICGC-PAAD-US) for validating the risk model. To screen DEGs in GSE62452, we collected 61 non-tumor tissues from PC patients. We identified 10,031 genes that existed in both TCGA and GSE62452, and 6,747 genes were screened as DEGs in GSE62452. For further analysis, we obtained 5,872 genes as the intersection gene dataset, and their transcriptome data were used to score metabolism, DDR, and ICI activities for each patient.
The function power analysis showed that a soft threshold of 14 was optimal for ensuring a scale-free network in the WGCNA (Figure 2A). By merging similarity modules and applying a cut-line, we identified a total of 13 modules, with each module assigned a color using the dynamic tree cut method (Figure 2C). The coexpression network was visualized in a network heatmap plot (Figure 2B). Each color module represented a gene set with closely associated expressions. The gray module represented genes that were not assigned to any other cluster. The other 12 modules were plotted in a heatmap to evaluate the association between each module and different metabolic pathways (Figure 2D). Based on the criteria (|Cor| > 0.65), yellow, black, and green-yellow modules, which collectively included 536 genes, were selected for further analysis.
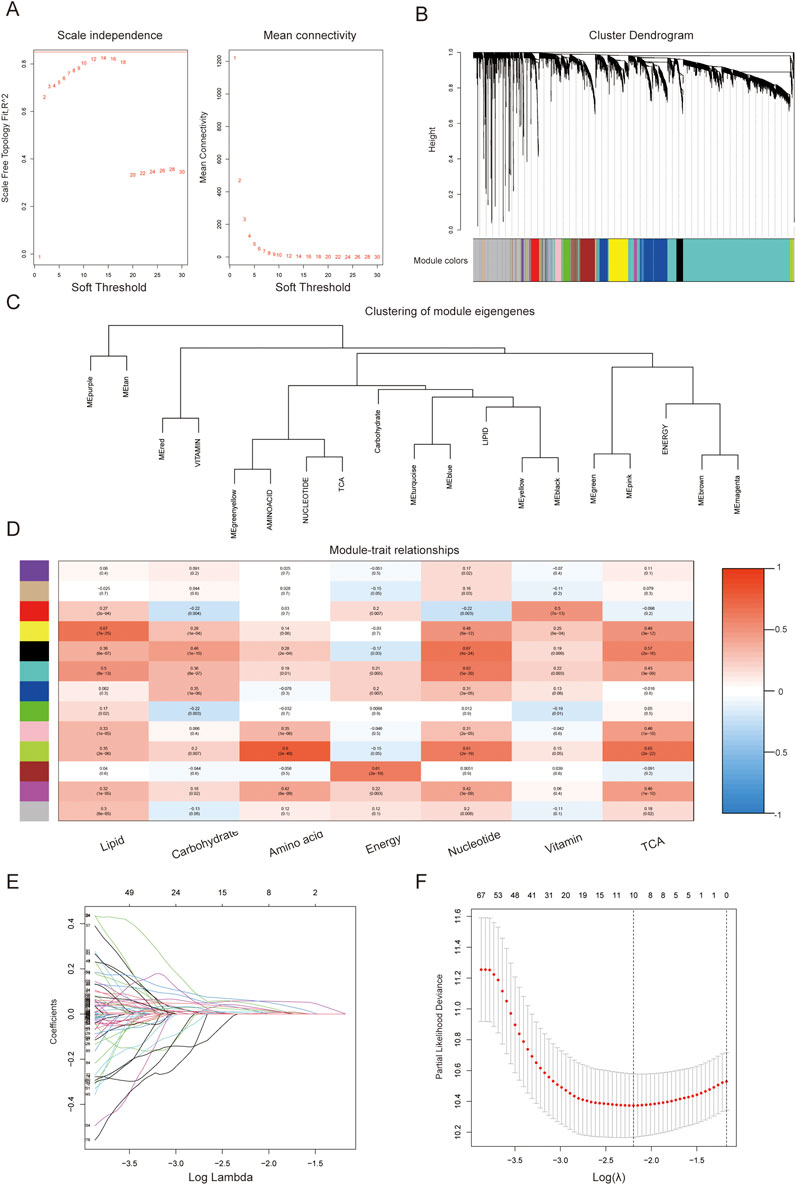
Figure 2. Identification of hub predictive genes associated with metabolic features using WGCNA. (A) Analysis of scale independence and mean connectivity for the soft thresholding powers; (B) Cluster dendrogram; (C) Clustering of module eigengenes; (D) Correlation of the gene module with metabolic phenotypic features (The data in the module represents the correlation coefficient and statistical value between each gene set and metabolic pathway); (E) Confidence intervals of log lambda; (F) Partial likelihood deviance of log Lambda.
3.2 Construction and validation of a metabolism-associated prognostic risk model
To filter genes with predictive value, we performed univariate Cox regression analysis and identified 362 genes among the metabolic hub genes (p < 0.001). Based on the 1000-fold cross-validation results of LASSO regression analysis, the optimal efficacy was achieved when ten variables were selected as the target markers (Figures 2E,F). Furthermore, through multivariate Cox regression analysis, we identified five genes derived from the LASSO regression analysis that could independently construct a gene signature to predict the prognosis of PC as described in 2.4.
Patients were divided into two groups based on the median risk score for validation. The KM curve showed that the high-risk group had significantly worse OS than the low-risk group (Figure 3B), which was further verified in external validation sets from GEO and ICGC (Figures 3C,D). The ROC curves and AUC values of the three datasets demonstrated the predictive ability of the risk score from a time-dependent perspective (Figures 3E–G). In TCGA, the AUCs for 1-, 2-, and 3-year were 0.75, 0.74, and 0.80, respectively, indicating good predictive performance for PC. When compared with other reported models, our model exhibited a better ROC curve and AUC value, and the top five models are displayed in Figure 3H (Supplementary Figure S1).
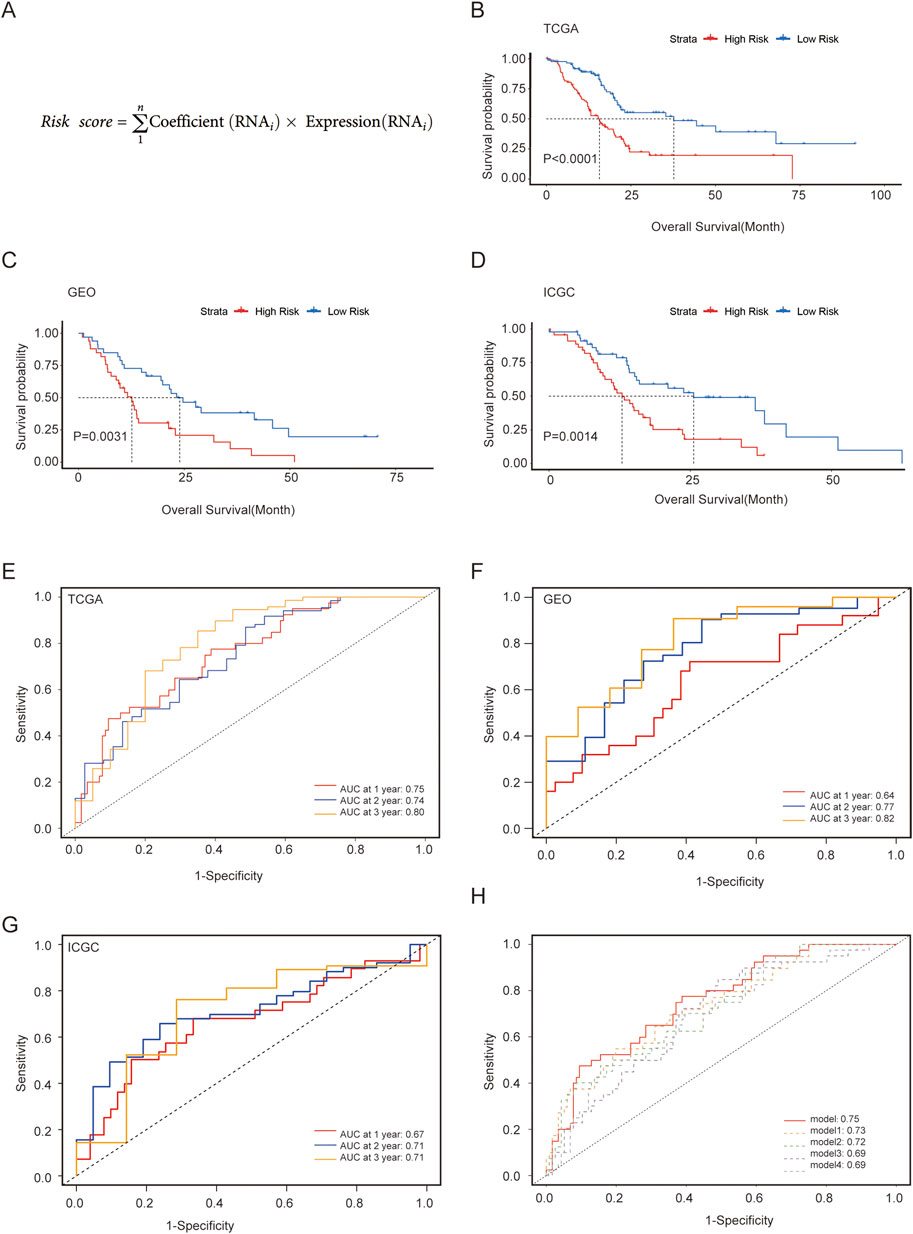
Figure 3. Construction and validation of a metabolism-associated prognostic risk model. (A) Risk score for the model; (B–D) Survival curves analysis of three cohorts; (E–G) ROC curve and evaluated AUC values for three cohorts; (H) Comparison of our model with four other models demonstrating superior predictive efficacy.
3.3 Clinical and pathological characteristics of two groups
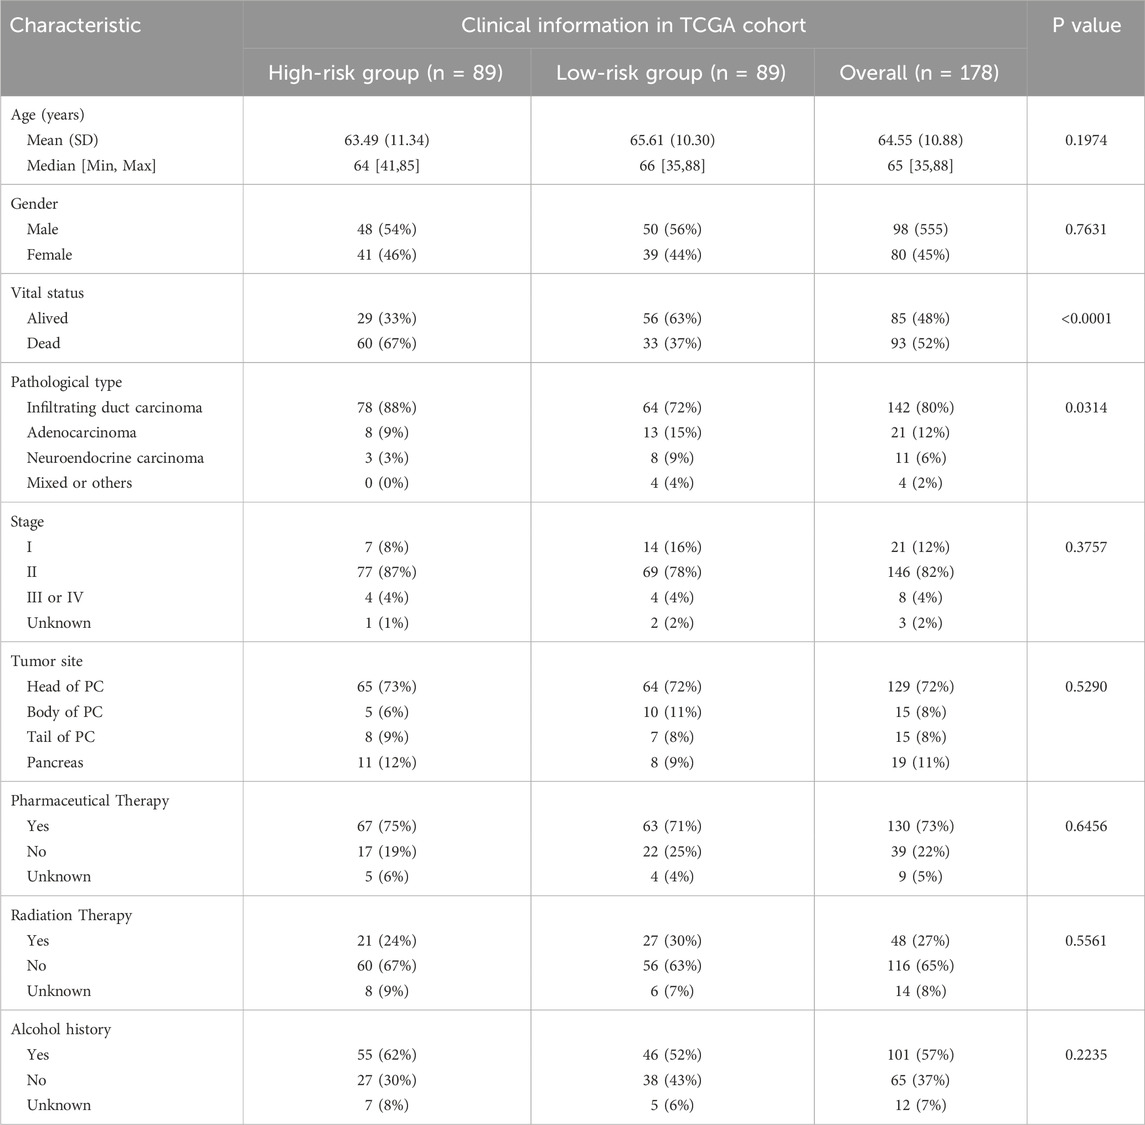
The distribution of clinical and pathological information between the two groups is presented in Table 1. The analysis results showed that, except for vital status and pathological types, no significant distribution differences were observed in other characteristics. The expression levels of the five indicator genes in the high-risk group were higher than those in the low-risk group, which may explain the potential mechanisms of OS (Figure 4A).
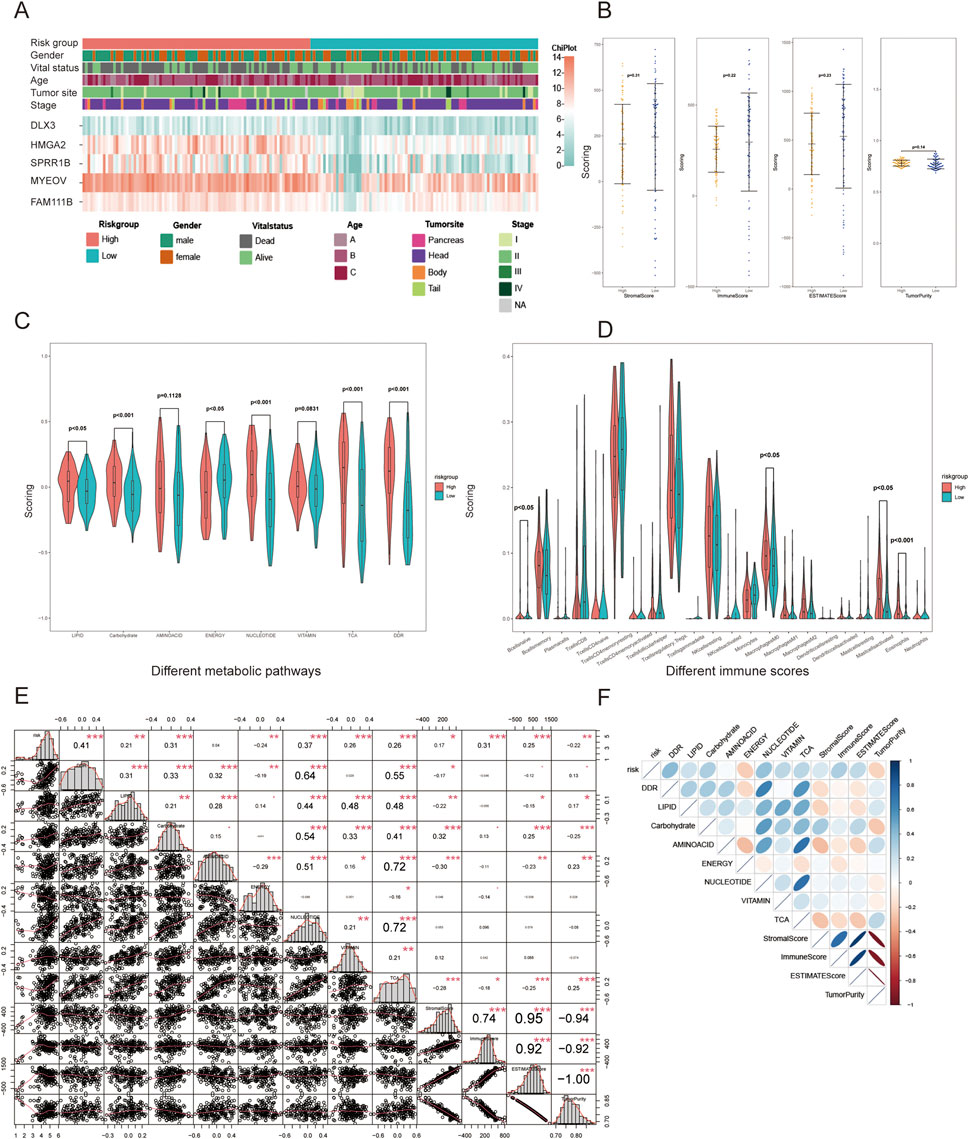
Figure 4. Differences in clinical and phenotypic features between the two groups. (A) Heatmap of clinical features and gene expression; (B) Differences in estimate scores; (C) Differences in seven metabolic pathways and DDR; (D) Differences in 22 immune cell infiltrations; (E) Correlation coefficients between significant phenotypic features; (F) Heatmap of the correlations. *p < 0.05, **p < 0.01, ***p < 0.001.
3.4 Correlation between risk score and phenotypic features
The risk score showed strong associations with metabolism, DDR, and estimate scores but weak correlations with 22 immune cells, as revealed by the differential analysis (Figures 4B–D). The high-risk group demonstrates lower scores of stromal, immune, and estimate, while the tumor purity score is higher. In terms of metabolism, the high-risk group exhibits higher scores for TCA, DDR and metabolism of lipid, carbohydrate, amino acid, nucleotide, vitamin, but a lower score for integrated energy metabolism. To further investigate the implied mechanism of the risk score, correlation analysis revealed that the risk score had the strongest correlation with DDR rating scores (correlation coefficient: 0.41, P < 0.001), followed by nucleotide, carbohydrate, immune, TCA, and vitamin scores (Figures 4E,F). In terms of the relationship between phenotypic features, DDR showed a strong correlation with lipid, carbohydrate, amino acid, nucleotide, and TCA metabolism, particularly with the latter two features. In contrast, the immune score displayed a weak correlation with metabolism and DDR. For the internal analysis of metabolism pathways, the correlation coefficient between nucleotide and TCA was 0.72, and both were closely related to lipid, carbohydrate, and amino acid metabolism. The correlation between different factors showed a positive correlation, except for energy metabolism. This reflects that patients identified as high-risk by our model may be more closely related to changes in the DDR pathway, which requires the support of metabolic pathways such as nucleotide and TCA.
3.5 GSEA reveals the mechanism of risk derived from multiple metabolic or proliferative pathways
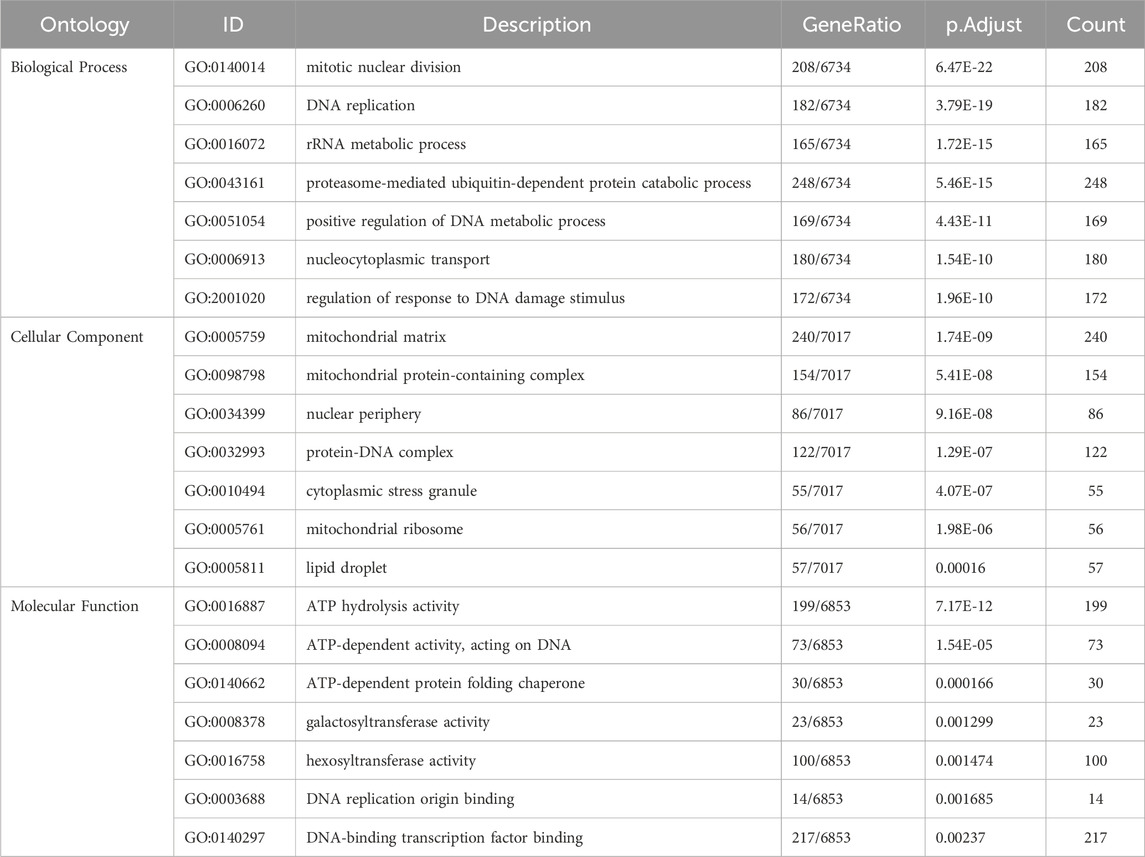
In total, 10,720 DEGs were re-identified as potential factors that could contribute to the survival differences between the two different risk groups. Among them, 705 DEGs were upregulated and 2,660 DEGs were downregulated in the high-risk group compared with those in the low-risk group (Figure 5A). GO analysis of the DEGs indicated that these genes were highly enriched in biological processes such as nucleocytoplasmic transport or replication, cellular components including mitochondria, and molecular functions related to regulating metabolism or ATP-dependent activities, as shown in Table 2 (Figure 5D). KEGG analysis and GSEA results showed that DEGs were enriched in several pathways closely related to metabolism and proliferation (Figures 5B,C,E). Nine pathways may explain the factors associated with the risk score and their effect on survival; among these pathways, five were upregulated and four were downregulated (Figures 5F,G).
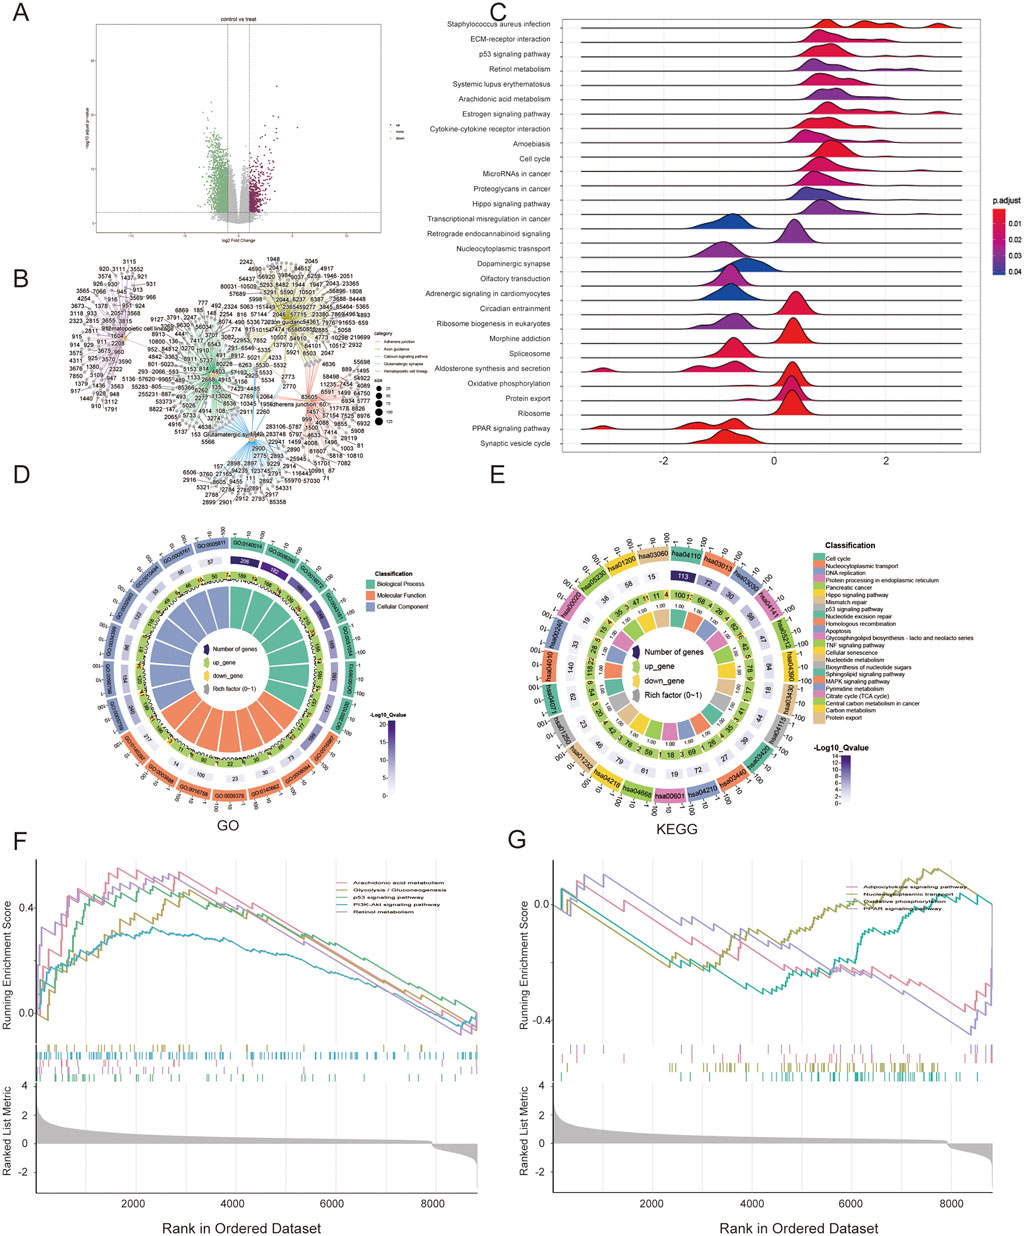
Figure 5. Gene set enrichment analysis (GSEA) between two risk groups. (A) Volcano plot of DEGs; (B) Connection between genes and pathways; (C) GSEA results; (D) GO analysis of DEGs; (E) KEGG analysis; (F,G) GSEA of upregulated and downregulated pathways.
3.6 Drug sensitivity analysis and validation
IC50 values reflect the sensitivity of patients to drugs, with lower values of IC50 indicating greater sensitivity. Gemcitabine and 5-fluorouracil were the only pharmaceuticals included in the drug sensitivity analysis that were also recommended in the PC guidelines. Additionally, the IC50 values of cisplatin, olaparib, and paclitaxel were analyzed considering that oxaliplatin and albumin paclitaxel were recommended in the PC guidelines. Furthermore, the predictive IC50 values of these five pharmaceuticals to assess the predictive value of the risk score between the two groups. The results showed that, except for paclitaxel, the IC50 values of other pharmaceuticals in the high-risk group were significantly higher than those in the low-risk group (Figure 6A). In the analysis of the actual response to gemcitabine, a trend emerged suggesting that patients with lower risk scores and a higher proportion in the low-risk group exhibited better responses (Figures 6B,C).
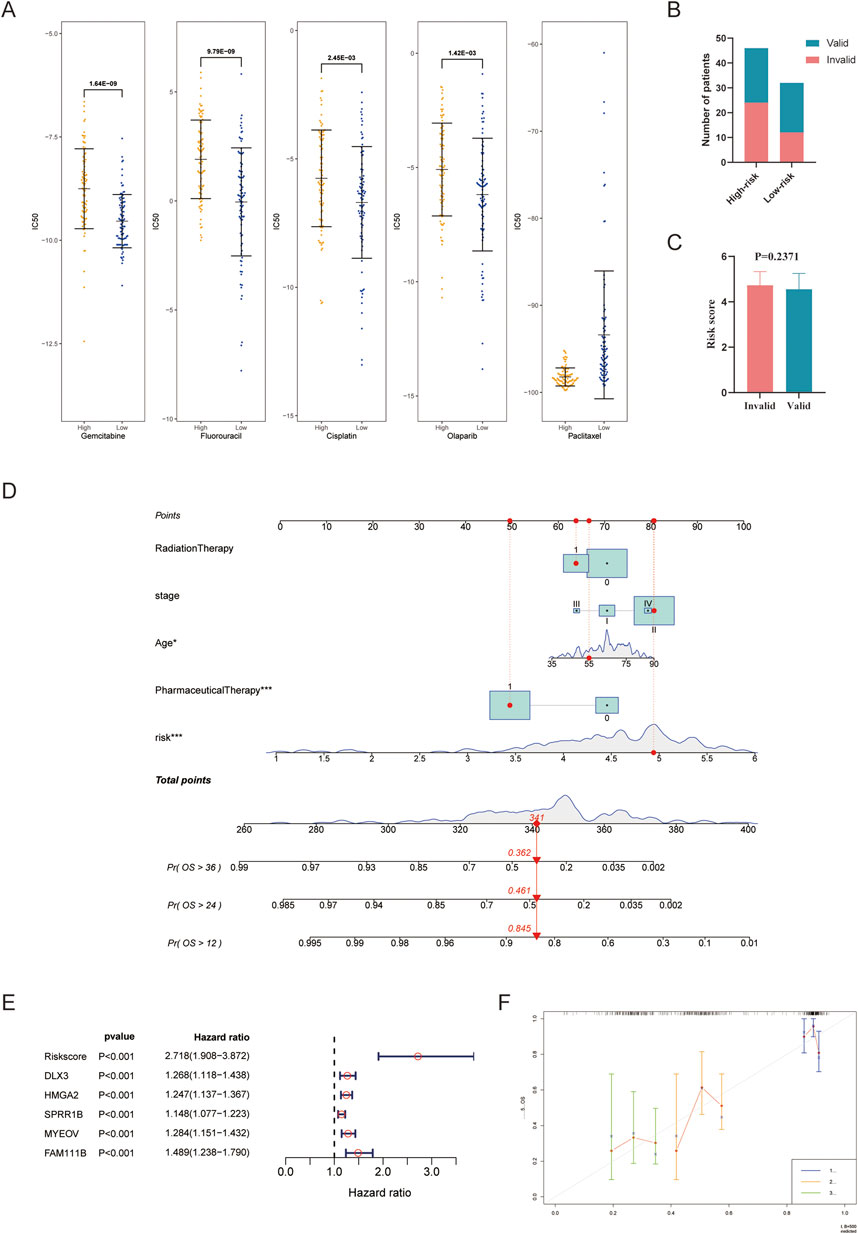
Figure 6. Predicting drug sensitivity and constructing a nomogram model. (A) Comparison of IC50 values between the high- and low-risk group; (B,C) Analysis of actual response to gemcitabine; (D) Nomogram model integrating the risk score and valuable clinical parameters; (E) Univariate Cox analysis of the risk score and included genes; (F) Calibration curves for 1, 2, and 3 years of the nomogram. ***P < 0.001.
3.7 Application of risk score in a clinical nomogram model
To further validate the accuracy and usability of the risk score, a nomogram was constructed using the risk score and several clinical parameters. The total points obtained from the nomogram were used to evaluate the 1-, 2-, and 3-year OS rates in PC (Figure 6D). The nomogram displayed that younger age, administration of pharmaceutical therapy, and low-risk scores were all protective prognostic factors; these tendencies were consistent with expectations. The previous administration of radiotherapy and the later stage of the disease also showed a partial protective tendency. However, the sample size in some cohorts was insufficient to achieve statistical significance. A forest plot was used to display the predictive value of the five hub genes with hazard ratios in PC (Figure 6E). We further analyzed levels of five genes in other cancers with TCGAplot, most of them upregulated (Supplementary Figures S2A–E) (Liao and Wang, 2023). The protein expression of them on the Human Protein Atlas database may also upregulated in PC (DLX3 and SPRR1B pending analysis) (Supplementary Figures S2F,H). To verify the accuracy of the model, calibration curves were performed (Figure 6F), and the C-index was found to be 0.778 (0.729–0.828), indicating that the nomogram has good capability for predicting the OS rate of PC patients.
4 Discussion
Metabolic reprogramming plays a crucial role in the mechanisms for underlying many malignant behaviors of PC (Hao et al., 2021). Understanding its characteristics and exploring potential targets are of great significance for improving treatment efficacy. Numerous studies have demonstrated that targeting specific metabolic pathways can exert anticancer effects (Zu et al., 2022). However, the regulation process of metabolic reprogramming is complex, and few studies have comprehensively considered multiple metabolic pathways simultaneously. Therefore, we aimed to construct and validate a metabolism-associated prognostic risk model based on the level of metabolic phenotype, and explore its potential mechanisms.
Constructing a prognostic model is a common approach in bioinformatics analysis based on transcriptome data. In previous studies, directly intersected with phenotype-associated gene sets was a conventional step in constructing phenotype-related prognostic models. Metabolism has been a focus in similar studies. However, the gene sets used to construct models based on specific phenotypes that were often derived from previous studies. Our study adopted a method that screens hub genes based on metabolic phenotype scorings through using WGCNA. This approach recognizes that functional phenotypes of patients are often the result of combined actions of sets of genes. The performance of our model was well validated using KM and ROC curves in external datasets and exhibited good feasibility in a nomogram model. Moreover, our model demonstrated superior predictive ability for 1-year survival compared with that of the nine reported PC models. Our study findings revealed a closer relationship between risk score, metabolism, and DDR levels than between immunological or clinical features. This can be reasonably explained by the role of metabolism in mediating multiple phenotypes of PC that affect survival, particularly through DDR. As summarized in previous reviews, metabolites of lipid, carbon, and amino acids serve as the primary sources for nucleic acid metabolism and interact through the TCA pathway, collectively establishing the basis for DDR (Hönigova et al., 2022; Jurkovicova et al., 2022). The analysis results of GO, KEGG, and GSEA indicated that the risk score may originate from multiple metabolic or proliferative pathways, reaffirming the significance of metabolic processes in various malignancies of PC.
Five genes (DLX3, HMGA2, SPRR1B, MYEOV, and FAM111B) were included in this model. In the survival analysis of these five genes, each of them was significant as a risk factor in univariate Cox regression, whereas only HMGA2 was significant in multivariate Cox regression. Multivariate Cox analysis demonstrated that a robust prognostic risk model could be constructed using these integrated five genes. Except for DLX3, cumulative evidence has indicated that these genes participate in the malignant process of PC and are accepted for constructing similar models. As reported previously, HMGA2 sever as an upstream protein that alters chromatin structure and regulates gene expression, participating in various tumorigenic process (Huang et al., 2018; Hashemi et al., 2023). A necroptosis-related signature was constructed with HMGA2, indicating the predictive value of HMGA2 in PC (Chen et al., 2022). FAM111B and MYEOV have been incorporated into a necroptosis-related prognostic model for PC (Wu et al., 2022). Preliminary single-gene bioinformatics studies have indicated that FAM111B and MYEOV are highly expressed and closely associated with poor prognosis in PC (Gong et al., 2022; Tang et al., 2020). The enrichment results of FAM111B were related to cell cycle signaling and DDR pathways, while MYEOV was related to several glycolysis-related pathways. Emerging evidence indicates that overexpression of MYEOV increases the expression of metabolism-related enzyme genes through the c-Myc and mTORC1 pathways (Tange et al., 2023). SPRR1B has been validated in lung adenocarcinoma and included in a PC model (Zhang et al., 2021; Liu et al., 2019). A pan-cancer analysis revealed that SPRR1B was a significant biomarker of cancer stemness that used for predicting immunotherapy response (Zhang et al., 2022). The homeobox transcription regulator DLX3 is known for regulating skin epidermal homeostasis, and its loss induces squamous cell carcinoma of the skin (Bhattacharya et al., 2018; Palazzo et al., 2016). The mutation of DLX3 on autosome leads to tricho-dento-osseous syndrome (Dong et al., 2023). In our study, we found that DLX3 was a risk factor for PC, not a protective factor as observed in squamous cell carcinoma of the skin. Further studies are needed to determine whether this paradox can be attributed to the pathological characteristics of adenocarcinoma with abundant stroma in PC.
To our knowledge, this is the first study to screen metabolism-associated hub genes based on metabolic phenotype scoring and construct a prognostic model. Nonetheless, our study has some limitations. First, our data were from obtained online databases TCGA, GEO, and ICGA, but analysis data used for exploring phenotypic features, drug sensitivity, and nomogram model was only from TCGA. Second, real prospective clinical cohorts and basic investigations are needed for further validation. Lastly, the specific molecular mechanisms explaining the crosstalk between risk score, metabolism, and DDR are still poorly understood.
In conclusion, we constructed and validated a metabolism-associated prognostic model based on the levels of seven metabolic phenotypes in PC. The findings suggest that the mechanism of risk scores is primarily related to DDR and the metabolism of nucleotides, carbohydrates, and TCA. The close relation between metabolism and DDR may indicate that metabolic reprogramming provides abundant substances for DDR, promoting malignant behaviors. This offers new insight into the combined treatment strategies of PC.
Data availability statement
The original contributions presented in the study are included in the article/Supplementary Material, further inquiries can be directed to the corresponding authors.
Ethics statement
Ethical approval was not required for the studies involving humans because The RNA sequencing data were downloaded from databases of TCGA, GEO, ICGC (accessed on 19 March 2023). The studies were conducted in accordance with the local legislation and institutional requirements. Written informed consent for participation was not required from the participants or the participants’ legal guardians/next of kin in accordance with the national legislation and institutional requirements because The RNA sequencing data were downloaded from databases of TCGA, GEO, ICGC (accessed on 19 March 2023). Ethical approval was not required for the study involving animals in accordance with the local legislation and institutional requirements because The RNA sequencing data were downloaded from databases of TCGA, GEO, ICGC (accessed on 19 March 2023).
Author contributions
ZuS: Conceptualization, Data curation, Formal Analysis, Writing – original draft. ZiS: Conceptualization, Data curation, Formal Analysis, Writing – original draft. YD: Formal Analysis, Investigation, Writing – original draft. XL: Formal Analysis, Investigation, Writing – original draft. XK: Data curation, Formal Analysis, Writing – original draft. GR: Methodology, Supervision, Writing – review and editing. YW: Funding acquisition, Project administration, Supervision, Writing – review and editing.
Funding
The author(s) declare that financial support was received for the research and/or publication of this article. This work was supported by grants from the Capital Health Research and Development of Special Fund of China (No. 2022-2-5121).
Conflict of interest
The authors declare that the research was conducted in the absence of any commercial or financial relationships that could be construed as a potential conflict of interest.
Publisher’s note
All claims expressed in this article are solely those of the authors and do not necessarily represent those of their affiliated organizations, or those of the publisher, the editors and the reviewers. Any product that may be evaluated in this article, or claim that may be made by its manufacturer, is not guaranteed or endorsed by the publisher.
Supplementary material
The Supplementary Material for this article can be found online at: https://www.frontiersin.org/articles/10.3389/fgene.2025.1487046/full#supplementary-material
SUPPLEMENTARY FIGURE S1 | Comparison of ten models in TCGA dataset using ROC and AUC analysis. (A) Our model demonstrates superior predictive efficacy in PC; (B) Metabolism-related model reported by Huang et al.; (C) KRAS-associated metabolic model reported by Ma et al.; (D) Lipid metabolism-related model reported by Ye et al.; (E) Neuroendocrine regulation- and metabolism-related model reported by Zhang et al.; (F) Stem cell-related model reported by Ren et al.; (G) Immune-related model reported by Liu et al.; (H) Pyroptosis-related model reported by Yan et al.; (I) Four-gene model reported by Yan et al.; (J) Four-gene model reported by Zhou et al.
SUPPLEMENTARY FIGURE S2 | The transcription levels of five genes in pan cancers (A–E) and protein expression of HMGA2 (F), MYEOV (G), and FAM111B (H) in cancer and paracancer tissue (A color version of this figure is available in the online journal.). *P < 0.05, **P < 0.01, ***P < 0.001, ****P < 0.0001, ns, no statistically significant.
Abbreviations
PC, pancreatic cancer; TCA, tricarboxylic acid cycle; DDR, DNA damage repair; DEG, differential expression genes; WGCNA, weighted gene co-expression network analysis; LASSO, least absolute shrinkage and selection operator; TCGA, the cancer genome atlas; GEO, gene expression omnibus; ICGC, international cancer genome consortium; OS, overall survival; IGDS, intersection genes data set; ICI, immune cell profiling; KM, Kaplan-Meier; ROC, receiver operating characteristic; AUC, area under the curve; GSEA, gene set enrichment analysis; FDR, false discovery rate; GO, gene ontology; KEGG, Kyoto encyclopedia of genes and genomes; IC50, half maximal inhibitory concentration.
References
Bhattacharya, S., Kim, J.-C., Ogawa, Y., Nakato, G., Nagle, V., Brooks, S. R., et al. (2018). DLX3-Dependent STAT3 signaling in keratinocytes regulates skin immune homeostasis. J. Invest. Dermatol. 138 (5), 1052–1061. doi:10.1016/j.jid.2017.11.033
Bray, F., Laversanne, M., Sung, H., Ferlay, J., Siegel, R. L., Soerjomataram, I., et al. (2024). Global cancer statistics 2022: GLOBOCAN estimates of incidence and mortality worldwide for 36 cancers in 185 countries. CA a cancer J. Clin. 74 (3), 229–263. doi:10.3322/caac.21834
Cancer Genome Atlas Research NetworkCancer Genome Atlas Research Network (2017). Electronic address:YW5kcmV3X2FndWlycmVAZGZjaS5oYXJ2YXJkLmVkdSw= and Cancer Genome Atlas Research Network. Integr. Genomic Charact. Pancreat. Ductal Adenocarcinoma. Cancer cell 32 (2), 185–203.e13. doi:10.1016/j.ccell.2017.07.007
Chang, X., Liu, X., Wang, H., Yang, X., and Gu, Y. (2022). Glycolysis in the progression of pancreatic cancer.
Chen, L., Zhang, X., Zhang, Q., Zhang, T., Xie, J., Wei, W., et al. (2022). A necroptosis related prognostic model of pancreatic cancer based on single cell sequencing analysis and transcriptome analysis. Front. Immunol. 13, 1022420. doi:10.3389/fimmu.2022.1022420
Dong, L., Zhao, N., Wang, D., Wang, M., Zhang, Y., Sun, L., et al. (2023). DLX3 (Q178R) mutation delays osteogenic differentiation via H19/miR-29c-3p/KDM5B axis in TDO-iPSCs-derived MSCs. Genes & Dis. 11 (4), 101012. doi:10.1016/j.gendis.2023.05.011
Falcone, M., Uribe, A. H., Papalazarou, V., Newman, A. C., Athineos, D., Stevenson, K., et al. (2022). Sensitisation of cancer cells to radiotherapy by serine and Glycine starvation. Br. J. Cancer 127 (10), 1773–1786. doi:10.1038/s41416-022-01965-6
Fu, S., Li, Z., Xiao, L., Hu, W., Zhang, L., Xie, B., et al. (2019). Glutamine synthetase promotes radiation resistance via facilitating nucleotide metabolism and subsequent DNA damage repair. Cell Rep. 28 (5), 1136–1143.e4. doi:10.1016/j.celrep.2019.07.002
Gong, Q., Dong, Q., Zhong, B., Zhang, T., Cao, D., Zhang, Y., et al. (2022). Clinicopathological features, prognostic significance, and associated tumor cell functions of family with sequence similarity 111 member B in pancreatic adenocarcinoma. J. Clin. Lab. Anal. 36 (12), e24784. doi:10.1002/jcla.24784
Hao, X., Ren, Y., Feng, M., Wang, Q., and Wang, Y. (2021). Metabolic reprogramming due to hypoxia in pancreatic cancer: implications for tumor formation, immunity, and more. Biomed. Pharmacother. 141, 111798. doi:10.1016/j.biopha.2021.111798
Hashemi, M., Rashidi, M., Hushmandi, K., Ten Hagen, T. L. M., Salimimoghadam, S., Taheriazam, A., et al. (2023). HMGA2 regulation by MiRNAs in cancer: affecting cancer hallmarks and therapy response. Pharmacol. Res. 190, 106732. doi:10.1016/j.phrs.2023.106732
Helleday, T., and Rudd, S. G. (2022). Targeting the DNA damage response and repair in cancer through nucleotide metabolism. Mol. Oncol. 16 (21), 3792–3810. doi:10.1002/1878-0261.13227
Hönigova, K., Navratil, J., Peltanova, B., Polanska, H. H., Raudenska, M., and Masarik, M. (2022). Metabolic tricks of cancer cells. Biochim. Biophys. Acta BBA - Rev. Cancer 1877 (3), 188705. doi:10.1016/j.bbcan.2022.188705
Hruban, R. H., Gaida, M. M., Thompson, E., Hong, S.-M., Noë, M., Brosens, L. A., et al. (2019). Why is pancreatic cancer so deadly? The pathologist’s view. J. Pathol. 248, 131–141. doi:10.1002/path.5260
Huang, B., Yang, J., Cheng, Q., Xu, P., Wang, J., Zhang, Z., et al. (2018). Prognostic value of HMGA2 in human cancers: a meta-analysis based on literature and TCGA datasets. Front. Physiol. 9, 776. doi:10.3389/fphys.2018.00776
Huang, H., Zhou, S., Zhao, X., Wang, S., Yu, H., Lan, L., et al. (2023). Construction of a metabolism-related gene prognostic model to predict survival of pancreatic cancer patients. Heliyon 9 (1), e12378. doi:10.1016/j.heliyon.2022.e12378
Jurkovicova, D., Neophytou, C. M., Gašparović, A. Č., and Gonçalves, A. C. (2022). DNA damage response in cancer therapy and resistance: challenges and opportunities. Int. J. Mol. Sci. 23 (23), 14672. doi:10.3390/ijms232314672
Li, Y., Zhang, K., Peng, L., Chen, L., Gao, H., and Chen, H. (2022). Multiple perspectives reveal the role of DNA damage repair genes in the molecular classification and prognosis of pancreatic adenocarcinoma. Int. J. Mol. Sci. 23 (18), 10231. doi:10.3390/ijms231810231
Liao, C., and Wang, X. (2023). TCGAplot: an R package for integrative pan-cancer analysis and visualization of TCGA multi-omics data. BMC Bioinforma. 24 (1), 483. doi:10.1186/s12859-023-05615-3
Liu, B., Fu, T., He, P., Du, C., and Xu, K. (2021). Construction of a five-gene prognostic model based on immune-related genes for the prediction of survival in pancreatic cancer. Rep 41 (7), BSR20204301. doi:10.1042/BSR20204301
Liu, X., Li, J., Wang, Q., Bai, L., Xing, J., Hu, X., et al. (2022). Analysis on heterogeneity of hepatocellular carcinoma immune cells and a molecular risk model by integration of ScRNA-seq and bulk RNA-seq. Front. Immunol. 13, 1012303. doi:10.3389/fimmu.2022.1012303
Liu, Y., Zhu, D., Xing, H., Hou, Y., and Sun, Y. (2019). A 6-gene risk score system constructed for predicting the clinical prognosis of pancreatic adenocarcinoma patients. Oncol. Rep. 41, 1521–1530. doi:10.3892/or.2019.6979
Ma, Z., Li, Z., Ma, Z., Zhou, Z., Zhuang, H., Liu, C., et al. (2021). Development of a KRAS-associated metabolic risk model for prognostic prediction in pancreatic cancer. Biomed. Res. Int. 2021, 9949272–21. doi:10.1155/2021/9949272
Man, J., Pajic, M., and Joshua, A. M. (2020). Fats and mets, KRAS-driven lipid dysregulation affects metastatic potential in pancreatic cancer. Cancer Res. 80 (22), 4886–4887. doi:10.1158/0008-5472.CAN-20-3082
Nicolle, R., Gayet, O., Duconseil, P., Vanbrugghe, C., Roques, J., Bigonnet, M., et al. (2021). A transcriptomic signature to predict adjuvant gemcitabine sensitivity in pancreatic adenocarcinoma. Ann. Oncol. 32 (2), 250–260. doi:10.1016/j.annonc.2020.10.601
Palazzo, E., Kellett, M., Cataisson, C., Gormley, A., Bible, P. W., Pietroni, V., et al. (2016). The homeoprotein DLX3 and tumor suppressor P53 Co-regulate cell cycle progression and squamous tumor growth. Oncogene 35 (24), 3114–3124. doi:10.1038/onc.2015.380
Peng, T., Sun, F., Yang, J. C., Cai, M. H., Huai, M. X., Pan, J. X., et al. (2024). Novel lactylation-related signature to predict prognosis for pancreatic adenocarcinoma. World J. gastroenterology 30 (19), 2575–2602. doi:10.3748/wjg.v30.i19.2575
Rahib, L., Smith, B. D., Aizenberg, R., Rosenzweig, A. B., Fleshman, J. M., and Matrisian, L. M. (2014). Projecting cancer incidence and deaths to 2030: the unexpected burden of thyroid, liver, and pancreas cancers in the United States. Cancer Res. 74 (11), 2913–2921. doi:10.1158/0008-5472.CAN-14-0155
Ren, X., Zhou, C., Lu, Y., Ma, F., Fan, Y., and Wang, C. (2021). Single-cell RNA-seq reveals invasive trajectory and determines cancer Stem cell-related prognostic genes in pancreatic cancer. Bioengineered 12 (1), 5056–5068. doi:10.1080/21655979.2021.1962484
Singhi, A. D., Koay, E. J., Chari, S. T., and Maitra, A. (2019). Early detection of pancreatic cancer: opportunities and challenges. Gastroenterology 156 (7), 2024–2040. doi:10.1053/j.gastro.2019.01.259
Su, R., Jin, C., Zhou, L., Cao, Y., Kuang, M., Li, L., et al. (2021). Construction of a CeRNA network of hub genes affecting immune infiltration in ovarian cancer identified by WGCNA. BMC Cancer 21 (1), 970. doi:10.1186/s12885-021-08711-w
Sung, J.-Y., and Cheong, J.-H. (2021). Pan-cancer analysis reveals distinct metabolic reprogramming in different epithelial–mesenchymal transition activity States. Cancers 13 (8), 1778. doi:10.3390/cancers13081778
Tang, R., Ji, J., Ding, J., Huang, J., Gong, B., Zhang, X., et al. (2020). Overexpression of MYEOV predicting poor prognosis in patients with pancreatic ductal adenocarcinoma. Cell Cycle 19 (13), 1602–1610. doi:10.1080/15384101.2020.1757243
Tange, S., Hirano, T., Idogawa, M., Hirata, E., Imoto, I., and Tokino, T. (2023). MYEOV overexpression induced by demethylation of its promoter contributes to pancreatic cancer progression via activation of the folate cycle/c-Myc/MTORC1 pathway. BMC Cancer 23 (1), 85. doi:10.1186/s12885-022-10433-6
Tufail, M., Jiang, C. H., and Li, N. (2024). Altered metabolism in cancer: insights into energy pathways and therapeutic targets. Mol. Cancer 23 (1), 203. doi:10.1186/s12943-024-02119-3
Uddin, M. H., Zhang, D., Muqbil, I., El-Rayes, B. F., Chen, H., Philip, P. A., et al. (2024). Deciphering cellular plasticity in pancreatic cancer for effective treatments. Cancer metastasis Rev. 43 (1), 393–408. doi:10.1007/s10555-023-10164-5
Wu, Z., Huang, X., Cai, M., Huang, P., and Guan, Z. (2022). Novel necroptosis-related gene signature for predicting the prognosis of pancreatic adenocarcinoma. Aging 14 (2), 869–891. doi:10.18632/aging.203846
Xiao, Y., Zhang, B., Cloyd, J. M., Alaimo, L., Xu, G., Du, S., et al. (2022). Novel drug candidate prediction for Intrahepatic cholangiocarcinoma via hub gene network analysis and connectivity mapping. Cancers 14 (13), 3284. doi:10.3390/cancers14133284
Xu, R., Yang, J., Ren, B., Wang, H., Yang, G., Chen, Y., et al. (2020). Reprogramming of amino acid metabolism in pancreatic cancer: recent advances and therapeutic strategies. Front. Oncol. 10, 572722. doi:10.3389/fonc.2020.572722
Yan, C., Niu, Y., Li, F., Zhao, W., and Ma, L. (2022). System analysis based on the pyroptosis-related genes identifies GSDMC as a novel therapy target for pancreatic adenocarcinoma. J. Transl. Med. 20 (1), 455. doi:10.1186/s12967-022-03632-z
Yan, J., Wu, L., Jia, C., Yu, S., Lu, Z., Sun, Y., et al. (2020). Development of a four-gene prognostic model for pancreatic cancer based on transcriptome dysregulation. Aging 12 (4), 3747–3770. doi:10.18632/aging.102844
Yang, F., Jiang, N., Li, X. Y., Qi, X. S., Tian, Z. B., and Guo, Y. J. (2024). Construction and validation of a pancreatic cancer prognostic model based on genes related to the hypoxic tumor microenvironment. World J. gastroenterology 30 (36), 4057–4070. doi:10.3748/wjg.v30.i36.4057
Ye, Y., Chen, Z., Shen, Y., Qin, Y., and Wang, H. (2021). Development and validation of a four-lipid metabolism gene signature for diagnosis of pancreatic cancer. FEBS Open Bio 11 (11), 3153–3170. doi:10.1002/2211-5463.13074
Zhang, B., Yuan, Q., Zhang, B., Li, S., Wang, Z., Liu, H., et al. (2023). Characterization of neuroendocrine regulation- and metabolism-associated molecular features and prognostic indicators with aid to clinical chemotherapy and immunotherapy of patients with pancreatic cancer. Front. Endocrinol. 13, 1078424. doi:10.3389/fendo.2022.1078424
Zhang, Z., Shi, R., Xu, S., Li, Y., Zhang, H., Liu, M., et al. (2021). Identification of small proline-rich protein 1B (SPRR1B) as a prognostically predictive biomarker for lung adenocarcinoma by integrative bioinformatic analysis. Cancer 12 (6), 796–806. doi:10.1111/1759-7714.13836
Zhang, Z., Wang, Z. X., Chen, Y. X., Wu, H. X., Yin, L., Zhao, Q., et al. (2022). Integrated analysis of single-cell and bulk RNA sequencing data reveals a pan-cancer stemness signature predicting immunotherapy response. Genome Med. 14 (1), 45. doi:10.1186/s13073-022-01050-w
Zhou, Y.-Y., Chen, L.-P., Zhang, Y., Hu, S.-K., Dong, Z.-J., Wu, M., et al. (2019). Integrated transcriptomic analysis reveals hub genes involved in diagnosis and prognosis of pancreatic cancer. Mol. Med. 25 (1), 47. doi:10.1186/s10020-019-0113-2
Keywords: pancreatic cancer, predictable model, metabolism, DNA damage repair, bioinformatics
Citation: Song Z, Sun Z, Di Y, Liu X, Kang X, Ren G and Wang Y (2025) Metabolic reprogramming and prognostic modeling in pancreatic cancer: insights from WGCNA. Front. Genet. 16:1487046. doi: 10.3389/fgene.2025.1487046
Received: 28 August 2024; Accepted: 29 May 2025;
Published: 12 June 2025.
Edited by:
Premila Leiphrakpam, University of Nebraska Medical Center, United StatesReviewed by:
Mohith Manjunath, University of Illinois at Urbana-Champaign, United StatesEko Mugiyanto, Muhammadiyah University of Pekajangan Pekalongan, Indonesia
Copyright © 2025 Song, Sun, Di, Liu, Kang, Ren and Wang. This is an open-access article distributed under the terms of the Creative Commons Attribution License (CC BY). The use, distribution or reproduction in other forums is permitted, provided the original author(s) and the copyright owner(s) are credited and that the original publication in this journal is cited, in accordance with accepted academic practice. No use, distribution or reproduction is permitted which does not comply with these terms.
*Correspondence: Gang Ren, cmdzbkAxNjMuY29t; Yingjie Wang, d2FuZ3lqOTk5OUAxNjMuY29t
 Zhuo Song
 Zhijia Sun
 Yupeng Di
 Xu Liu1
 Xiaoli Kang
 Gang Ren
 Yingjie Wang