 Shiyi Wang1
 Dengying Liu
 Qishan Wang
 Yuchun Pan
 Peipei Ma
- 1Shanghai Collaborative Innovation Center of Agri-Seeds/School of Agriculture and Biology, Shanghai Jiao Tong University, Shanghai, China
- 2Department of Animal Breeding and Reproduction, College of Animal Science, Zhejiang University, Hangzhou, China
Objective: Genomic best linear unbiased prediction (GBLUP) is a key method in genomic prediction, relying on the construction of a genomic relationship matrix (G-matrix). Although various methods for G-matrix construction have been proposed, the performance of these methods across different species has not been thoroughly compared.
Methods: This study systematically evaluated the performance of six genomic relationship matrix (G-matrix) construction methods in improving the prediction accuracy of GBLUP models across four species: pigs, bulls, wheat, and mice. The methodological framework included: (1) an initial unscaled matrix; (2) five scaled methods utilizing allele frequency centralization. The scaled methods comprised: (a) three variance-weighted approaches using allele frequencies fixed at 0.5 (G05), observed frequencies (GOF), or average minor allele frequencies (GMF); (b) two centralized methods with weighting by either the trace of the numerator matrix (GN) or reciprocals of each locus’s expected variance (GD).
Results: The GD matrix demonstrated significant prediction accuracy improvements for pig traits. Conversely, most scaled G-matrices showed minimal effects on mice, wheat, and bull, even with underperforming unscaled baselines in prediction accuracy compared to the original unscaled matrix. The learning curve for bull data showed the choice of G-matrix had minimal impact on prediction accuracy when the reference population size and genetic marker density reached a certain threshold.
Discussion: The study concluded that the optimal G-matrix construction method varies across species, with population structure being a key factor. These findings highlight the importance of species-specific optimization in genomic prediction and suggest that the influence of G-matrix construction diminishes in large-scale, high-density genomic datasets.
1 Introduction
Genomic prediction (GP) is a method of genetic evaluation of individuals using information from genome-wide genetic markers (Desta and Ortiz, 2014). With the rapid development of sequencing technology (Slatko et al., 2018), the cost of high-throughput single nucleotide polymorphism (SNP) marker detection continues to decrease. GP is widely used in animal and plant breeding practices nowadays. Compared with conventional breeding approaches, this method offers significant advantages, including shorter generation intervals, higher predictive accuracy, and reduced operational costs (Zhang et al., 2010). Various models have been used for genomic prediction. Bayesian variable selection models are generally more accurate than genomic best linear unbiased prediction (GBLUP) in predicting genomic breeding values (VanRaden et al., 2009). However, GBLUP is generally used for routine genomic evaluations because of lower computation. Compared with traditional BLUP (Momen and Morota, 2018), the genomic matrix (G-matrix) of GBLUP can reflect differences in genetic information between individuals and reduce the deviation caused by Mendelian sampling (El-Kassaby et al., 2012). The accuracy of predicting breeding values using genomic data is significantly higher than that when using genealogical records (Jonas and de Koning, 2015).
The G-matrix could be constructed simply by multiplying genotype matrix M and its transpose matrix M′ to count the number of alleles shared by relatives. This method was directly derived according to the properties of variance. Several methods were then proposed to modify the G-matrix to make it comparable to the A-matrix (Wright, 1922). A normalized matrix (GN) ensured that the average diagonal element was close to 1. In other methods, the allelic frequency from the base population was needed in constructing G to increase the weight of rare alleles. However, it was not available since those individuals in the base population were not genotyped in reality. Therefore, researchers have proposed a variety of alternative approaches to obtain the frequencies: 0.5 for all markers (G05), the average minor allele frequency (GMF), or the observed allele frequency of each SNP (GOF). The covariance matrix of additive genetic effects is generally defined as proportional to G in GBLUP. The four previously described G-matrices assumed that all markers contribute equally to the genetic variation of the same trait. This assumption is not desirable if the trait is influenced by major genes. To address this limitation, the GD matrix weight markers are evaluated by reciprocals of their expected variance instead of applying uniform scaling across all loci (VanRaden, 2008). The efficiencies of different G-matrices were compared in a previous study, which mainly aimed to identify the optimal method for constructing the G-matrix in single-step BLUP. The mean and variance of the diagonal and off-diagonal elements, the variance of genotyped individuals, and the accuracy of genotyped female individuals varied among the different G-matrices. The authors recommended using the GN matrix in single-step BLUP since it was the most compatible matrix with the A-matrix. G05 does not require the frequency of the second allele, which is suitable for the situation where the total population or the genotype of some individuals is unknown. GMF is similar to G05, except that 0.5 is replaced by the mean value of the frequency, which is suitable for the base population when some allele frequencies are unknown. When the average inbreeding coefficient is low or the number of generations is small, the mean value of the diagonal and off-diagonal elements is greater than the coefficient in the pedigree in G05 or GMF. On the contrary, the mean of the diagonal elements in GOF will be smaller than the coefficient in the pedigree, and the mean of the off-diagonal elements is 0. GOF is currently the most widely used G-matrix. If the amount of data is small, a G-matrix with an average diagonal coefficient not equal to 1 will result in a large additive variance. The normalized GN matrix can reduce the additive variance. GN can better correspond to the pedigree matrix (A-matrix) when pedigree information is needed and the inbreeding coefficient is low. GD has a higher pertinence to the trait affected by major genes. The calculation process of GD is relatively complex, but it is more effective in researching human genetic diseases (Amin et al., 2007) compared with GOF and GMF. However, how different G-matrices performed in GBLUP and which method was robust in different species were not investigated in previous studies.
The objective of this study was to compare the impacts of six G matrices on the accuracy of GBLUP. Four different species were used, namely, pigs, mice, wheat, and cattle, which also differed in population size and the number of genetic markers.
2 Materials and methods
2.1 Data
Four different species were used in the study, namely, pig, wheat, mice, and bull. Details of the data are shown in Table 1.
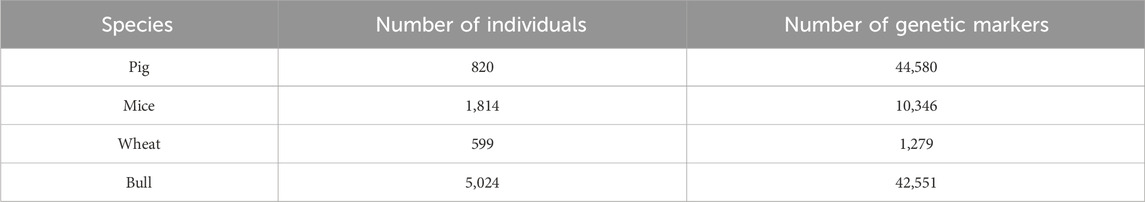
Table 1. Summary of datasets.
There were 820 commercial female pigs from a published study (Fan et al., 2011), which were genotyped using the Illumina PorcineSNP60 BeadChip. After quality control, 44,580 SNPs remained. Phenotypic traits comprised the 10th rib backfat (bf10), last rib backfat (lastrib), and loin muscle area at the 10th rib (LMA).
Mice and wheat datasets were obtained from the BGLR reference manual (https://cran.r-project.org/web/packages/BGLR/BGLR.pdf) of R software (de los Campos et al., 2009). The mice dataset was composed of 1,814 individuals, each genotyped for 10,346 polymorphic markers. The traits presented here were body mass index (Obesity_BMI), body weight (EndNormalBW), and body length (Obesity_BodyLength). The wheat dataset was from the Global Wheat Program of the International Maize and Wheat Improvement Center (CIMMYT), Mexico. Information was collected from 599 historical CIMMYT wheat lines. Wheat lines were genotyped using 1,447 Diversity Arrays Technology (DArT) generated by Triticarte Pty., Ltd. The number of DArT MMs after editing was 1,279. The environments in the trials were grouped into four typical agro-climatic regions, and the trait analyzed was the average grain yield (GY) of 599 wheat lines in each of these four mega-environments.
Bull data were derived from the study by Zhang et al. (2015), which used a German Holstein population of 5,024 bulls provided by Vereinigte Informationssysteme Tierhaltung w.V. (Zhang et al., 2015). All bulls were genotyped using the Illumina BovineSNP50 BeadChip (Matukumalli et al., 2009), and 42,551 SNPs remained after quality control. The three traits were milk fat percentage (FP), milk yield (MY), and somatic cell score (SCS), which had highly reliable conventional estimated breeding values. They may represent three genetic structures of complex traits, namely, one major gene and many small effect loci (FP), few moderate effect loci and many small effect loci (MY), and many small effect loci (SCS) (Hu et al., 2013; Zhang et al., 2014).
Genetic markers were screened by deleting SNPs with a minor allele frequency (MAF) less than 0.05.
2.2 GBLUP statistic model
The GBLUP model used in this study was as follows:
where
2.3 Genomic relationship matrix
The G-matrix was constructed based on genetic markers. This study compares the effects of six G-matrix construction methods on the accuracy of GBLUP.
SNP information was transformed into a digital matrix containing the number of minor alleles (M matrix), represented by 0, 1, and 2, respectively. The number of rows in M is the number of individuals (n), and the number of columns is the number of markers (m). M matrix times its transpose is MM′, which is the first method of constructing the G-matrix.
To set the mean values of the allele effects to 0, M was modified by subtracting 2
Allele frequencies should ideally be obtained from the unselected base population, but this was not available. Instead, these frequencies were expressed as 0.5 for all markers (G05), the average minor allele frequency (GMF), and the observed allele frequency of each SNP (GOF).
In the GN and GD method,
G is normalized in the GN method. We obtain the normalized GN by dividing by the mean of the trace of
For the GD method, the diagonal D-matrix is used to add weight to markers. D is a diagonal matrix in which all off-diagonal elements are 0, and the diagonal elements are calculated as follows:
GD modifies itself using the inverse of the markers’ expected variances rather than relying on the sum of expectations across multiple loci.
2.4 Cross-validation
K-fold cross-validation was used to test the accuracy of genomic prediction using different G-matrices. First, the data were divided into k folds. One fold was used as the test set each time, and the other folds were used as the training set. The training set was used to build the association between genetic markers and phenotypes. The test set was used to predict the phenotype based on the constructed model and compare it with real observations to verify the accuracy of genomic prediction.
For cross-validation, pigs and wheat were divided into 10 groups for phenotypic value prediction. Mice were randomly divided into 15 groups, and bulls were randomly divided into 32 groups. Notably, the number of individuals in one group in the wheat and mouse datasets was one less than the other groups, which did not affect the results (Wang et al., 2017).
GBLUP analysis is performed using self-coded scripts running in R software (R 4.1.1). The result analysis mainly refers to
where
2.5 Learning curves with bull data
The learning curve was used to compare the performance of genomic prediction strategies (Ou and Liao, 2019). To evaluate the effects of reference population size and marker density on the accuracy of genomic prediction across different genomic relationship matrices (G-matrices), we implemented a comprehensive sampling strategy involving systematic variations in both parameters.
We examined seven levels of reference population size (500, 1,000, 1,500, 2,000, 2,500, 3,000, and 4,000 bulls), with each size level independently replicated six times through random sampling to ensure robust estimates of prediction accuracy.
For the marker density analysis, we fixed the reference population size at 5,024 bulls and created 5 geometrically spaced density levels by subsampling from all available markers, specifically analyzing milk yield as our target trait. These density levels were generated by sampling one SNP per 16 markers (yielding 2,660 SNPs), per 8 markers (5,319 SNPs), per 4 markers (10,638 SNPs), and per 2 markers (21,276 SNPs) while maintaining consistent genomic distribution and quality control standards across all subsets.
All the scenarios used 10-fold cross-validation.
3 Results
3.1 Accuracy of phenotype prediction in pigs
The coefficients of determination (
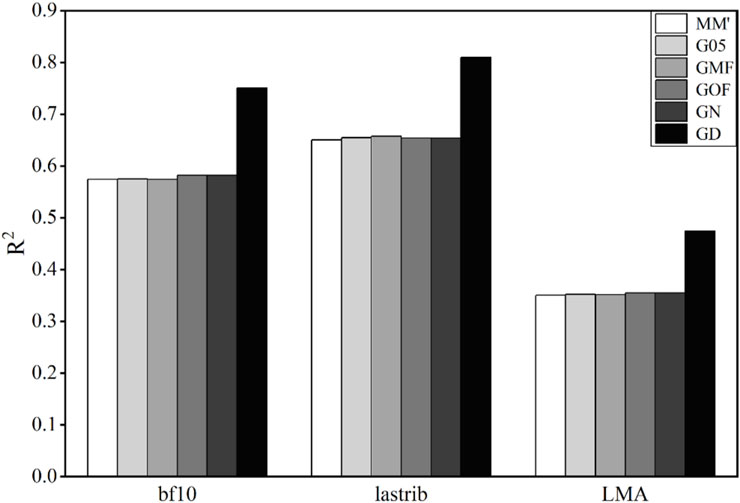
Figure 1. Coefficient of determination (
3.2 Accuracy of phenotype prediction in mice
Six methods were used to construct the G-matrix to predict obesity correlation traits of mice. The results of the model accuracies using these six matrices are shown in Figure 2.
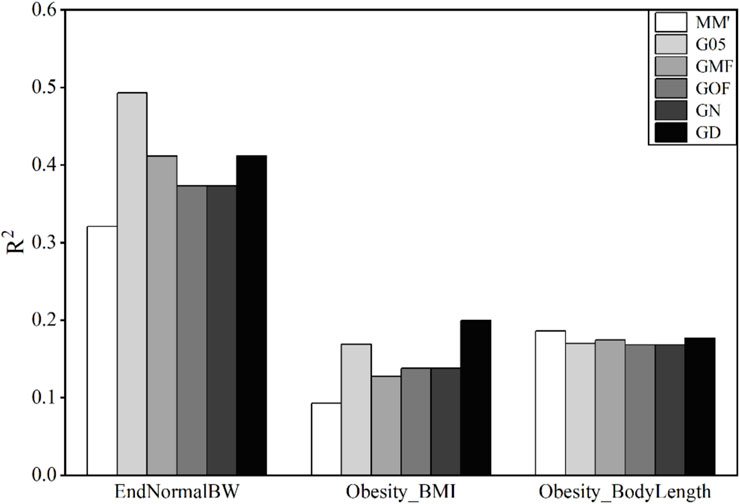
Figure 2. Coefficient of determination (
3.3 Accuracy of phenotype prediction in wheat lines
The traits of wheat used in this study were the average grain yield (GY) in four main agro-climatic regions. The accuracies of genomic prediction using these six matrices are shown in Figure 3.
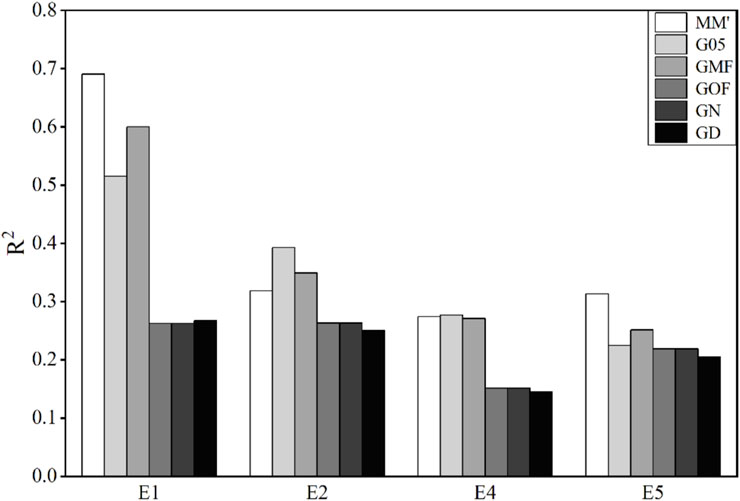
Figure 3. Coefficient of determination (
The accuracies of prediction of GY in E2, E4, and E5 environments are very low, and all values of
3.4 Accuracy of phenotype prediction in bulls
The results obtained using these six matrices to predict the traits of bulls are shown in Figure 4. Accuracies of genomic prediction for these three traits are very high. The average values of
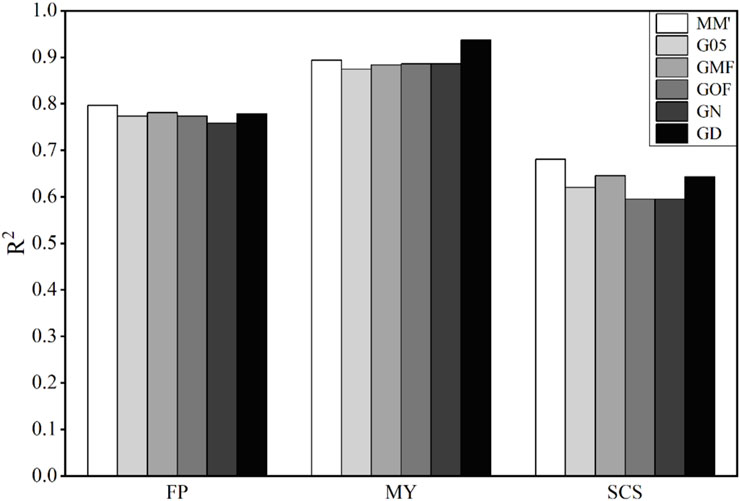
Figure 4. Coefficient of determination (
3.5 Comprehensive comparison
The average values of
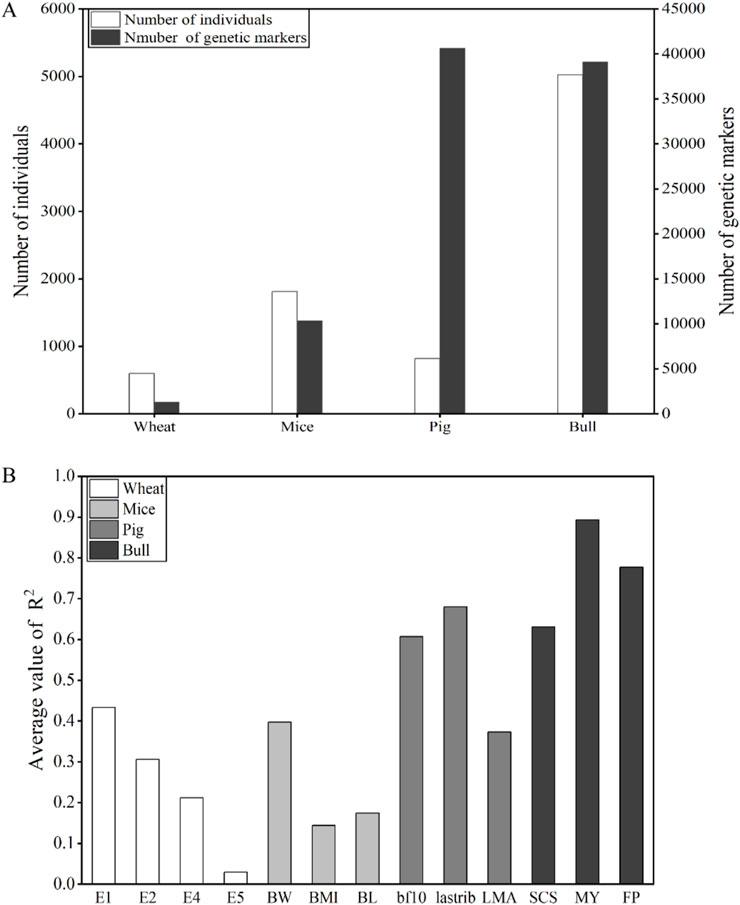
Figure 5. (A) Summary of the number of individuals and genetic markers. (B) Comparison of average values of
3.6 Learning curves with bull data
Figures 6A–C showed that reference population size significantly affected prediction accuracy across all three traits. Although accuracy consistently improved as population size increased from 500 to 5,024 individuals, none of the analyses reached a clear plateau, suggesting the potential for further gains with larger reference populations. The choice of the G-matrix showed trait-dependent effects on prediction accuracy. For milk yield, G-matrix selection had a substantial impact at smaller reference sizes (<2,000 individuals), with the GD matrix demonstrating superior performance in these scenarios. For somatic cell score (SCS), prediction accuracy was less sensitive to G-matrix construction methods across all population sizes. Marker density analysis for milk yield revealed that prediction accuracy plateaued at 10,638 markers (1/4 of the full panel), with minimal improvements observed when including additional markers (Figure 6D). The GD matrix consistently outperformed other approaches across most marker density levels, except when the marker density was 1/8 of the full panel.
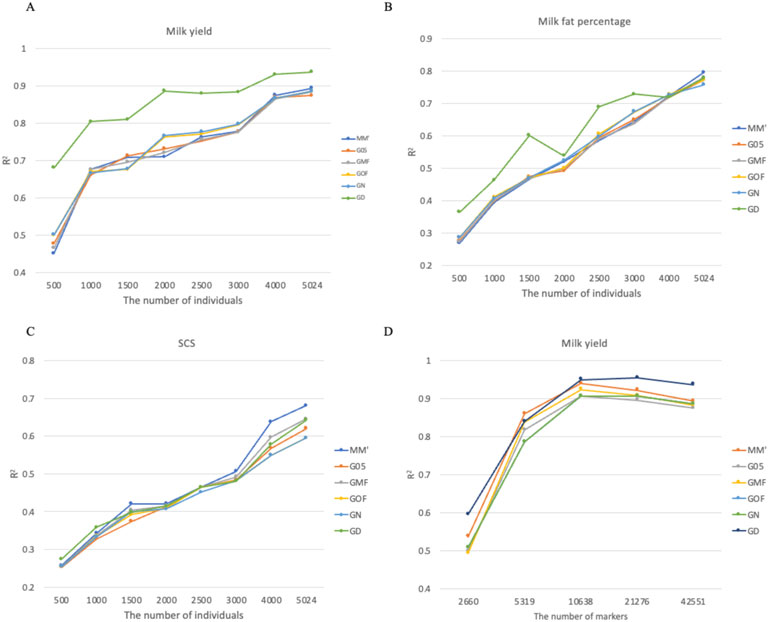
Figure 6. Effects of reference population size and marker density on the accuracy of genomic prediction across different G-matrices in bull data. (A) Coefficient of determination for milk yield using different G-matrices and the number of individuals. (B) Coefficient of determination for milk fat percentage using different G-matrices and the number of individuals. (C) Coefficient of determination for SCS using different G-matrices and the number of individuals. (D) Coefficient of determination for milk yield using different G-matrices and the number of markers.
4 Discussion
This study used datasets from four different species to investigate the impact of the G-matrix on the accuracy of genomic prediction. The coefficient of determination, which was calculated according to the sum of squared prediction errors, was used to measure the accuracies of genomic prediction. The results showed that the accuracies of prediction using different G-matrices were not consistent in mice, wheat, and pig data, but they were quite similar in bulls’ data. GD performed the best in all three traits of pigs, while G05, MM′, and GMF performed better than the other methods in wheat. GOF and GN obtained quite similar accuracies in most traits.
In most studies, the accuracy of genomic prediction is assessed using the squared correlation between genomic estimated breeding values (GEBVs) and pseudo phenotypes as the criterion (Ma et al., 2019). In this study, we used
The genotyping of wheat lines was performed using Diversity Arrays Technology (DArT) (Jaccoud et al., 2001). DArT markers generate binary (0/1) calls that primarily reflect the presence/absence variation (PAV) of genomic fragments rather than allelic dosage information. This means that the technology detects whether a specific genomic fragment is present (1) or absent (0) in a given sample, without differentiating between different allelic states or copy numbers across homologous chromosomes. For example, in hexaploid wheat (AABBDD genome constitution), if a DArT marker is present in at least one of the A sub-genome chromosomes, it will be scored as “1” (present), regardless of whether the marker is present or absent in the B or D sub-genomes.
The optimal method for constructing the G-matrix was not consistent in different species since the population structures were quite different. The single-marker weighted GD matrix could significantly improve the accuracy of prediction for pig traits, while the other five matrices showed no significant difference. The possible reason could be that these traits were affected by different loci, with the hypothesis that the markers were equally informative (Speed and Balding, 2015). The prediction accuracies of the three traits of bulls were high, and there were no significant differences in genomic prediction calculated using the six matrices, which may be due to the large size of the reference population and reliable phenotypes used in the bull data. The comparative analysis of the reference population size effects in bulls revealed patterns consistent with those observed in pig data. Notably, the GD matrix demonstrated superior predictive accuracy for milk yield at smaller reference population sizes (<2,000 individuals), mirroring its enhanced performance for porcine backfat and loin muscle area traits under similar conditions. This consistency across species indicates that the GD approach may be generally preferable for traits influenced by a mix of major and minor genes when working with limited reference data. G05 and GD could slightly improve the prediction accuracy of mouse traits. The mouse population was derived from eight different lines and had undergone more than 50 generations of random mating. According to the results, we inferred that constant a value of 0.5 was suitable for the heterogeneous population. Unlike the other three species, MM′, G05, and GMF could improve the prediction accuracy of wheat traits, and MM′ obtained the highest
The size of the reference population and the number of effective SNPs also influence the uncertainty of the estimated effect and variance, whose importance has been demonstrated in many studies (Daetwyler et al., 2008; MacEachern et al., 2009; Rolf et al., 2010; Solberg et al., 2008). The results of the four species were as follows: the average values of
The higher the heritability, the more the phenotype is influenced by gene control, and the more accurately the regression model predicted. However, the order of different methods for the traits of the same species was similar. The three pig traits used in this study had moderate to high heritability (Cabling et al., 2015). The accuracies of genomic prediction for two backfat traits were higher than that for LMA trait. SCS is affected by many small effect loci, and the
This result is also reflected in wheat yield projects. The accuracies of the G-matrix, obtained using the average allele frequency and MAF of 0.5, were higher than those of the other methods. This is related to the strong influence of the plant environment, unknown allele frequency, and a small number of reference populations and SNPs. The results indicated that the optimal method for constructing the G-matrix in genomic prediction was influenced by the population structure strongly rather than the genetic character of the traits. GOF and GN obtained similar accuracies for almost all the traits, and the reason was that these two methods were similar with the hypothesis that the number of individuals was high.
After deleting SNPs with MAF less than 0.05, the number of SNPs in pigs and bulls was 40,653 and 39,117, respectively. The changes in population numbers of wheat, mice, and bulls are consistent with the changes in the number of genetic markers. The number of individuals and genetic markers in bulls is abundant. The population size and genetic marker quantity of wheat and mice were lower. Pigs have a relatively small number of individuals but the largest number of genetic markers. The average values of
A limitation to this study is the consideration of additive effects only. Dominant variance components (DeVogel et al., 2021) could also be considered in the future if the traits were also affected by dominant effects.
5 Conclusion
Different G-matrix construction methods exhibit significant differences in the accuracy of prediction, especially for pig and wheat data. The performance of different G-matrix construction methods in various species was not consistent. Population structure could be considered one of the important factors for choosing the method of constructing the G-matrix. When the reference population and genetic marker density reached a certain scale, the six matrices in this study had little influence on the prediction accuracy of the GBLUP model.
Data availability statement
The data presented in the study are publicly available from the following sources. Mice and wheat datasets were obtained from the BGLR reference manual (https://cran.r-project.org/web/packages/BGLR/BGLR.pdf) of R software (de los Campos et al., 2009). Bull dataset was provided by Vereinigte Informationssysteme Tierhaltung w.V. Pig data was available from the previous published work of Fan et al., 2011.
Ethics statement
Ethical approval was not required for the studies involving animals in accordance with the local legislation and institutional requirements because publicly available datasets were used.
Author contributions
SW: formal analysis, investigation, methodology, writing – original draft, and writing – review and editing. YW: formal analysis, investigation, methodology, writing – original draft, and writing – review and editing. DL: methodology, supervision, writing – original draft, and writing – review and editing. XZ: writing – original draft, writing – review and editing, and data curation. QW: writing – original draft, writing – review and editing, methodology, and supervision. YP: supervision, writing – original draft, and writing – review and editing. MP: supervision, writing – original draft, writing – review and editing, funding acquisition, methodology, and project administration.
Funding
The author(s) declare that financial support was received for the research and/or publication of this article. This work was supported by the Shanghai Agricultural Science and Technology Innovation Program (B2024004) and the Natural Science Foundation of Shanghai (22ZR1431500). The funders had no role in the study design, data collection and analysis, decision to publish, or preparation of the manuscript.
Conflict of interest
The authors declare that the research was conducted in the absence of any commercial or financial relationships that could be construed as a potential conflict of interest.
Generative AI statement
The author(s) declare that no Generative AI was used in the creation of this manuscript.
Publisher’s note
All claims expressed in this article are solely those of the authors and do not necessarily represent those of their affiliated organizations, or those of the publisher, the editors and the reviewers. Any product that may be evaluated in this article, or claim that may be made by its manufacturer, is not guaranteed or endorsed by the publisher.
Supplementary material
The Supplementary Material for this article can be found online at: https://www.frontiersin.org/articles/10.3389/fgene.2025.1576248/full#supplementary-material
References
Amin, N., van Duijn, C. M., and Aulchenko, Y. S. (2007). A genomic background based method for association analysis in related individuals. Plos One 2 (12), e1274. doi:10.1371/journal.pone.0001274
Cabling, M. M., Kang, H. S., Lopez, B. M., Jang, M., Kim, H. S., Nam, K. C., et al. (2015). Estimation of genetic associations between production and meat quality traits in duroc pigs. Asian-Australasian J. Animal Sci. 28 (8), 1061–1065. doi:10.5713/ajas.14.0783
Daetwyler, H. D., Villanueva, B., and Woolliams, J. A. (2008). Accuracy of predicting the genetic risk of disease using a genome-wide approach. Plos One 3 (10), e3395. doi:10.1371/journal.pone.0003395
de los Campos, G., Naya, H., Gianola, D., Crossa, J., Legarra, A., Manfredi, E., et al. (2009). Predicting quantitative traits with regression models for dense molecular markers and pedigree. Genetics 182 (1), 375–385. doi:10.1534/genetics.109.101501
Desta, Z. A., and Ortiz, R. (2014). Genomic selection: genome-wide prediction in plant improvement. Trends Plant Sci. 19 (9), 592–601. doi:10.1016/j.tplants.2014.05.006
DeVogel, N., Auer, P. L., Manansala, R., Rau, A., and Wang, T. (2021). A unified linear mixed model for familial relatedness and population structure in genetic association studies. Genet. Epidemiol. 45 (3), 305–315. doi:10.1002/gepi.22371
Ding, X., Zhang, Z., Li, X., Wang, S., Wu, X., Sun, D., et al. (2013). Accuracy of genomic prediction for milk production traits in the Chinese Holstein population using a reference population consisting of cows. J. Dairy Sci. 96 (8), 5315–5323. doi:10.3168/jds.2012-6194
El-Kassaby, Y. A., Klápště, J., and Guy, R. D. (2012). Breeding without breeding: selection using the genomic best linear unbiased predictor method (GBLUP). New For. 43 (5), 631–637. doi:10.1007/s11056-012-9338-4
Fan, B., Onteru, S. K., Du, Z. Q., Garrick, D. J., Stalder, K. J., and Rothschild, M. F. (2011). Genome-wide association study identifies Loci for body composition and structural soundness traits in pigs. Plos One. 6 (2), e14726
Hu, Z. L., Park, C. A., Wu, X. L., and Reecy, J. M. (2013). Animal QTLdb: an improved database tool for livestock animal QTL/association data dissemination in the post-genome era. Nucleic Acids Res. 41 (Database issue), D871–D879. doi:10.1093/nar/gks1150
Jaccoud, D., Peng, K., Feinstein, D., and Kilian, A. (2001). Diversity arrays: a solid state technology for sequence information independent genotyping. Nucleic Acids Res. 29 (4), E25. doi:10.1093/nar/29.4.e25
Jonas, E., and de Koning, D. J. (2015). Genomic selection needs to be carefully assessed to meet specific requirements in livestock breeding programs. Front. Genet. 6, 49. doi:10.3389/fgene.2015.00049
Ma, P., Lund, M. S., Aamand, G. P., and Su, G. (2019). Use of a Bayesian model including QTL markers increases prediction reliability when test animals are distant from the reference population. J. Dairy Sci. 102 (8), 7237–7247. doi:10.3168/jds.2018-15815
MacEachern, S., Hayes, B., McEwan, J., and Goddard, M. (2009). An examination of positive selection and changing effective population size in Angus and Holstein cattle populations (Bos taurus) using a high density SNP genotyping platform and the contribution of ancient polymorphism to genomic diversity in Domestic cattle. BMC Genomics 10, 181. doi:10.1186/1471-2164-10-181
Matukumalli, L. K., Lawley, C. T., Schnabel, R. D., Taylor, J. F., Allan, M. F., Heaton, M. P., et al. (2009). Development and characterization of a high density SNP genotyping assay for cattle. PLoS One 4 (4), e5350. doi:10.1371/journal.pone.0005350
Momen, M., and Morota, G. (2018). Quantifying genomic connectedness and prediction accuracy from additive and non-additive gene actions. Genet. Sel. Evol. 50 (1), 45. doi:10.1186/s12711-018-0415-9
Ou, J. H., and Liao, C. T. (2019). Training set determination for genomic selection. Theor. Appl. Genet. 132 (10), 2781–2792. doi:10.1007/s00122-019-03387-0
Rolf, M. M., Taylor, J. F., Schnabel, R. D., McKay, S. D., McClure, M. C., Northcutt, S. L., et al. (2010). Impact of reduced marker set estimation of genomic relationship matrices on genomic selection for feed efficiency in Angus cattle. BMC Genet. 11, 24. doi:10.1186/1471-2156-11-24
Slatko, B. E., Gardner, A. F., and Ausubel, F. M. (2018). Overview of next-generation sequencing technologies. Curr. Protoc. Mol. Biol. 122 (1), e59. doi:10.1002/cpmb.59
Solberg, T. R., Sonesson, A. K., Woolliams, J. A., and Meuwissen, T. H. E. (2008). Genomic selection using different marker types and densities. J. Animal Sci. 86 (10), 2447–2454. doi:10.2527/jas.2007-0010
Speed, D., and Balding, D. J. (2015). Relatedness in the post-genomic era: is it still useful? Nat. Rev. Genet. 16 (1), 33–44. doi:10.1038/nrg3821
VanRaden, P. M. (2008). Efficient methods to compute genomic predictions. J. Dairy Sci. 91 (11), 4414–4423. doi:10.3168/jds.2007-0980
VanRaden, P. M., Van Tassell, C. P., Wiggans, G. R., Sonstegard, T. S., Schnabel, R. D., Taylor, J. F., et al. (2009). Invited review: reliability of genomic predictions for North American Holstein bulls. J. Dairy Sci. 92 (1), 16–24. doi:10.3168/jds.2008-1514
Wang, X., Li, L., Yang, Z., Zheng, X., Yu, S., Xu, C., et al. (2017). Predicting rice hybrid performance using univariate and multivariate GBLUP models based on North Carolina mating design II. Hered. (Edinb) 118 (3), 302–310. doi:10.1038/hdy.2016.87
Wright, S. (1922). Coefficients of inbreeding and relationship. Am. Nat. 56, 330–338. doi:10.1086/279872
Xu, S. (2017). Predicted residual error sum of squares of mixed models: an application for genomic prediction. G3 (Bethesda, Md.) 7 (3), 895–909. doi:10.1534/g3.116.038059
Zhang, H., Yin, L., Wang, M., Yuan, X., and Liu, X. (2019). Factors affecting the accuracy of genomic selection for agricultural economic traits in maize, cattle, and pig populations. Front. Genet. 10, 189. doi:10.3389/fgene.2019.00189
Zhang, Z., Erbe, M., He, J., Ober, U., Gao, N., Zhang, H., et al. (2015). Accuracy of whole-genome prediction using a genetic architecture-enhanced variance-covariance matrix. G3-Genes Genomes Genet. 5 (4), 615–627. doi:10.1534/g3.114.016261
Zhang, Z., Liu, J., Ding, X., Bijma, P., de Koning, D.-J., and Zhang, Q. (2010). Best linear unbiased prediction of genomic breeding values using a trait-specific marker-derived relationship matrix. Plos One 5 (9), e12648. doi:10.1371/journal.pone.0012648
Keywords: genomic relationship matrix, accuracy of prediction, different species, size of reference population, marker density
Citation: Wang S, Wei Y, Liu D, Zhang X, Wang Q, Pan Y and Ma P (2025) Impact of different genomic relationship matrix construction methods on the accuracy of genomic prediction in different species. Front. Genet. 16:1576248. doi: 10.3389/fgene.2025.1576248
Received: 13 February 2025; Accepted: 08 April 2025;
Published: 02 May 2025.
Edited by:
Tao Wang, Medical College of Wisconsin, United StatesReviewed by:
Leonardo Alfredo Ornella, Cubiqfoods SL, SpainYu Wang, Medical College of Wisconsin, United States
Copyright © 2025 Wang, Wei, Liu, Zhang, Wang, Pan and Ma. This is an open-access article distributed under the terms of the Creative Commons Attribution License (CC BY). The use, distribution or reproduction in other forums is permitted, provided the original author(s) and the copyright owner(s) are credited and that the original publication in this journal is cited, in accordance with accepted academic practice. No use, distribution or reproduction is permitted which does not comply with these terms.
*Correspondence: Yuchun Pan, cGFueXVjaHVuMTk2M0BhbGl5dW4uY29t; Peipei Ma, cGVpcGVpLm1hQHNqdHUuZWR1LmNu