 Iouri Chepelev
 Isaac T. W. Harley
 John B. Harley
- 1Research Service, US Department of Veterans Affairs Medical Center, Cincinnati, OH, United States
- 2Cincinnati Education and Research for Veterans Foundation, Cincinnati, OH, United States
- 3Rheumatology Section, Medicine Service, US Department of Veterans Affairs Medical Center, Aurora, CO, United States
- 4Department of Immunology and Microbiology, University of Colorado School of Medicine, Aurora, CO, United States
- 5Division of Rheumatology, Department of Medicine, University of Colorado School of Medicine, Aurora, CO, United States
Background: Systemic lupus erythematosus (SLE) is a chronic autoimmune condition with complex causes involving genetic and environmental factors. While genome-wide association studies (GWASs) have identified genetic loci associated with SLE, the functional genomic elements responsible for disease development remain largely unknown. Mendelian Randomization (MR) is an instrumental variable approach to causal inference based on data from observational studies, where genetic variants are employed as instrumental variables (IVs).
Methods: This study utilized a two-step strategy to identify causal genes for SLE. In the first step, the classical MR method was employed, assuming the absence of horizontal pleiotropy, to estimate the causal effect of gene expression on SLE. In the second step, advanced probabilistic MR methods (PMR-Egger, MRAID, and MR-MtRobin) were applied to the genes identified in the first step, considering horizontal pleiotropy, to filter out false positives. PMR-Egger and MRAID analyses utilized whole blood expression quantitative trait loci (eQTL) and SLE GWAS summary data, while MR-MtRobin analysis used an independent eQTL dataset from multiple immune cell types along with the same SLE GWAS data.
Results: The initial MR analysis identified 142 genes, including 43 outside of chromosome 6. Subsequently, applying the advanced MR methods reduced the number of genes with significant causal effects on SLE to 66. PMR-Egger, MRAID, and MR-MtRobin, respectively, identified 13, 7, and 16 non-chromosome 6 genes with significant causal effects. All methods identified expression of PHRF1 gene as causal for SLE. A comprehensive literature review was conducted to enhance understanding of the functional roles and mechanisms of the identified genes in SLE development.
Conclusions: The findings from the three MR methods exhibited overlapping genes with causal effects on SLE, demonstrating consistent results. However, each method also uncovered unique genes due to different modelling assumptions and technical factors, highlighting the complementary nature of the approaches. Importantly, MRAID demonstrated a reduced percentage of causal genes from the Major Histocompatibility complex (MHC) region on chromosome 6, indicating its potential in minimizing false positive findings. This study contributes to unraveling the mechanisms underlying SLE by employing advanced probabilistic MR methods to identify causal genes, thereby enhancing our understanding of SLE pathogenesis.
Introduction
Genome-wide association studies (GWASs) have identified thousands of genetic loci associated with common diseases and disease-related traits (www.ebi.ac.uk/gwas/). However, the functional genomic elements which exert causal effects on the phenotypes remain largely unknown. Genetic variants can causally affect a disease phenotype by altering gene product structure or quantitative levels of gene products. For Systemic Lupus Erythematosus (SLE), for example, nearly 200 apparently independent loci have been identified (1). Thousands of changes in gene expression are associated with the variants at these loci. Many of these relationships define mechanisms of gene regulation, but do not help determine whether they are related in any way to disease causality.
When the underlying assumptions are met, newer analytical methods of Mendelian Randomization (MR) offer the possibility of identifying causal relations between gene expression and disease. Herein we have applied multiple MR methods (2–5) using genetic data from SLE (6) and multiple sources of expression quantitative trait loci (eQTL) data (7–9).
In this work, therefore, we are concerned only with the modeling of a causal effect for levels of gene products, as indirectly inferred from mRNA gene expression data. Other models of causation, such as alleles leading to alternate protein sequence, are not evaluated. The genetic variants modulate gene expression levels, which in turn exert causal effects on the disease phenotype. Since the genetic variants are the underlying reason for the heritability of the disease phenotype, we naturally initiate the investigation with the potentially causal variants. However, due to linkage disequilibrium (LD), the causal potential for disease associated GWAS genetic variants is difficult to interpret. Thousands of variants are potentially causal for disease (candidate causal variants). Despite these problems, many statistical methods have been developed for causal variant discovery (10). However, due to the large number of genetic variants in the genome, these methods often have low statistical power to identify causal variants. These challenges have thus motivated the development of methods to prioritize candidate causal genes at GWAS loci; the resulting methods are potentially more statistically powerful since there is a smaller set of candidate genes, rather than considering millions of genetic variants in the genome.
Transcriptome-wide association studies (TWAS) leverage expression reference panels (eQTL data) to identify gene expressions associated with disease phenotype. However, TWAS projects can only identify gene-disease associations, but the association does not imply causation. Mendelian Randomization (MR) is an instrumental variable approach to causal inference based on data from observational studies, where genetic variants serve the role of instrumental variables (IV). The goal of this method is to identify the causal effect (variable in Figure 1A) of exposure X on the outcome Y, in the presence of unmeasured confounders C of the X-Y association. If the three IV assumptions shown in Figure 1B hold true, the classical MR method provides an unbiased estimate of (see Materials and Methods for details). However, if the IV assumptions are violated in the presence of the horizontal pleiotropy, which is widespread given the complexity of the genetics of living species (11), then the estimate of causal effect size made using the classical MR method is biased. Horizontal pleiotropy occurs when the genetic variant has an effect on outcome/disease outside of its effect on the “Exposure” (see Figure 1) in MR. There are two types of horizontal pleiotropy: uncorrelated pleiotropy, where the effects of genetic variants (G) on Y are uncorrelated with the effects of G on X, and correlated pleiotropy, where the effects of genetic variants (G) on Y are correlated with effects of G on X through confounders (C) (Figure 1). In the context of MR, newer methods accommodate both types of pleiotropy (3, 4, 12). Additional advances even allow for the analysis on a tissue-specific level (Materials and Methods) (2). By applying these methods using existing SLE loci as Instruments (IVs) and expression data as the Exposure we show that the three approaches suggest causation for a subset of the locus-gene expression dyads, thereby, providing a beginning to elucidate mechanisms for SLE using the MR approaches.
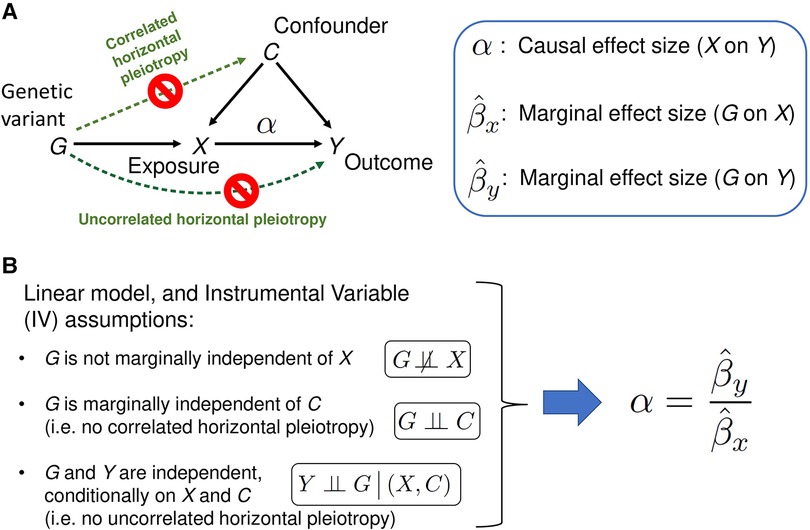
Figure 1. A schematic of the classical Mendelian randomization (MR) method. (A) A graphical model of classical MR. The directed acyclic graph represents the probabilistic dependencies of the random variables shown. The goal of the MR method is to estimate the causal effect of Exposure X on the Outcome (trait Y), using marginal effect sizes from the Exposure and Outcome GWAS (see Materials and Methods for details). Horizontal pleiotropy (green dotted arrows) occurs when the genetic variant has an effect on Outcome/disease outside of its effect on the Exposure X. There are two types of horizontal pleiotropy: uncorrelated pleiotropy, where effects of genetic variants G on Y are uncorrelated with effects of G on X, and correlated pleiotropy, where effects of genetic variants G on Y (directed path G→C→Y) are correlated with effects of G on X (directed path G→C→X). (B) If the Instrumental Variable (IV) assumptions hold, and the linear relation between the variables in the model is assumed, MR method can unbiasedly estimate the causal effect size as the ratio of G-on-Y to G-on-X effect sizes. When one or more of the IV assumptions are violated, such as when correlated and/or uncorrelated horizontal pleiotropic effects are present, the naïve estimate is biased. The second IV assumption, ‘G is marginally independent of C’, can be mathematically described as follows. Panel A's graphical model corresponds a joint probability distribution of four random variables. Summing over all possible outcomes of X and Y produces a marginal probability distribution of G and C: . If the marginal distribution factorizes as , then G and C are said to be marginally independent. Similarly, the third IV assumption, ‘G and Y are independent given X and C, can be understood as a factorization of the conditional probability distribution: .
In the last few years, MR methods have become increasingly sophisticated with heavy use of complex concepts and methods from theoretical statistics and statistical learning theory. In this work, we attempt a pedagogical exposition of the statistical theory behind the MR methods used in our analyses, with the hope that a wider range of investigators in genetics will be able to exploit the inner-workings of these methods to provide insight into disease mechanisms.
Results
Single-SNP summary data-based MR analysis
We used a two-step strategy to identify causal genes. In the first step, we assumed that horizontal pleiotropic effects are absent and applied the classical MR method to estimate causal effect of the gene expression (Exposure X) on SLE (Outcome Y) (as in Figure 1). In the second step, we applied advanced probabilistic MR methods to the genes identified in Step-1, without restrictive assumptions on the horizontal pleiotropic effects.
Let be the marginal effect size of a SNP (single nucleotide polymorphism) (Instrumental Variable G) on the gene expression (Exposure X) from the eQTL summary statistics data (Figure 1). Let be the marginal effect size of the same SNP (Instrumental Variable G) on the SLE (Outcome Y) from the SLE GWAS summary statistics data. When the Instrumental Variable (IV) assumptions hold, the classical MR method provides unbiased estimate of the causal effect size to be (Materials and Methods) (13, 14). We applied the classical MR method, as implemented in a two-sample MR method SMR (Summary data-based Mendelian Randomization) (5), to the whole-blood eQTL (expression quantitative trait locus) summary statistics data from the eQTLGen study (9) (sample size = 31,684 persons of European ancestry), and the SLE GWAS summary statistics data from (6) [sample size = 14,267 persons of European ancestry; 5,201 persons diagnosed with SLE and 9,066 persons without known SLE diagnosis; GWAS summary data was preprocessed using the QC algorithm DENTIST (15), Materials and Methods]. In two-sample MR, the Exposure and Outcome variables are measured on two non-overlapping sets of individuals.
We chose genes with at least one significant cis-eQTL (PeQTL < 5e-8) with transcription start sites (TSS) located within 500 kb of GWAS significant SNPs (PGWAS < 5e-8) for the SMR analysis (Materials and Methods). For each gene chosen for the SMR analysis, its top cis-eQTL SNP was used as the Instrumental Variable. The causal effects of expressions of 142 genes were identified as being statistically significant by the SMR method (Bonferroni corrected p-value < 0.05; Nominal p-value < 9e-5) (Figure 2 and Supplementary Table S1). Of these genes, 99 are from the chromosome 6 and 43 are from the rest of the genome. Ninety-five of the chromosome 6 genes are from the extended MHC region (xMHC, hg19 region chr6:25Mb–34Mb). 68 of these genes are from the classical MHC region (MHC, hg19 region chr6:28.5Mb–33.4Mb).
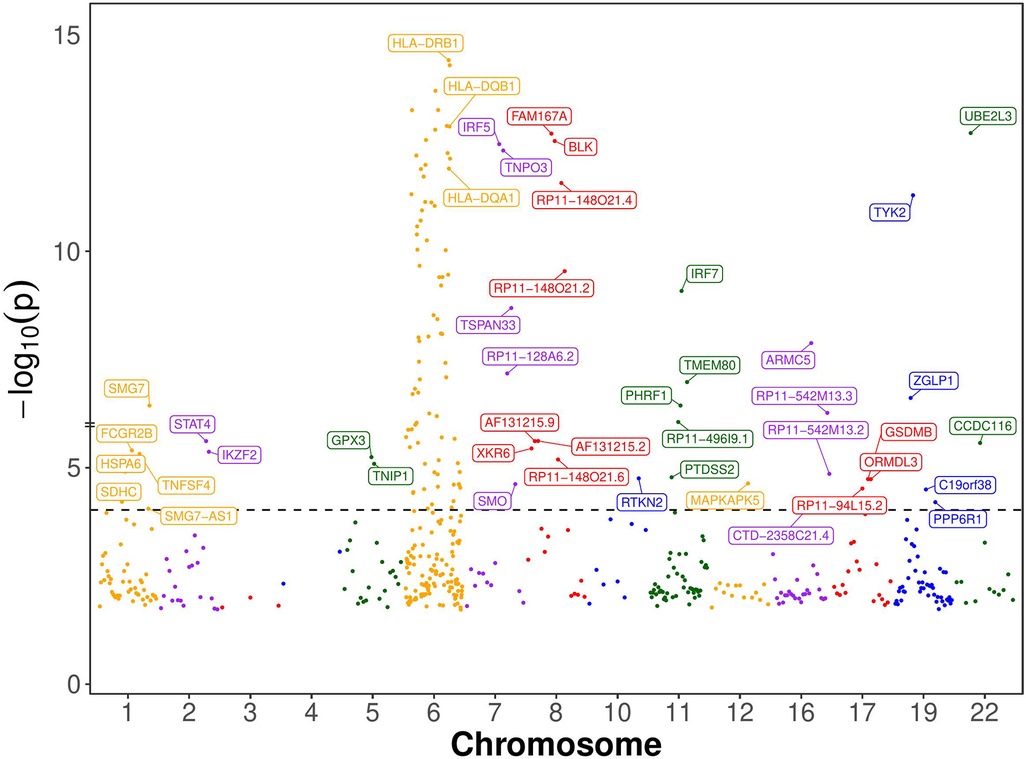
Figure 2. Manhattan plot of SMR-significant genes. Named are the 43 non-chromosome 6 and 3 chromosome 6 genes whose expression has statistically significant causal effect on SLE according to the single-SNP SMR method, which presupposes that the Instrumental Variable (IV) assumptions hold (see Figure 1B). The dotted horizontal line is at the nominal causal effect p-value threshold of 0.05/531 (Bonferroni correction for 531 multiple statistical tests). Only 3 important genes from chromosome 6 are labeled, and the rest are not labeled to avoid clutter. The genes’ order on the chromosome is maintained, but their location is not shown to scale for clarity.
Genetic variants are known to exhibit widespread horizontal pleiotropic effects (11). The IV assumptions underpinning the classical MR method are thus likely to be violated, with the implication that there may also be some false positives among the 142 putative causal genes identified by the SMR method. Thus, we applied advanced MR methods capable of performing inference in the presence of invalid Instrumental Variables to analyze the 142 genes identified earlier. Our two-step strategy can be motivated as follows. The SMR algorithm assumes that horizontal pleiotropy is absent, which can lead to false positives in gene discovery. Addressing these false positives is our primary concern, so we applied additional filtering to the genes identified by SMR in step-1. Our aim was to employ advanced MR methods as filters. Applying these advanced MR methods on the entire dataset instead would have introduced challenges related to multiple testing due to the large number of genes.
Modelling uncorrelated horizontal pleiotropy with PMR-Egger
If IV assumptions of the classical MR method can be violated by the horizontal pleiotropy, why not explicitly model it? This is the approach taken in recent studies (3, 4, 12, 16–19). For a recent review of these methods, see (20). The idea is to jointly estimate the parameters characterizing the horizontal pleiotropy and causal effect size using summary statistics from the Exposure and the Outcome GWAS. PMR-Egger (4), a probabilistic MR method, explicitly models uncorrelated horizontal pleiotropy (see Materials and Methods, and Figure 3 for a concise description of the method). The European whole-blood eQTL summary statistics data from the eQTLGen study (9), the European population SLE GWAS summary statistics data from (6), and the LD structure from the European 1KG data, was used as input data for the PMR-Egger method.
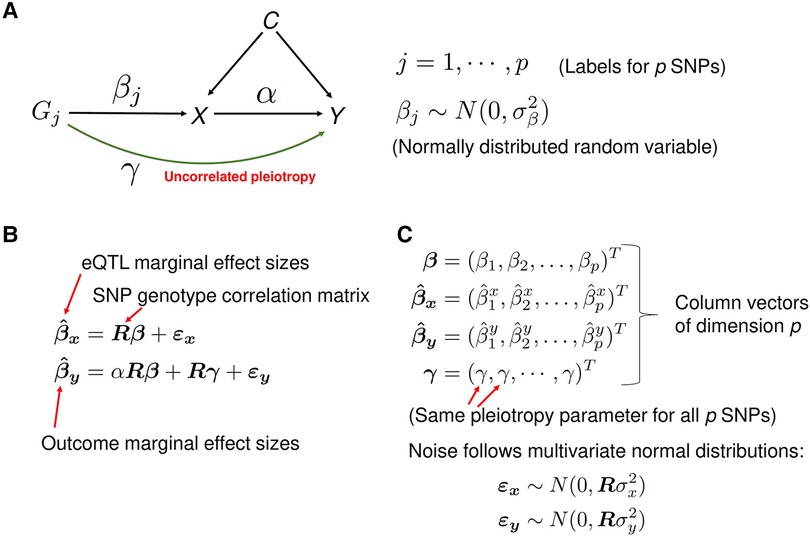
Figure 3. A description of the PMR-Egger method. (A) A graphical representation of the statistical model. The model is used to estimate the causal effect of gene expression X on the trait Y of interest, in the presence of the uncorrelated horizontal pleiotropic effect . Correlated pleiotropic effects are assumed to be absent. For each , the random variable represents the effect size of genetic variant (cis-SNP) on the gene expression X and is assumed to follow the normal distribution with mean zero and the variance . These random variables are assumed to be independent of each other. (B) The matrix equations representing the mixed-effects statistical model from panel A. For example, the first equation states that the vector of marginal effect sizes of p cis-SNPs on exposure variable X (gene expression) is equal to the matrix-product of matrix R (SNP-SNP genotype correlation matrix) and the vector of effect sizes of the p cis-SNPs on exposure X, plus a noise vector. The matrix and vectors in the equations are emphasized in boldface. (C) A detailed description of some variables in the equations from the panel B. Column vectors of dimension p are represented as a transpose (‘T’) of row vectors. The noise terms and follow the multivariate normal distributions with mean zero and covariance matrix and , respectively, where R is the SNP-SNP genotype correlation matrix.
From the set of 142 genes identified by SMR method, we selected 97 genes based on the criterion that the SNP set Sg for each gene g contains at least 25 statistically significant (PeQTL < 5e-8) eQTL SNPs (for the details and a heuristic motivation for the cutoff of 25 SNPs, see Materials and Methods). We performed PMR-Egger analysis on each of these 97 genes using the eQTL and SLE GWAS summary statistics data, and the LD data restricted to SNPs from the set Sg for each gene g.
The PMR-Egger method has identified 13 non-chromosome 6 and 34 chromosome 6 genes with statistically significant causal effect sizes (causal effect p-value < 0.05) (see Figure 4, Table 1 and Supplementary Table S1). Due the complexity of the MHC locus on chromosome 6, the results for chromosome 6 are likely to be unreliable. For a discussion of this issue, see ‘Comparison of analysis results from three MR methods’ Section below.
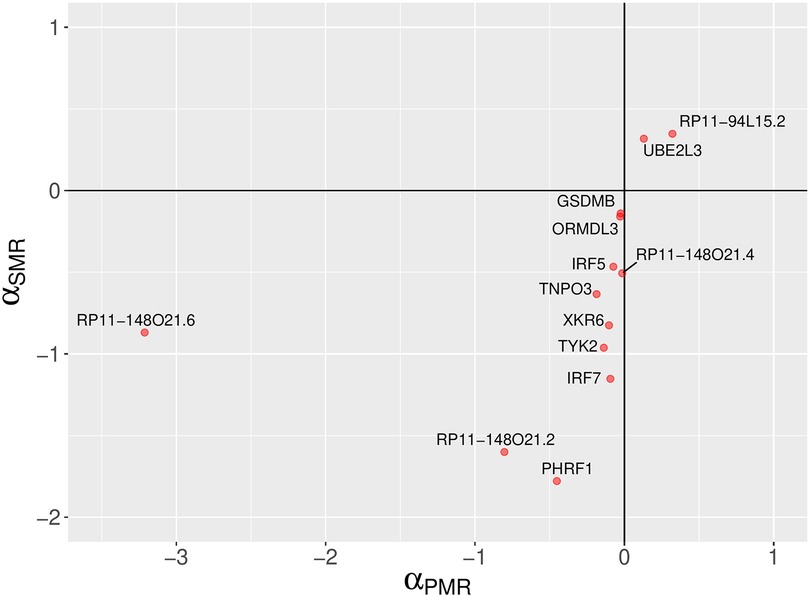
Figure 4. A comparison of PMR-Egger and SMR causal effect sizes. A scatter plot depicting SLE causal effect sizes of non-chromosome 6 genes which are statistically significant according to the probabilistic MR method (PMR-Egger). The signs of the causal effect sizes estimated using two methods agree. The PMR-Egger method models the uncorrelated horizontal pleiotropic effects, but assumes that the correlated horizontal pleiotropy is absent.
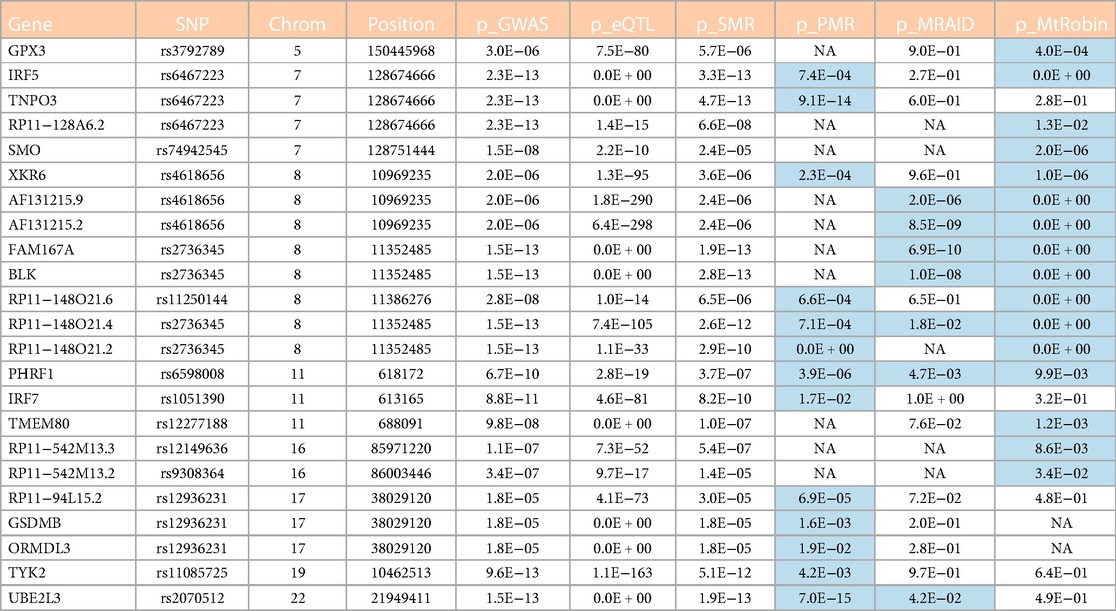
Table 1. Candidate causal genes from outside of the chromosome 6 identified in this study. See also Figure 13A. Cells with p-value < 0.05 in the table are highlighted in light blue color. The table column names are described as follows. Gene: Symbol representing the gene; SNP: ID of the most significant eQTL SNP associated with the gene; Chrom: ID of chromosome where the gene and SNPs are located; Position: Chromosomal position (base-pair) of the top eQTL SNP associated with the gene; p_GWAS: SLE GWAS p-value of the top eQTL SNP; p_eQTL: eQTL p-value of the top eQTL SNP; p_SMR: p-value for the gene causal effect size estimate by SMR method; p_PMR: p-value for the gene causal effect size estimate by PMR-Egger method; p_MRAID: p-value for the gene causal effect size estimate by MRAID method; p_MtRobin: p-value for the gene causal effect size estimate by MR-MtRobin method. ‘NA’ in the cells: data not available because of technical issues such as ‘algorithm generated errors’ and ‘insufficient number of genetic variants at the locus to reliably estimate causal effect size’.
PMR-Egger method estimates the causal effect size , the uncorrelated horizontal pleiotropy level (see Figure 3) and the corresponding statistical significance p-values and . Interestingly, we found no evidence of uncorrelated pleiotropy for the 13 non-chromosome 6 significant genes ( and median ). On the other hand, the median pleiotropy p-value () for the statistically non-significant genes (those with the causal effect p-value ) is 3e-6. This means that genes whose causal effects on SLE are not significant according to PMR-Egger have high uncorrelated pleiotropy levels. The SMR method incorrectly identified these genes as being causal due to the invalid IV assumption that horizontal pleiotropy was absent. On the other hand, the PMR-Egger method, by explicitly taking into account the uncorrelated horizontal pleiotropy in the statistical modelling, shows that the expression of many genes does not have statistically significant causal effects on SLE under the model being tested.
Despite being statistically significant, the causal effect sizes estimated using PMR-Egger method are small (Figure 4 and Supplementary Table S1). However, absolute values of causal effect sizes should not be taken literally because the SLE GWAS summary statistics were calculated using a logistic regression for a binary trait (case-control study). On the other hand, almost all MR methods, including the methods used in this work, assume continuous trait values in linear models. Thus, the MR methods treat binary trait values as continuous, which is not fully justified. Thus, it may be more appropriate to focus on the statistical significance level (p-value) and interpret the causal effect size only semi-quantitatively. Nevertheless, despite the technical limitations of MR methods, our study findings demonstrate consistent estimates of the direction of causal effects across all four MR methods employed for the majority of genes identified (Figures 4–6).
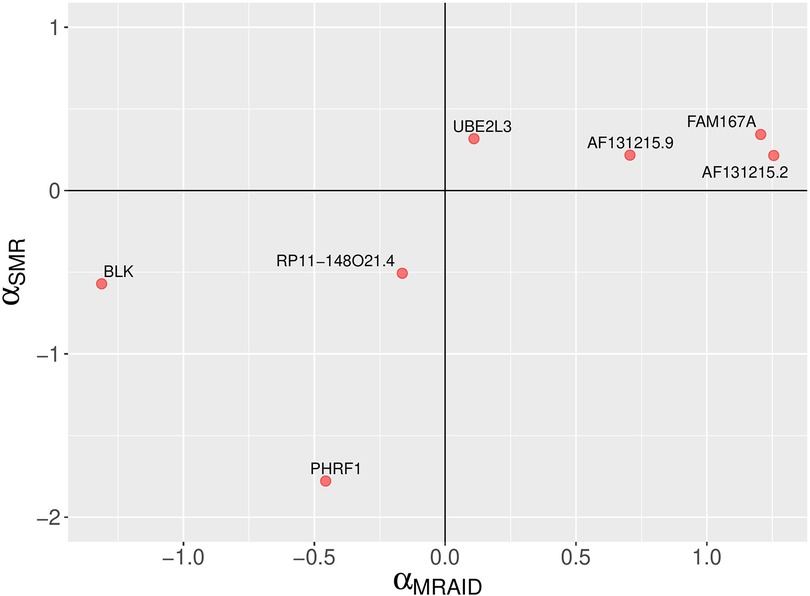
Figure 5. A comparison of MRAID and SMR causal effect sizes. A scatter plot depicting SLE causal effect sizes of non-chromosome 6 genes which are statistically significant according the MRAID method. The MRAID method models both uncorrelated and correlated horizontal pleiotropic effects. The signs of the causal effect sizes estimated using two methods agree.
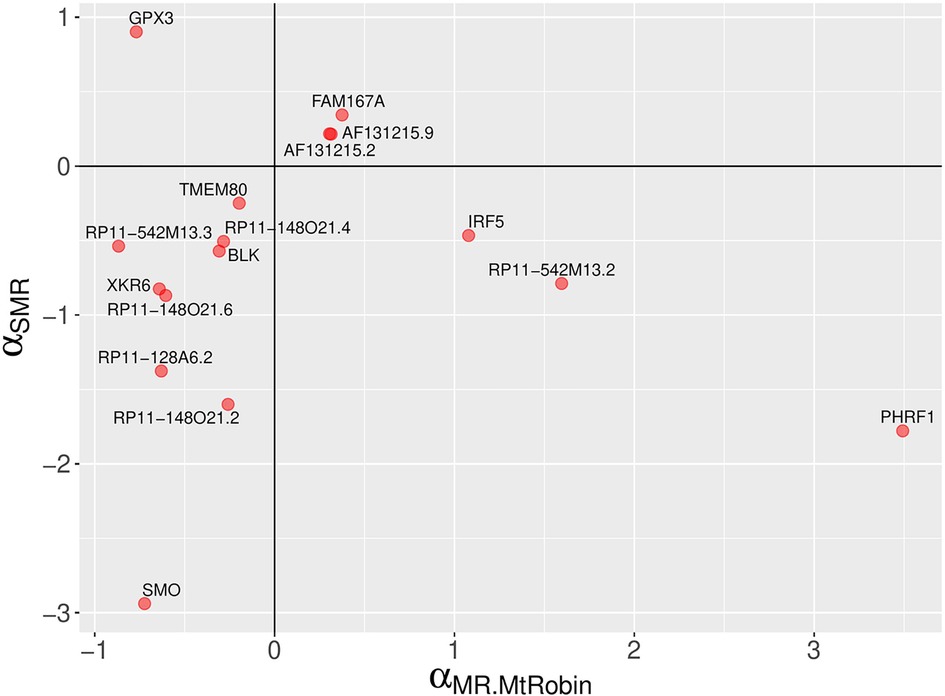
Figure 6. A comparison of MR-MtRobin and SMR causal effect sizes. A scatter plot depicting SLE causal effect sizes of non-chromosome 6 genes which are statistically significant according the MR-MtRobin method applied to the DICE and LCL eQTL data. This method implicitly models both uncorrelated and correlated horizontal pleiotropic effects. The signs of the causal effect sizes estimated using two methods agree for all but four genes.
Modelling correlated and uncorrelated horizontal pleiotropic effects using MRAID
PMR-Egger statistical model described above imposes a restrictive assumption on the model: the absence of correlated pleiotropic effects. The correlated pleiotropy is present when effects of genetic variants on Outcome Y are correlated with effects on Exposure X [Figure 1 and (12)]. MRAID (MR with Automated Instrument Determination) is a probabilistic MR method for causal inference with correlated SNP instruments in the presence of both correlated and uncorrelated horizontal pleiotropic effects (3). For a concise description of the MRAID model, see Figure 7 and Materials and Methods. MRAID was originally developed for causal inference of complex traits exposures, but, to the best of our knowledge, has not yet been applied to gene expression exposures in published work.
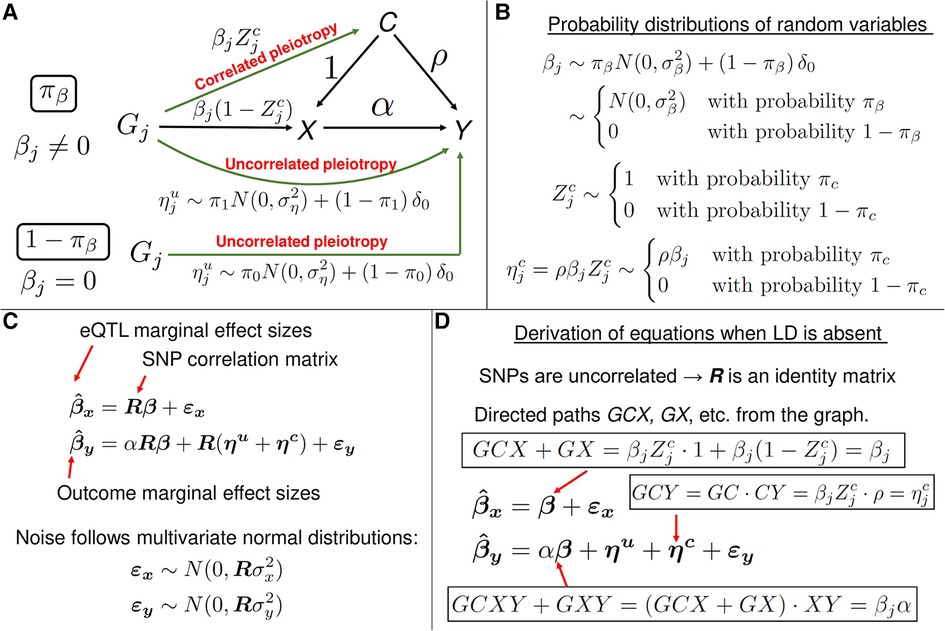
Figure 7. A description of the MRAID method. (A) A graphical representation of the statistical model. The model is used to estimate the causal effect of gene expression X on the trait Y of interest, in the presence of the uncorrelated and correlated horizontal pleiotropic effects. In this mixed-effects model, the variables and are fixed effects, and the other variables are random effects. (B) The random effect variables in the model follow mixture probability distributions. For instance, with the probability , the random variable follows a normal distribution and is identically equal to zero with the probability . In the latter case, the genetic variant does not directly affect the gene expression X, but has a direct uncorrelated pleiotropic effect on the outcome Y. With the probability , the random variable is equal to zero, which results in the vanishing correlated horizontal pleiotropy random variable . When , the effect size of genetic variant (cis-SNP) on the gene expression X is non-zero and is equal to . (C) The matrix equations representing the mixed-effects statistical model from panel A. The equation for is formally identical to the corresponding equation from the PMR-Egger method (see Figure 3B). In the linear equation for , the first three terms on the right-hand side are of the form: matrix R times a vector random variable. Thus, the variables are a priori not distinguishable. However, thanks to assumptions on distributions of the random variables (see panels (A) and (B)), the variables are distinguishable and the method can infer the parameters of the probability distributions. (D) A heuristic derivation of mixed-model equations from panel C when all SNPs are in linkage equilibrium. In the latter case, SNPs are uncorrelated and the SNP-SNP genotype correlation matrix R becomes the identity matrix, and R can then be erased from the equations. The right-hand side of equation for can be understood as follows. In the graph from panel A, there are two directed paths from to X: GCX and GX. The value of is the sum of the contributions from these two paths and the noise term. The value of the directed path GCX is the product of the values of the directed paths GC and CX. Similarly, the value of is the sum of the contributions from the directed paths GCY, GCXY, GXY and GY, and the noise term. The equations in the general case of correlated SNPs can be understood as R-weighted contributions to marginal effect size of a SNP from the tagged SNPs which are in LD.
For MRAID analysis, we used the same whole-blood eQTL, SLE GWAS summary statistics, LD structure data as described earlier for the PMR-Egger analysis. From the set of 142 genes identified by SMR method, we selected 97 genes and the corresponding sets (Sg for each gene g) of statistically significant (PeQTL < 5e-8) eQTL SNPs (see Materials and Methods). We performed MRAID analysis on each of these 97 genes using the eQTL and SLE GWAS summary statistics data, and the LD data restricted to SNPs from the set Sg for each gene g. The MRAID method has identified 7 non-chromosome 6 and 6 chromosome 6 genes with statistically significant causal effect sizes (causal effect p-value < 0.05) (see Figure 5, Table 1 and Supplementary Table S1).
Multi-cell type MR analysis
The MR analyses described so far used whole-blood eQTL data generated from over 31 thousand individuals in the eQTLGen project (9). We sought to replicate our findings in an independent data set from different immune cell types. To this end, we applied MR-MtRobin method (2) to the eQTL datasets from the DICE project (15 immune cell types from 90 Europeans) and GEUVADIS lymphoblastoid cell lines (LCLs from 445 Europeans) (7). We included LCL data in our analysis because these cell lines are infected with Epstein-Barr virus (EBV), which is a strong etiologic candidate for causing SLE and Multiple Sclerosis (MS) (21–23). LCLs are stable transformed cell lines that express EBV's Latency III program. Notably, the EBV gene product and transcription co-factor, EBNA2, is enriched at the genetic loci associated with the risk of both SLE and MS (24). A comparison of the gene expression profile of SLE risk genes across 459 different cell/tissue types revealed that EBV-infected B cells (LCLs) had the strongest representation of highly expressed SLE risk genes (25).
For a concise description of the MR-MtRobin model, see Figure 8 and Materials and Methods. The MR-MtRobin method uses a mixed-effects linear statistical model which relates cell-type specific eQTL effect sizes (dependent variables) to GWAS effect sizes (independent variables) in what effectively amounts to a weighted reverse regression analysis (‘reverse’ because of the inversion in the roles of dependent and independent variables), with the weights given by reciprocals of squares of standard errors in estimate of eQTL effect sizes (Figures 8–10 and Materials and Methods). The MR-MtRobin method has identified 16 non-chromosome 6 and 21 chromosome 6 genes with statistically significant causal effect sizes (causal effect p-value < 0.05) (see Figure 6, Table 1 and Supplementary Table S1).
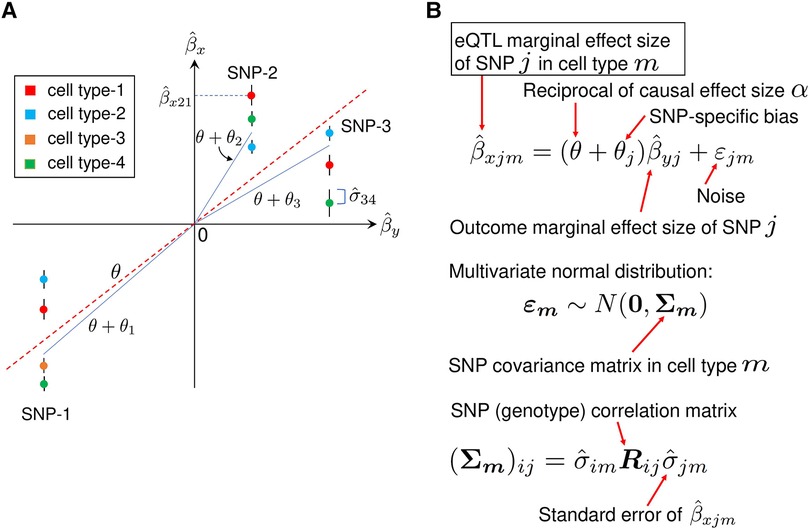
Figure 8. A description of MR-MtRobin method. (A) An illustrative plot depicting a weighted linear regression of cell type-specific eQTL effect sizes against the effect sizes from the trait Y GWAS. Artificially generated data points for three SNPs in four cell types are shown. The error bars represent standard errors of effect sizes from the cell type-specific eQTL summary statistics data. The effect sizes of SNP-1 eQTL are statistically significant in four cell types, while those of SNP-2 and SNP-3 are significant in three cell types only. Each vertical cluster of data points corresponds to a single SNP. A blue line connecting the origin with a point in a vertical cluster for each SNP represents a statistical fit of the weighted linear regression model described in the panel B, with the estimated SNP-specific slope parameter equal to for SNP-k. For each SNP, the data points with smaller eQTL effect size standard errors receive larger weights (the end points of the blue lines are closer to such data points). The red dotted line with the slope , which is the reciprocal of the X-on-Y causal effect size , represents an overall linear relationship between and . (B) The mixed-effects linear model. In the linear relationship between cell type-specific eQTL effect sizes and GWAS effect sizes , is a fixed effect and are SNP-specific random effects. The noise term in the equation is cell type specific and depends on the structure of SNP-SNP genotype correlations. Specifically, for the cell type m, the vector follows a multivariate normal distribution with mean zero and the covariance matrix whose elements are the products of eQTL standard errors in cell type m and SNP genotype correlation matrix elements.
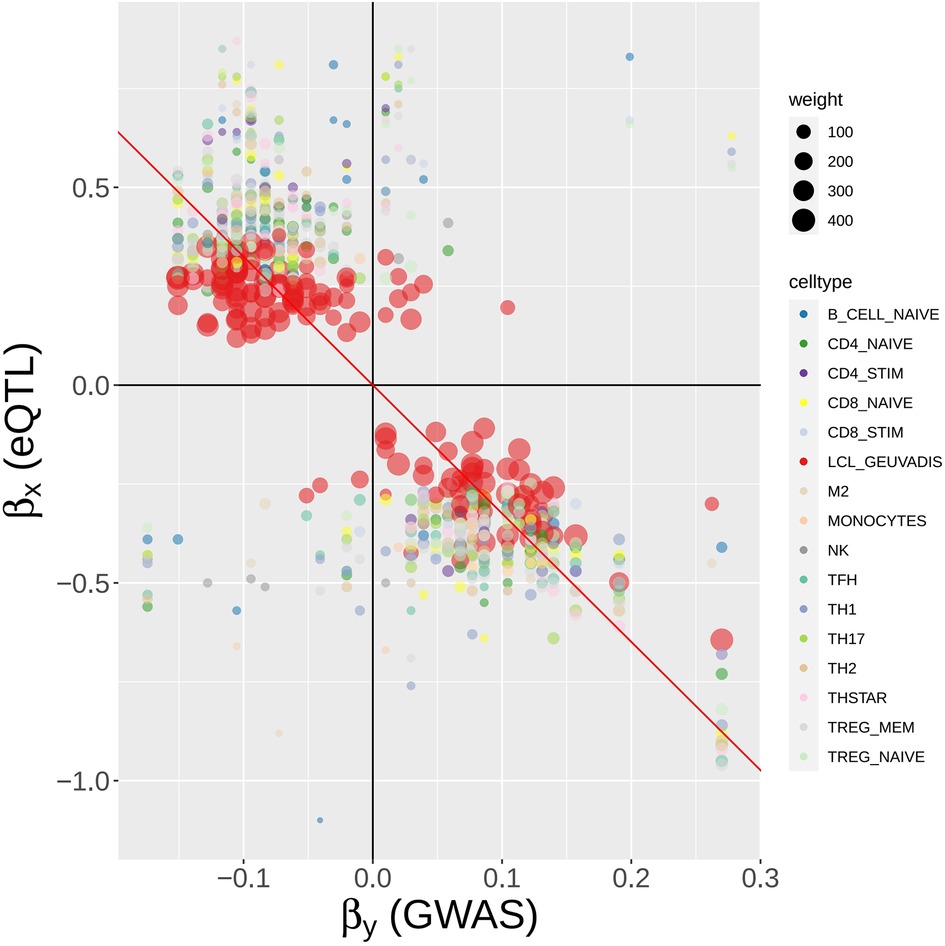
Figure 9. MR-MtRobin weighted linear regression analysis for the causal effect of BLK gene expression on SLE. For a description of the model, see Figure 8 and Materials and Methods. A scatter plot of SLE GWAS vs. cell type-specific eQTL effect sizes of cis-SNPs in the neighborhood of BLK gene. Each colored circle represents a SNP in a particular cell type (see color to cell type dictionary on the right), with the size of the circle being proportional to the weight , where is the standard error of the estimate for eQTL effect size of the SNP j in the cell type m (see Figure 8) – the more accurate the estimate is, the larger the weight is. The weights are largest for LCL eQTLs due to the larger sample size (n = 445) of the LCL eQTL study. The slope of the black line through origin represents the fixed effect of the model (see Figure 8).
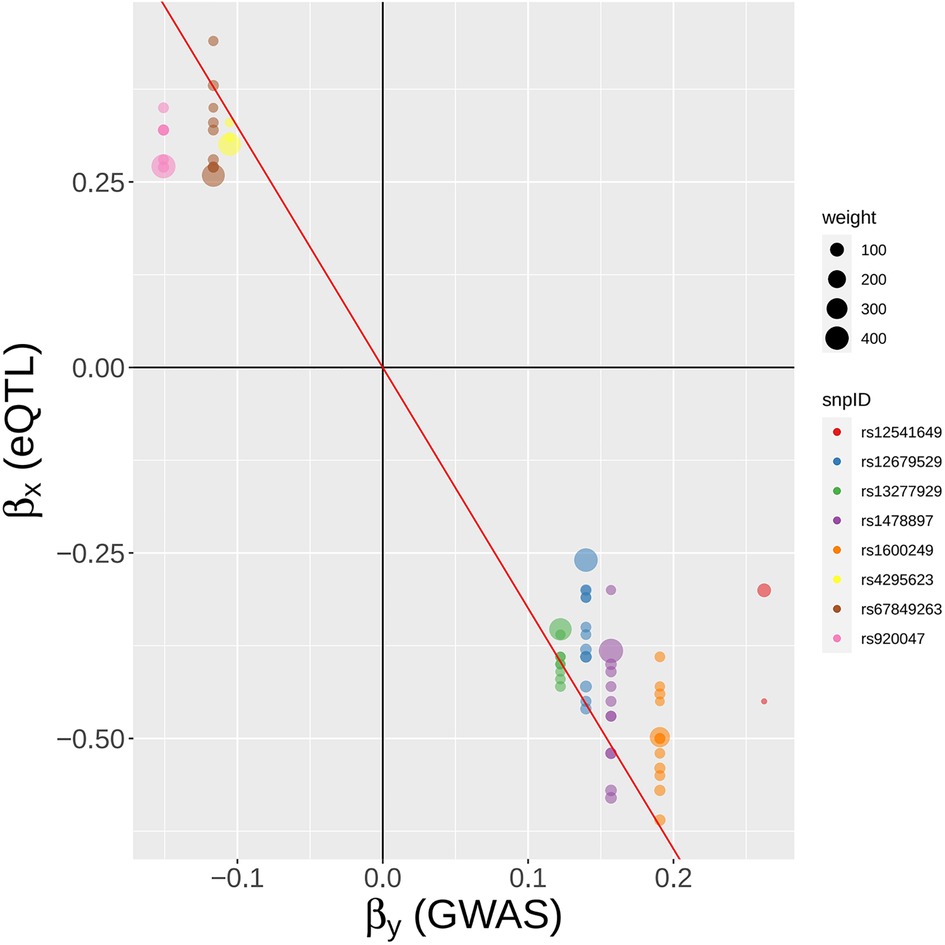
Figure 10. A SNP-centric view of MR-MtRobin analysis for the causal effect of BLK gene expression on SLE. To ensure clarity, only a selection of the top GWAS SNPs is depicted.
Interestingly, among the 16 non-chromosome 6 genes, MR-MtRobin and SMR methods demonstrated a discrepancy in the direction/sign of causal effect size estimates for four genes (see Figure 6). To investigate the reason for this inconsistency, we conducted an analysis of scatter plots comparing multi-cell type eQTL effect sizes vs. GWAS effect sizes (Figure 11). Notably, the LCL cell line (shown in red color) has the most substantial impact on the causal effect size estimates by MR-MtRobin due to its larger sample size (n = 445) compared to the smaller sample sizes (n = 90) of eQTL data from other cell types. When the MR-MtRobin analysis included the LCL eQTL data alongside other cell types’ eQTL data, the causal effect of PHRF1 is positive, equaling 3.5 (p-value = 0.099, Supplementary Table S1), which aligns with the red data points following a positive slope line (red line in Figure 11A). Conversely, when the analysis excluded the LCL eQTL data, the causal effect of PHRF1 became negative, equaling −0.5 (although statistically not significant: p-value = 0.33), in agreement with the data points for non-LCL cell types following a negative slope line (blue dashed line in Figure 11A) and consistent with the direction of the causal effect estimate obtained by SMR analysis using whole blood eQTL data. However, for the other three genes (IRF5, GPX3, and RP11-542M13.2), the exclusion of LCL eQTL data did not lead to a reversal of the causal effect estimates by MR-MtRobin [Causal effect estimates of these genes with LCL data included in MR-MtRobin analysis: 1.1 (p-value = 0), −0.77 (p-value = 0.0004) and 1.6 (p-value = 0.034), see Supplementary Table S1; Causal effect estimates when LCL data are excluded from the analysis: 1.6 (p-value = 0.57), −0.64 (p-value = 0.0004) and 4.1 (p-value = 0.7)] (Figures 11B–D). The direction/sign of causal effect size estimates for the remaining 12 genes shown in Figure 6 stay consistent between SMR and MR-MtRobin when the LCL data is excluded from the MR-MtRobin analysis. Achieving more consistent estimates of the direction of causal effects would necessitate larger and more balanced multi-cell type eQTL data sets, and advanced MR methods capable of incorporating cell type-specific eQTL effects in statistical models. For completeness, we report the Venn diagram comparisons of statistically significant (p-value < 0.05) genes identified by MR-MtRobin method with and without LCL eQTL data (Figure 12).
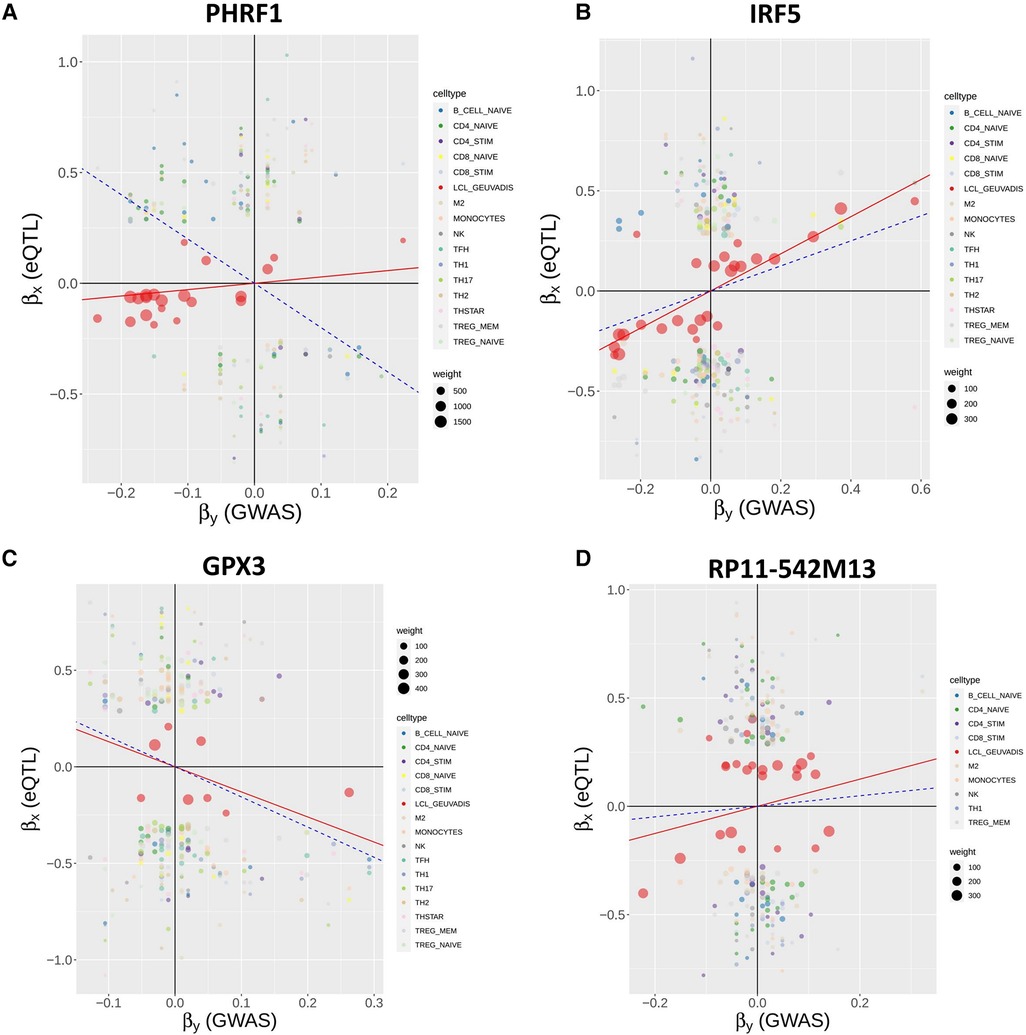
Figure 11. Reversal of causal effect direction estimates by MR-MtRobin due to cell type-specific eQTL effects and unbalanced eQTL sample sizes. MR-MtRobin weighted linear regression analysis for the causal effects of expressions of four genes on SLE. For a description of the model, see Figure 8 and Materials and Methods, and for a description of the scatter plots, see Figure 9 legend. The largest contribution to the causal effect size estimate is from the LCL cell line (data points shown in red color) due to the larger sample size (n = 445) of the LCL eQTL data compared to the smaller sample sizes (n = 90) of eQTL data for other cell types. The slope of red line for each gene represents the reciprocal of causal effect size () estimate with LCL cell line data included in the MR-MtRobin analysis, while the blue dashed line shows the same with LCL data excluded from the analysis. (A) For PHRF1 gene, the data points for LCL (red circles) are aligned along the red line with a positive slope. The data points for other cell types are more consistent with the negative slope blue dashed line. The MR-MtRobin causal effect sizes of PHRF1 with and without LCL eQTL data included in the MR-MtRobin analysis are and , respectively (see Supplementary Table S1). (B-D) Scatter plots for IRF5, GPX3 and RP11-542M13 genes, respectively.
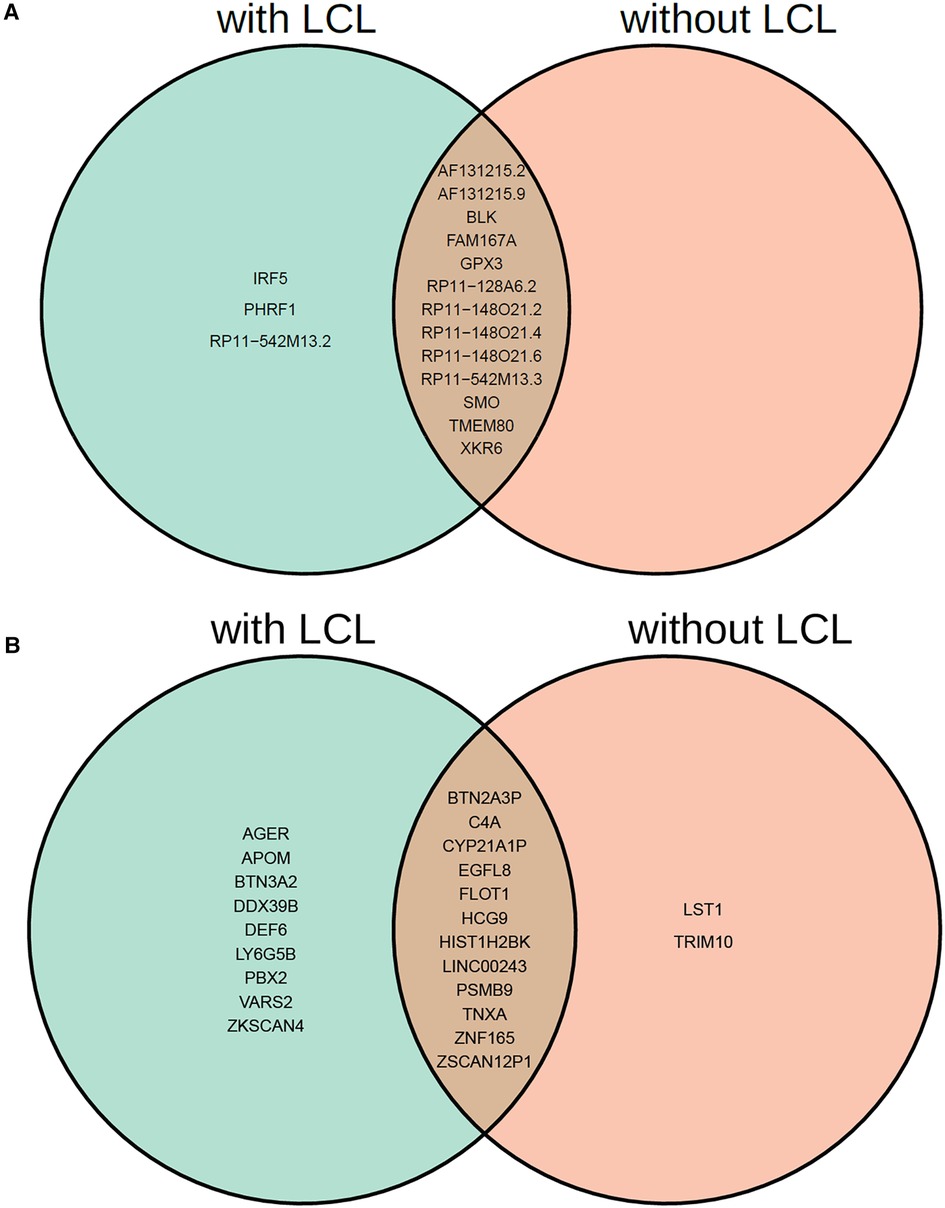
Figure 12. Venn diagram comparison of statistically significant causal genes identified by MR-MtRobin method using two different sets of eQTL data: DICE + LCL (with LCL) and DICE alone (without LCL). (A) Genes from outside of chromosome 6. (B) Genes from chromosome 6.
Comparison of analysis results from three MR methods
Non-chromosome 6 genes
In this study, we employed three different MR methods, namely MRAID, PMR-Egger, and MR-MtRobin, to identify SLE causal genes. Specifically, excluding chromosome 6, MRAID identified a total of 7 genes, while PMR-Egger detected 13 genes, and MR-MtRobin identified 16 genes (Figure 13A). Among these, 3 genes were found to be common between MRAID and PMR-Egger, whereas 6 genes were shared between MRAID and MR-MtRobin. Interestingly, we observed that 6 genes were common between PMR-Egger and MR-MtRobin, and 2 genes were identified by all three methods (Figure 13A).
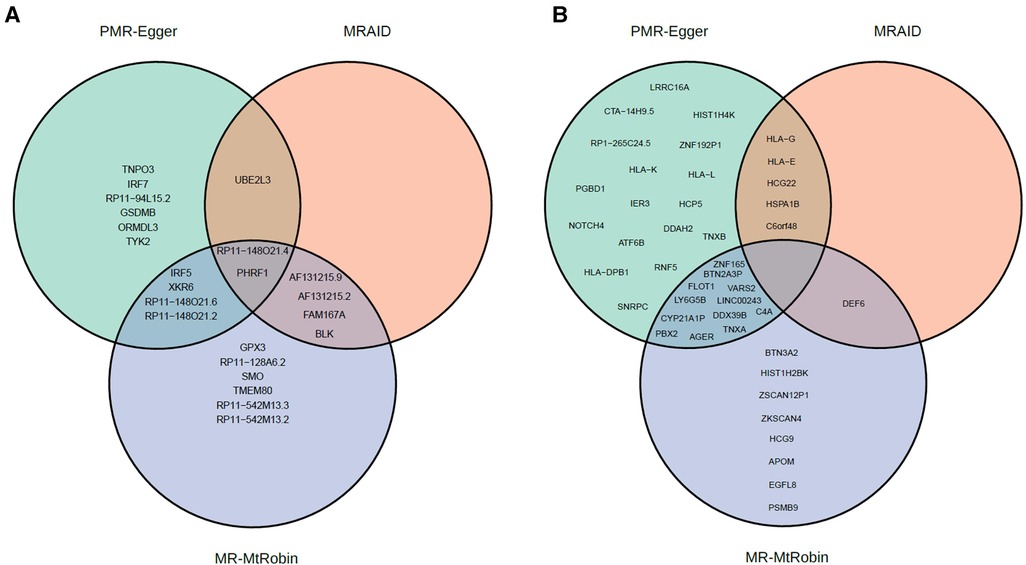
Figure 13. Venn diagrams of statistically significant causal genes identified by MRAID, PMR-Egger and MR-MtRobin (the latter with DICE + LCL eQTL data) methods. (A) Genes from outside of chromosome 6. (B) Genes from chromosome 6.
To shed light on the reasons behind the discrepancies in gene identification among the methods, it is crucial to consider various factors. Technical issues played a significant role in certain genes being deemed significant by one method but not by another. Notably, four genes (AF131215.9, AF131215.2, FAM167A, and BLK) identified as significant by MRAID were not detected by PMR-Egger due to errors that occurred during the analysis (‘Cholesky decomposition failed in PMR_summary_Egger_CPP function’ error message was reported when Cholesky decomposition of a matrix constructed from LD SNP-SNP correlation matrix was performed by PMR-Egger). Similarly, six genes specific to MR-MtRobin were not identified by either MRAID or PMR-Egger. Specifically, four of these genes (RP11-128A6.2, SMO, RP11-542M13.3, and RP11-542M13.2) were excluded from the analysis of PMR-Egger and MRAID due to having fewer than 25 SNPs in Sg (as explained in the Materials and Methods section). Additionally, errors (‘Cholesky decomposition failed in PMR_summary_Egger_CPP function’) were encountered during the analysis of TMEM80 and GPX3 genes by PMR-Egger. Furthermore, the absence of GSDMB and ORMDL3 genes from the MR-MtRobin list resulted from errors generated by a non-linear optimization (NLopt) step in the MR-MtRobin algorithm. Thus, it is evident that these three MR methods serve as complementary approaches for inferring causal genes, as they may not be able to analyze the same set of genes.
For the remaining genes, the precise reasons behind their identification by one method but not the others are yet to be determined. It is important to note that the three MR methods operate based on different assumptions, leading to distinct regimes of validity the methods (for assumptions, see Materials and Methods). To illustrate this, consider a hypothetical scenario where a gene is deemed significant by MR method A but not by MR method B. If the assumptions underlying method A are violated by that particular gene, it is likely to be a false positive for method A while being a true negative for method B. Conversely, if the assumptions for method A are valid but those for method B are not, the gene would be classified as a false negative for method B. Therefore, understanding the assumptions and limitations of each MR method is crucial in interpreting the discrepancies in gene identification results. Performing a comprehensive examination of the impact of MR modeling assumptions on the false positive and false negative rates in causal gene discovery would necessitate extensive simulation of in silico datasets using complex probabilistic models. These models would need to incorporate factors like horizontal pleiotropic effects and cell-type specificity. However, undertaking such an extensive in silico analysis is beyond the scope of the present study.
Chromosome 6 genes
On chromosome 6, MRAID identified a total of 6 genes, while PMR-Egger detected 34 genes, and MR-MtRobin identified 21 genes (Figure 13B). Among these, 5 genes were found to be common between MRAID and PMR-Egger, whereas only one gene was shared between MRAID and MR-MtRobin. Interestingly, we observed that 12 genes were common between PMR-Egger and MR-MtRobin, and none were identified together by all three methods (Figure 13B).
Interestingly, only 46% of causal genes identified by MRAID are from chromosome 6, compared to 70% for SMR, 72% for PMR-Egger and 57% for MR-MtRobin. This suggests that MRAID, by modelling both uncorrelated and correlated pleiotropic effects, and using a richer probabilistic model than other MR methods, was able to reduce false positive ‘causal’ genes from the chromosome 6. PMR-Egger method makes a simplistic assumption that correlated horizontal pleiotropy is absent. Furthermore, PMR-Egger method makes a simplifying assumption that horizontal pleiotropic effect sizes of all instrumental SNPs are equal to a single unknown parameter (see Figure 3 and Materials and Methods). By contrast, the MRAID model is general and the instrumental SNPs in the model are not constrained to have the same value of horizontal pleiotropic effect (Figure 7 and Materials and Methods).
Due to the high levels of linkage disequilibrium (LD) at the MHC locus on chromosome 6, this region is commonly excluded from Mendelian randomization (MR) analyses. For instance, the SMR study (5) excluded this locus due to LD. The elevated LD levels in this region are likely to result in violations of the standard MR assumptions. Consequently, we anticipate that a typical MR method would exhibit a higher false positive rate in identifying causal genes on chromosome 6 compared to non-chromosome 6 regions.
In contrast, the MRAID method effectively eliminated most chromosome 6 genes, proving valuable in reducing false positives. Conversely, the other MR methods identified a significant number of chromosome 6 genes, suggesting that these methods potentially have higher false positive rates when applied to chromosome 6. This finding underscores the challenges posed by LD in this region. However, beyond chromosome 6, LD levels are lower, indicating that different MR methods likely have comparable false positive rates. Nonetheless, false negative rates may vary, highlighting the complementary nature of the three probabilistic MR approaches (MRAID, PMR-Egger, and MR-MtRobin) utilized in this study. Thus, the combination of these methods provides a comprehensive assessment of causal gene discovery in both chromosome 6 and non-chromosome 6 regions, taking into account the varying levels of LD and the potential for false positives and false negatives.
Multivariable Mendelian randomization (MVMR) analysis to disentangle causal effects at the FAM167A-BLK locus
The analysis using three single-Exposure variable Mendelian Randomization (MR) methods, namely PMR-Egger, MRAID, and MR-MtRobin, has identified specific genes from the FAM167A-BLK locus as potential causal factors for SLE. The neighboring genes BLK and FAM167A have been found to have causal effects in opposite directions (Figures 5, 6 and Supplementary Table S1). This finding aligns with previous research indicating that reduced expression of BLK and elevated expression of FAM167A are associated with an increased risk of SLE (26, 27).
In addition to BLK and FAM167A, other genes within the FAM167A-BLK locus, namely RP11-148O21.2, RP11-148O21.4, and RP11-148O21.6, have also been identified as potential causal factors for SLE by one or more of the single-variable MR methods (see Table 1). Given the high linkage disequilibrium at this locus, it is important to investigate whether the causal effects of these five genes are independent of each other. To investigate whether the causal effects of the identified genes within the FAM167A-BLK locus are independent, we employed a Multivariable Mendelian Randomization (MVMR) method (16, 28). In this study, we used the single-variable MR methods with an abstract approach to model horizontal pleiotropy without exploring the precise underlying mechanisms driving these effects. In contrast, the MVMR method offers a more explicit modeling of horizontal pleiotropy by considering the pathways from genetic variants to the expression patterns of a subset of genes within a gene set during causal inference. To illustrate this concept, we can reinterpret the MVMR model incorporating the five mentioned genes as a single-variable MR analysis with a specific focus on the BLK gene, while interpreting the expressions of other four genes as mediators of horizontal pleiotropic effects. For a concise description of the MVMR method, see Materials and Methods.
A joint MVMR analysis of the five genes at the FAM167A-BLK locus revealed that the causal effect sizes of two genes were statistically significant. Specifically, the BLK gene exhibited a significant effect (causal effect size = −0.635, p-value = 0.004), suggesting its direct causal relationship with SLE. Similarly, the RP11-148O21.2 gene also demonstrated a significant effect (causal effect size = 0.637, p-value = 0.002). On the other hand, the causal effects of the remaining three genes did not reach statistical significance, indicating that they may not play a significant role in the development of SLE. However, it is crucial to note that this conclusion hinges on the validity of the underlying assumptions in the MVMR analysis. As such, we cannot assert with absolute certainty that FAM167A, RP11-148O21.4, and RP11-148O21.6 are not important in the etiology of SLE.
HEIDI test of horizontal pleiotropy
In this study, we employed three probabilistic MR methods (PMR-Egger, MRAID, and MR-MtRobin) that explicitly model horizontal pleiotropic effects. We conducted a comparison between the results obtained using these probabilistic MR methods and the findings generated by HEIDI test on the set of 142 genes identified using the SMR method. HEIDI (HEterogeneity In Dependent Instruments) test is a statistical method used in Mendelian randomization (MR) analysis to detect horizontal pleiotropy that may arise due to the linkage disequilibrium between single-nucleotide polymorphisms (SNPs) (5).
A challenge in MR analysis using expression quantitative trait loci (eQTLs) as exposure variables is the limited availability of independent cis-eQTL single-nucleotide polymorphisms (SNPs) for most genes in the genome. To overcome this challenge and increase the number of instrumental variables (SNPs), we included correlated SNPs in our analysis. However, we ensured that the correlation between these SNPs (IVs) remained below a specific threshold [a linkage disequilibrium (LD) r-squared value of less than 0.9]. These correlated SNPs were considered when applying HEIDI test.
It is important to note that the correlation among instrumental variables can increase the likelihood of false positive results in the HEIDI test, potentially leading to incorrect indications of horizontal pleiotropy. Consequently, HEIDI test may erroneously reject causal genes identified by the SMR algorithm as non-causal (i.e., false negatives in gene discovery). To address this concern, we chose not to rely on HEIDI test in this study. Instead, we employed the three aforementioned probabilistic MR methods, which explicitly account for horizontal pleiotropy, to filter the candidate causal genes identified by the SMR method.
Nevertheless, for completeness, we report the results of HEIDI test (see p_HEIDI p-values in Supplementary Table S1). Among the set of 142 genes identified by the SMR algorithm, the HEIDI test detected heterogeneity in 115 genes at a significance level of p_HEIDI < 0.05. Out of the remaining 27 genes that passed HEIDI test (p_HEIDI >= 0.05), seven genes are located on chromosome 6, while the remaining 20 are located on other chromosomes. Interestingly, four (HIST1H2BK, HIST1H4K, APOM and DEF6) out of the seven genes from chromosome 6 that passed HEIDI test were among the 43 chromosome 6 genes identified in our study. Similarly, ten (RP11-128A6.2, AF131215.9, AF131215.2, FAM167A, BLK, PHRF1, TMEM80, RP11-542M13.2, GSDMB and UBE2L3) out of the 20 non-chromosome 6 genes that passed HEIDI test were among the 23 non-chromosome 6 genes identified in our study. It is worth considering that HEIDI test, with its stringent p-value cutoff of p_HEIDI> = 0.05, may be overly conservative for gene discovery and could result in the exclusion of many potentially causal genes (i.e., false negatives).
Relation to other Mendelian randomization studies on autoimmune diseases
Previous work on Mendelian Randomization (MR) methods in understanding autoimmune and inflammatory diseases encompasses various studies. These include investigations into the association of atopic dermatitis with autoimmune diseases using a bidirectional and multivariable two-sample MR (29), the causal association between atopic eczema and inflammatory bowel disease using a two-sample bidirectional MR (30), and the causal associations between Vitamin D levels and psoriasis, atopic dermatitis, and vitiligo using a bidirectional two-sample MR (31). Additionally, studies have explored the causal relation between telomere length and the development of SLE using MR methods (32), the causal relationship between vitamin D levels and the risk of juvenile idiopathic arthritis (33), and the potential therapeutic targeting of TYK2 for autoimmune diseases (34).
Of particular relevance to our study are two MR analyses. One study (35) employed MR analysis using single-cell eQTL data from peripheral blood mononuclear cells (PBMCs) collected from 982 donors and identified cell type-specific causal genes in seven autoimmune diseases. The study identified 19 candidate causal genes for SLE, 16 of which were from chromosome 6 and 3 were non-chromosome 6 genes. After applying the HEIDI test filter (p_HEIDI> = 0.05), 8 significant causal genes remained (5 from chromosome 6 and 3 from other chromosomes). All three non-chromosome 6 genes identified in (35) (BLK, FAM167A, and UBE2L3) were also identified as causal in our study using four combined methods (SMR and one or more of PMR-Egger, MRAID and MR-MtRobin). Furthermore, 13 of the 19 genes identified in (35) were found in our SMR analysis. Notably, the study (35) revealed cell type-specific effects, such as the causal effect of BLK being restricted to immature naïve B cells, memory B cells, and CD4+ T cells, while the causal effect of FAM167A was restricted to memory B cells. The causal effect of UBE2L3 was found in CD4 + and CD8+ T cells, as well as in mature natural killer (NK) cells. Additionally, the causal effect of C6orf48 was observed in immature naïve B cells, CD4+ T cells, CD4 + central memory T cells, and CD8+ T cells. The causal effect of BTN3A2 was restricted to the same cell types as C6orf48, with additional effects seen in memory B cells, CD8 + effector T cells, and NK cells.
The second relevant study (36) utilized the SMR Mendelian randomization method and HEIDI filtering (p_HEIDI > 0.05) on three whole-blood eQTL datasets from European individuals [Westra data (n = 5,311) (37), CAGE data (n = 2,765) (38) and GTEx data (39) to identify causal genes in SLE. Their analysis identified 21 genes, with 12 from chromosome 6 and 9 from outside of chromosome 6. The majority of these genes showed statistically significant causal effects in only one of the three eQTL datasets. However, four non-chromosome 6 genes (FAM167A, BLK, IRF7, and UBE2L3) and four chromosome 6 genes (HCP5, C6orf48, C4A, and RNF5) identified in (36) were also identified as causal in our study using four combined methods. When considering only our SMR results, we found overlap with the same four non-chromosome 6 genes and ten chromosome 6 genes identified in (36).
In summary, our study confirms and extends the findings of previous Mendelian Randomization (MR) studies, providing further support for the role of specific genes in autoimmune diseases. We observed overlap in the identification of causal genes, particularly those showing significant effects across multiple datasets. Moreover, our research emphasizes the significance of considering cell type-specific effects, offering insights into the involvement of different immune cell populations in autoimmune diseases.
Our investigation utilized a powerful whole blood expression quantitative trait loci (eQTL) dataset comprising data from almost 32,000 individuals. This dataset provided valuable insights into the causal genes associated with autoimmune and inflammatory diseases. However, given the mixed nature of whole blood, which encompasses various cell types, it remains challenging to discern cell type-specific effects using this dataset alone. Unfortunately, cell type-specific datasets of comparable sample size are not currently available. Although a previous study we discussed employed single-cell eQTL data, the sample size was significantly smaller, around 1,000 individuals, limiting the comprehensive exploration of cell type-specific effects. To gain a more comprehensive understanding of the specific roles played by different cell types in autoimmune and inflammatory diseases, future investigations should incorporate larger single-cell eQTL datasets.
Disease relevance of candidate causal genes identified in this study
By utilizing statistical MR methods, we have identified 23 genes outside of chromosome 6 whose expression may play a causative role in the development of SLE (see Table 1 and Figure 13A). Next, we collected an extensive literature evidence to strengthen their association with the development of this disease (see Appendix A). Based on literature evidence, the genes identified as potentially causal for SLE in this study are implicated in diverse pathways and mechanisms (see Figure 14). Misexpression of these genes contributes to dysregulated type I interferon and IL-12/23 signaling, dysregulation of antibody class switch recombination, dysregulation of B-cell signaling and function, breakdown of self-tolerance, NF-kB hyperactivity, immune dysregulation, inflammatory response, tissue damage, oxidative stress, Epstein-Barr virus infection, and dysregulation in lymphocyte development.
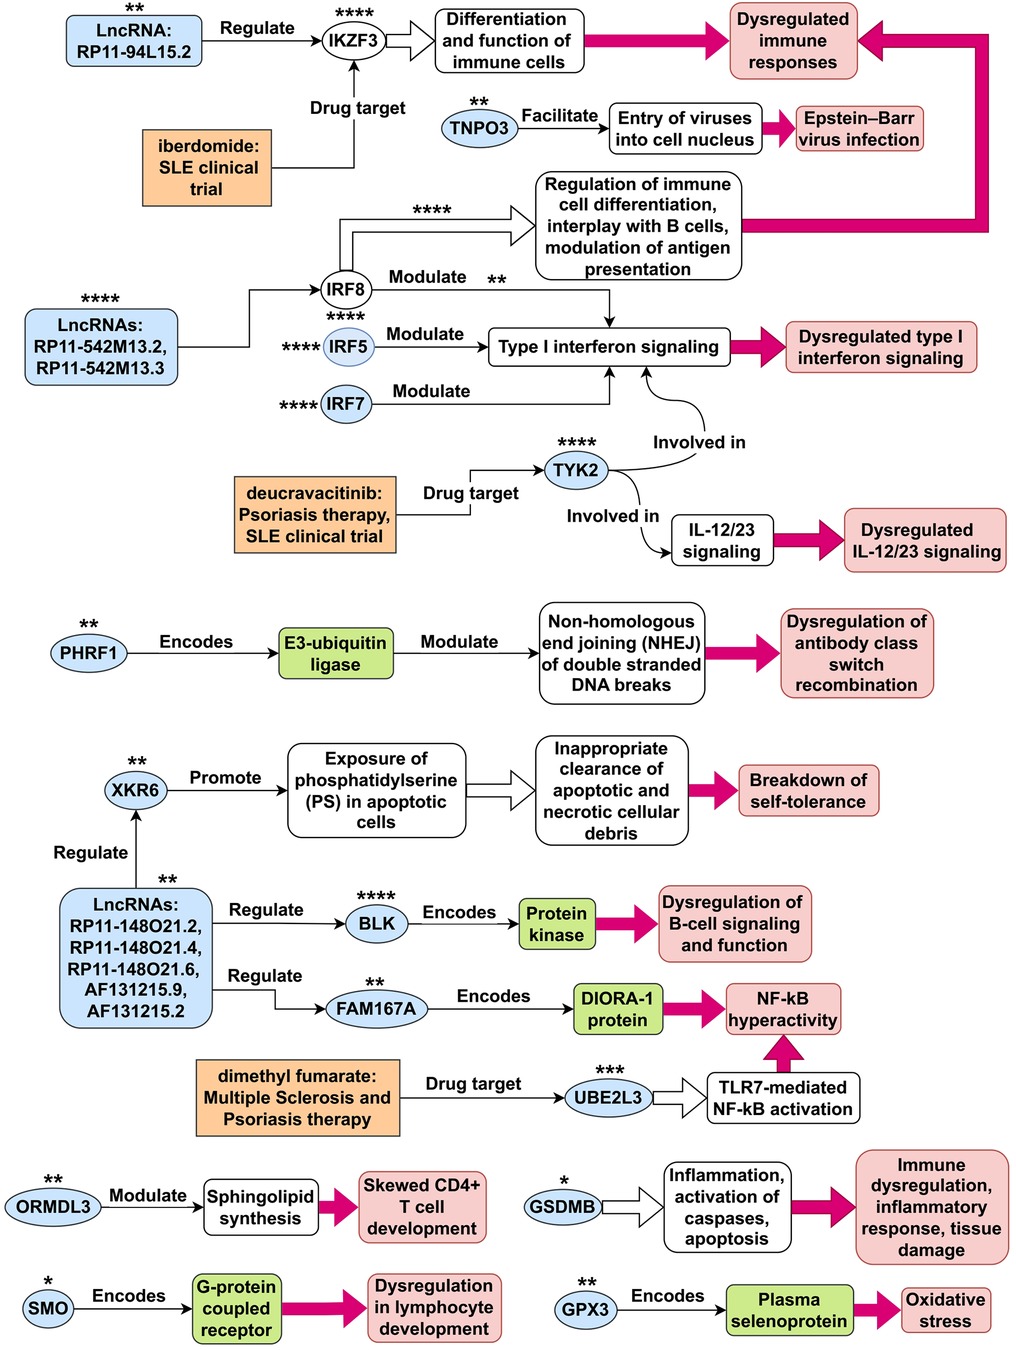
Figure 14. Tentative SLE disease mechanisms for genes identified in this study. This figure illustrates potential disease mechanisms associated with systemic lupus erythematosus (SLE) genes. The light-blue shapes represent 21 of the 23 non-chromosome 6 genes identified as plausible causes in this study. Depending on the context within the figure, these shapes can also represent gene products, such as proteins and mRNAs. The unfilled ovals represent the SLE genes IKZF3 and IRF8, which were not identified in this study. The number of asterisks next to each gene shape indicates the overall level of confidence in the evidence supporting its disease mechanism, ranging from 1 star (*) for the least confident evidence to 4 stars (****) for the most confident evidence. For IRF8, there are two pathways associated with it, and the number of asterisks shown above each pathway represents the confidence level in the evidence supporting that particular pathway.
Materials and methods
SLE GWAS summary statistics data preprocessing
The European population SLE GWAS summary statistics data from (6) (5,201 cases and 9,066 controls) was downloaded from European Bioinformatics Institute (ebi.ac.uk) under the study ID GCST003156. The SNPs with effect size standard error (SE) identically equal to zero were removed from the GWAS summary statistics data. The reference genotype data from European individuals was obtained from the International Genome Sample Resource (IGSR, https://www.internationalgenome.org), formerly 1,000 Genomes Project (1KG). The 1KG European genotypes were filtered using plink2 (40) with parameters hwe = 1e-6 (Hardy–Weinberg equilibrium test p-value cutoff) and maf = 0.001 (minor-allele frequency cutoff). The effect sizes for all SNPs were transformed () to be relative to the minor allele of SNP based on minor allele frequency in the 1KG European population. The quality control (QC) of the SLE GWAS summary statistics data was done using DENTIST (Detecting Errors iN analyses of summary staTISTics) algorithm. DENTIST is a GWAS summary statistics quality control method that leverages LD among genetic variants to detect and eliminate errors in GWAS or LD reference and heterogeneity between the two (15). DENTIST was run with default parameter settings. DENTIST removed around 5% of SNPs from the SLE GWAS summary statistics data. We name the resulting summary statistics data ‘Bentham-SLE-GWAS’. We found the quality control of GWAS summary statistics by DENTIST method to be an essential data preprocessing step. Without it, the probabilistic MR algorithm MRAID (which is described below) runs into numerical errors such as very large (>1e + 10) estimates of some model parameters.
Preprocessing of the eQTL data
The European whole-blood eQTL summary statistics data from the eQTLGen study (9) (sample size = 31,684) was downloaded from eQTLGen Consortium website (https://eqtlgen.org/) (9). The eQTL effect sizes for all SNPs were transformed () to be relative to the minor allele of SNP based on minor allele frequency in the 1KG European population. The eQTLGen summary statistics data file was reformatted into file formats suitable for SMR, PMR-Egger and MRAID algorithms using custom Perl and R scripts. The European eQTL summary statistics data from 15 immune cell types (sample size = 90) was downloaded from the DICE [Database of Immune Cell Expression, Expression quantitative trait loci (eQTLs) and Epigenomics] project website (https://dice-database.org/) (8). The 15 immune cell types in the DICE dataset are: naïve B cell, classical monocytes, non-classical monocytes, CD56dim CD16+ NK cells, various CD4 T cell types (Tfh, Th1, Th17, Th1/17, Th2, memory Treg, naïve Treg, naïve CD4 T cell, activated naïve CD4 T cell), naïve CD8 T cells and activated naïve CD8 T cells. The processed GEUVADIS LCL eQTL summary statistics data (7) was obtained from (41) (European sample size = 445). The DICE and LCL eQTL summary statistics data files were reformatted into file formats suitable for the MR-MtRobin algorithm using custom Perl and R scripts.
Description of SMR method
If the Instrumental Variable (IV) assumptions hold, the classical MR method can unbiasedly estimate causal effect (Figure 1) (13, 14). A two-stage least-squares regression procedure then yields statistical estimate of causal effect as the ratio of GWAS and eQTL marginal effect sizes of the SNP. For single-SNP MR analysis, we used SMR (summary data-based MR) method, which was specifically developed for causal gene inference from eQTL and GWAS summary statistics data (5). In SMR method, p-value of causal effect is computed using an approximate chi-squared test statistic , where and are the z statistics from the eQTL and GWAS study, respectively.
SMR analysis
From the eQTLGen whole-blood eQTL data, we removed SNP-gene associations with the nominal p-value > 5e-8. From the retained data, we kept only rows with genes whose transcription start sites (TSS) are located within 500 kb of any GWAS significant SNP (p-value < 5e-8) from the Bentham-SLE-GWAS summary data. The TSS genomic coordinates information was obtained from the Ensembl database (www.ensembl.org, version GRCh37-p13). The classical MR method, as implemented in a two-sample MR method SMR (5), was applied to the European whole-blood eQTL summary statistics data from the eQTLGen study (9) (sample size = 31,684), and the European population SLE GWAS summary statistics data from (6) (5,201 cases and 9,066 controls).
Description of PMR-Egger statistical model
PMR-Egger (4) is a probabilistic Mendelian randomization (MR) method for performing two-sample MR analysis with correlated SNP instruments in the presence of uncorrelated horizontal pleiotropy which violates one of the IV assumptions (see Figure 1). PMR-Egger examines one gene at a time and estimates causal effect of gene expression (exposure X) on the trait (outcome Y) of interest (Figure 3A). PMR-Egger is a mixed-effects statistical model containing both fixed effects ( and ) and random effects () (see Figure 3B for a concise description of the model). The random variables , which represents effect size of SNP j on the exposure variable X, are assumed to be independent and follow the same normal distribution (Figure 3A). In order to avoid the problem of overfitting the data, the PMR-Egger method makes a simplifying assumption that horizontal pleiotropic effect sizes of all instrumental SNPs are equal to a single unknown parameter . The marginal effect size estimates and from the exposure (eQTL) and outcome (GWAS) studies, and SNP genotype correlation matrix R (a measure of SNP-SNP linkage-disequilibrium levels) are used as the input data to perform a maximum likelihood inference of model parameters. In the eQTL summary statistics data, the marginal effect size of a SNP on the gene expression was estimated using a univariate linear regression analysis. The marginal effect size of a SNP consists of the ‘functional’ effect size of the SNP and LD-weighted contributions from the tagged SNPs which are in linkage disequilibrium (LD) with the SNP. This intuitively explains the vectorial equation , which reads in the component form as . When SNPs are in linkage equilibrium, the genotype correlation matrix R becomes the identity matrix, and the equations from Figure 3B simplify.
PMR-Egger analysis
For each gene g from the set of 142 genes identified using SMR method, we considered the set Sg of all its significant eQTLs (PeQTL < 5e-8) located within 500 kb of the gene's topmost significant eQTL and with linkage disequilibrium in order to avoid inclusion of highly correlated (and hence uninformative) SNPs in the analysis. For the analyses using PMR-Egger and MRAID, we selected 97 genes whose set Sg contains at least 25 SNPs in order to be able to reliably estimate the parameters of the mixed-effects linear model from the eQTL and GWAS summary statistics data for the SNPs in the set Sg. The cutoff of 25 SNPs can be heuristically motivated as follows: PMR-Egger and MRAID models contain many parameters, including the causal effect size alpha. Bayesian averaging was applied over all parameters except alpha, simplifying the models to focus on estimating alpha. This, combined with the ‘one in ten rule’ (42) from the logistic regression method, which indicates the need for at least 10 data points to reliably estimate one model parameter, and considering that the number of SNPs in the model corresponds to the number of rows (i.e., data points) in the matrix equations of PMR-Egger and MRAID statistical models shown in Figures 3B, 7C, led us to conservatively select a lower bound of 25 SNPs.
We performed PMR-Egger analysis on each of these 97 genes using the eQTL and SLE GWAS summary statistics data, and the LD data restricted to SNPs from the set Sg.
Description of MRAID statistical model
MRAID (MR with Automated Instrument Determination) is a probabilistic MR method for causal inference with correlated SNP instruments in the presence of IV assumptions-violating correlated and uncorrelated horizontal pleiotropic effects (3). For a concise description of the MRAID model, see Figure 7. MRAID is a mixed-effects statistical model containing fixed effect ( and ) and random effect () variables. The random variables in the model are assumed to follow mixture probability distributions shown in Figures 7A,B. The use of random effect variables in the model can be motivated as follows. MRAID takes marginal effect sizes for a set of SNPs from exposure X and outcome Y summary statistics data as input and estimates various parameters in the model. For p SNPs, 3p parameters would have been required to parametrize the model if these were fixed-effect variables. In MRAID, these parameters are treated as independent random variables drawn from mixture distributions parametrized by a small number of hyper-parameters (, etc.), thus circumventing the problem of overfitting the input data. Using an explicit formula for the posterior likelihood, Gibbs sampling can be performed to estimate parameters characterizing various distributions in the MRAID model (3).
MRAID analysis
For the analysis using MRAID, we selected the same 97 genes as in PMR-Egger analysis. We performed MRAID analysis on each of these 97 genes using the eQTL and SLE GWAS summary statistics data, and the LD data restricted to SNPs from the set Sg. MRAID algorithm was run with a default setting for all parameters except the parameter Gibbsnumber (the number of Gibbs sampling iterations) which was set to 1e6.
Description of the MR-MtRobin statistical model
MR-MtRobin (Multi-tissue TWMR method ROBust to Invalid IV) method takes as input summary-level GWAS and multi-cell type eQTL statistics, and performs transcriptome-wide MR (TWMR) inference in the presence of invalid IVs (2). It leverages multi-cell type eQTL data in a mixed-effects statistical model, which makes identifiable the SNP-specific random effects due to pleiotropy from standard errors of eQTL summary statistics and provide inference of causal effect of gene expression on the outcome trait.
If the instrumental variable (IV) assumptions hold, an unbiased MR estimate of the causal effect size is given by (see Figure 1). Equivalently, , where . If the IV assumptions are violated due to horizontal pleiotropy, the equation will include bias terms: . For a concise description of the MR-MtRobin mixed-effects linear model, see Figure 8B. In the linear relationship between cell type-specific eQTL effect sizes and GWAS effect sizes , is a fixed effect and are SNP-specific random effects. The noise term in the equation is cell type specific and depends on the structure of SNP-SNP genotype correlations. Specifically, for the cell type m, the vector follows a multivariate normal distribution with mean zero and the covariance matrix whose elements are the products of eQTL standard errors and SNP genotype correlation matrix elements.
The MR-MtRobin method is based on a generalized InSIDE (G-InSIDE) assumption, which is a more general version of the InSIDE assumption used in an earlier MR method called MR-Egger (16). MR-Egger provides consistent causal effect estimates when the Instrument Strength Independent of Direct Effect (InSIDE) assumption holds. The InSIDE assumption is met when there is no correlation between the direct effects of the pleiotropic Instrument Variable on the Outcome and its effects on the Exposure variable (represented by and in Figure 7A, respectively). The G-InSIDE assumption used in MR-MtRobin is a more complex version of InSIDE (2).
MR-MtRobin analysis
The SNP Instrument Variables (IVs) were selected using ‘select_IV’ function with the following values of the parameters: nTiss_thresh = 2 (minimum number of cell types in which a candidate IV must have eQTL p-value < 0.05) and ld_thresh = 0.5 (pairwise LD threshold ). The main MR-MtRobin algorithm, MR_MtRobin, was run with the parameter pval_thresh = 0.05 (p-value threshold for Instrumental Variables). The p-values of gene expression causal effects were estimated using ‘MR_MtRobin_resample’ function with the parameter nsamp = 1e6 (number of resampling to perform in estimating the causal effect p-value).
The MR-MtRobin gene causal effect sizes shown in Figure 6 were calculated as follows. The MR_MtRobin algorithm does not explicitly return the gene causal effect sizes. However, it returns lme_res, an R object produced by the linear mixed-effects modeling algorithm lme4 (https://CRAN.R-project.org/package=lme4). From lme_res, the fixed effect (see Figure 8) was extracted. The causal effect size was computed as .
Description of multivariable Mendelian randomization (MVMR) method
Multivariable Mendelian randomization (MVMR) extends the scope of single-variable Mendelian randomization method by addressing genetic variants that are linked to multiple Exposure variables or risk factors (28). This method provides a more explicit modeling of horizontal pleiotropy as the pathways from genetic variants to the expression patterns of a subset of genes within a gene set in the causal inference.
The MVMR approach relies on specific assumptions known as extended Instrumental Variable (IV) assumptions. Firstly, it assumes that the genetic variant is associated with one or more of the Exposure variables. Secondly, the genetic variant should not be linked to any confounding factor that may influence the associations between the Exposure variables and the Outcome. Finally, the genetic variant is conditionally independent of the Outcome given the Exposure variables and Confounders.
It is important to note that not every genetic variant needs to be associated with every Exposure variable in the set. However, a variant cannot have associations with the Outcome except through the Exposure variables of interest. These assumptions guide the application of MVMR and ensure the validity of causal inference in the analysis.
The MVMR method, as implemented in the “MendelianRandomization” R package (https://cran.r-project.org/package=MendelianRandomization), leverages generalized multivariable weighted linear regression to analyze correlated genetic variants. This approach enables estimation of causal effects by regressing the associations of genetic variants with the Outcome variable onto the associations of genetic variants with the Exposure variables. The weighted regression is performed with the intercept set to zero, and the weights are determined by the inverse-variances of the associations of genetic variants with the Outcome.
The resulting causal effect estimates represent the direct causal effect of each exposure variable individually, while considering the other exposure variables as fixed. This allows for a comprehensive understanding of the specific causal effects associated with each exposure variable within the context of the others. The MVMR method provides a robust framework for analyzing the relationships between genetic variants, Exposure variables, and the Outcome, offering valuable insights into the direct causal effects in a multivariable setting.
MVMR analysis
The input data for the MVMR analysis was prepared in the following manner. First, for each of the five genes (BLK, FAM167A, RP11-148O21.2, RP11-148O21.4, and RP11-148O21.6), the eQTLGen expression Quantitative Trait Locus (eQTL) SNPs with a significance level of were selected. Subsequent analysis was restricted to the shared significant eQTL SNPs across these genes.
To avoid including highly correlated genetic variants in the MVMR analysis, LD (Linkage Disequilibrium) variant pruning was performed using the plink2 algorithm (40) with the parameter “indep-pairwise 50 0.9” (a window size of 50 kb and a threshold of r-squared = 0.9) and the input IGSR reference genotype data from European individuals described earlier in Materials and Methods.
From the resulting list of SNPs, GWAS SNPs that passed the DENTIST-filtering with a significance level of were selected. This resulted in a final list of 196 SNPs spanning a genomic region of 1.3 megabases (hg19 coordinates chr8:10.5Mb–11.8Mb) at the FAM167A-BLK locus. A matrix of LD correlations between these SNPs was then calculated using the SMR algorithm (5) with the parameters “–make-bld –r –ld-wind 4000”.
Using the SLE GWAS effect sizes and standard errors (6), eQTLGen study eQTL effect sizes and standard errors (9), as well as the LD correlation matrix, the input object for the MVMR analysis was created using the “mr_mvinput” function from the “MendelianRandomization” R package.
Finally, the MVMR analysis was performed using the “mr_mvivw” function (Multivariable inverse-variance weighted method) from the “MendelianRandomization” R package with the following parameters: model = “random”, correl = TRUE, distribution = “normal”. This analysis allowed for the assessment of the causal effects in a multivariable setting, taking into account the correlations between variables.
Data visualization
We used three R (https://cran.r-project.org/) packages for data visualization: (1) ggmanh for the Manhattan plot in Figure 2 (source: https://bioconductor.org/packages/release/bioc/html/ggmanh.html), (2) ggplot2 for the scatter plots in Figures 4–6, 9–11 (source: https://CRAN.R-project.org/package=ggplot2), and (3) ggvenn for the Venn diagrams in Figures 12, 13 (source: https://CRAN.R-project.org/package=ggvenn).
Discussion
In this study, a two-step strategy was employed to identify causal genes for systemic lupus erythematosus (SLE). The first step utilized classical Mendelian randomization (MR) method without assuming horizontal pleiotropic effects to estimate the causal effect of gene expression on SLE, resulting in the identification of 142 genes, including 43 from outside of chromosome 6. In the second step, advanced probabilistic MR methods, namely PMR-Egger, MRAID and MR-MtRobin, were applied to the genes identified in the first step to filter out false positives, allowing for the consideration of horizontal pleiotropy.
Using PMR-Egger, which models uncorrelated horizontal pleiotropy, 13 non-chromosome 6 genes and 34 chromosome 6 genes with statistically significant causal effects were identified. MRAID, which models both correlated and uncorrelated horizontal pleiotropic effects, revealed 7 non-chromosome 6 genes and 6 chromosome 6 genes with statistically significant causal effects. To validate the findings, an independent dataset from different immune cell types was utilized, and the MR-MtRobin method identified 16 non-chromosome 6 genes and 21 chromosome 6 genes with statistically significant causal effects.
Although there were overlaps between the genes identified by the three MR methods, some genes were identified by only one or two methods due to different modelling assumptions and technical factors. These discrepancies highlight the complementary nature of the three MR methods and the importance of understanding their assumptions and limitations. Notably, MRAID showed a lower percentage of causal genes from chromosome 6 compared to other methods, suggesting its ability to reduce false positive causal genes.
A Multivariable Mendelian Randomization (MVMR) method was used to investigate the independence of causal effects of genes at the FAM167A-BLK locus. The joint analysis revealed significant effects for BLK and RP11-148O21.2, while the other three genes at the locus did not reach statistical significance. However, the certainty of these findings depends on the validity of the underlying assumptions of MVMR method.
Following the identification of causal genes using the MR methods, an extensive review of the literature was conducted to provide additional evidence supporting their association with the development of systemic lupus erythematosus (SLE) (see Appendix A). This literature review aimed to strengthen the understanding of the functional roles and mechanisms by which these genes contribute to the pathogenesis of the disease.
The extensive literature supports the notion that misexpression of genes identified as potentially causal for SLE in this study contributes to dysregulated immune responses, Epstein-Barr virus infection, dysregulated type I interferon, IL-12/23 and B-cell signaling, dysregulation of antibody class switch recombination, breakdown of self-tolerance, NF-kB hyperactivity, dysregulation in lymphocyte development, inflammatory response, tissue damage and oxidative stress (Figure 14). By integrating the findings from the MR methods with the extensive literature evidence, this study aimed to provide a comprehensive understanding of the functional roles and disease relevance of the identified causal genes in the context of SLE. This collective knowledge serves to strengthen the association between these genes and the development of the disease, paving the way for further research and potential therapeutic targets.
Under the assumption of valid IV instruments, the SMR method initially identified 142 genes as statistically significant. However, the subsequent use of more advanced probabilistic MR methods revealed that many of these genes were not statistically significant. This suggests that the presence of horizontal pleiotropic effects may have led to false positives among the genes identified by SMR. Nevertheless, it would be premature to conclude that the genes identified as ‘not causal’ by the advanced methods are indeed not involved in the development of SLE. We believe that a significant number of the 142 genes are genuinely causal, but demonstrating causality will require powerful datasets and more advanced MR methods. Drawing an analogy with the legal principle “presumption of innocence until proven guilty,” our approach adopts the “presumption of non-causal until proven causal” in gene discovery. We applied advanced MR methods to filter out potential false positives among the 142 genes identified by the simplistic SMR method. Despite lacking conclusive causality proof, we remain optimistic about future advancements in MR methods and richer data to demonstrate causality of these genes.
To increase the statistical power in detecting causal gene expression for SLE, it will be necessary to utilize large sample size eQTL, mQTL (methylation QTL), and other molecular data from diverse immune cell types. Additionally, sophisticated probabilistic MR methods capable of integrating molecular data from various cell types, performing multi-variable MR (MVMR) analyses, accounting for correlated SNPs, and resilient to the presence of invalid Instrumental Variables will be indispensable.
Our focus on European GWAS and eQTL data stems from the extensive sample size (n = 32k individuals of European ancestry) available in the eQTLGen study. Accurate estimation of parameters in probabilistic MR models relies on data from GWAS and eQTL studies with substantial sample sizes. Unfortunately, eQTL studies with similar sample sizes to eQTLGen are currently lacking for non-European populations. The significance of having data from diverse ethnic populations cannot be overstated, as demonstrated by the value of trans-ethnic study design approaches to boost statistical power in fine-mapping causal genetic variants (43).
It is important to note that most MR methods, including the ones employed in this study, assume continuous trait values in linear models. However, the SLE GWAS summary statistics were calculated using logistic regression for a binary trait in a case-control study. Therefore, treating binary trait values as continuous in MR methods is not entirely justified, and the interpretation of causal effect size estimates should be considered semi-quantitative at best. The development of probabilistic MR methods that can appropriately handle binary traits is crucial, as demonstrated by recent progress (44).
Although MR-MtRobin enhances statistical power by utilizing eQTL data from multiple cell types, it adopts a consensus approach where only eQTLs with consistent effects across cell types are utilized. However, the etiology of diseases often involves cell-type specific effects (45). Therefore, the development of advanced MR methods that can model tissue-specific contributions to diseases should incorporate statistical approaches for estimating the causal tissues for complex traits and diseases (46–49). By doing so, we can better understand the tissue-specific mechanisms underlying complex traits and diseases, leading to more accurate MR analyses.
Data availability statement
Publicly available datasets were analyzed in this study. This data can be found here: https://eqtlgen.org; https://dice-database.org; www.ensembl.org; ebi.ac.uk, study ID GCST003156; https://www.internationalgenome.org.
Ethics statement
Ethical review and approval was not required for this study in accordance with the national legislation and the institutional requirements.
Author contributions
IC and JH conceived the project. IC conducted the analyses and drafted the manuscript. IH wrote the literature evidence-based narrative to support the disease relevance of candidate causal genes. IC, IH, and JH revised and approved the final manuscript. All authors contributed to the article and approved the submitted version.
Funding
This work was supported by a Career Development Award and a K Bridge Award from the Rheumatology Research Foundation to ITWH, and Merit Awards to JBH (I01 BX001834 and I01 BX006254), NIH R01 AI024717, and the Burroughs Wellcome Fund.
Acknowledgments
Some analyses described in this work were performed on Owens computing cluster from the Ohio Supercomputer Center. This work was presented in part at American Society of Human Genetics international meeting, October 25–29, 2022.
Conflict of interest
The authors declare that the research was conducted in the absence of any commercial or financial relationships that could be construed as a potential conflict of interest.
The author JH declared that they were an editorial board member of Frontiers, at the time of submission. This had no impact on the peer review process and the final decision.
Publisher's note
All claims expressed in this article are solely those of the authors and do not necessarily represent those of their affiliated organizations, or those of the publisher, the editors and the reviewers. Any product that may be evaluated in this article, or claim that may be made by its manufacturer, is not guaranteed or endorsed by the publisher.
Author disclaimer
The contents of this manuscript do not represent the views of the U.S. Department of Veterans Affairs or the United States Government.
Supplementary material
The Supplementary Material for this article can be found online at: https://www.frontiersin.org/articles/10.3389/flupu.2023.1234578/full#supplementary-material
References
1. Harley ITW, Sawalha AH. Systemic lupus erythematosus as a genetic disease. Clin Immunol. (2022) 236:108953. doi: 10.1016/j.clim.2022.108953
2. Gleason KJ, Yang F, Chen LS. A robust two-sample transcriptome-wide Mendelian randomization method integrating GWAS with multi-tissue eQTL summary statistics. Gene Epidemiol. (2021) 45:353–71. doi: 10.1002/gepi.22380
3. Yuan Z, Liu L, Guo P, Yan R, Xue F, Zhou X. Likelihood-based Mendelian randomization analysis with automated instrument selection and horizontal pleiotropic modeling. Sci Adv. (2022) 8:eabl5744. doi: 10.1126/sciadv.abl5744
4. Yuan Z, Zhu H, Zeng P, Yang S, Sun S, Yang C, et al. Testing and controlling for horizontal pleiotropy with probabilistic Mendelian randomization in transcriptome-wide association studies. Nat Commun. (2020) 11:3861. doi: 10.1038/s41467-020-17668-6
5. Zhu Z, Zhang F, Hu H, Bakshi A, Robinson MR, Powell JE, et al. Integration of summary data from GWAS and eQTL studies predicts complex trait gene targets. Nat Genet. (2016) 48:481–7. doi: 10.1038/ng.3538
6. Bentham J, Morris DL, Graham DSC, Pinder CL, Tombleson P, Behrens TW, et al. Genetic association analyses implicate aberrant regulation of innate and adaptive immunity genes in the pathogenesis of systemic lupus erythematosus. Nat Genet. (2015) 47:1457–64. doi: 10.1038/ng.3434
7. Lappalainen T, Sammeth M, Friedländer MR, ‘t Hoen PAC, Monlong J, Rivas MA, et al. Transcriptome and genome sequencing uncovers functional variation in humans. Nature. (2013) 501:506–11. doi: 10.1038/nature12531
8. Schmiedel BJ, Singh D, Madrigal A, Valdovino-Gonzalez AG, White BM, Zapardiel-Gonzalo J, et al. Impact of genetic polymorphisms on human immune cell gene expression. Cell. (2018) 175:1701–1715.e16. doi: 10.1016/j.cell.2018.10.022
9. Võsa U, Claringbould A, Westra H-J, Bonder MJ, Deelen P, Zeng B, et al. Large-scale cis- and trans-eQTL analyses identify thousands of genetic loci and polygenic scores that regulate blood gene expression. Nat Genet. (2021) 53:1300–10. doi: 10.1038/s41588-021-00913-z
10. Schaid DJ, Chen W, Larson NB. From genome-wide associations to candidate causal variants by statistical fine-mapping. Nat Rev Genet. (2018) 19:491–504. doi: 10.1038/s41576-018-0016-z
11. Verbanck M, Chen C-Y, Neale B, Do R. Detection of widespread horizontal pleiotropy in causal relationships inferred from Mendelian randomization between complex traits and diseases. Nat Genet. (2018) 50:693–8. doi: 10.1038/s41588-018-0099-7
12. Morrison J, Knoblauch N, Marcus JH, Stephens M, He X. Mendelian Randomization accounting for correlated and uncorrelated pleiotropic effects using genome-wide summary statistics. Nat Genet. (2020) 52:740–7. doi: 10.1038/s41588-020-0631-4
13. Didelez V, Sheehan N. Mendelian randomization as an instrumental variable approach to causal inference. Stat Methods Med Res. (2007) 16:309–30. doi: 10.1177/0962280206077743
14. Smith GD, Ebrahim S. “Mendelian randomization”: can genetic epidemiology contribute to understanding environmental determinants of disease? Int J Epidemiol. (2003) 32:1–22. doi: 10.1093/ije/dyg070
15. Chen W, Wu Y, Zheng Z, Qi T, Visscher PM, Zhu Z, et al. Improved analyses of GWAS summary statistics by reducing data heterogeneity and errors. Nat Commun. (2021) 12:7117. doi: 10.1038/s41467-021-27438-7
16. Bowden J, Davey Smith G, Burgess S. Mendelian randomization with invalid instruments: effect estimation and bias detection through egger regression. Int J Epidemiol. (2015) 44:512–25. doi: 10.1093/ije/dyv080
17. Cheng Q, Qiu T, Chai X, Sun B, Xia Y, Shi X, et al. MR-Corr2: a two-sample Mendelian randomization method that accounts for correlated horizontal pleiotropy using correlated instrumental variants. Bioinforma Oxf Engl. (2022) 38:303–10. doi: 10.1093/bioinformatics/btab646
18. Cheng Q, Yang Y, Shi X, Yeung K-F, Yang C, Peng H, et al. MR-LDP: a two-sample Mendelian randomization for GWAS summary statistics accounting for linkage disequilibrium and horizontal pleiotropy. NAR Genomics Bioinforma. (2020) 2:lqaa028. doi: 10.1093/nargab/lqaa028
19. Xu S, Fung WK, Liu Z. MRCIP: a robust Mendelian randomization method accounting for correlated and idiosyncratic pleiotropy. Brief Bioinform. (2021) 22:bbab019. doi: 10.1093/bib/bbab019
20. Boehm FJ, Zhou X. Statistical methods for Mendelian randomization in genome-wide association studies: a review. Comput Struct Biotechnol J. (2022) 20:2338–51. doi: 10.1016/j.csbj.2022.05.015
21. Bjornevik K, Cortese M, Healy BC, Kuhle J, Mina MJ, Leng Y, et al. Longitudinal analysis reveals high prevalence of epstein-barr virus associated with multiple sclerosis. Science. (2022) 375:296–301. doi: 10.1126/science.abj8222
22. Harley JB, James JA. Epstein-Barr virus infection induces lupus autoimmunity. Bull NYU Hosp Jt Dis. (2006) 64:45–50.17121489
23. Laurynenka V, Ding L, Kaufman KM, James JA, Harley JB. A high prevalence of anti-EBNA1 heteroantibodies in systemic lupus erythematosus (SLE) supports anti-EBNA1 as an origin for SLE autoantibodies. Front Immunol. (2022) 13:830993. doi: 10.3389/fimmu.2022.830993
24. Harley JB, Chen X, Pujato M, Miller D, Maddox A, Forney C, et al. Transcription factors operate across disease loci, with EBNA2 implicated in autoimmunity. Nat Genet. (2018) 50:699–707. doi: 10.1038/s41588-018-0102-3
25. Afrasiabi A, Keane JT, Ong LTC, Alinejad-Rokny H, Fewings NL, Booth DR, et al. Genetic and transcriptomic analyses support a switch to lytic phase in epstein barr virus infection as an important driver in developing systemic lupus erythematosus. J Autoimmun. (2022) 127:102781. doi: 10.1016/j.jaut.2021.102781
26. Hom G, Graham RR, Modrek B, Taylor KE, Ortmann W, Garnier S, et al. Association of systemic lupus erythematosus with C8orf13-BLK and ITGAM-ITGAX. N Engl J Med. (2008) 358:900–9. doi: 10.1056/NEJMoa0707865
27. Saint Just Ribeiro M, Tripathi P, Namjou B, Harley JB, Chepelev I. Haplotype-specific chromatin looping reveals genetic interactions of regulatory regions modulating gene expression in 8p23.1. Front Genet. (2022) 13:1008582. doi: 10.3389/fgene.2022.1008582
28. Burgess S, Thompson SG. Multivariable Mendelian randomization: the use of pleiotropic genetic variants to estimate causal effects. Am J Epidemiol. (2015) 181:251–60. doi: 10.1093/aje/kwu283
29. Zhou W, Cai J, Li Z, Lin Y. Association of atopic dermatitis with autoimmune diseases: a bidirectional and multivariable two-sample mendelian randomization study. Front Immunol. (2023) 14:1132719. doi: 10.3389/fimmu.2023.1132719
30. Wang L, Wang Y, Wang XE, Chen B, Zhang L, Lu X. Causal association between atopic eczema and inflammatory bowel disease: a two-sample bidirectional Mendelian randomization study of the east Asian population. J Dermatol. (2023) 50:327–36. doi: 10.1111/1346-8138.16642
31. Ren Y, Liu J, Li W, Zheng H, Dai H, Qiu G, et al. Causal associations between vitamin D levels and psoriasis, atopic dermatitis, and vitiligo: a bidirectional two-sample Mendelian randomization analysis. Nutrients. (2022) 14:5284. doi: 10.3390/nu14245284
32. Wang X-F, Xu W-J, Wang F-F, Leng R, Yang X-K, Ling H-Z, et al. Telomere length and development of systemic lupus erythematosus: a Mendelian randomization study. Arthritis Rheumatol Hoboken NJ. (2022) 74:1984–90. doi: 10.1002/art.42304
33. Clarke SLN, Mitchell RE, Sharp GC, Ramanan AV, Relton CL. Vitamin D levels and risk of juvenile idiopathic arthritis: a Mendelian randomization study. Arthritis Care Res. (2023) 75:674–81. doi: 10.1002/acr.24815
34. Yuan S, Wang L, Zhang H, Xu F, Zhou X, Yu L, et al. Mendelian randomization and clinical trial evidence supports TYK2 inhibition as a therapeutic target for autoimmune diseases. EBioMedicine. (2023) 89:104488. doi: 10.1016/j.ebiom.2023.104488
35. Yazar S, Alquicira-Hernandez J, Wing K, Senabouth A, Gordon MG, Andersen S, et al. Single-cell eQTL mapping identifies cell type-specific genetic control of autoimmune disease. Science. (2022) 376:eabf3041. doi: 10.1126/science.abf3041
36. Mo X, Guo Y, Qian Q, Fu M, Lei S, Zhang Y, et al. Mendelian Randomization analysis revealed potential causal factors for systemic lupus erythematosus. Immunology. (2020) 159:279–88. doi: 10.1111/imm.13144
37. Westra H-J, Peters MJ, Esko T, Yaghootkar H, Schurmann C, Kettunen J, et al. Systematic identification of trans eQTLs as putative drivers of known disease associations. Nat Genet. (2013) 45:1238–43. doi: 10.1038/ng.2756
38. Lloyd-Jones LR, Holloway A, McRae A, Yang J, Small K, Zhao J, et al. The genetic architecture of gene expression in peripheral blood. Am J Hum Genet. (2017) 100:228–37. doi: 10.1016/j.ajhg.2016.12.008
39. GTEx Consortium Laboratory, Data Analysis & Coordinating Center (LDACC)—Analysis Working Group Statistical Methods groups—Analysis Working Group, Enhancing GTEx (eGTEx) groups NIH Common Fund NIH/NCI NIH/NHGRI NIH/NIMH NIH/NIDA Biospecimen Collection Source Site—NDRI Biospecimen Collection Source Site—RPCI Biospecimen Core Resource—VARI Brain Bank Repository—University of Miami Brain Endowment Bank Leidos Biomedical—Project Management ELSI Study Genome Browser Data Integration &Visualization—EBI Genome Browser Data Integration &Visualization—UCSC Genomics Institute University of California Santa Cruz Lead analysts Laboratory, Data Analysis &Coordinating Center (LDACC) NIH program management Biospecimen collection Pathology eQTL manuscript working group Battle A, Brown CD, Engelhardt BE, Montgomery SB. Genetic effects on gene expression across human tissues. Nature. (2017) 550:204–13. doi: 10.1038/nature24277
40. Chang CC, Chow CC, Tellier LC, Vattikuti S, Purcell SM, Lee JJ. Second-generation PLINK: rising to the challenge of larger and richer datasets. GigaScience. (2015) 4:7. doi: 10.1186/s13742-015-0047-8
41. Kerimov N, Hayhurst JD, Peikova K, Manning JR, Walter P, Kolberg L, et al. A compendium of uniformly processed human gene expression and splicing quantitative trait loci. Nat Genet. (2021) 53:1290–9. doi: 10.1038/s41588-021-00924-w
42. Peduzzi P, Concato J, Kemper E, Holford TR, Feinstein AR. A simulation study of the number of events per variable in logistic regression analysis. J Clin Epidemiol. (1996) 49:1373–9. doi: 10.1016/s0895-4356(96)00236-3
43. Li YR, Keating BJ. Trans-ethnic genome-wide association studies: advantages and challenges of mapping in diverse populations. Genome Med. (2014) 6:91. doi: 10.1186/s13073-014-0091-5
44. Allman PH, Aban I, Long DM, Bridges SL, Srinivasasainagendra V, MacKenzie T, et al. A novel Mendelian randomization method with binary risk factor and outcome. Genet Epidemiol. (2021) 45:549–60. doi: 10.1002/gepi.22387
45. Hekselman I, Yeger-Lotem E. Mechanisms of tissue and cell-type specificity in heritable traits and diseases. Nat Rev Genet. (2020) 21:137–50. doi: 10.1038/s41576-019-0200-9
46. Arvanitis M, Tayeb K, Strober BJ, Battle A. Redefining tissue specificity of genetic regulation of gene expression in the presence of allelic heterogeneity. Am J Hum Genet. (2022) 109:223–39. doi: 10.1016/j.ajhg.2022.01.002
47. Finucane HK, Reshef YA, Anttila V, Slowikowski K, Gusev A, Byrnes A, et al. Heritability enrichment of specifically expressed genes identifies disease-relevant tissues and cell types. Nat Genet. (2018) 50:621–9. doi: 10.1038/s41588-018-0081-4
48. Hu X, Kim H, Stahl E, Plenge R, Daly M, Raychaudhuri S. Integrating autoimmune risk loci with gene-expression data identifies specific pathogenic immune cell subsets. Am J Hum Genet. (2011) 89:496–506. doi: 10.1016/j.ajhg.2011.09.002
Keywords: systemic lupus erythematosus (SLE), Mendelian randomization (MR), GWAS, eQTL, gene expression, genetics, causal inference, PHRF1
Citation: Chepelev I, Harley ITW and Harley JB (2023) Modeling of horizontal pleiotropy identifies possible causal gene expression in systemic lupus erythematosus. Front. Lupus 1:1234578. doi: 10.3389/flupu.2023.1234578
Received: 4 June 2023; Accepted: 12 September 2023;
Published: 3 October 2023.
Edited by:
Maria Gerosa, University of Milan, ItalyReviewed by:
Michelle Delano Catalina, AbbVie, United StatesMatthew Cook, University of Cambridge, United Kingdom
© 2023 Chepelev, Harley and Harley. This is an open-access article distributed under the terms of the Creative Commons Attribution License (CC BY). The use, distribution or reproduction in other forums is permitted, provided the original author(s) and the copyright owner(s) are credited and that the original publication in this journal is cited, in accordance with accepted academic practice. No use, distribution or reproduction is permitted which does not comply with these terms.
*Correspondence: Iouri Chepelev aWNoZXBlbGV2QGdtYWlsLmNvbQ== John B. Harley am9obmJoYXJsZXlAeWFob28uY29t