 Manish Kumar Singh1,†
 Guru Prashad Maiti1,†
 Harikrishna Reddy Rallabandi1
 Mehdi Fazel-Najafabadi1
 Loren L. Looger2
 Swapan K. Nath1*
- 1Arthritis and Clinical Immunology Research Program, Oklahoma Medical Research Foundation, Oklahoma City, OK, United States
- 2Department of Neurosciences, Howard Hughes Medical Institute, University of California San Diego, La Jolla, CA, United States
Background: Systemic lupus erythematosus (SLE) is a complex autoimmune disease with a strong genetic basis. Despite the identification of several single nucleotide polymorphisms (SNPs) near the SLC15A4 gene that are significantly associated with SLE across multiple populations, specific causal SNP(s) and molecular mechanisms responsible for disease susceptibility are unknown.
Methods: To address this gap, we employed bioinformatics, expression quantitative trait loci (eQTLs), and 3D chromatin interaction analysis to nominate a likely functional variant, rs35907548, in an active intronic enhancer of SLC15A4.
Results: Through luciferase reporter assays followed by chromatin immunoprecipitation (ChIP)-qPCR, we observed significant allele-specific enhancer effects of rs35907548 in diverse cell lines. The rs35907548 risk allele T is associated with increased regulatory activity and target gene expression, as shown by eQTLs and chromosome conformation capture (3C)-qPCR. The latter revealed long-range chromatin interactions between the rs35907548 enhancer and the promoters of SLC15A4, GLTLD1, and an uncharacterized lncRNA. The enhancer-promoter interactions and expression effects were validated by CRISPR/Cas9 knock-out (KO) of the locus in HL60 promyeloblast cells. KO cells also displayed dramatically dysregulated endolysosomal pH regulation.
Conclusions: Together, our data show that the rs35907548 risk allele affects multiple aspects of cellular physiology and may directly contribute to SLE.
1. Introduction
Systemic lupus erythematosus (SLE) is a chronic autoimmune disease characterized by immune attack on the body's tissues and organs, resulting in profound dyshomeostasis and damage to skin, joints, kidneys, cardiovascular system, and nervous system, among others. The disease is very heterogeneous, with each patient presenting uniquely, thus making diagnosis, treatment, and even basic understanding challenging (1). Gender and ethnicity significantly influence the incidence and severity of SLE, with females and individuals of African, Hispanic, and Asian ancestry being both more prone to SLE and to severe manifestations like kidney disease and frequent hospitalization. Conversely, European-ancestry SLE patients tend to exhibit more skin manifestations but less renal involvement. Therefore, managing SLE and its comorbidities requires a comprehensive internal medicine approach and an understanding of its diverse underlying pathogenic mechanisms (2–5).
SLE has a significant genetic component, evidenced by familial aggregation, sibling risk ratio, and twin studies (6). SLE appears to be a highly polygenic disease, with >100 risk loci implicated to date (7, 8). These SNPs and associated genes are involved in biological pathways related to tolerance, cell signaling, apoptosis, and other critical immune functions (9, 10). Molecular pathway analysis has revealed different underpinnings of immune system homeostasis and SLE risk in diverse ethnic populations (9, 11, 12), emphasizing the importance of studying the genetics of complex disease in multiple ethnicities—both to elucidate fundamental biochemical pathways and to develop personalized diagnostics and treatments.
SLC15A4 was discovered as an SLE risk locus in 2009 through GWAS on Chinese individuals. Since then, several SNPs have been associated with risk across Asian, European, Hispanic, and African ancestries (9). However, despite strong genetic association, the actual functional SNP(s) and underlying biological mechanism(s) contributing to SLE pathogenesis are not understood (13, 14).
SLC15A4, also known as peptide/histidine transporter 1 (PHT1), is a member of the solute carrier family 15 of proton-coupled oligopeptide transporters (13–16). It is primarily located on the endolysosomal membrane of immune cells, where it transports histidine and bacterially-derived dipeptides such as the NOD2 ligand muramyl dipeptide (MDP). SLC15A4 is crucial for lysosomal acidification, as it generates a proton gradient through transport of the proton acceptor histidine. Moreover, SLC15A4 can recruit the adapter molecule “TLR adaptor interacting with SLC15A4 on the lysosome” (TASL), which regulates Toll-like receptor (TLR) function and promotes downstream signaling through type I interferon and Interferon Response Factor 5 (IRF5) (17). Therefore, SLC15A4 plays a crucial role in regulating lysosomal function and innate immunity. SLC15A4 deficiency may promote lysosomal dysfunction and impaired autophagy, both associated with various autoimmune diseases, including SLE (18). Consequently, these findings suggest that pharmacological intervention to restore or supplement the function of SLC15A4 may be a promising therapeutic approach for treating lupus and other endosomal TLR-dependent diseases (18–21).
Here, we employ systematic bioinformatics to investigate SNPs in the SLC15A4 locus, identifying rs35907548 as a likely regulatory variant. We show that this variant indeed underlies activity of a potent enhancer, chromatin interactions, expression of SLC15A4 and nearby genes, and ultimately plays a decisive role in maintaining endolysosomal acidification, critical for proper function of immune cells. Our results finely localize SLE risk of the highly associated SLC15A4 locus and give mechanistic insight into its function.
2. Materials and methods
2.1. Bioinformatics
To comprehensively assess the potential functional significance of SNPs within this locus, we performed an unbiased evaluation using a range of bioinformatics tools.
First, we identified all SNPs in high linkage disequilibrium (>80% LD) with the five index SNPs, identified as genome-wide significant (p < 5 × 10⁻⁸) in studies from individuals with Asian (22–24) and with European (25, 26) ancestries. Subsequently, we used RegulomeDB (27) and Ldlink (28) to prioritize and rank these SNPs based on their potential regulatory roles. We then integrated data about cis-regulatory elements, including assessments of chromatin accessibility (from ATAC-seq and DNase-I hypersensitivity assays), well-established histone modifications such as H3K27ac, H3K4me1, and H3K4me3, and the extent of RNA polymerase II (Pol II) binding. This data was sourced from ENCODE (29), focusing on information derived from immune cell lines. Additionally, we incorporated data regarding transcription factor binding sites from ENCODE's resources.
For each SNP, to assess its impact on immune cell type-specific expression quantitative trait loci (eQTLs) and its influence on target gene expression, we leveraged data from ImmuNexUT (the Immune Cell Gene Expression Atlas based on the Japanese population from the University of Tokyo) (30). This resource encompasses a diverse array of 28 immune cell types from both healthy individuals and those diagnosed with ten different immune diseases. To broaden the scope of our analysis, we also integrated additional eQTL databases, including eQTLgen (31), which is tailored to SNP-based eQTLs within the European population.
We utilized RegulomeDB and Ldlink to prioritize SNP regulatory potential. We added information on cis-regulatory elements, including chromatin accessibility (ATAC-seq and DNase-I hypersensitivity), canonical histone modifications (H3K27ac, H3K4me1, H3K4me3), and RNA polymerase II (Pol II) binding, from ENCODE data from immune cell lines. Transcription factor binding sites were taken from ENCODE as well.
To evaluate cell type-specific expression quantitative trait loci (eQTLs) and target gene expression, we used data from ImmuNexUT (Immune Cell Gene Expression Atlas from the University of Tokyo), encompassing 28 immune cell types from both healthy donors and individuals with ten immune diseases. To broaden our analysis, we added other eQTL databases, including eQTLgen, which is tailored for European SNP-based eQTLs.
2.2. Cell lines
Dual-luciferase reporter assays were performed in HEK293, lymphoblastoid cell lines (LCLs; B-cell), Jurkat (T-cell), and HL-60 (promyeloblast). ChIP-qPCR assays were performed in LCLs (GM18624, GM18603). Chromatin conformation capture (3C) experiments were in the same LCLs. CRISPR/Cas9 gene editing was in HL-60. Endolysosomal pH measurements were in wild-type and gene-edited HL-60. All cell lines were purchased from ATCC (American Type Culture Collection). All cells were tested for mycoplasma by PCR and used between passages 4 and 7.
2.3. Dual-luciferase assay
To investigate whether the rs35907548 region has enhancer activity, we utilized the well-established Dual-Luciferase Reporter Assay System. A detailed description of the method is provided elsewhere (32, 33). Briefly, we cloned the 300 bp region, rs35907548 at the middle (chr12:129,282,013-129,282,312, hg 19) locus into pGL4.26 (Promega) and co-transfected with pGL4.74 (internal control) in HEK293, LCL, Jurkat, and HL-60 cells. After 24 h, enhancer activity was measured using a Synergy H1 spectrophotometer (BioTek). Three experimental replicates were performed per cell type. Statistical significance was assessed by Student's t-test using GraphPad PRISM; p-value of <0.05 was considered significant. We used two non-coding SNPs, rs12831705 and rs34616325, as negative controls for allele-specific luciferase activity.
2.4. Chromatin immunoprecipitation and quantitative PCR (ChIP-qPCR)
To investigate whether the rs35907548 region shows allele-specific binding to specific histone marks (H3K27ac, H3K4me1, and H3K4me3), we conducted ChIP-qPCR assays using the Magnify ChIP assay (Cat No. 492024, Thermo-Fisher, Waltham, MA, USA), following manufacturer's guidelines. A detailed description of the method is provided elsewhere (32, 33). Briefly, 1.5–2 × 10⁶ homozygous rs35907548 risk-“TT” (GM18603) and non-risk-“CC” (GM18624) genotype B-lymphoblastoid LCLs (Coriell) were cross-linked with 1% paraformaldehyde, washed, and sonicated. Immunoprecipitation was performed overnight at 4°C with antibodies against individual histone marks or other DNA-binding proteins pre-incubated with Dynamag magnetic A + G beads. After reverse crosslinking and elution, real-time qPCR analysis was performed with SYBR Green and primers flanking the rs35907548 region using an Applied Biosystems 7900HT qPCR machine. Statistical significance was assessed by Student's t-test using GraphPad PRISM software, and a p-value of <0.05 was considered significant. Detailed methods are described in Supplementary Materials and Methods.
2.5. Chromatin conformation capture (3C) with quantitative PCR (3C-qPCR)
To investigate the chromatin interactions between the promoters of the target genes and the rs35907548 region in an ex vivo context, we utilized 3C-qPCR in LCL and Jurkat cells. Detailed protocols are provided elsewhere (32, 33). Briefly, cells were suspended in complete media with 10% FBS (1 × 10⁶/ml media) at 70%–80% confluency and cross-linked with 1% paraformaldehyde at room temperature for 10 min. Following quenching with 0.2 M glycine, cross-linked cells were lysed in buffer containing protease inhibitors. Cross-linked nuclei were purified, suspended in 0.5% SDS, and incubated at 62°C for 10 min followed by quenching with Triton X-100. Perforated nuclei were digested with 400 U HindIII and DpnII at 37°C overnight and in-nucleus ligated with T4 DNA ligase at 20°C for 4 h. A small volume of the digested mixture was reserved to evaluate digestion efficiency. DNA was purified from ligated chromatin with proteinase K digestion, phenol-chloroform extraction, and alcohol precipitation. Purified DNA was quantified and diluted for 3C-qPCR. Primers were designed to amplify several promoter regions based on restriction maps. Primers within the rs35907548 enhancer were used as common primers for other fragments. Primer sequences are in Supplementary Table 1. Cross-linking frequencies were calculated from PCR band intensity. Data were plotted as relative interaction frequency vs. genomic distance from rs35907548.
2.6. CRISPR/Cas9 gene editing
To evaluate the functional consequences of the rs35907548 region, we utilized CRISPR/Cas9 gene editing. Detailed experimental protocols are available elsewhere (32, 33). Short-guide RNA (sgRNA)/Cas9 RNP complexes were introduced into HL-60 cells by Neon Electroporation System. Genomic DNA was extracted three days post-transfection and Sanger-sequenced to verify deletion. Indel efficiency was determined using TIDE and ICE. Subsequently, pooled edited cells were cultured and harvested for gene expression measurements. sgRNA sequences are in Supplementary Table 1. Three experimental replicates were performed per cell type. Statistical significance was assessed by Student's t-test using GraphPad PRISM; p-value of <0.05 was considered significant.
2.7. Quantitative real-time PCR (qRT-PCR)
Pooled CRISPR/Cas9-edited cells were used for RNA purification using the RNA Mini-prep kit (Zymo Research). Purity and concentration were measured using a NanoDrop spectrophotometer. Approximately 700 ng total purified RNA was used to generate cDNA with the iScript cDNA Synthesis kit (Bio-Rad). cDNA was used for PCR to quantify gene expression for SLC15A4, GLTD1, and lncRNA AC069262.1 using qRT-PCR LightCycler 480 Instrument II (Roche) using specific primers and iTaq Universal SYBR Green Supermix (Bio-Rad). To normalize gene expression data, 18S rRNA was used as an internal control. Primer sequences are in Supplementary Table 1.
2.8. Endolysosomal pH
To assess differences in endolysosomal pH between WT and KO cells, we used the pHrodo® Red AM Intracellular pH Indicator (Thermo-Fisher) following manufacturer's protocol. Briefly, WT and KO cells (0.2 × 10⁶ cells) were stained with 5 μM pHrodo® Red AM at 37°C for 30 min in 96-well plates. Cells were washed with Live Cell Imaging Media, and standard buffers containing 10 μM nigericin and 10 μM valinomycin were added to specific wells for 5 min to clamp intracellular pH values at 4.5, 5.5, 6.5, and 7.5. The average cellular fluorescence was measured in triplicate samples using a spectrophotometer (Synergy H1, BioTek). A standard curve was generated for WT and KO samples, showing a linear relationship between intracellular pH and relative fluorescence units.
3. Results
3.1. Systematic bioinformatics prioritizes rs35907548 as a likely regulatory SNP
We used diverse bioinformatics tools to assess the regulatory potential of all 77 high-linkage disequilibrium (LD; r2 > 80%) SNPs in and around the SLC15A4 locus (Supplementary Table 2). These 77 SNPs were generated from five significantly associated (p < 5 × 10⁻⁸) index SNPs (rs10847697/rs1385374 (22), rs12370194 (23), rs10593112 (26), and rs11059928 (24). RegulomeDB2 ranked all SNPs for regulatory potential, prioritizing intronic rs35907548 (Supplementary Table 2). We used ENCODE (29)-annotated histone marks, chromatin accessibility, and RNA Pol II occupancy to identify active chromatin, within which rs35907548 lies (Figure 1). ENCODE annotated rs35907548 as a “distal enhancer-like” candidate cis-regulatory element (cCRE). We used PCHi-C chromatin conformation data to identify several regions topologically associated with rs35907548 in multiple immune cells (Figure 1). To investigate the impact of rs35907548 on target gene expression, we conducted a thorough search in publicly available expression quantitative trait locus (eQTL) databases, specifically focusing on patient-derived primary immune cells (30). Our findings indicate that rs35907548 acts as an eQTL for SLC15A4 in various immune cell types (Supplementary Figure 1). Notably, plasmacytoid dendritic cells (pDCs) exhibit the most significant eQTLs on SLC15A4. Finally, rs35907548 is in the middle of multiple transcription factor binding sites (Supplementary Figure 2), where the risk allele T is universally conserved among motifs. These transcription factors include Ikaros family zinc finger protein 1 (IKZF1), IKZF3, E74-like factor 1 (ELF1), Friend leukemia integration 1 transcription factor (FLI1), and ETS1, all of which are SLE risk genes themselves (34–38).
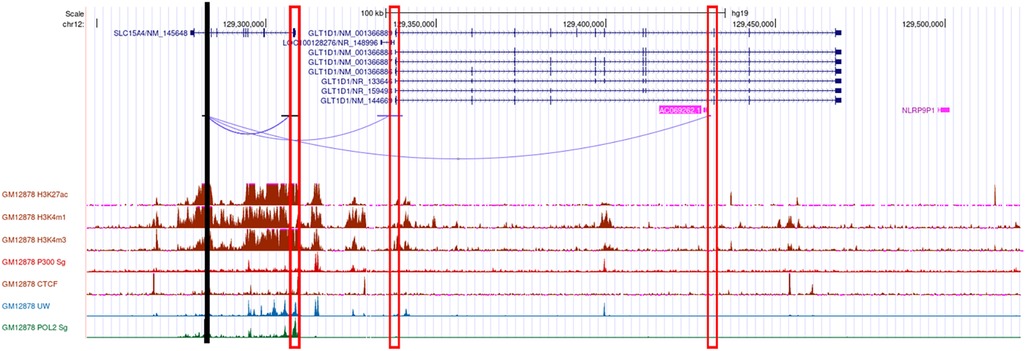
Figure 1. Bioinformatics. Cartoon showing the genomic location of rs35907548 (black vertical line), PCHi-C interactions from rs35907548 to the promoters (rectangle boxes) of the neighboring genes, regulatory histone marks, and Pol 2.
3.2. rs35907548 risk allele increases enhancer activity in diverse cell lines
We assessed allele-specific enhancer activity of rs35907548 using dual-luciferase reporter enhancer assays in both non-immune HEK293 cells and immune cells including Jurkat, HL-60, and LCL B-cells. In all cell types, the rs35907548 risk allele (TT) exhibited notably higher enhancer activity compared to the non-risk allele (CC) (p-values: <0.0001, <0.001, 0.016, 0.0016; as shown in Figure 2A). As negative controls, we selected two non-coding SNPs, rs12831705 and rs34616325. Both SNPs, at distances of 12.7 kb and 25.5 kb from the target SNP, respectively, are scored “1f” (i.e., predicted to have a similar regulatory potential as rs35907548; Supplementary Table 2) by RegulomeDB and are in strong linkage disequilibrium (LD) with rs35907548. Our results show insignificant regulatory activity for both negative control SNPs in HEK293 and LCL (Supplementary Figure 3), increasing the confidence in the observed activity of rs35907548.
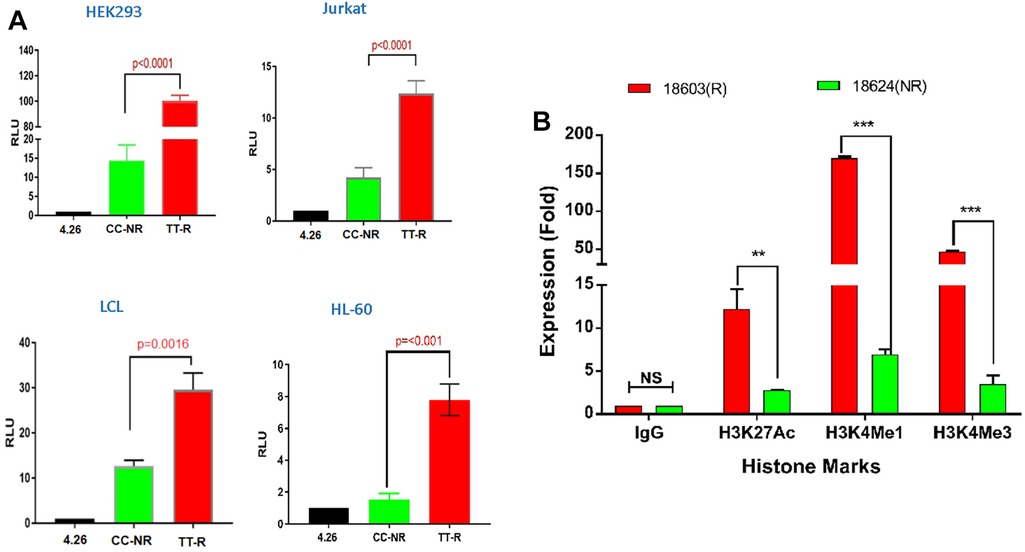
Figure 2. Allelic-specific regulatory effects of the rs35907548 enhancer. (A) Luciferase reporter assays on 4 cell types. (B) ChIP-qPCR with risk (R) and non-risk (NR) LCLs.
Using ChIP-grade antibodies, we analyzed the specific binding patterns of three regulatory histone marks—namely, H3K27ac, H3K4me1, and H3K4me3—at the SNP site within its biological context. The quantification of binding was conducted through ChIP-qPCR (Figure 2B). Across all three marks, we observed a distinct and heightened level of binding in GM18603 (the risk TT genotype) when compared to GM18624 (the non-risk CC genotype) (H3K27ac: p = 0.002, ∼4-fold increase; H3K4me1: p < 0.001, ∼20-fold increase; H3K4me3: p < 0.001, ∼13-fold increase). This substantiates the prevailing notion that the SNP is situated within an active enhancer region, where intricate interactions involving RNA polymerase, histone marks, chromatin modulators, and allele-specific components collectively oversee the orchestration of transcriptional control at these specific loci.
3.3. The rs35907548 enhancer establishes long-range chromatin interactions with target gene promoters
Given that rs35907548 demonstrated allele-specific enhancer activity across all examined cell lines, we set out to explore its potential involvement in establishing promoter-enhancer connections through chromatin interactions. To explore these interactions, we performed 3C-qPCR experiments between the SNP and gene promoters (Figure 3). Our findings aligned with previous eQTL and PCHi-C data, unveiling interactions between the enhancer-SNP region and the promoters of SLC15A4, GLT1D1, and IncRNA AC069262.1 (as illustrated in Figure 1). These collective results imply that the enhancer region encompassing rs35907548 could play an active regulatory role in governing the expression of SLC15A4, GLT1D1, and IncRNA AC069262.1.
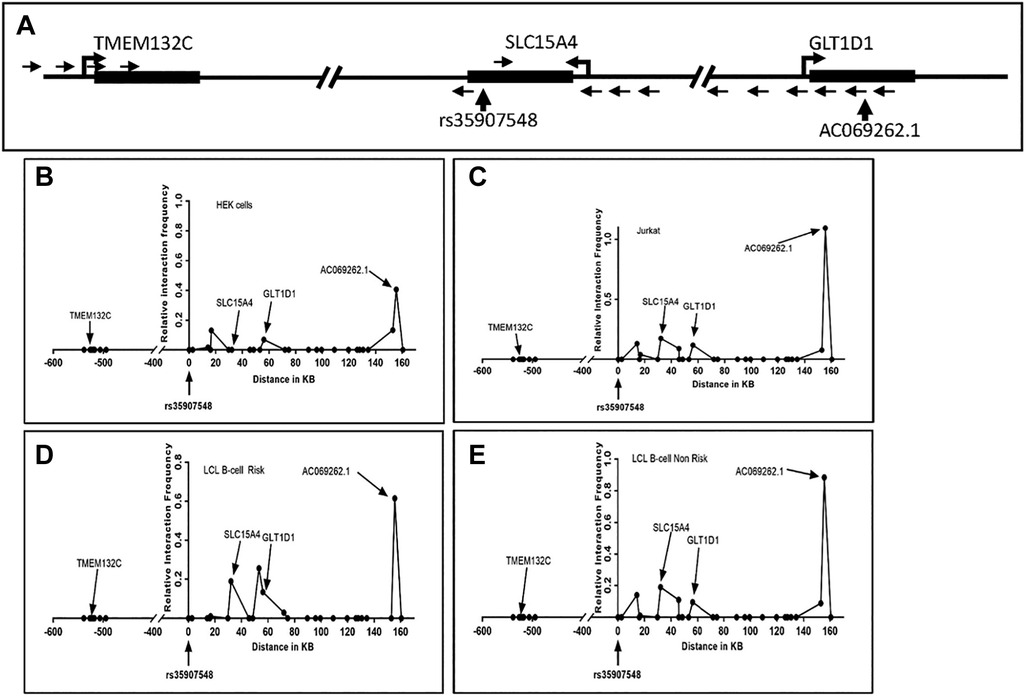
Figure 3. 3C interaction analysis. (A) Schematic of the rs35907548 region and neighboring genes. SacI restriction enzyme sites were used to design primers. Small arrows represent primer locations and orientations. The common primer at the rs35907548 region is common for all other primers at SLC15A4, GLT1D1 and TMEM132C promoter regions. Big arrowheads represent transcriptional start sites (TSSs). (B-E) Graphs show relative interactions of rs35907548 regions with different genomic regions in HEK (B), Jurkat (C) and EBV-transformed LCL B-cells (D, E). The relative interaction frequency for each set of primers represents the intensity of PCR. X-axis shows genomic distance (in kb) in forward and reverse directions from rs35907548 (0 kb).
3.4. Validating transcriptional effects with CRISPR-based genome editing
To validate the transcriptional regulatory effects of the rs35907548 locus, we used three short-guide RNAs (sgRNAs) to delete ∼140 bases around rs35907548 in HL-60 cells (Figure 4A and Supplementary Figure 4). The deletion was confirmed with Sanger sequencing, and ICE analysis demonstrated high indel efficiency (63%) of pooled cells (data not shown). Subsequently, we determined expression levels of SLC15A4, GLT1D1, and lncRNA AC069262.1 in KO and WT cells. Expression levels were lower in KO cells than WT (∼45%, p < 0.0001; ∼25%, p < 0.01; and ∼35%, p < 0.001, respectively; Figure 4B). These findings provide further evidence that rs35907548 exerts regulatory effects to influence the expression of SLC15A4 and other target genes through its enhancer activity.
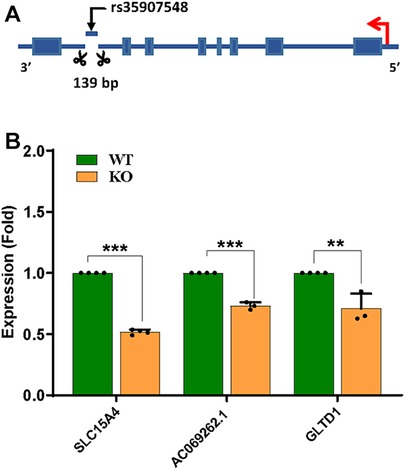
Figure 4. CRISPR/Cas9-based enhancer deletion. (A) CRISPR-based deletion, (B) qPCR-based target gene expression between WT and KO.
3.5. Impact of the rs35907548 enhancer on endolysosomal acidification
SLC15A4 plays a crucial role in maintaining the acidic environment of the endolysosomal compartment (39). We found that KO cells expressed less SLC15A4; consistent with this, KO cells showed a dramatic increase over WT in endolysosomal pH (5.3 vs. 4.5, p < 0.01; Figure 5). These data underscore the crucial link between SLC15A4, maintenance of the acidic environment in endolysosomal compartments, and subsequent effects on cellular pH regulation.
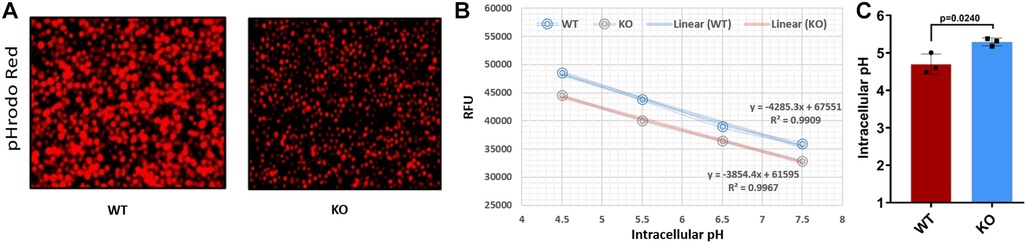
Figure 5. Comparing the endolysosomal acidification between WT and KO cells. (A) pHrodo™ Red AM-stained WT and KO cells under a fluorescent microscope. (B) Standard curve for WT and KO cells using pHrodo™ Red AM with Intracellular pH Calibration Buffer Kit for the translation of fluorescence ratios into pH. (C) pH determined for WT and KO using standard curve and manufacturer's protocols. RFU, relative fluorescence units.
4. Discussion
GWAS analyses invariably yield association peaks, which are often extensive, encompassing numerous genes and hundreds of SNPs. Searching within these broad GWAS peaks to pinpoint true causal variants and elucidate their underlying mechanisms is a formidable task (40). Nevertheless, it is an essential prerequisite for mapping and understanding disease risk and identifying opportunities for diagnosis and treatment. Several studies have associated SLC15A4 SNPs with increased SLE risk in both Asian and European populations (18, 19, 41), although experimental validation is lacking. We sought to comprehensively analyze potentially functional SNPs, and experimentally validate the best candidate(s).
Autoimmune diseases share many pathways and underlying mechanisms, and some risk SNPs are shared among diseases. Some SNPs, however, appear specific to a single disease. We thus asked whether SLC15A4 is a susceptibility gene specific to SLE, or if it has links to other autoimmune diseases. A comprehensive search of a GWAS catalog (https://www.ebi.ac.uk/gwas/) revealed that several GWAS studies have connected SLC15A4 exclusively with SLE susceptibility, while none have associated it with other autoimmune diseases. Thus, at this point, we conclude that SLC15A4 is an SLE-specific susceptibility gene.
Here, we localize SLC15A4 SLE risk to the intronic SNP rs35907548, at the center of an enhancer modulating expression of—and physically interacting with—SLC15A4 and nearby genes. Dual-luciferase reporter assays revealed strong enhancer activity, particularly of the risk “TT” allele, in diverse cell types. The risk allele consistently showed substantially higher binding to active histone marks. We confirmed the activity of the rs35907548 enhancer in cells by creating CRISPR/Cas9 knock-out cells, which showed significantly lower levels of SLC15A4, GLT1D1, and the uncharacterized lncRNA AC069262.1. SLC15A4 is a histidine transporter located primarily on the endolysosomal membrane, where it plays several pivotal roles including maintenance of endolysosomal acidification (19, 39), thus regulating protein degradation, inflammation, endocytosis, and autophagy, among other processes (42–44). Accordingly, KO cells failed to properly acidify the endolysosome, demonstrating the profound effects of the rs35907548 enhancer on cell physiology.
Several studies have suggested SLC15A4 as a potential therapeutic target for SLE and other autoimmune diseases (21, 39, 45). In mouse models, the absence of SLC15A4 has been shown to confer resistance to the development of multiple autoimmune diseases, including dextran sulfate sodium (DSS)-induced colitis (wherein Slc15a4−/− pDCs fail to produce IFNα upon TLR7 agonist R848 stimulation) and the Faslpr model of SLE (18). This observation is significant as TLR7/8 inhibitors are currently in clinical trials for SLE (19). These findings collectively underscore the dysregulation of lysosomal pH, particularly deacidification, in autoimmune diseases such as SLE. This dysregulation is closely linked to the activity of lysosomal hydrolases.
Interestingly, two widely used anti-malarial drugs, hydroxychloroquine and chloroquine, are commonly used to treat SLE. These drugs have many cellular targets and complicated mechanisms of action. The weak base drugs accumulate in acidic compartments like the lysosome, where they increase pH by becoming protonated. The drugs also directly inhibit lysosomal hydrolases, increasing pH by a further two units. Finally, they block stimulation of Toll-like receptor 9 (TLR9) family members, decreasing innate immune reactivity. Together, these effects decrease lysosome activity and inflammasome activation and mitigate inflammation. The precise mechanisms through which these drugs benefit SLE patients are still being investigated, and other cellular targets may be discovered. Despite this incomplete understanding, these drugs are critical tools in managing SLE (46–48).
Crucially, our study identifies SLC15A4 as a genetic locus linked to substantially elevated SLE risk. Given its central role in governing endolysosomal pH and activity, this genetic variation likely contributes to SLE susceptibility, aligning well with the fact that endolysosomal modulator drugs are essentially the only SLE drugs of note. Our findings, as depicted in Figures 2A, 4, point to heightened SLC15A4 expression in SLE patients. Importantly, a recent study (49) lends additional support to this assertion. Despite its reliance on a limited sample size, the study reports significantly elevated SLC15A4 mRNA in PBMCs from SLE patients compared to healthy controls. This observation bolsters the association between SLC15A4 expression and autoimmune diseases such as SLE (50).
rs35907548 lies in the middle of multiple conserved transcription factor binding sites, including those for SLE risk genes and white blood cell factors IKZF1, IKZF3, ELF1, FLI1, and ETS1; the ancestral risk allele T is universally present in the binding motifs. It is likely that proper binding of these transcription factors is critical to enhancer function, and indeed the risk allele T shows much higher levels of active chromatin marks and enhancer activity, implying a heightened regulatory role.
The convergence of various elements—including the existence of evolutionarily conserved binding sites, the participation of transcription factors associated with immune processes and SLE, and the distinct presence of the risk allele within these motifs—collectively implies a complex interplay that likely underlies the regulatory function of the enhancer. These findings emphasize the intricate and multifaceted nature of genetic aspects of disease susceptibility and cellular function.
The intricate interplay between SLC15A4 and the rs35907548 variant emerges as a pivotal factor in the context of SLE pathogenesis. Our findings, combined with other recent research, strongly suggest that this regulatory variant is closely linked to altered immune and inflammatory processes, significantly influencing SLE susceptibility.
To elaborate, SLC15A4 is involved in regulating immune responses, particularly reactions to viral and bacterial infections (51). Immune dysregulation, wherein an overactive immune system generates autoantibodies against the body's cells and tissues, is a hallmark of SLE. Furthermore, the fact that SLE is characterized by heightened levels of type I interferons (IFN-I) makes the association between SLC15A4 and IFN-I production especially noteworthy (17, 50, 52). Excessive IFN-I production is a significant contributor to SLE pathogenesis. Therefore, SLC15A4's potential influence on IFN-I production likely contributes to the observed inflammatory environment in SLE. Additionally, SLC15A4 is intricately linked to autophagy (53), a cellular process responsible for degrading damaged or unnecessary cellular components. Autophagy also plays a critical role in immune system regulation. Since abnormalities in autophagy have been linked to SLE, it further underscores the importance of this gene variant in SLE pathogenesis.
The adjacent locus Glycosyltransferase 1 Domain Containing 1 (GLT1D1) has also been flagged as an SLE risk locus (54). GLT1D1 targets programmed cell death-ligand 1 (PD-L1) for glycosylation (55); glycosylated PD-L1 is strongly immunosuppressive and correlates with B-cell non-Hodgkin's lymphoma progression. In addition to the links to endolysosomal acidification, TLR signaling, and autophagy through SLC15A4, future experiments will investigate the contribution of rs35907548 and other SNPs to SLE risk through GLT1D1. The role of lncRNA AC069262.1 in biological processes and diseases, including SLE, remains largely unexplored. Further investigations are required to uncover its potential significance and contribution to SLE.
In the present study, our primary objective was to define susceptibility regions likely to contain functional SNP(s) linked to increased lupus risk. Leveraging bioinformatics and experiments, we identified rs35907548 within an active enhancer with the capacity to modulate the expression of target genes with critical immune functions. Nevertheless, we acknowledge a limitation of our study, namely that we have not explicitly demonstrated the effects of the single base-pair change on target gene expression, endolysosomal pH, or other cellular properties. To address this limitation, advanced techniques like CRISPR base-editing or prime-editing will be required. We have demonstrated numerous specific effects of the single base-pair change (transcription factor binding, enhancer activity, chromatin contacts) from both in vitro experiments and from data acquired from in vivo samples, which are strongly consistent with the cellular effects that we observe from CRISPR deletion of the rs35907548 locus. Future studies will validate the cellular effects of the single base-pair change, allowing stronger conclusions to be made about the effect of the rs35907548 SNP on SLE development and progression.
In summary, our study both identifies a SNP causally underlying SLE risk association at the SLC15A4 locus and establishes an analytical and experimental framework for studying risk SNPs at SLC15A4 and other loci. The results and framework may contribute to future investigation of therapeutic interventions and diagnostics.
Data availability statement
The datasets presented in this study can be found in online repositories. The names of the repository can be found below: RegulomeDB: https://regulomedb.org/regulome-search/; Ldlink: https://ldlink.nih.gov/?tab=home.
Ethics statement
Ethical approval was not required for the studies on humans in accordance with the local legislation and institutional requirements because only commercially available established cell lines were used.
Author contributions
SN conceived and designed the study. MS, GM, and HR conducted and validated the experiments. MF-N, LL, and SN organized the database and conducted bioinformatics analyses. SN, GM, MS, and LL wrote the manuscript. All authors contributed to the article and approved the submitted version.
Funding
Research reported in this publication was supported by National Institutes of Health grants R01AI172255, R21AI168943, and R21AI144829.
Acknowledgments
The authors wish to sincerely express their appreciation to Dr. Valerie Harris for her invaluable advice on setting up the pHrodo experiments. Furthermore, they extend their thanks to Ms. Louise Williamson for her technical assistance during the preparation of the manuscript.
Conflict of interest
The authors declare that the research was conducted in the absence of any commercial or financial relationships that could be construed as a potential conflict of interest.
Publisher's note
All claims expressed in this article are solely those of the authors and do not necessarily represent those of their affiliated organizations, or those of the publisher, the editors and the reviewers. Any product that may be evaluated in this article, or claim that may be made by its manufacturer, is not guaranteed or endorsed by the publisher.
Supplementary material
The Supplementary Material for this article can be found online at: https://www.frontiersin.org/articles/10.3389/flupu.2023.1244670/full#supplementary-material
References
1. Crow MK. Pathogenesis of systemic lupus erythematosus: risks, mechanisms and therapeutic targets. Ann Rheum Dis. (2023) 82(8):999–1014. doi: 10.1136/ard-2022-223741
2. Aguirre A, Izadi Z, Trupin L, Barbour KE, Greenlund KJ, Katz P, et al. Race, ethnicity, and disparities in the risk of end-organ lupus manifestations following a systemic lupus erythematosus diagnosis in a multiethnic cohort. Arthritis Care Res (Hoboken). (2023) 75(1):34–43. doi: 10.1002/acr.24892
3. Kabani N, Ginzler EM. Is ethnicity linked to the severity of SLE manifestations? Nat Rev Rheumatol. (2019) 15(9):515–6. doi: 10.1038/s41584-019-0271-1
4. Lewis MJ, Jawad AS. The effect of ethnicity and genetic ancestry on the epidemiology, clinical features and outcome of systemic lupus erythematosus. Rheumatology (Oxford). (2017) 56(Suppl 1):i67–77. doi: 10.1093/rheumatology/kew399
5. Maningding E, Dall'Era M, Trupin L, Murphy LB, Yazdany J. Racial and ethnic differences in the prevalence and time to onset of manifestations of systemic lupus erythematosus: the California lupus surveillance project. Arthritis Care Res (Hoboken). (2020) 72(5):622–9. doi: 10.1002/acr.23887
6. Kuo CF, Grainge MJ, Valdes AM, See LC, Luo SF, Yu KH, et al. Familial aggregation of systemic lupus erythematosus and coaggregation of autoimmune diseases in affected families. JAMA Intern Med. (2015) 175(9):1518–26. doi: 10.1001/jamainternmed.2015.3528
7. Harley ITW, Sawalha AH. Systemic lupus erythematosus as a genetic disease. Clin Immunol. (2022) 236:108953. doi: 10.1016/j.clim.2022.108953
8. Molineros JE, Yang W, Zhou XJ, Sun C, Okada Y, Zhang H, et al. Confirmation of five novel susceptibility loci for systemic lupus erythematosus (SLE) and integrated network analysis of 82 SLE susceptibility loci. Hum Mol Genet. (2017) 26(6):1205–16. doi: 10.1093/hmg/ddx026
9. Owen KA, Bell KA, Price A, Bachali P, Ainsworth H, Marion MC, et al. Molecular pathways identified from single nucleotide polymorphisms demonstrate mechanistic differences in systemic lupus erythematosus patients of Asian and European ancestry. Sci Rep. (2023) 13(1):5339. doi: 10.1038/s41598-023-32569-6
10. Theofilopoulos AN, Kono DH, Baccala R. The multiple pathways to autoimmunity. Nat Immunol. (2017) 18(7):716–24. doi: 10.1038/ni.3731
11. Owen KA, Price A, Ainsworth H, Aidukaitis BN, Bachali P, Catalina MD, et al. Analysis of trans-ancestral SLE risk loci identifies unique biologic networks and drug targets in African and European ancestries. Am J Hum Genet. (2020) 107(5):864–81. doi: 10.1016/j.ajhg.2020.09.007
12. Wang YF, Wei W, Tangtanatakul P, Zheng L, Lei Y, Lin Z, et al. Identification of shared and Asian-specific loci for systemic lupus erythematosus and evidence for roles of type III interferon signaling and lysosomal function in the disease: a multi-ancestral genome-wide association study. Arthritis Rheumatol. (2022) 74(5):840–8. doi: 10.1002/art.42021
13. Toyama-Sorimachi N, Kobayashi T. Lysosomal amino acid transporters as key players in inflammatory diseases. Int Immunol. (2021) 33(12):853–8. doi: 10.1093/intimm/dxab069
14. Yamashita T, Shimada S, Guo W, Sato K, Kohmura E, Hayakawa T, et al. Cloning and functional expression of a brain peptide/histidine transporter. J Biol Chem. (1997) 272(15):10205–11. doi: 10.1074/jbc.272.15.10205
15. Daniel H, Kottra G. The proton oligopeptide cotransporter family SLC15 in physiology and pharmacology. Pflugers Arch. (2004) 447(5):610–8. doi: 10.1007/s00424-003-1101-4
16. Smith DE, Clémençon B, Hediger MA. Proton-coupled oligopeptide transporter family SLC15: physiological, pharmacological and pathological implications. Mol Aspects Med. (2013) 34(2–3):323–36. doi: 10.1016/j.mam.2012.11.003
17. Heinz LX, Lee J, Kapoor U, Kartnig F, Sedlyarov V, Papakostas K, et al. TASL is the SLC15A4-associated adaptor for IRF5 activation by TLR7-9. Nature. (2020) 581(7808):316–22. doi: 10.1038/s41586-020-2282-0
18. Baccala R, Gonzalez-Quintial R, Blasius AL, Rimann I, Ozato K, Kono DH, et al. Essential requirement for IRF8 and SLC15A4 implicates plasmacytoid dendritic cells in the pathogenesis of lupus. Proc Natl Acad Sci U S A. (2013) 110(8):2940–5. doi: 10.1073/pnas.1222798110
19. Katewa A, Suto E, Hui J, Heredia J, Liang J, Hackney J, et al. The peptide symporter SLC15a4 is essential for the development of systemic lupus erythematosus in murine models. PLoS ONE. (2021) 16(1):e0244439. doi: 10.1371/journal.pone.0244439
20. Kobayashi T, Tsutsui H, Shimabukuro-Demoto S, Yoshida-Sugitani R, Karyu H, Furuyama-Tanaka K, et al. Lysosome biogenesis regulated by the amino-acid transporter SLC15A4 is critical for functional integrity of mast cells. Int Immunol. (2017) 29(12):551–66. doi: 10.1093/intimm/dxx063
21. Rimann I, Gonzalez-Quintial R, Baccala R, Kiosses WB, Teijaro JR, Parker CG, et al. The solute carrier SLC15A4 is required for optimal trafficking of nucleic acid-sensing TLRs and ligands to endolysosomes. Proc Natl Acad Sci U S A. (2022) 119(14):e2200544119. doi: 10.1073/pnas.2200544119
22. Han JW, Zheng HF, Cui Y, Sun LD, Ye DQ, Hu Z, et al. Genome-wide association study in a Chinese han population identifies nine new susceptibility loci for systemic lupus erythematosus. Nat Genet. (2009) 41(11):1234–7. doi: 10.1038/ng.472
23. Sun C, Molineros JE, Looger LL, Zhou XJ, Kim K, Okada Y, et al. High-density genotyping of immune-related loci identifies new SLE risk variants in individuals with Asian ancestry. Nat Genet. (2016) 48(3):323–30. doi: 10.1038/ng.3496
24. Yin X, Kim K, Suetsugu H, Bang SY, Wen L, Koido M, et al. Meta-analysis of 208370 east asians identifies 113 susceptibility loci for systemic lupus erythematosus. Ann Rheum Dis. (2020) 80(5):632–40. doi: 10.1136/annrheumdis-2020-219209
25. Bentham J, Morris DL, Cunninghame Graham DS, Pinder CL, Tombleson P, Behrens TW, et al. Genetic association analyses implicate aberrant regulation of innate and adaptive immunity genes in the pathogenesis of systemic lupus erythematosus. Nat Genet. (2015) 47(12):1457–64. doi: 10.1038/ng.3434
26. Langefeld CD, Ainsworth HC, Cunninghame Graham DS, Kelly JA, Comeau ME, Marion MC, et al. Transancestral mapping and genetic load in systemic lupus erythematosus. Nat Commun. (2017) 8:16021. doi: 10.1038/ncomms16021
27. Boyle AP, Hong EL, Hariharan M, Cheng Y, Schaub MA, Kasowski M, et al. Annotation of functional variation in personal genomes using RegulomeDB. Genome Res. (2012) 22(9):1790–7. doi: 10.1101/gr.137323.112
28. Machiela MJ, Chanock SJ. LDlink: a web-based application for exploring population-specific haplotype structure and linking correlated alleles of possible functional variants. Bioinformatics. (2015) 31(21):3555–7. doi: 10.1093/bioinformatics/btv402
29. Consortium EP. An integrated encyclopedia of DNA elements in the human genome. Nature. (2012) 489(7414):57–74. doi: 10.1038/nature11247
30. Ota M, Nagafuchi Y, Hatano H, Ishigaki K, Terao C, Takeshima Y, et al. Dynamic landscape of immune cell-specific gene regulation in immune-mediated diseases. Cell. (2021) 184(11):3006–21.e17. doi: 10.1016/j.cell.2021.03.056
31. Võsa U, Claringbould A, Westra HJ, Bonder MJ, Deelen P, Zeng B, et al. Large-scale cis- and trans-eQTL analyses identify thousands of genetic loci and polygenic scores that regulate blood gene expression. Nat Genet. (2021) 53(9):1300–10. doi: 10.1038/s41588-021-00913-z
32. Fazel-Najafabadi M, Rallabandi HR, Singh MK, Maiti GP, Morris J, Looger LL, et al. Discovery and functional characterization of two regulatory variants underlying lupus susceptibility at 2p13.1. Genes (Basel). (2022) 13(6):1016. doi: 10.3390/genes13061016
33. Singh B, Maiti GP, Zhou X, Fazel-Najafabadi M, Bae SC, Sun C, et al. Lupus susceptibility region containing CDKN1B rs34330 mechanistically influences expression and function of multiple target genes, also linked to proliferation and apoptosis. Arthritis Rheumatol. (2021) 73(12):2303–13. doi: 10.1002/art.41799
34. Cai X, Qiao Y, Diao C, Xu X, Chen Y, Du S, et al. Association between polymorphisms of the IKZF3 gene and systemic lupus erythematosus in a Chinese han population. PLoS ONE. (2014) 9(10):e108661. doi: 10.1371/journal.pone.0108661
35. Garrett-Sinha LA, Kearly A, Satterthwaite AB. The role of the transcription factor Ets1 in lupus and other autoimmune diseases. Crit Rev Immunol. (2016) 36(6):485–510. doi: 10.1615/CritRevImmunol.2017020284
36. Hu SJ, Wen LL, Hu X, Yin XY, Cui Y, Yang S, et al. IKZF1: a critical role in the pathogenesis of systemic lupus erythematosus? Mod Rheumatol. (2013) 23(2):205–9. doi: 10.3109/s10165-012-0706-x
37. Sato S, Lennard Richard M, Brandon D, Jones Buie JN, Oates JC, Gilkeson GS, et al. A critical role of the transcription factor fli-1 in murine lupus development by regulation of interleukin-6 expression. Arthritis Rheumatol. (2014) 66(12):3436–44. doi: 10.1002/art.38818
38. Yang J, Yang W, Hirankarn N, Ye DQ, Zhang Y, Pan HF, et al. ELF1 is associated with systemic lupus erythematosus in Asian populations. Hum Mol Genet. (2011) 20(3):601–7. doi: 10.1093/hmg/ddq474
39. Kobayashi T, Shimabukuro-Demoto S, Yoshida-Sugitani R, Furuyama-Tanaka K, Karyu H, Sugiura Y, et al. The histidine transporter SLC15A4 coordinates mTOR-dependent inflammatory responses and pathogenic antibody production. Immunity. (2014) 41(3):375–88. doi: 10.1016/j.immuni.2014.08.011
40. Claussnitzer M, Cho JH, Collins R, Cox NJ, Dermitzakis ET, Hurles ME, et al. A brief history of human disease genetics. Nature. (2020) 577(7789):179–89. doi: 10.1038/s41586-019-1879-7
41. He CF, Liu YS, Cheng YL, Gao JP, Pan TM, Han JW, et al. TNIP1, SLC15A4, ETS1, RasGRP3 and IKZF1 are associated with clinical features of systemic lupus erythematosus in a Chinese Han population. Lupus. (2010) 19(10):1181–6. doi: 10.1177/0961203310367918
42. Bonam SR, Wang F, Muller S. Lysosomes as a therapeutic target. Nat Rev Drug Discov. (2019) 18(12):923–48. doi: 10.1038/s41573-019-0036-1
43. Cao M, Luo X, Wu K, He X. Targeting lysosomes in human disease: from basic research to clinical applications. Signal Transduct Target Ther. (2021) 6(1):379. doi: 10.1038/s41392-021-00778-y
44. Noguchi M, Hirata N, Tanaka T, Suizu F, Nakajima H, Chiorini JA. Autophagy as a modulator of cell death machinery. Cell Death Dis. (2020) 11(7):517. doi: 10.1038/s41419-020-2724-5
45. Daniel CL, Wesley WW, Tzu-Yuan C, Weichao L, Appaso MJ, Jacob MW, et al. Chemoproteomics-guided development of SLC15A4 inhibitors with anti-inflammatory activity. bioRxiv. (2022). 2022.10.07.511216.
46. Ponticelli C, Moroni G. Hydroxychloroquine in systemic lupus erythematosus (SLE). Expert Opin Drug Saf. (2017) 16(3):411–9. doi: 10.1080/14740338.2017.1269168
47. Dima A, Jurcut C, Chasset F, Felten R, Arnaud L. Hydroxychloroquine in systemic lupus erythematosus: overview of current knowledge. Ther Adv Musculoskelet Dis. (2022) 14:1759720x211073001. doi: 10.1177/1759720X211073001
48. Dörner T. Therapy: hydroxychloroquine in SLE: old drug, new perspectives. Nat Rev Rheumatol. (2010) 6(1):10–1. doi: 10.1038/nrrheum.2009.235
49. Li S, Wu Q, Jiang Z, Wu Y, Li Y, Ni B, et al. miR-31-5p regulates type I interferon by targeting SLC15A4 in plasmacytoid dendritic cells of systemic lupus erythematosus. J Inflamm Res. (2022) 15:6607–16. doi: 10.2147/JIR.S383623
50. Fujio K. Functional genome analysis for immune cells provides clues for stratification of systemic lupus erythematosus. Biomolecules. (2023) 13(4):591. doi: 10.3390/biom13040591
51. Blasius AL, Krebs P, Sullivan BM, Oldstone MB, Popkin DL. Slc15a4, a gene required for pDC sensing of TLR ligands, is required to control persistent viral infection. PLoS Pathog. (2012) 8(9):e1002915. doi: 10.1371/journal.ppat.1002915
52. Zhang H, Bernaleau L, Delacrétaz M, Hasanovic E, Drobek A, Eibel H, et al. SLC15A4 controls endolysosomal TLR7-9 responses by recruiting the innate immune adaptor TASL. Cell Rep. (2023) 42(8):112916. doi: 10.1016/j.celrep.2023.112916
53. López-Haber C, Netting DJ, Hutchins Z, Ma X, Hamilton KE, Mantegazza AR. The phagosomal solute transporter SLC15A4 promotes inflammasome activity via mTORC1 signaling and autophagy restraint in dendritic cells. EMBO J. (2022) 41(20):e111161. doi: 10.15252/embj.2022111161
54. Joo YB, Lim J, Tsao BP, Nath SK, Kim K, Bae SC. Genetic variants in systemic lupus erythematosus susceptibility loci, XKR6 and GLT1D1 are associated with childhood-onset SLE in a Korean cohort. Sci Rep. (2018) 8(1):9962. doi: 10.1038/s41598-018-28128-z
Keywords: SLC15A4, luciferase, ChIP-qPCR, CRISPR, lupus, lysosomal acidification
Citation: Singh MK, Maiti GP, Rallabandi HR, Fazel-Najafabadi M, Looger LL and Nath SK (2023) A non-coding variant in SLC15A4 modulates enhancer activity and lysosomal deacidification linked to lupus susceptibility. Front. Lupus 1:1244670. doi: 10.3389/flupu.2023.1244670
Received: 22 June 2023; Accepted: 6 November 2023;
Published: 22 November 2023.
Edited by:
Antonio La Cava, University of California, Los Angeles, United StatesReviewed by:
Michelle Delano Catalina, AbbVie, United StatesCharalampos Skarlis, National and Kapodistrian University of Athens, Greece
Dionysis Nikolopoulos, Karolinska Institutet (KI), Sweden
© 2023 Singh, Maiti, Rallabandi, Fazel-Najafabadi, Looger and Nath. This is an open-access article distributed under the terms of the Creative Commons Attribution License (CC BY). The use, distribution or reproduction in other forums is permitted, provided the original author(s) and the copyright owner(s) are credited and that the original publication in this journal is cited, in accordance with accepted academic practice. No use, distribution or reproduction is permitted which does not comply with these terms.
*Correspondence: Swapan K. Nath c3dhcGFuLW5hdGhAb21yZi5vcmc=
†These authors have contributed equally to this work