 Sara Ruiz-Cabrera
 Isabel Pérez-Santos
 Josefa Zaldivar-Diez
 Miguel Ángel García-Cabezas
- 1Department of Anatomy, Histology and Neuroscience, School of Medicine, Autónoma University of Madrid, Madrid, Spain
- 2PhD Program in Neuroscience UAM-Cajal, School of Medicine, Autónoma University of Madrid, Madrid, Spain
- 3Adjunct Professor, Neural Systems Laboratory, Department of Health Sciences, Boston University, Boston, MA, United States
The expansion of human and non-human primate central nervous system structures has been a paramount question for classic and contemporary studies in comparative vertebrate neuroanatomy. These studies can benefit from framing data analysis within the Prosomeric Model, which defines a common Bauplan for all vertebrate species, including mammals. According to this model, the vertebrate nervous system is composed of several Fundamental Morphological Units (FMUs) that are defined and delineated by characteristic gene expression profiles. Thus, the expansion of neural structures can be traced back to heterochronic neurogenesis, cell lineage specification, and axon growth in their corresponding FMUs. In the present article, we exemplify the use of the Prosomeric Model as the proper theoretical framework for analyzing the expansion of the cerebral and cerebellar cortices, the pontine nuclei, the striatum, the nigrostriatal dopaminergic system, the thalamus, and the amygdala in primates compared to rodents. We describe the quantitative (volume and neuron number) and qualitative (cytoarchitectonic and cell type differences) expansion of these structures in primates versus rodents and define different expansion modes. Then, we relate these modes to the developmental primary events of specification and secondary events of histogenesis, like neurogenesis. We conclude that the systematic analysis of the molecular regulation of primary and secondary developmental events in each FMU in rats, primates, and other mammals could provide the necessary insight to identify the causal mechanisms of the expansion modes described in the present article.
1 Introduction
Since the dawn of modern studies on brain structure, comparative neuroanatomists have devoted large efforts to identify similarities and differences in the size, cytoarchitecture, chemical composition, synaptic connections, and cell types across the central nervous system in different vertebrate species [e. g., Ariëns Kappers et al. (1936)]. The preservation of “older” and the appearance and expansion of “newer” vertebrate nervous system parts have been explored, quantified, and conceptualized in different scaling models [e. g., Finlay and Darlington (1995); Yopak et al. (2010)]. These comparative studies are a central core of contemporary neuroscience and have implications that go beyond their own scope; for instance, they can provide sound criteria for defining homology of brain regions in different species, which is key for extrapolating experimental data obtained in laboratory animals to the human brain.
Most of the classic comparative studies of the vertebrate central nervous system were performed within the theoretical framework of the Columnar Model of Charles Judson Herrick (1910; 1933; 1948) and Hartwig Kuhlenbeck (1967–1978), a model that has been proved incompatible with the spatiotemporal expression profiles of morphogenetic genes across vertebrate embryos (Puelles and Rubenstein, 2015). On the contrary, molecular developmental data have provided sound foundations for the Prosomeric Model of Luis Puelles and his coworkers. This model defines a vertebrate nervous system Bauplan (or blueprint) composed of several Fundamental Morphological Units (FMUs), each of them defined and delineated by characteristic gene expression profiles (García-Calero and Puelles, 2020). More important, the topological neighborhood relationships among FMUs are invariant across vertebrates species (Nieuwenhuys and Puelles, 2016). Thus, Bauplan FMUs seem to have been conserved across all vertebrates and allow for advancing sound homology hypotheses: two brain structures in two different species should be homologous if they are originated in the same FMU of the Bauplan defined by the Prosomeric Model (Puelles and Medina, 2002).
Besides homology criteria, the Prosomeric Model has also proved its efficacy for making predictions on brain connectivity based on the causal mechanisms of development (Puelles, 2022) and explaining malformations (Diaz and Puelles, 2020). Thus, this model could provide a fruitful theoretical framework for comparative neuroanatomical studies in search of evolutionary principles. In our opinion, defining principles does not consist only in identifying regularities, like those represented in scaling models. A principle in evolutionary biology also requires a causal mechanism for the identified regularity; and causal mechanisms of nervous system evolution must be searched for in the genetic regulation of embryonic development.
In the present article, we compare the expansion of several central nervous system regions in primates compared to rodents in the light of the Prosomeric Model. Our aim is to exemplify the use of this model for defining different expansion modes of neural structures and propose potential causal mechanisms for such modes. First, we summarize the historical development and major concepts of the Columnar and Prosomeric Models to identify the model that can better explain the differential expansion of primate nervous system parts. Then, we compare the quantitative (volume and neuron number) and qualitative (cytoarchitectonic and cell type differences) expansion of the cerebral and cerebellar cortices, the pontine nuclei, the striatum, the dopaminergic nigrostriatal system, the amygdala, and the thalamus in human and non-human primates compared to rodents. Also, we identify the corresponding FMUs of these structures and compare between rodents and primates the data (when available) on neuron number of each structure. Finally, we define five expansion modes of primate nervous system structures and relate them to the primary events of specification and secondary events of histogenesis in the corresponding FMUs to identify their potential developmental and phylogenetic causal mechanisms.
2 Models of neural tube development and evolution
2.1 The Columnar Model of the vertebrate nervous system
Our current understanding of central nervous system development is rooted in the seminal works of the Swiss embryologist Wilhelm His (1831–1904), who, during the second half of the XIXth century, carried on systematic descriptions of the developing nervous system in human and other vertebrate embryos. His obtained complete series of sections through in toto embedded-in-paraffin embryos, stained the sections with Nissl technique, and used them for 3D reconstructions (Richardson and Keuck, 2022). The illustrations and drawing produced by His are still reproduced in contemporary textbooks of embryology and anatomy [e. g., Mancall et al. (2011)].
His described in the neural plate and early neural tube several longitudinal zones, called plates (floor, basal, alar, and roof plates), that extended rostro-caudally along the prospective prosencephalon, mesencephalon, rhombencephalon, and spinal cord [His (1897; 1904); Figure 1A]. He could distinguish the alar and basal plates based on differences in neurogenesis time-course (earlier in the basal than in the alar plate). His model was later rejected in favor of an alternative interpretation that assumed that the notochord, and, thus, the basal plate, did not extend to the anterior end of the neural plate and was present only in the spinal cord, the rhombencephalon, and the mesencephalon [Kingsbury (1920); Figure 1B]. Simultaneously, Charles Judson Herrick (1868–1960) described four longitudinal zones, called columns, abutting on the ventricular surface of the diencephalon. These columns were, from dorsal to ventral, the epithalamus (gives rise to the habenula and the pineal gland), the dorsal thalamus (gives rise to all the thalamic nuclei, except the reticular nucleus), the ventral thalamus (gives rise to the thalamic reticular nucleus, the zona incerta, and the Forel fields), and the hypothalamus. The diencephalic columns showed different neurogenesis time-courses (Reinoso Suárez, 1966) and were outlined by three sulci (dorsal, middle, and ventral diencephalic sulci) that could be identified at different developmental stages [Herrick (1910; 1933); Figure 1C]. The four columns in a devoid of basal plate diencephalon were the touchstone of the Columnar Model (Figure 1D) that was further elaborated by Kuhlenbeck (1967–1978) and incorporated to most textbooks of embryology and neuroanatomy [e. g., Kahle et al. (1986); Langman and Sadler (1990)].
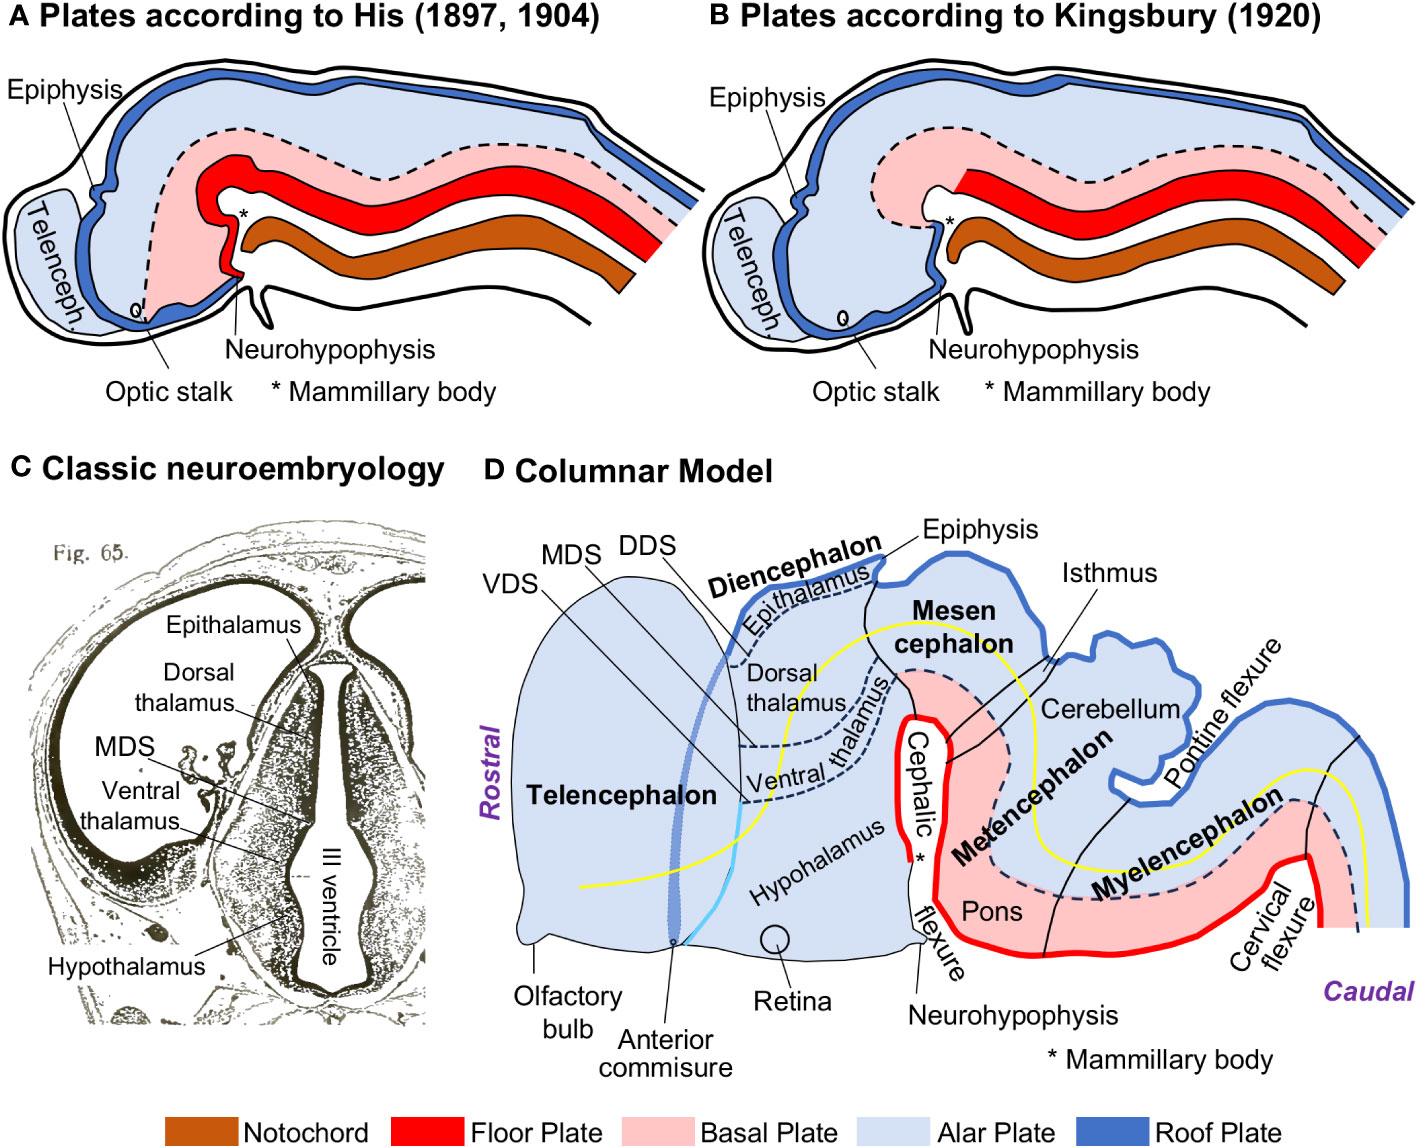
Figure 1 The Columnar Model of the vertebrate central nervous system. (A), Scheme that shows the medial view of a parasagittaly cut mammalian neural tube; the basal plate (pink) extends from the spinal cord to the diencephalon according to His (1897; 1904). (B), Scheme that shows the medial view of a parasagittaly cut mammalian neural tube; the basal plate (pink) extends from the spinal cord to the mesencephalon according to Kingsbury (1920). (C), Coronal section stained with Nissl through the diencephalon of a human embryo (Crown-rump length = 25.1 mm); the four diencephalic columns and the middle diencephalic sulcus (MDS) are indicated on the wall of the III ventricle. (D), Scheme of a mammalian neural tube (left lateral view) showing plates (floor, basal, alar, and roof plates), the four diencephalic columns (Epithalamus, Dorsal thalamus, Ventral thalamus, and Hypothalamus) the three diencephalic sulci (dorsal, middle, and ventral), and the axis (yellow line) of the central nervous system according to Herrick (1910; 1933; 1948) and Kuhlenbeck (1967–1978). (A, B) have been modified from Figure 440 in Arey (1965); note that the roof plate is represented as in contact with the floor plate (A) or the basal plate (B), which now we know that are incorrect topological relations [see Figure 1 in Puelles (2018)]. (C) has been modified from Figure 65 in Hochstetter (1919). The floor plate is colored in red, the basal plate in pink, the alar plate in light blue, the roof plate in dark blue, and the notochord in brown. The Microsoft PowerPoint program was used to prepare Figure 1 (and all the other figures); drawings were delineated with “shape” tools and colored with “shape fill”. DDS, dorsal diencephalic sulcus; MDS, middle diencephalic sulcus; Telenceph., telencephalon; VDS, ventral diencephalic sulcus.
It is important to consider that the Columnar Model is an interpretation of the development of the neural tube and its constituents that is based on observations of vertebrate embryos stained for classic neuroanatomical techniques, like Nissl-staining (Figure 1C). These techniques, in combination with serial sectioning and 3D reconstruction, allow for identifying sulci on the pial and ventricular surfaces of the neural tube (like the diencephalic sulci), bulges on the ventricular surface (like the diencephalic columns), and flexures (like the cephalic and pontine flexures) and dilations (like the diencephalic vesicle) along the neural tube (Figure 1D). In the literature of the Columnar Model [e. g., Kuhlenbeck (1967–1978)], the parts of the developing nervous system delineated by sulci, like the diencephalic columns, are considered fundamental constituents of a vertebrate nervous system Bauplan. Another important tenet of the Columnar Model is the definition of the telencephalon as the most rostral part of the neural tube; thus, the rostro-caudal axis of the neural tube (yellow line in Figure 1D) passes, from rostral to caudal, through the telencephalon, the diencephalon, the mesencephalon, the metencephalon, the myelencephalon, and the spinal cord.
2.2 The Prosomeric Model of the vertebrate nervous system
In parallel to the alar and basal plates, classic developmental studies also described transient transverse structures that were called neuromeres. In the rhombencephalon, several rhombomeres were delineated by obvious sulci between them, but in other neural tube regions the neuromeric organization was less obvious. In spite of this, several neuromeric models were proposed along the XXth century based on classic neuroanatomical techniques [e. g., von Kupffer (1906); Rendahl (1924); Bergquist and Kallen (1954); reviewed in Nieuwenhuys and Puelles (2016) and Puelles (2021)]. Some of this models identified neuromeric boundaries according to differences in neurogenesis time-course (Bergquist and Kallen, 1954). Importantly, the neuromeric boundaries did not coincide with the sulci between the diencephalic columns, but Kuhlenbeck considered that the initial neuromeric structure was later substituted by the diencephalic columns (Kuhlenbeck, 1967–1978).
A new neuromeric model, the Prosomeric Model, was proposed by Luis Puelles (1948–) and his coworkers based on the analysis of in toto chick embryos stained for acetylcholinesterase. This technique stains all the newborn neurons and revealed transverse patterns of neurogenesis that did not coincide with the diencephalic columns (Puelles et al., 1987a). In the last decade of the XXth century, the use of in situ hybridization to color the expression of morphogenetic genes in vertebrate embryos was instrumental to confirm the neuromeric organization of the vertebrate neural tube (Puelles and Rubenstein, 1993; Rubenstein et al., 1994). These studies also showed that Sonic hedgehog (Shh), the morphogenetic determinant of the basal plate, was expressed in the ventral part of the diencephalon (Figure 2A), supporting the presence of a basal plate component in this vesicle as advanced by His (1897; 1904). Puelles and his coworkers also experimentally demonstrated that the most rostral part of the neural tube was the prospective anterior commissure (Puelles et al., 1987b) and defined the Natural axis of the nervous system (yellow line in Figure 2B), which roughly matches the alar-basal plate boundary; also, they have demonstrated that the entire neural tube is epichordal (Puelles and Rubenstein, 2015).
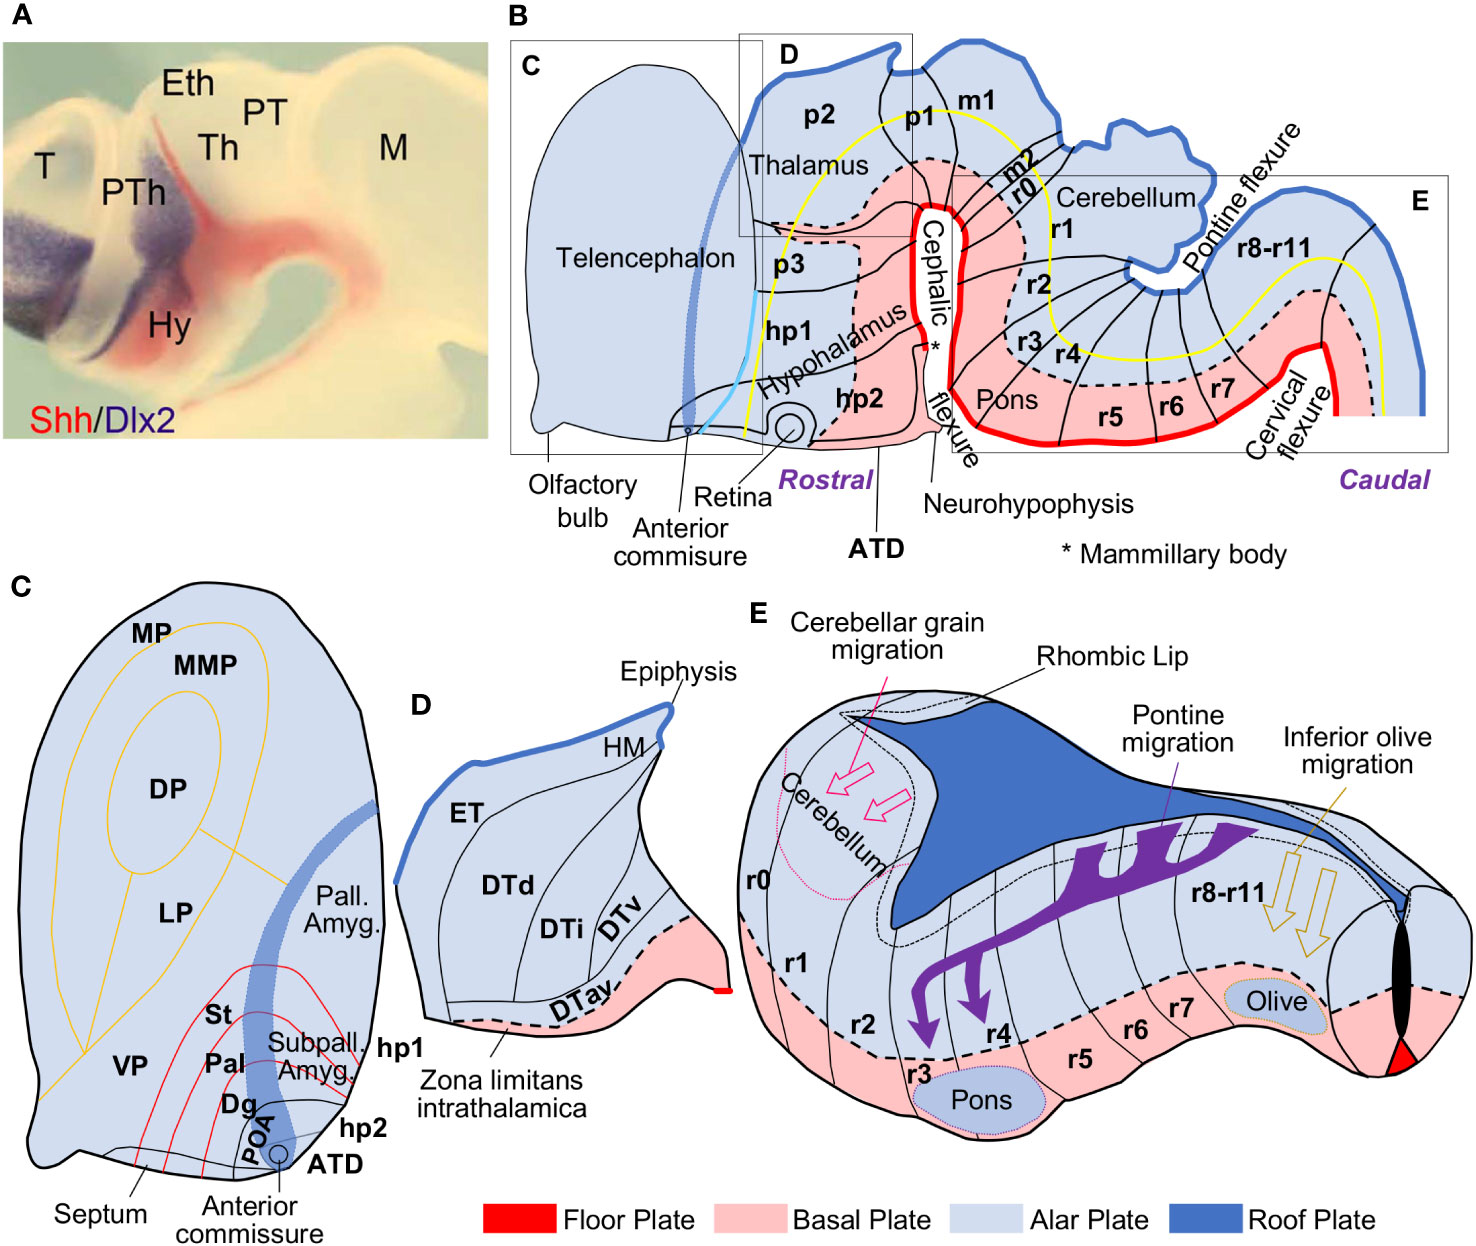
Figure 2 The Prosomeric Model of the vertebrate central nervous system. (A), Expression of Sonic hedgehog (Shh; reddish) and Distal-Less Homeobox 2 (Dlx2; gray) genes colored by in situ hybridization in the diencephalon of a hole mount chick embryo; Shh labels the basal plate. This photography is reproduced from Figure 2B in Martinez-Ferre and Martinez (2012). (B), Scheme of a mammalian neural tube (left lateral view) showing neuromeres (from caudal to rostral: r11-r0, m2-m1, p1-p3, hp1, hp2, ATD), plates (from ventral to dorsal: floor, basal, alar, and roof plates), and the axis (yellow line) of the central nervous system according to Puelles et al. (1987b); Puelles et al. (2008); Puelles and Rubenstein (2015); Nieuwenhuys and Puelles (2016); and Puelles (2018). (C), Magnification of the telencephalic region in B; the pallial (MP, MMP, DP, LP, VP, pallial amygdala; yellow boundaries) and subpallial (St, Pal, Dg, POA; red boundaries) FMUs are represented. (D), Magnification of the prosomere p2 in B; the thalamic FMUs (ET, DTd, DTi, DTv, DTav) are represented in the alar plate. (E), Magnification of the rhombencephalon in B; the rhombic lip is delineated by a short-dashed black line in the alar plate adjacent to the roof plate; tangential migrations that give rise to the cerebellum (pink arrows), the pontine nuclei (purple arrows), and the inferior olive (mustard arrows) are represented. The floor plate is colored in red, the basal plate in pink, the alar plate in light blue, and the roof plate, in dark blue. ATD, acroterminal domain; Dlx2, Distal-Less Homeobox 2 gene; Dg, diagonal subpallial domain; DP, dorsal pallium; DTav, dorsal thalamus, anteroventral subdivision; DTd, dorsal thalamus, dorsal subdivision; DTi, dorsal thalamus, intermediate subdivision; DTv, dorsal thalamus, ventral subdivision; ET, epithalamus; Eth, epithalamus; HM, medial habenula; hp1-2, hypothalamic prosomeres 1-2; Hy, hypothalamus; LP, lateral pallium; m1-2, mesomeres 1-2; M, mesencephalon; MP, medial pallium; MMP, mesomedial pallium; p1-3, prosomeres 1-3; Pal, pallidal subpallial domain; Pall. Amyg., amygdalar pallium; POA, preoptic subpallial domain; PT, pretectum; PTh, prethalamus; r0-11, rhombomeres 0-11; Shh, Sonic hedgehog; St, striatal subpallial domain; Subpall. Amyg., subpallial amygdala; T, telencephalon; Th, thalamus; VP, ventral pallium.
The Prosomeric Model defines the components of the vertebrate central nervous system based on abundant genoarchitectonic data obtained from in situ hybridization experiments performed on vertebrate embryos (Puelles and Ferran, 2012). Genoarchitectonic data has served to identify and delineate several FMUs that constitute the “building bricks” of a common nervous system Bauplan for all vertebrates, including primates. FMUs are patterned during primary events of specification under the induction of several organizers. The notochord and the lateral ectoderm specify the longitudinal floor, basal, alar, and roof plates. The isthmus, the zona limitans intrathalamica (ZLI), and the acroterminal domain (ATD) specify the transverse neuromeres, which are segments of neural tube comprising a representation of the four plates; from caudal to rostral there are twelve rhombomeres (r11-r0; r0 corresponds to the isthmus), two mesomeres (m2-1), and six prosomeres (p1-3, hp1-2, and the ATD). The intersection of longitudinal plates and transverse neuromeres in the neural plate creates a checkboard of histogenetic units, each of them characterized by a specific gene expression profile detected by genoarchitectonic techniques. Further molecular processes within the histogenetic units specify progenitor domains which constitute the FMUs that will give rise to adult brain structures (Figure 2B). The Bauplan formed by the FMUs is conceptualized in the Prosomeric Model [for a review of the Prosomeric Model see Puelles et al. (2013); Nieuwenhuys and Puelles (2016); Nieuwenhuys (2017); García-Calero and Puelles (2020); Puelles (2021)] and takes into account the Natural axis of the central nervous system, which corresponds to the rostro-caudal axis of the early neural tube before it folds [yellow line in Figure 2B: see also Figure 2 in Nieuwenhuys (2017)]. Thus, anatomical descriptors, like rostral, caudal, ventral, and dorsal can be used in a topological sense in relation to this axis; for example, the hypothalamus in the adult brain is topographically ventral to the thalamus but, from the point of view of the Prosomeric Model is topologically rostral to the thalamus. It is important to note that the topological position of each FMU in relation to the others is invariant across vertebrate species. Such invariancy allows to propose homology hypothesis based on Field homology: two nervous system structures in two different vertebrate species are homologues if they originate in the same FMU (Puelles and Medina, 2002).
According to the Prosomeric Model, the hypothalamus is a derivative of the floor, basal, and alar plates of hp1, hp2, and the ATD and the telencephalon is a topologically dorsal extension of the alar plate of prosomere hp1, with a small contribution from hp2 (Puelles and Rubenstein, 2015). Four subpallial and six pallial FMUs are specified in the telencephalon. The subpallial FMUs are Striatum (St, gives rise to the striatum), Pallidum (Pal, gives rise to the globus pallidus and the lateral part of the bed nucleus of the stria terminalis), Diagonal (Dg, gives rise to basal prosencephalic structures and the medial part of the bed nucleus of the stria terminalis), and Preoptic (POA, the only part of the telencephalon originated in the alar plate of hp2; gives rise to the preoptic region) (García-López et al., 2008; Medina et al., 2011). The pallial FMUs are the medial pallium (gives rise to the hippocampal allocortex and the entorhinal cortex), the ventral pallium (gives rise to the primary olfactory cortex and the olfactory bulb), the lateral pallium (gives rise to paraolfactory mesocortices), the mesomedial pallium (a hypothetical pallial sector that should give rise to the parahippocampal mesocortices), the dorsal pallium (gives rise to the isocortex), and the amygdalar pallial sector (Puelles et al., 2019; García-Cabezas et al., 2023a). Amygdalar nuclei are originated in the amydalar pallial sector but also in the four subpallial FMUs [García-López et al. (2008); Puelles et al. (2019); Figure 2C]. Several smaller FMUs have been identified within the amygdalar pallial sector (García-Calero et al., 2020).
The thalamus was considered a diencephalic column in the Columnar Model of Herrick (1910; 1933; 1948) and Kuhlenbeck (1967–1978), but genoarchitectonic data show that it is originated in the alar plate of p2, with the exception of the thalamic reticular nucleus, which is originated in the alar plate of p3. Five smaller FMUs have been identified in the alar plate of p2 [Martinez-Ferre and Martinez (2012); Redies et al. (2000); Figure 2D].
In the rhombencephalon, twelve rhombomeres have been identified based on cytoarchitectonic boundaries and gene expression profiles (Nieuwenhuys, 2011). The rhombic lip is a region of the alar plate adjacent to the floor plate that extends from r0 to r10. This region is specialized in producing neurons that will tangentially migrate long distances, like the inferior olive, the pontine nuclei, and the cerebellum. The inferior olive originates from tangential migrations starting at the rhombic lip from r10 to r8 and ending in the basal plate of these same rhombomeres (Tomas-Roca et al., 2016). The pontine nuclei are originated by massive tangential migrations starting at the rhombic lip from r8 to r6; these migrations transverse several rhombomeric boundaries and invade the basal plate of r3 and r4 (Tomas-Roca et al., 2016; Kratochwil et al., 2017). The rhombic lip also contributes to form the cerebellum, which has a dual origin. First, excitatory cerebellar neurons are originated in the rhombic lip at r1 and tangentially migrate to populate the prospective cerebellar cortex and the deep cerebellar nuclei. Second, GABAergic inhibitory cerebellar neurons originate in a different sector of the ventricular zone in the alar plate of r1 and radially migrate to the prospective cerebellar cortex and the deep cerebellar nuclei [Martinez et al. (2013); Figure 2E].
2.3 The Columnar and the Prosomeric Models face to face
The Columnar and the Prosomeric Models propose two different Bauplans for the vertebrate nervous system from two different epistemological and ontological frameworks (Table 1). The Columnar Model is based on the microscopic examination and 3D reconstruction of embryos that are cut and stained with classic techniques, like Nissl staining (Figure 1C). These techniques allow for identifying sulci, bulges, and columns produced by differential growth of some parts of the neural tube over others. Finally, the Columnar Model describes an axis of the neural tube that considers the telencephalon as its most rostral part.
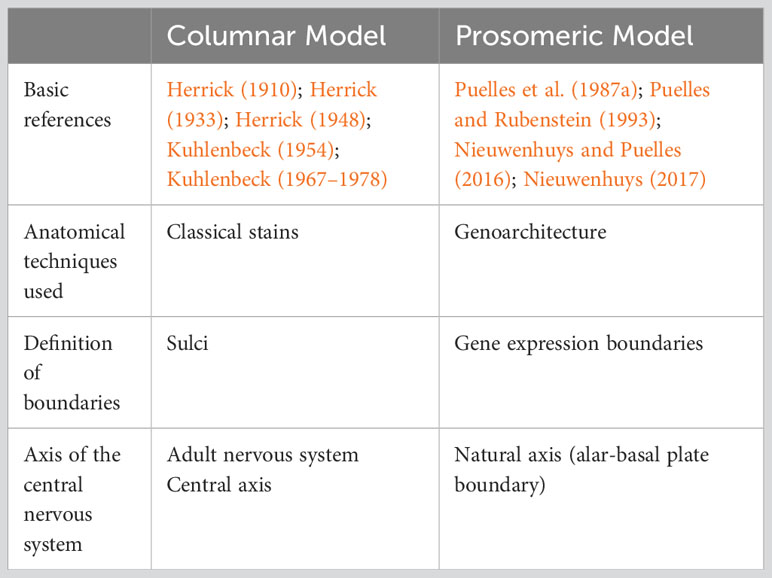
Table 1 Epistemological differences between the Columnar and the Prosomeric Models.
In contrast, the Prosomeric Model is based on the microscopic examination of embryos that are stained with in situ hybridization and immunohistochemistry to color the expression of morphogenetic genes, like Shh. These techniques allow for identifying boundaries between parts of the embryo that express a given gene and other parts that do not express it; for instance, Shh is expressed in the basal plate, but not in the alar plate (Figure 2A). Finally, the Prosomeric model uses the Natural axis of the neural tube that roughly matches the alar-basal plate boundary and considers that the entire neural tube is epichordal.
The use of different staining techniques provides each model with different ontological power because the classic stains of the Columnar Model and the genoarchitectonic stains of the Prosomeric Model detect different events of development. In embryos, we can define three types of events [Nieuwenhuys and Puelles (2016); Table 2]. First, the primary events of specification are the result of induction processes directed by organizers like the notochord or the isthmus; there are several levels of specification, from the specification of the neural plate by the hypoblast and the primitive node (Echevarria et al., 2003) to the specification of histogenetic units and FMUs. Second, the secondary events of histogenesis comprise all the cellular processes, like neurogenesis, cell migration, or axon growth, that lead to circuit formation after FMUs are specified. Finally, the tertiary events of morphogenesis consist in the appearance of sulci in the ventricular and pial surfaces of the neural tube, in the deformation of the neural tube like and accordion, and in the enlargement of vesicles, columns, and eminences due to the differential growth of some FMUs over others; the tertiary events of morphogenesis also comprise the formation of grisea (thalamic nuclei, cortical layers, etc.) after secondary events finalize. Thus, the Columnar Model uses tertiary events of morphogenesis (like the diencephalic columns separated by the diencephalic sulci) to define the constituents of the neural tube. In contrast, the Prosomeric Model defines FMUs of the nervous system according to the primary events of specification.
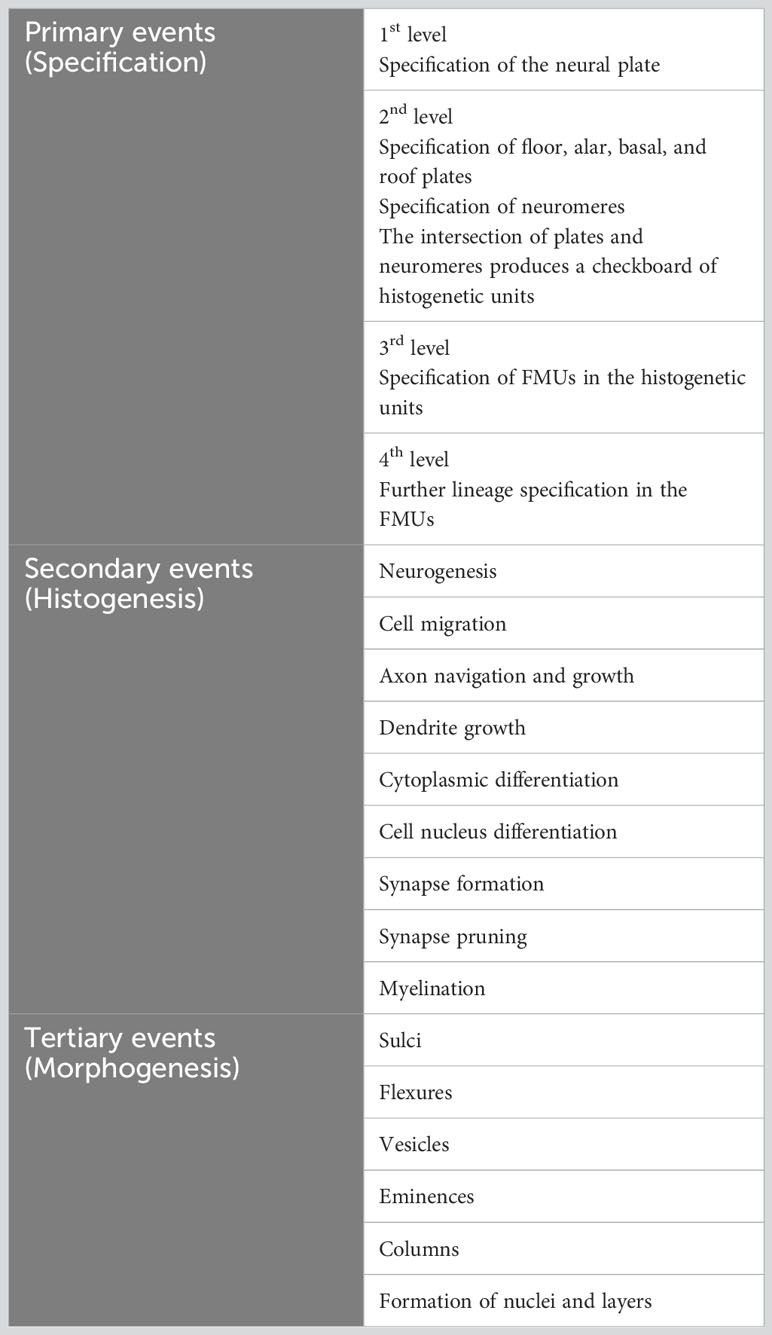
Table 2 Types of events during embryological development.
In comparative and evolutionary neuroanatomy, the choice of one Bauplan model over another is not a trivial question. Specifically, the genetic mechanisms that underlie changes in the relative dimension of nervous system parts [“mosaic” evolution; Barton and Harvey (2000)] could be searched for in the constituent units of the Columnar or the Prosomeric Model Bauplans. We consider that the Prosomeric Model, with FMUs defined by the primary events of specification, provides a better framework for investigating differential expansion of nervous system parts across species than the Columnar Model. For instance, the expansion of the pontine nuclei in primates should be studied in the rhombic lip of rhombomeres r6-8, two of which are cryptorhombomeres that are identified using genoarchitectonic techniques [Tomas-Roca et al. (2016); Figure 2E]. Regarding the diencephalon, one FMU corresponds to the epithalamus column of Herrick, but other four FMUs have been identified in the alar plate of p2, which corresponds to the dorsal thalamus column [Martinez-Ferre and Martinez (2012); Figure 2D]; each of these thalamic FMUs is differentially expanded in vertebrates [see Figure 5 in Puelles (2001)]. Finally, in the telencephalon the subpallial ganglionic eminences, which are bulges on the ventricular surface due to tertiary events of morphogenesis, are composed of four FMUs, each of them with specific contributions to subpallial nuclei [Puelles et al. (2016); Figure 2C]; on the other hand, the pallium is composed of six FMUs [five of them give rise to the cerebral cortex and one to the pallial amygdala, Puelles et al. (2019); Figure 2C] that are differentially expanded in primates compared to rodents (García-Cabezas et al., 2023a).
In summary, the Prosomeric Model provides an ontology of central nervous system parts based on the primary events of specification, which are mediated by the action of gene regulatory networks that direct and coordinate the development of the vertebrate nervous system. Also, the Prosomeric Model Bauplan allows to propose homology hypothesis based on Field homology. Therefore, the FMU-based ontology provides a framework for meaningful interspecies comparison and searching for causal mechanisms of nervous system part expansion in phylogeny.
3 Expanded nervous system structures in humans compared to rats
A first look at the rat and human central nervous systems brings to light quantitative differences. Figure 3 shows several adult rat central nervous system regions around a micrograph of a parasagittal section stained with Nissl. Figure 3A represents a fate map of the early pallium from a rat embryo with the six pallial FMUs, Figure 3B represents the cortical gradient of laminar complexity with its different cortical types (allocortex, mesocortex, eulaminate), Figure 3C represents in grayscale these cortical types on the fate map of the early pallium, and Figure 3D shows higher magnifications of representative cortical regions with different grade of laminar complexity. Other regions, like the dorsal (Figure 3E) and ventral striatum (Figure 3F), the thalamus (Figure 3G), and the cerebellar cortex (Figure 3H), are showed in higher magnification.
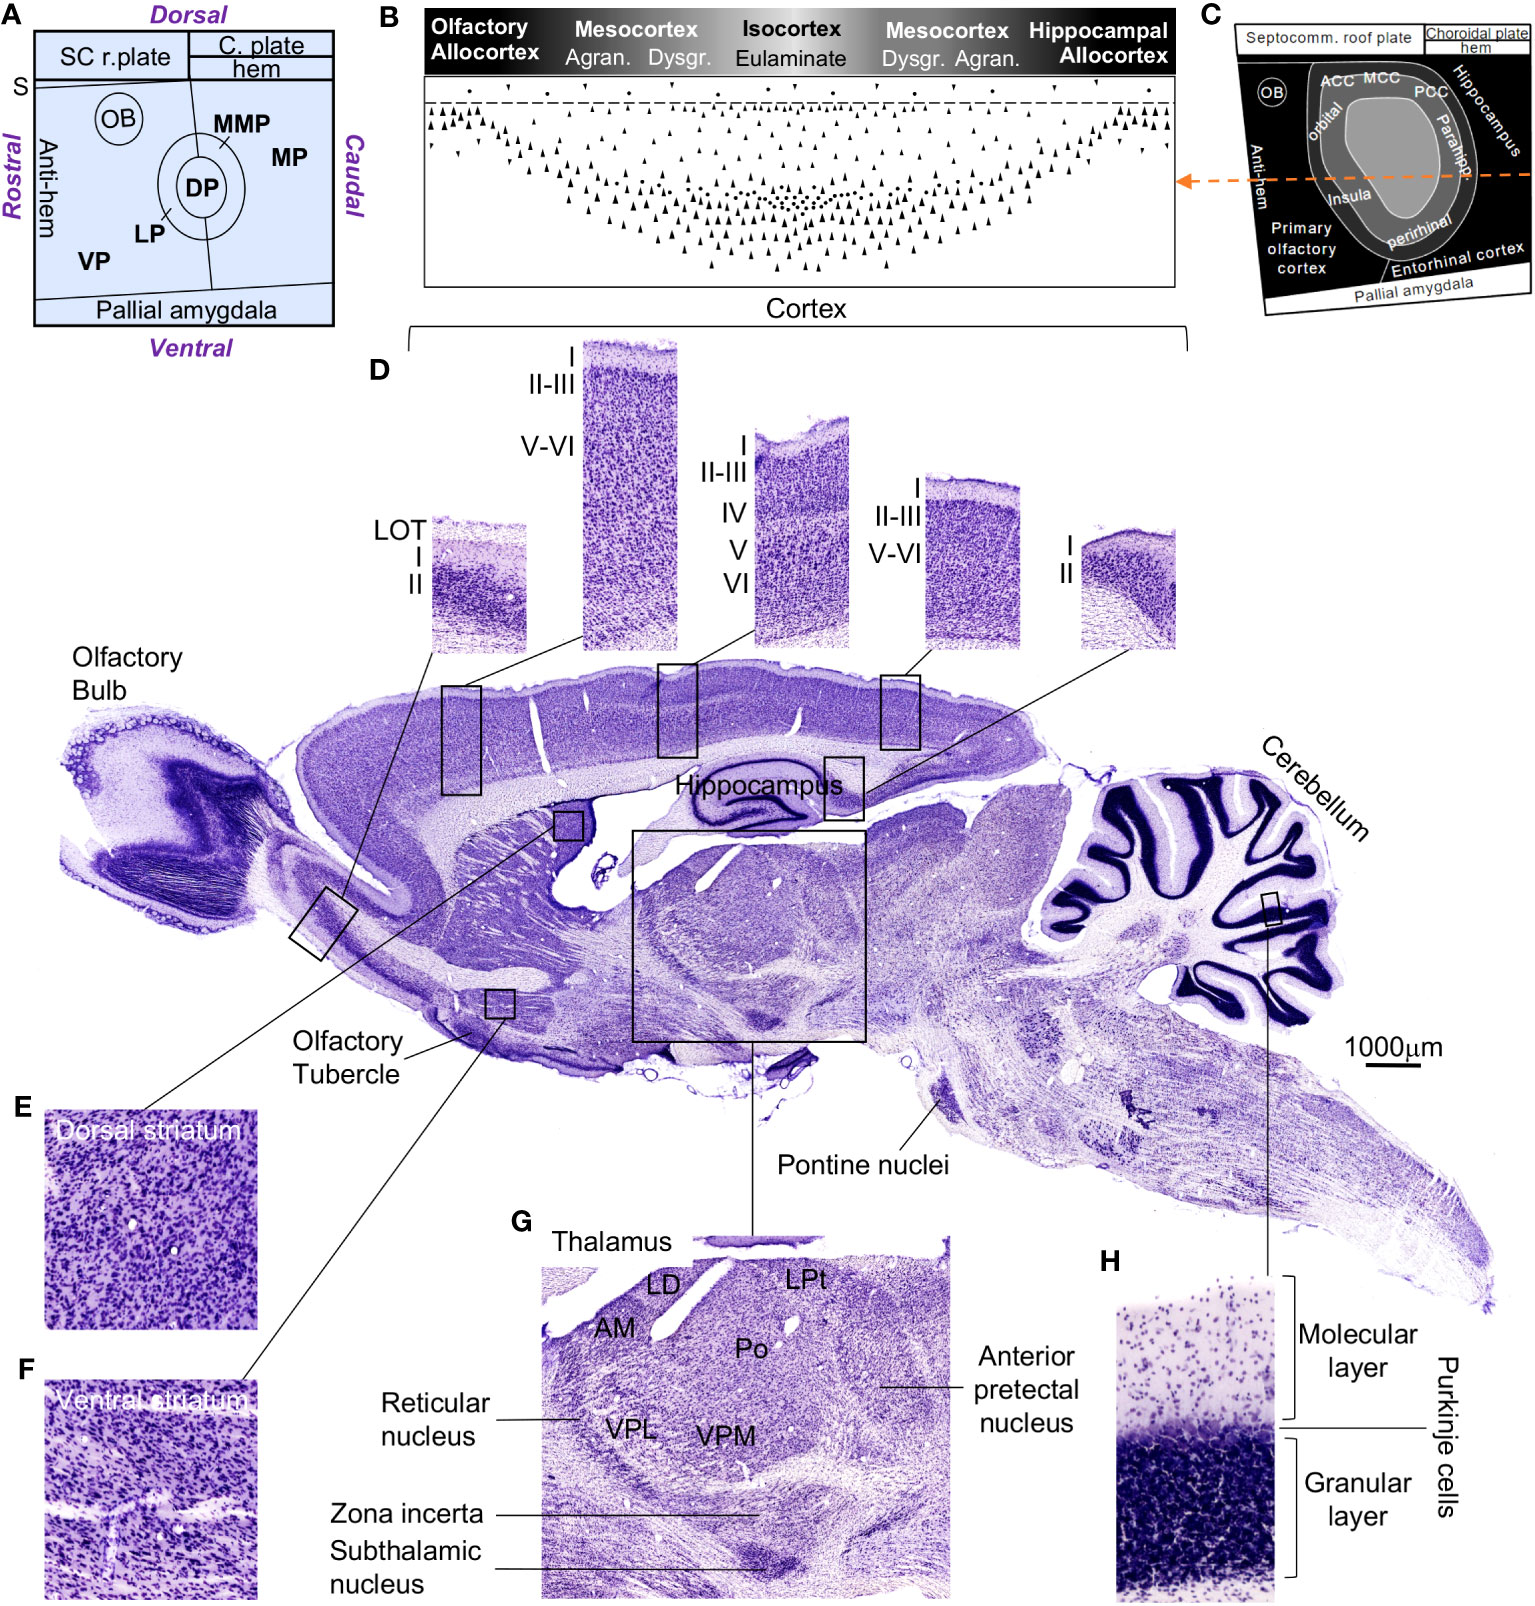
Figure 3 The rat central nervous system. Several regions are highlighted around the photograph of a rat central nervous system parasagittal section stained with Nissl. (A), Flat map of pallial FMUs in the mammalian neural plate according to Puelles et al. (2019) and García-Cabezas et al. (2023a). (B), Rat cortical types along the laminar complexity gradient; the grayscale represents cortical type according to the grade of laminar complexity (black: simplest cortical type; lightest gray: most complex type). (C), Flat map showing the prospective patterning of cortical types in the rat neural plate according to García-Cabezas et al. (2023a); the grayscale is the same as in (B); the orange dashed line passes through all the cortical types represented in (B). (D), Micrographs of cortical types; from left to right: olfactory allocortex – paraolfactory mesocortex – eulaminate cortex – parahippocampal mesocortex – hippocampal allocortex; Roman numerals indicate cortical layers. (E), Magnification of the dorsal striatum. (F), Magnification of the ventral striatum. (G), Magnification of the thalamus. (H), Magnification of the cerebellar cortex, showing its layers. The calibration bar applies to the rat central nervous system parasagittal section. ACC, anterior cingulate cortex; Agran., agranular cortex; AM, anteromedial thalamic nucleus; C. plate, choroidal plate; DP, dorsal pallium; Dysgr., dysgranular cortex; LD, laterodorsal thalamic nucleus; LOT, lateral olfactory tract; LP, lateral pallium; LPt, lateral posterior thalamic nucleus; MCC, medial cingulate cortex; MP, medial pallium; MMP, mesomedial pallium; OB, olfactory bulb; Parahipp., parahippocampal; PCC, posterior cingulate cortex; Po, posterior nucleus; S, septum; SC r. plate, septocommissural roof plate; Septocomm., septocommissural; VP, ventral pallium; VPL, ventral posterolateral thalamic nucleus; VPM, ventral posteromedial thalamic nucleus.
In contrast, Figure 4 shows schemes of several adult human central nervous system regions on top of and on a parasagittal section drawing [from the Atlas of Marburg (1904)]. Figure 4A represents the cortical gradient of laminar complexity with its different cortical types (allocortex, mesocortex, eulaminate I, eulaminate II, eulaminate III, koniocortex), Figure 4B represents in grayscale these cortical types on the fate map of the early pallium, and Figure 4C represents the same cortical types on the surface of the left hemisphere. Other brain regions, like the thalamus, the pons, the inferior olive, and the cerebellum, are highlighted on the parasagittal section drawing (Figure 4D).
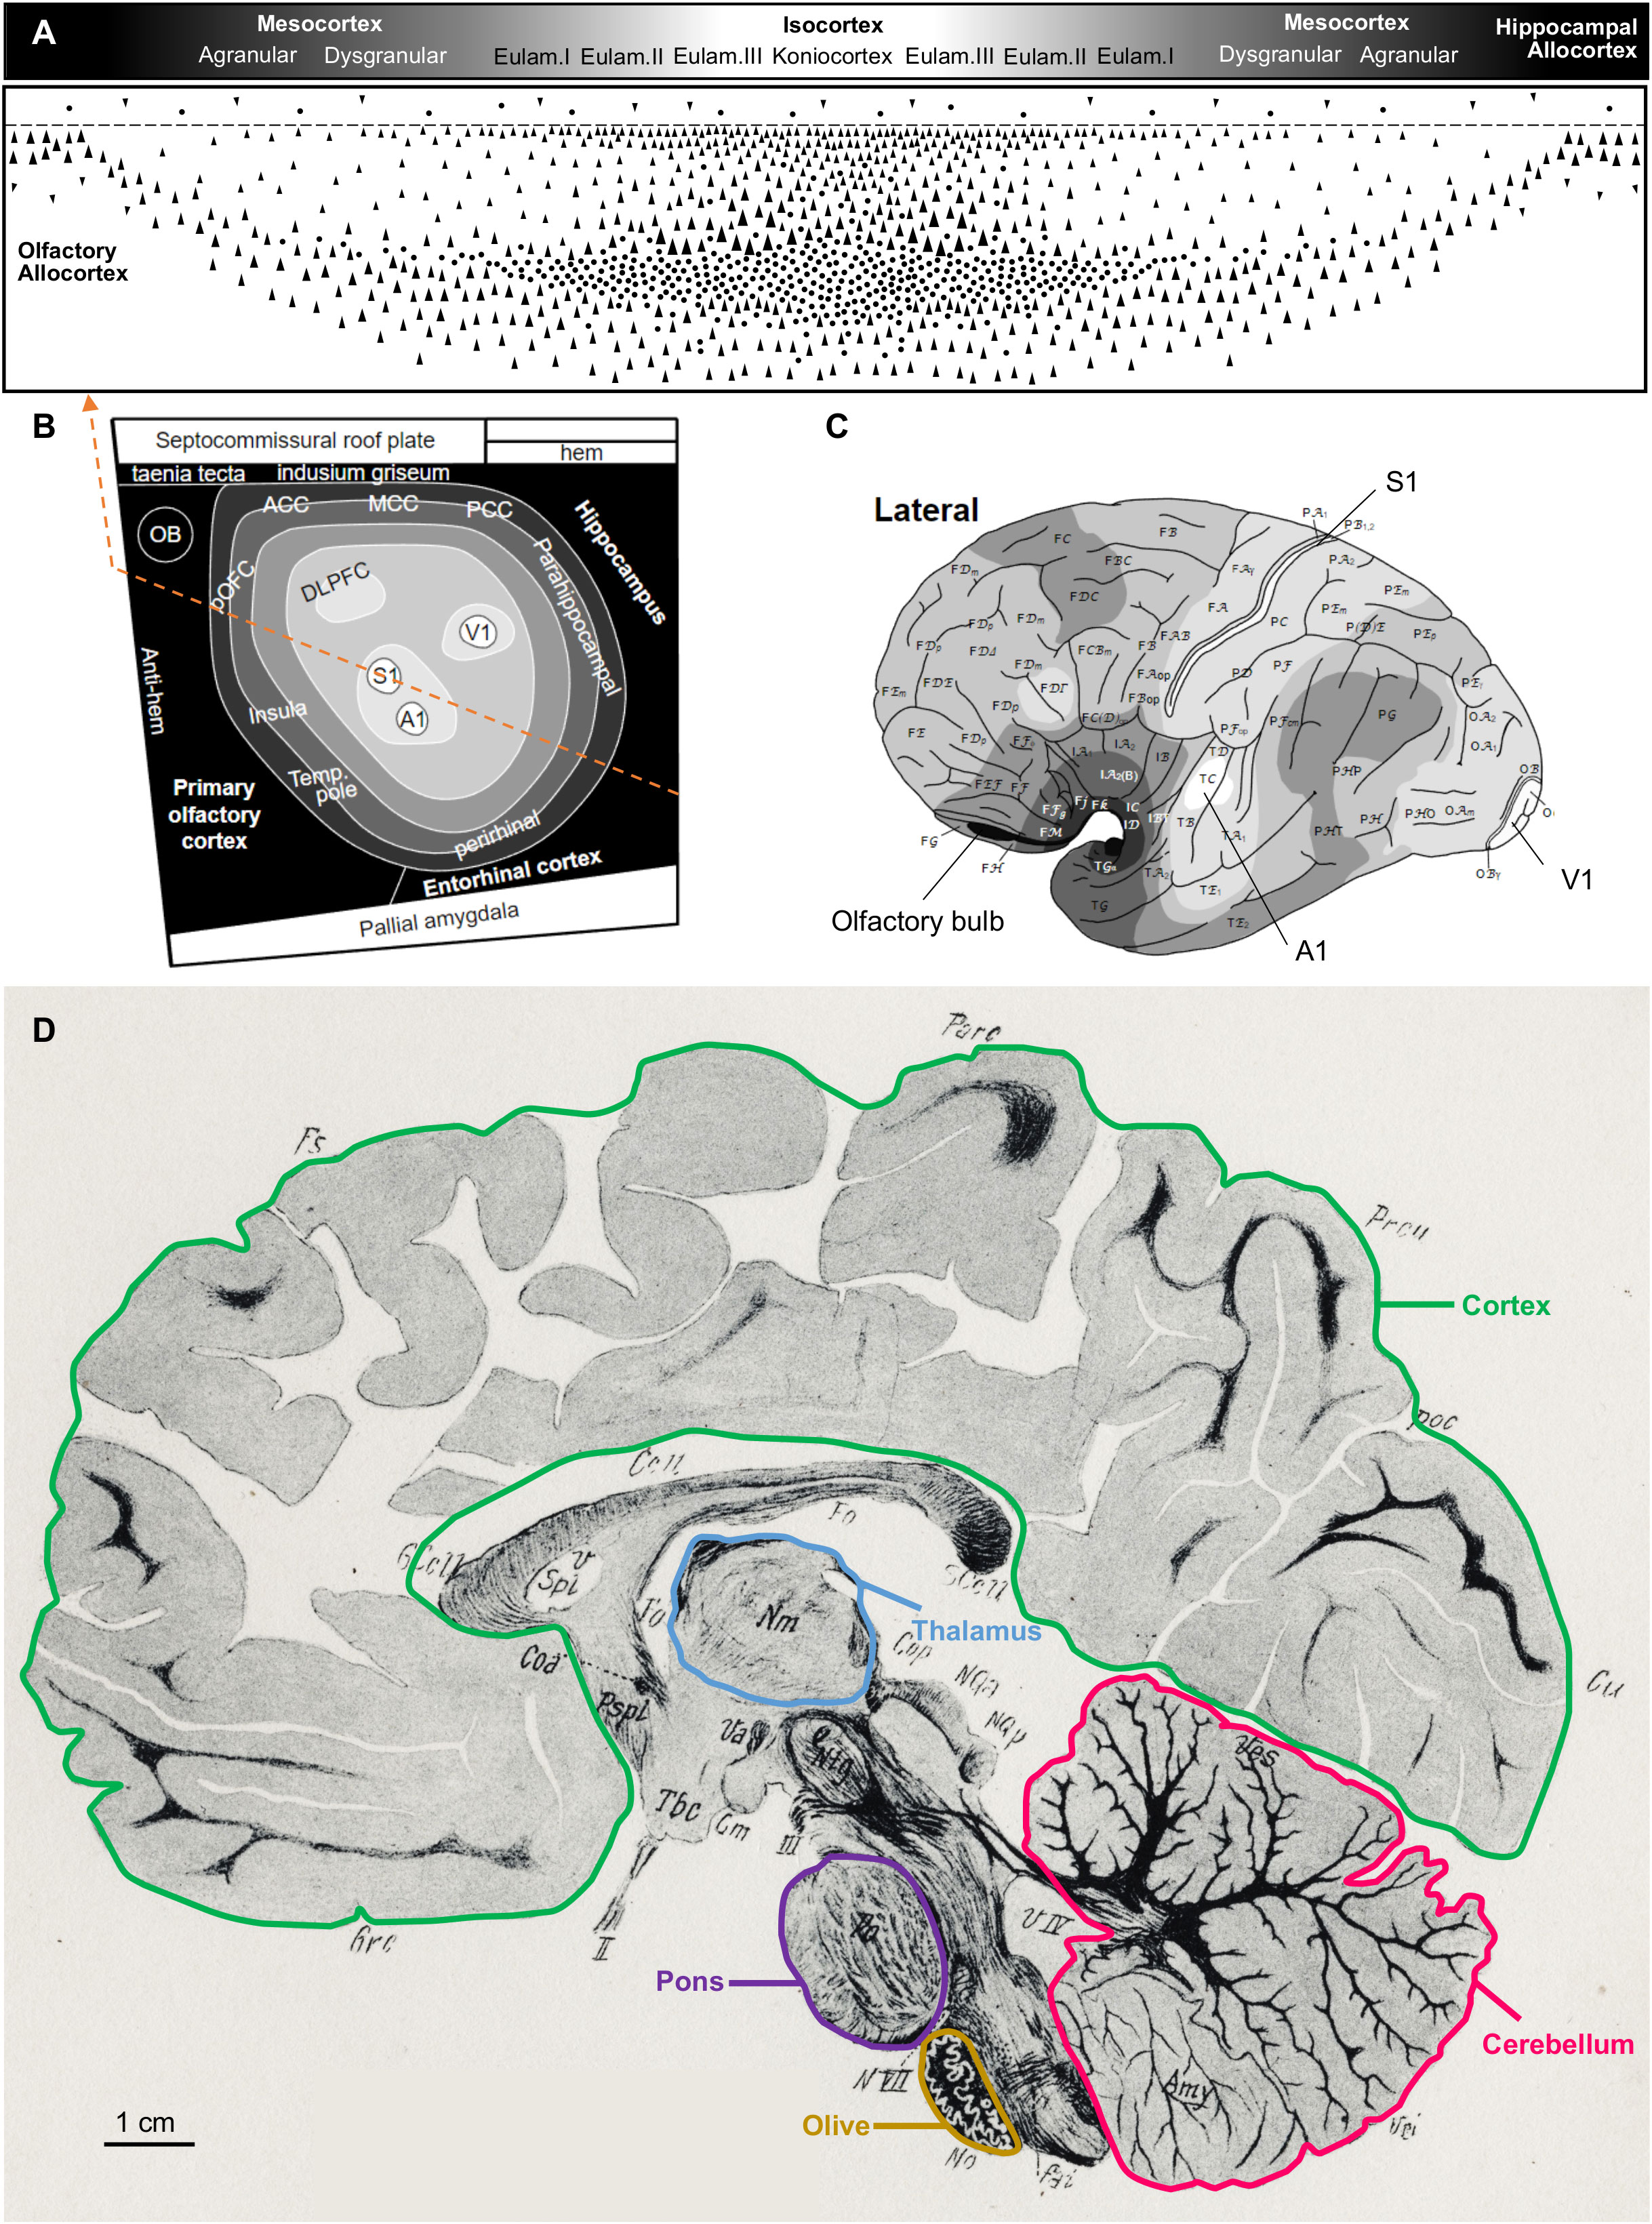
Figure 4 The human central nervous system. Several regions are highlighted on top and on a drawing of a human central nervous system parasagittal section stained for myelin [reproduced from Figure 80 in the atlas of Marburg (1904)]. (A), Human cortical types along the gradient of laminar complexity; the grayscale represents cortical types according to the grade of laminar complexity (black: simplest cortical type; white: most complex type). (B), Flat map showing the prospective patterning of cortical types in the primate neural plate according to García-Cabezas et al. (2023a); the grayscale is the same as in A; the orange dashed line passes through all the cortical types represented in (A). (C), Drawing of the lateral view of a left adult human brain hemisphere showing the distribution of cortical types [modified from García-Cabezas et al. (2020), licensed under CC-BY 4.0]; the grayscale is the same as in (A). (D), Drawing of a parasagittal section of the human brain stained for myelin. The cortex (green contour), thalamus (blue contour), pons (purple contour), olive (mustard contour), and cerebellum (pink contour) are delineated. The calibration bar applies to the human central nervous system parasagittal drawing. A1, primary auditory area; ACC, anterior cingulate cortex; DLPFC, dorsolateral prefrontal cortex; Eulam., eulaminate cortex; MCC, middle cingulate cortex; OB, olfactory bulb; PCC, posterior cingulate cortex; pOFC, posterior orbitofrontal cortex; S1, primary somesthetic area; Temp. pole, temporal pole; V1, primary visual area.
The expansion of the cerebral cortex, the pons, and the cerebellum in the human compared to the rat nervous system stands out at first sight when comparing Figures 3 and 4. In the following sections, we will analyze the quantitative (volume and neuron number) and qualitative (cytoarchitectonic and cell type differences) expansion of the cerebral and cerebellar cortices, the pontine nuclei, the striatum, the dopaminergic nigrostriatal system, the amygdala, and the thalamus in human and non-human primates compared to rodents. We will define several expansion modes and trace them back to the developmental primary events of specification and the secondary events of histogenesis, like neurogenesis and axon growth, in their corresponding prosomeric FMU.
3.1 Tangential expansion of the primate cerebral cortex: “quantitative and qualitative expansion”
The primate cerebral cortex is significantly expanded compared to rodents. This expansion is not merely a quantitative extension of cortical surface by the addition of more cortical columns with comparable laminar composition. On the contrary, new cortical types of higher laminar complexity that are absent in the rat cortex appear in the primate (García-Cabezas et al., 2023a). The appearance of new isocortical types (Eulaminate II, Eulaminate III, and Koniocortex; Figure 4A), was first observed in the human cortex by Friedrich Sanides (1962) and is at the base of the Hypothesis on the Dual Origin of the Neocortex (Sanides, 1970; García-Cabezas et al., 2023a). This hypothesis is supported, at least partially, by genoarchitectonic data obtained in mammalian embryos that suggest that the tangential expansion of the human and non-human primate cerebral cortex seems to have been directed by molecular signalling form developmental organizers like the hem, the anti-hem, and the septocommisural roof plate (Puelles et al., 2019). Primate cortical expansion seems to involve the specification of new isocortical (eulaminate) types in the dorsal pallium FMU (Figure 4B), as suggested by García-Cabezas et al. (2023a).
We have described previously in detail the cytoarchitecture of cortical types along the gradients of laminar complexity in rat, macaque, and human cerebral cortices (García-Cabezas et al., 2019; García-Cabezas et al., 2020; John et al., 2022; Aparicio-Rodríguez and García-Cabezas, 2023; García-Cabezas et al., 2023a). We have also described the differences in the embryonic cortical layers of rats and humans, highlighting the absence of intermediate progenitors in the rat cortex and in prospective human mesocortical areas and their abundance in prospective human eulaminate areas (Barbas and García-Cabezas, 2016; García-Cabezas et al., 2019). Briefly, the tangentially expanded part of the primate cerebral cortex (eulaminate II, eulaminate III, and koniocortical areas) requires an expanded germinal zone composed of ventricular and well-developed subventricular (including outer subventricular) zones (Reillo et al., 2011); the latter, which is underdeveloped in the rat embryonic cortex and in prospective mesocortical human areas, contains intermediate progenitors that produce the abundant granular neurons in layer IV and the projection neurons in layers II and III. It is important to recall that eulaminate II, eulaminate III, and konicortical areas in the primate cortex have higher neuron density at the expenses of their layers II, III, and IV than mesocortical areas (O'Kusky and Colonnier, 1982; Dombrowski et al., 2001; García-Cabezas et al., 2017). Also, the expanded primate cerebral cortex contains more GABAergic interneurons than the rodent cortex [25% and 15% of the total neuron population, respectively; DeFelipe (2011)]; in the latter species cortical GABAergic interneurons are originated in subpallial domains and tangentially migrate to the cortical plate (Marin and Muller, 2014), but in primates they are also originated in pallial sectors (Letinic and Rakic, 2001; Fertuzinhos et al., 2009; Delgado et al., 2022) and probably migrate guided by radial glia, like cortical excitatory neurons do.
In summary, the tangential expansion of the human cerebral cortex (Figure 4A) consisted in the addition of cortical types that do not exist in rodents (Figure 3B). These new types are probably specified in concentric rings within the dorsal pallial FMU (Figure 4B) and contain a well develop subventricular zone with abundant intermediate progenitors. The new cortical types in primates have more excitatory neurons in layers II–IV than in layers V–VI and more GABAergic interneurons across all layers from both pallial and subpallial origin. Thus, we describe the expansion mode of the human cerebral cortex as “Quantitative and qualitative expansion”.
3.2 Primate pontine nuclei, cerebellum, and striatum expansion: “general quantitative expansion”
Several circuits involving the cerebellum and pontine nuclei support different aspects of cortical function [Caligiore et al. (2017); Figure 5]. Extensive cortical regions project to the pontine nuclei, which in turn project to the contralateral cerebellar cortex. Then, Purkinje neurons in the cerebellar cortex project to the deep cerebellar nuclei, which in turn project to the contralateral thalamus. Thalamocortical neurons in the cerebellar thalamic territory close the loop projecting back to frontal cortical areas (Schmahmann and Pandya, 2008). The development of these circuits involves the specification of cerebral cortex, pontine, cerebellar, and thalamic neurons in the alar plate of neuromeres hp1, r6-8, r1, and p2, respectively (Figures 2C–E). Pontine neurons are originated in the alar plate (rhombic lip) of r6-8. Excitatory cerebellar neurons (granule cells in the cerebellar cortex and neurons in the deep cerebellar nuclei) are originated in the rhombic lip of r1, while GABAergic cerebellar neurons (like Purkinje cells) are originated in another sector of the alar plate in r1 (Leto et al., 2016). The thalamic nuclei that receive the deep cerebellar nuclei projection, like the ventral posterior lateral nucleus–oral part (Asanuma et al., 1983), are originated in the Dorsal Thalamus dorsal tier (DTd; in the alar plate of p2) FMU (Puelles, 2001). Finally, the frontal areas that receive projections originated in the cerebellar thalamic territory are originated in the mesomedial pallium (mesocortical cingulate motor areas) and the dorsal pallium (isocortical frontal areas) (Puelles et al., 2019; García-Cabezas et al., 2023a).
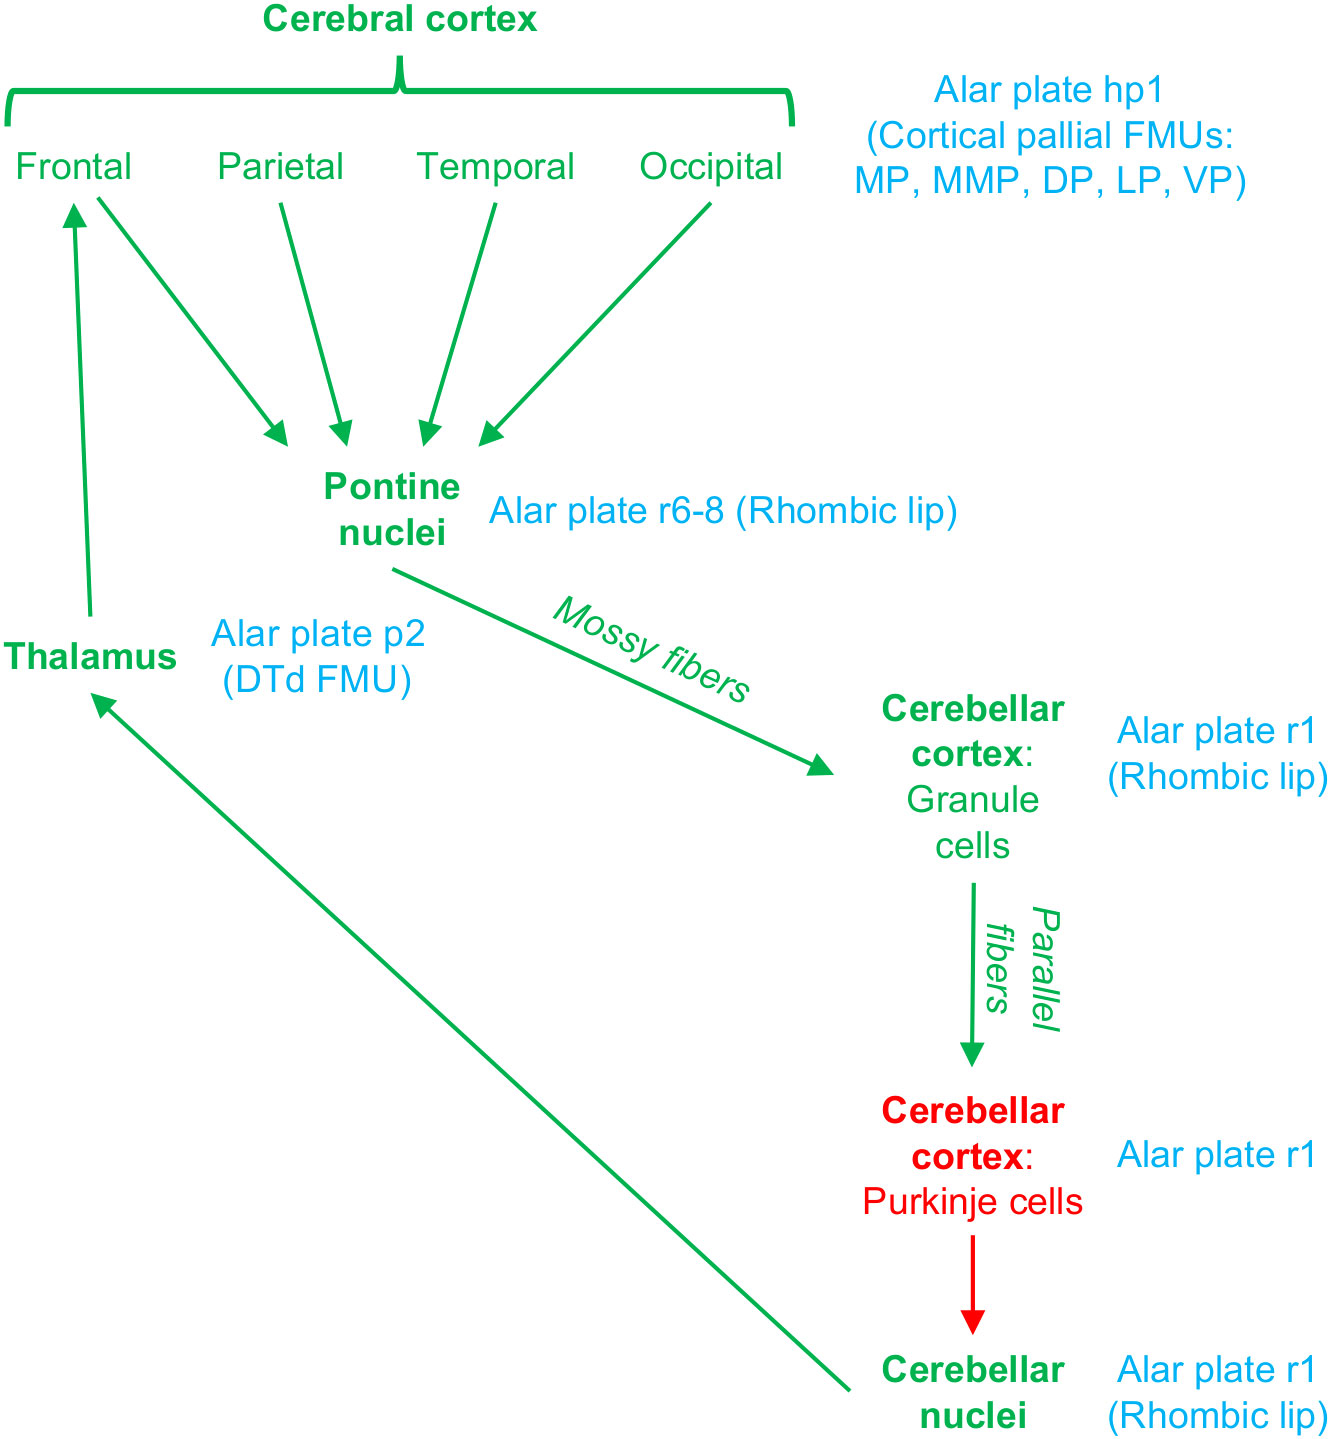
Figure 5 Circuits connecting the cerebral cortex with the pontine nuclei and the cerebellum. Excitatory pathways are colored in green and inhibitory (GABAergic) in red. The corresponding plate, neuromere, and FMU of each circuit station is indicated in blue. Note that all the neurons that form these cortico-pontine, ponto-cerebellar, cerebellar-thalamic, and thalamo-cortical pathways are originated in alar plate FMUs from six different neuromeres. For abbreviations see Figure 2.
Contrary to the cerebral cortex, there is not significant variation in the neuron types that constitute the cerebellum and the pontine nuclei in primates compared to rodents. Actually, the cerebellar cytoarchitecture and cellular composition does not change significantly in primates compared to rodents (Larsell and Jansen, 1967; Baizer, 2014), but the human cerebellar cortex has a much higher index of gyrification than the rat cerebellar cortex (compare Figures 3, 4). Regarding the pontine nuclei, it seems that the differences between rodents and primates are quantitative (with a significant expansion of these nuclei in the human brainstem as showed in Figure 4D) without the addition of new neuron types (Mihailoff et al., 1981; Schmahmann and Pandya, 1997). In summary, the expansion of the primate cerebellum and pontine nuclei does not involve major cytoarchitectonic modifications and probably “just” consists in the addition of more neurons of basically the same types as in rodents. Therefore, we describe the expansion mode of these structures as “General quantitative expansion”.
Besides ponto-cerebellar circuits, the basal ganglia also support cortical function. The striatum is the most important input nuclei of the basal ganglia, and its sectors [olfactory tubercule (TOL), nucleus accumbens (NAc), putamen (Put), and caudate (Cd); originated from the St subpallial FMU; reviewed in Del Rey and García-Cabezas (2023)] receive projections from the entire cerebral cortex. Synaptic tract-tracing studies in primates show that corticostriatal projections are arranged topographically in parallel to cortical type; thus, hippocampal and olfactory allocortices project to TOL and NAc, mesocortical areas project mostly to NAc, and isocortical eulaminate areas project to Put and Cd (Figures 6A, B). In rats, corticostriatal projections are also arranged in parallel to cortical type (Figures 7A, B), but the cortical gradient of laminar complexity in these species does not include highly eulaminate isocortical types (Figures 3B, 7A). Therefore, the pattern of corticostriatal projections in primates and rats is compatible with a striatal expansion in parallel to the tangential cortical expansion [see Del Rey and García-Cabezas (2023)]. Contrary to the cortex, the overall cytoarchitecture and neuron composition of the rat and primate striatum does not vary significantly across striatal nuclei or species, with medium spiny neurons constituting over 80% of the entire neuron population in the striatum of rodents and primates (Del Rey et al., 2022). We can conclude that the expansion of the striatum in primates, like the cerebellum and the pontine nuclei, follows a “General quantitative expansion”.
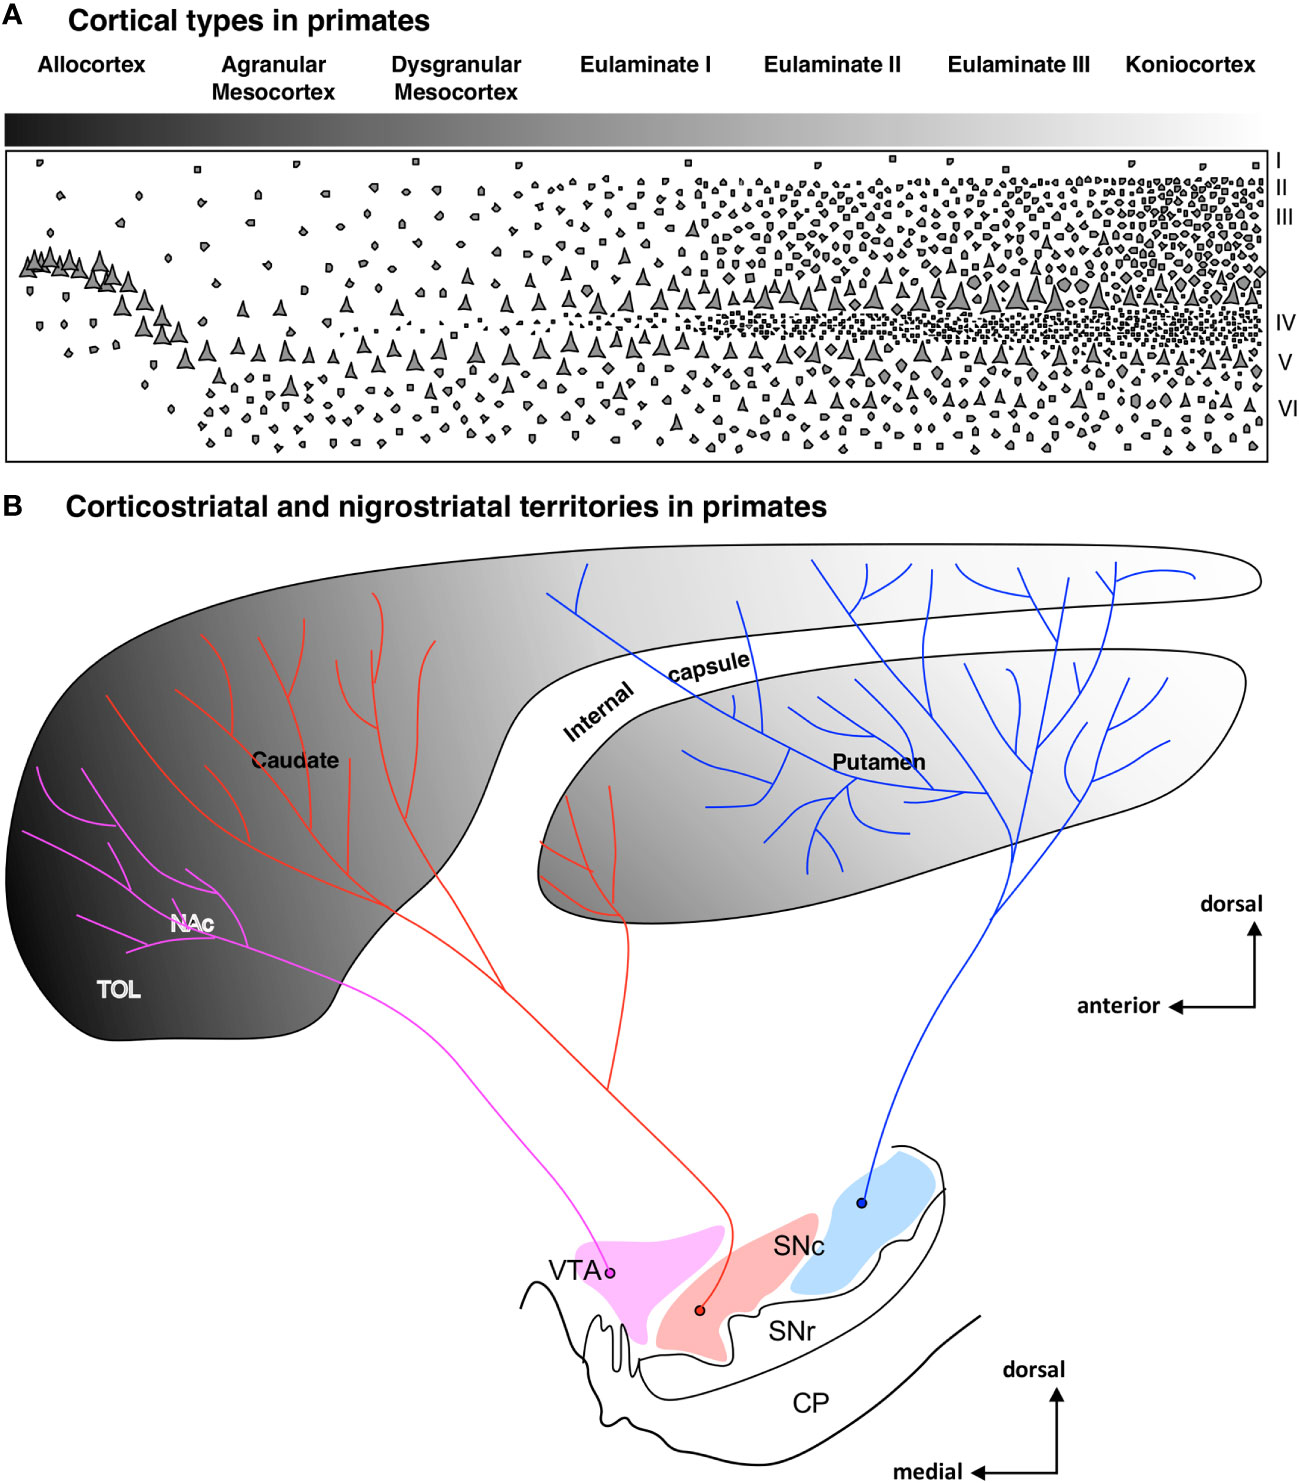
Figure 6 Corticostriatal and nigrostriatal territories in primates. (A), Laminar complexity gradient in the primate cerebral cortex. The grayscale represents cortical types according to the grade of laminar complexity (black: simplest cortical type; white: most complex type); Roman numerals indicate cortical layers. (B), Scheme of the striatum showing the distribution of corticostriatal [according to Yeterian and Pandya (1991); Yeterian and Pandya (1993); Yeterian and Pandya (1995); Yeterian and Pandya (1998); reviewed in Del Rey and García-Cabezas (2023)] and nigrostriatal [according to Lynd-Balta and Haber (1994)] territories. The grayscale represents the corticostriatal territories according to the corresponding cortical type of the projecting areas. Pink represents the ventral tegmental area (VTA), red represents the medial part of the substantia nigra pars compacta (SNc), and blue represents the lateral part of SNc. CP, cerebral peduncle; NAc, nucleus accumbens; SNc, substantia nigra pars compacta; SNr, substantia nigra pars reticulata; TOL, olfactory tubercule; VTA, ventral tegmental area.
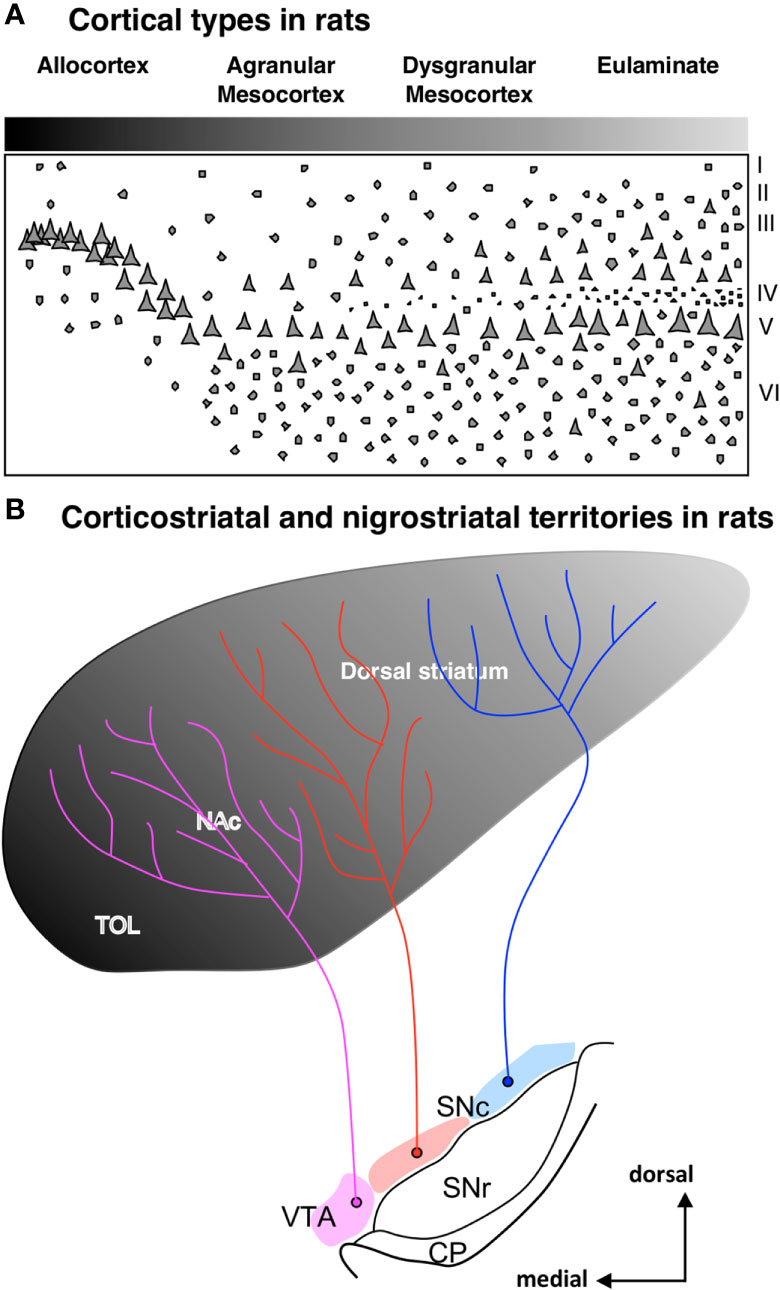
Figure 7 Corticostriatal and nigrostriatal territories in rats. (A), Laminar complexity gradient in the rat cerebral cortex. The grayscale represents cortical types according to the grade of laminar complexity (black: simplest cortical type; lightest gray: most complex type); Roman numerals indicate cortical layers. (B), Scheme of the striatum showing the distribution of corticostriatal [according to Heimer (2008)] and nigrostriatal [according to Beckstead et al. (1979)] territories. The grayscale represents the corticostriatal territories according to the corresponding cortical type of the projecting areas. Pink represents the ventral tegmental area (VTA), red represents the medial part of the substantia nigra pars compacta (SNc), and blue represents the lateral part of SNc. CP, cerebral peduncle; NAc, nucleus accumbens; SNc, substantia nigra pars compacta; SNr, substantia nigra pars reticulata; TOL, olfactory tubercule; VTA, ventral tegmental area.
3.3 Primate dopaminergic nigrostriatal pathways: “telodendrion expansion”
Besides corticostriatal pathways, the striatum receives dopaminergic projections from the substantia nigra pars compacta (SNc) and the ventral tegmental area (VTA). These projections are key for motor and cognitive functions and are disrupted in neuropsychiatric disorders like Parkinson’s disease [reviewed in Del Rey and García-Cabezas (2023)]. The macaque striatum volume increases one order of magnitude compared to rodents and the human striatum is nearly 10 times larger than the macaque striatum (Figure 8A). Thus, the striatum volume in humans compared to rodents increases in a logarithmic scale (Figure 8B). In contrast, the number of dopaminergic SNc neurons increases only in one order of magnitude in humans compared to rodents (Figure 8C). Thus, each dopaminergic neuron in the human SNc must provide innervation to four times more striatal volume than equivalent macaque neurons and ten times more striatal volume than equivalent rodent neurons (Figure 8D). It is important to note that the striatal volume occupied by neuropil compared to the volume occupied by neuron bodies also increases in humans compared to rodents. This is evidenced by microscopic examination of the striatum in Nissl-stained sections (Figures 8E–H); Nissl technique stains neuron bodies and the nuclei of neurons, glial, and endothelial cells, but leaves the neuropil (dendrites, spines, axons, axon terminals, and synapses) unstained. Thus, human dopaminergic SNc neurons must innervate not only larger striatal volumes than those innervated by macaques and rodents, but also enriched-in-synapses volumes. We hypothesize that, in order to provide dopaminergic innervation to their corresponding enriched-in-neuropil larger striatal volumes, human dopaminergic SNc neurons may have significantly longer telodendrions (Figure 6B) than those of rodent nigral neurons (Figure 7B). The increase in body size of SNc neurons in primates compared to rodents (Figures 8I–K), especially in humans (Figure 8L), may reflect larger metabolic burdens of human dopaminergic SNc neurons due to their longer telodendrions and higher number of synapses, which, as has been suggested (Bolam and Pissadaki, 2012), may render human SNc neurons vulnerable to Parkinson’s disease. In summary, we describe the expansion mode of the primate dopaminergic nigrostriatal system as “Telodendrion expansion”.
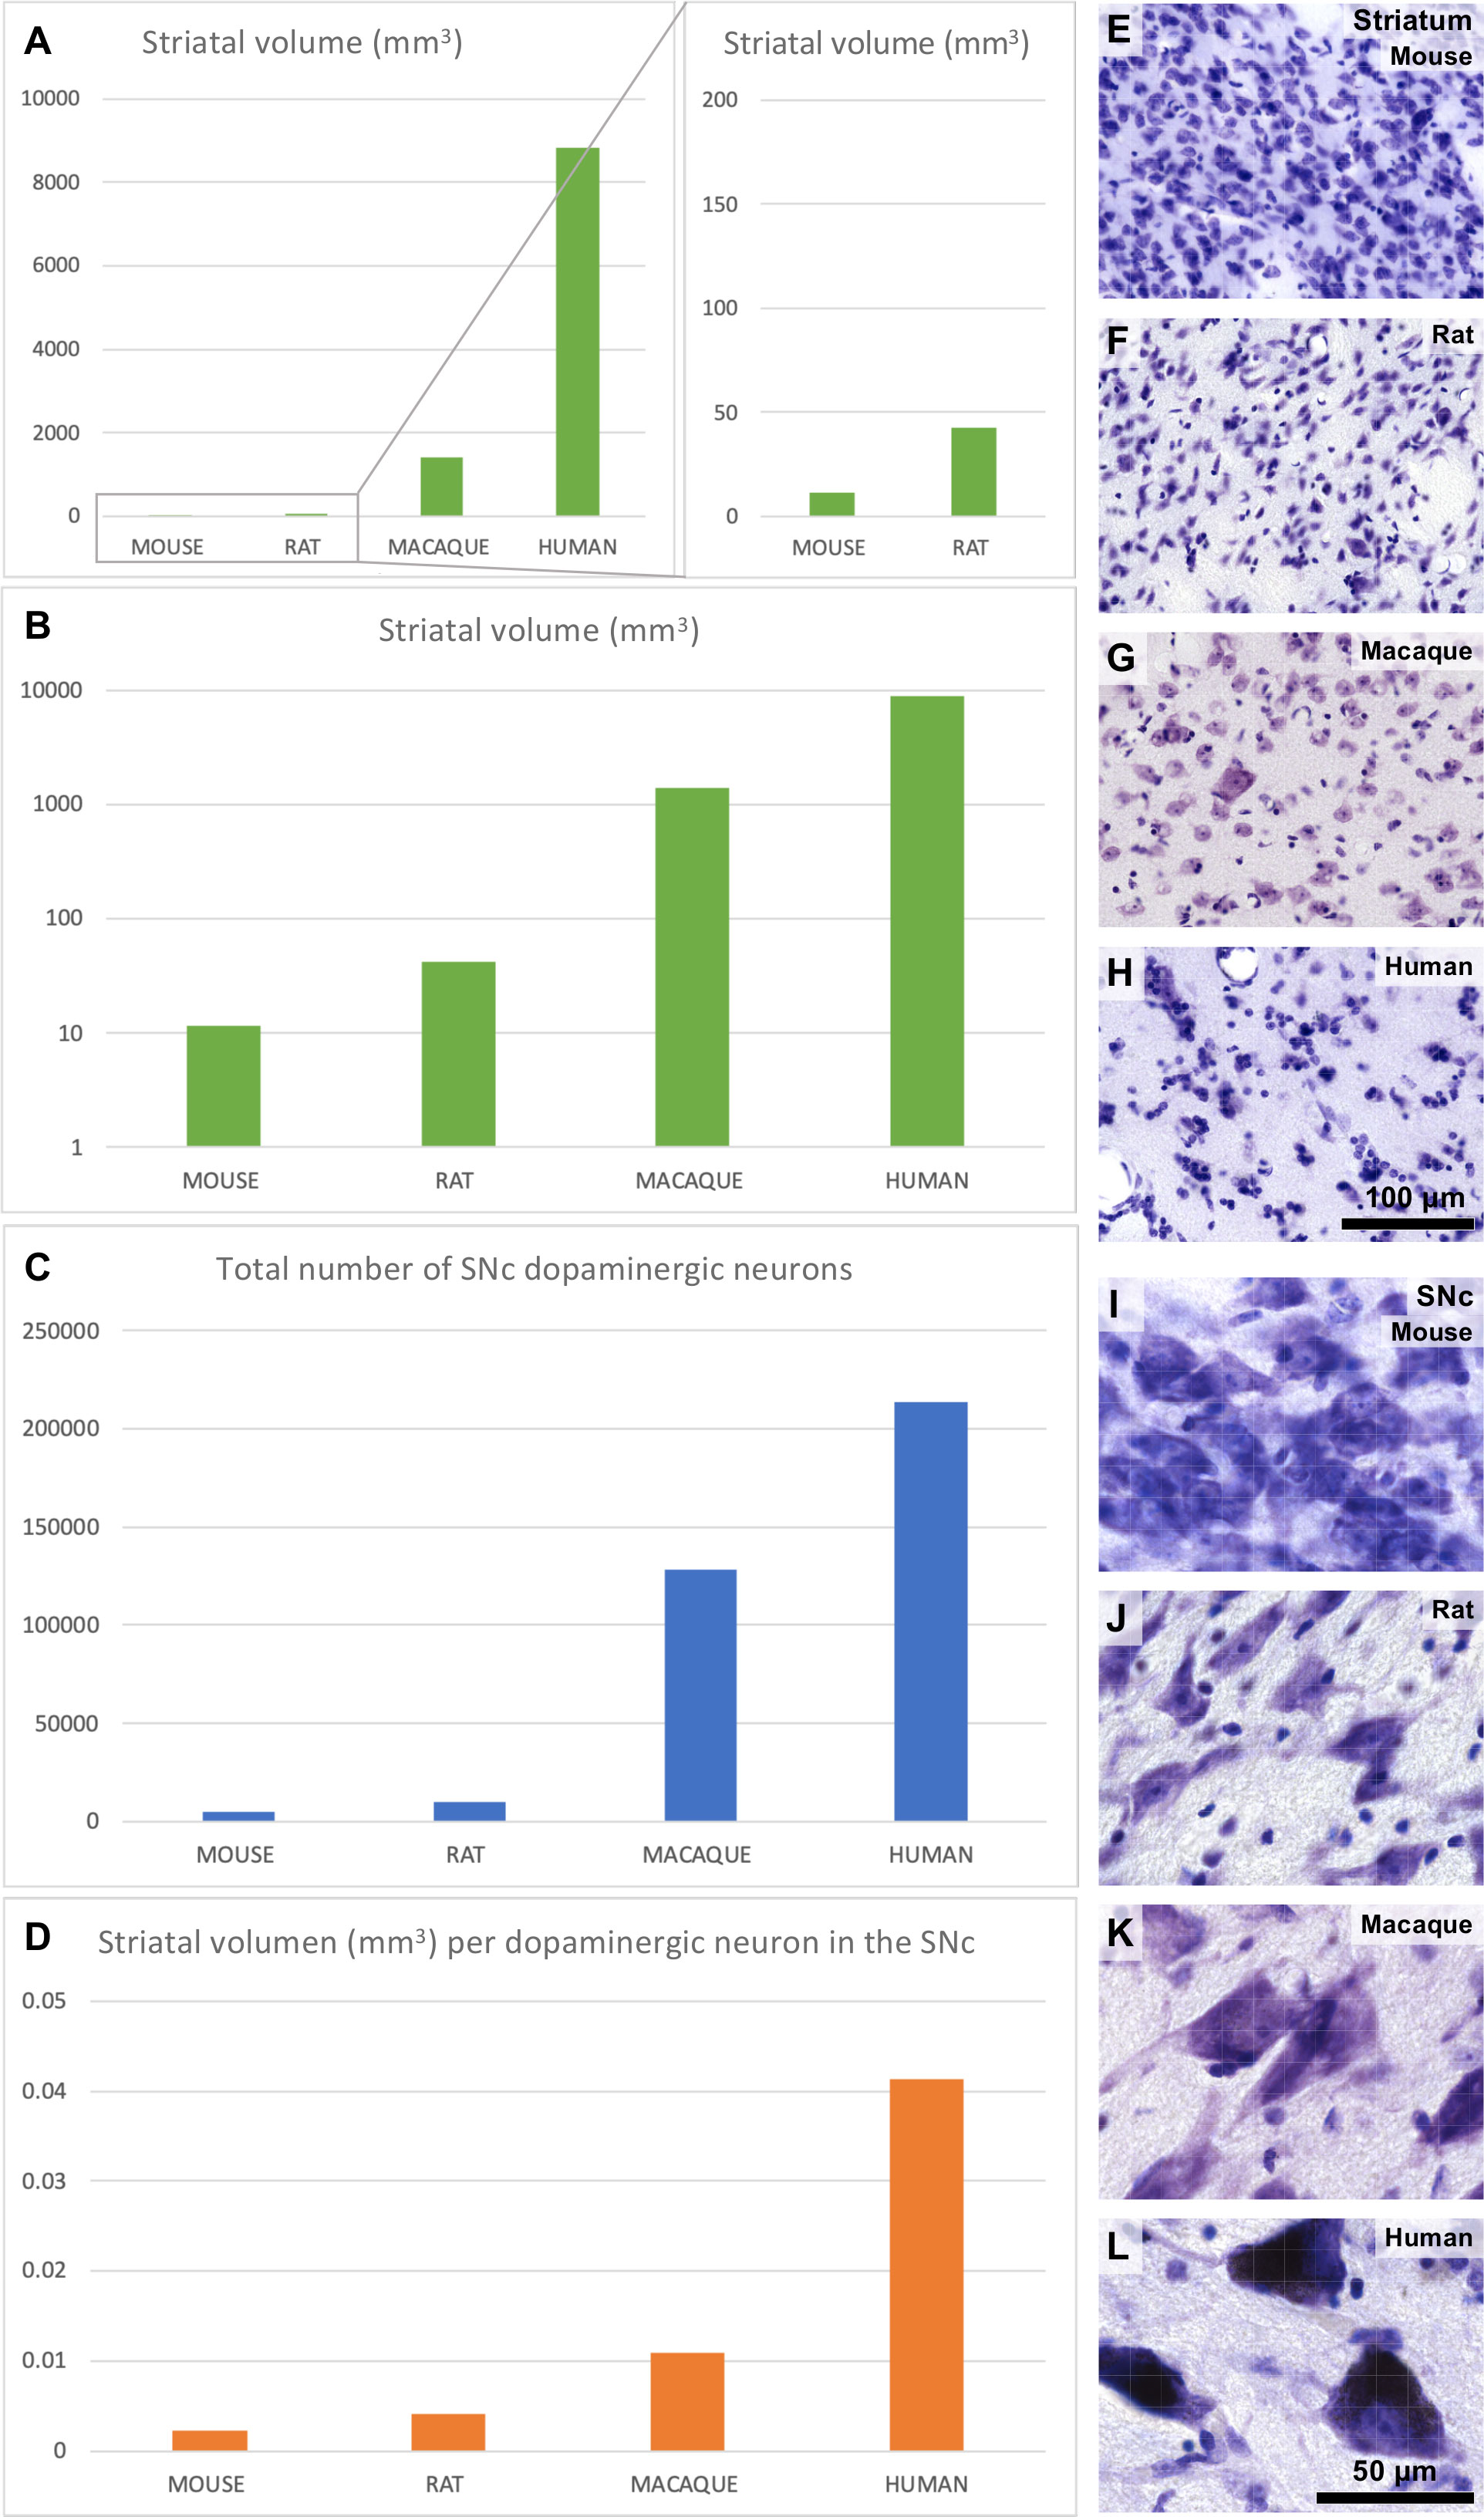
Figure 8 Striatal and nigral expansion in primates compared to rodents. (A), Mouse, rat, macaque, and human unilateral striatal volume. (B), Mouse, rat, macaque, and human unilateral striatal volume in logarithmic scale. (C), Unilateral number of dopaminergic neurons in the mouse, rat, macaque, and human substantia nigra pars compacta (SNc). (D), Striatal volume per dopaminergic SNc neuron in mice, rats, macaques, and humans. (E–H), Micrographs of the mouse, rat, macaque, and human striatum from Nissl-stained sections. (I–L), Micrographs of the mouse, rat, macaque, and human SNc from Nissl-stained sections. Calibration bar in H applies to (E–H) and in L applies to (I–L). Striatal volume data used in this Figure were obtained from Hajek et al. (2009); Yin et al. (2009); Park et al. (2011); Li et al. (2015); Crum et al. (2017); Hamezah et al. (2017) and Nguyen et al. (2020). SNc dopaminergic neuron numbers used in this Figure were obtained from Oorschot (1996); Emborg et al. (1998); Baquet et al. (2009); Omelchenko et al. (2016); Smeyne et al. (2016); Alam et al. (2017); Ip et al. (2017); Vidyadhara et al. (2017); Selemon and Begovic (2020) and Belliveau et al. (2021). See also Supplementary Data File.
3.4 The primate vs rat amygdala: “focal quantitative expansion”
The amygdala is composed of pallial and subpallial nuclei. Cytoarchitectonic studies in rat, macaque, and human amygdala have identified a comparable set of nuclei, with the only probable exception of the primate paralaminar nucleus, as showed in Figure 9. Some amygdalar nuclei originate in the four subpallial FMUs [García-López et al. (2008); red, Figures 9A–C] and others originate in several FMUs within the pallial amydalar sector [García-Calero et al. (2020); yellow, Figures 9A–C]. Subpallial amygdalar nuclei are composed mostly of GABAergic neurons and issue inhibitory projections (red pathways, Figure 9C) to effector autonomic nuclei in the hypothalamus and the brainstem. On the other hand, pallial amygdalar nuclei are composed mostly of excitatory neurons (green pathways, Figure 9C) and have reciprocal connections with mesocortical limbic and isocortical multimodal and unimodal associative areas.
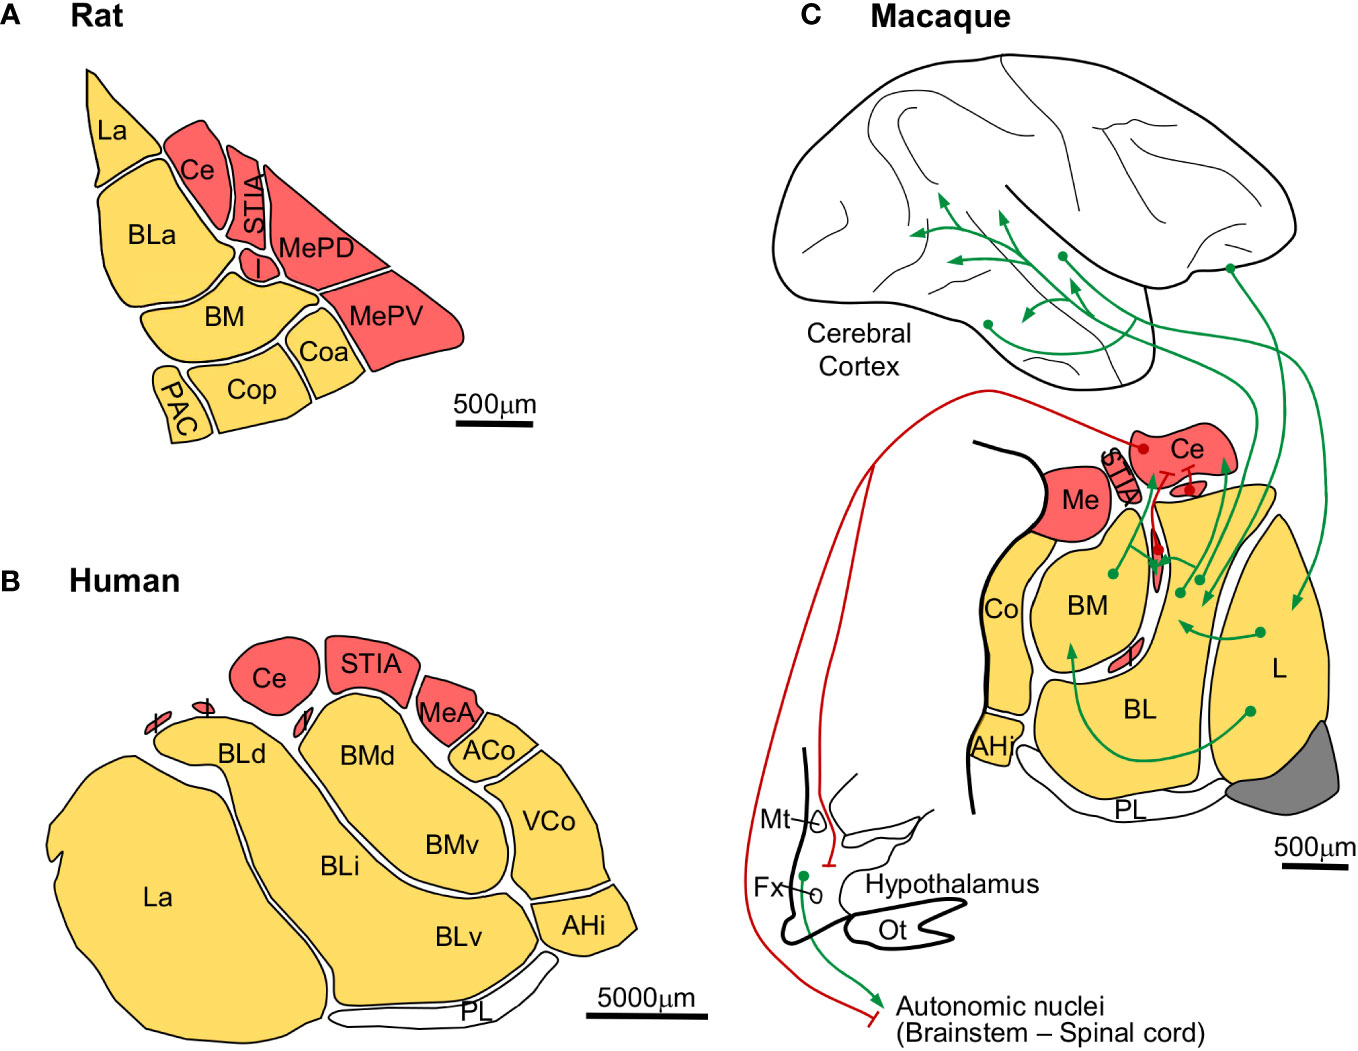
Figure 9 Expansion of pallial amygdalar nuclei in primates. (A), Rat amygdalar nuclei cytoarchitectonic parcellation in coronal section [according to Paxinos and Watson (2007)]. (B), Human amygdalar nuclei cytoarchitectonic parcellation in coronal section [according to de Olmos (1990)]. (C), Scheme of the macaque amygdalar cortical and subcortical synaptic connections [nuclear parcellation in coronal section according to Barbas and de Olmos (1990); synaptic connections according to Freese and Amaral (2009)]; red lines represent GABAergic inhibitory projections; green lines represent excitatory projections. Pallial amygdalar nuclei are colored in yellow; subpallial amygdalar nuclei are colored in red The calibration bar in C applies only to the amygdala. ACo, anterior cortical nucleus; AHi, amygdalo-hippocampal area; BL, basolateral nucleus; BLa, anterior subdivision of the basolateral nuclei; BLd, dorsal subdivision of the basolateral nucleus; BLi, intermediate subdivision of the basolaterl nucleus; BLv, ventral subdivision of the basolateral nucleus; BM, basomedial nucleus; BMd, dorsal subdivision of the basomedial nucleus; BMv, ventral subdivision of the basomedial nucleus; Ce, central nucleus; Co, cortical nucleus; Coa, anterior subdivision of the cortical nucleus; Cop, posterior subdivision of the cortical nucleus; Fx, fornix; I, intercalated masses; L, lateral nucleus; La, lateral nucleus; Me, medial nucleus; MeA, anterior subdivision of the medial nucleus; MePD, posterodorsal subdivision of the medial nucleus; MePV, posteroventral subdivision of the medial nucleus; Mt, mammillothalamic tract; Ot, optic tract; PAC, periamygdaloid cortex; PL, paralaminar nucleus; STIA, intra-amygdaloid subdivision of the stria terminalis; VCo, ventral subdivision of the cortical nucleus.
The amygdalar volume in macaques (Figure 9C) and humans (Figure 9B) increases compared to rats (Figure 9A). But this volume expansion is not homogeneous, because the relative size of the subpallial and the cortical pallial nuclei is not preserved. Actually, the Lateral (L), Basolateral (BL), and Basomedial (BM) nuclei are significantly expanded in macaques compared to rats and in humans compared to macaques (Figure 9). The expanded primate amygdalar nuclei are connected to mesocortical and isocortical areas (Barbas and de Olmos, 1990; Hoistad and Barbas, 2008; Timbie et al., 2020), suggesting that they expand in parallel to the isocortex. The expansion of pallial amygdalar nuclei does not seem to have involved the appearance of different neuron types, because the amygdala in rodents (Millhouse and DeOlmos, 1983; Millhouse, 1986) and primates (Ulfig et al., 2003; Zikopoulos et al., 2016) is composed of comparable neuron types. Therefore, we describe the expansion mode of the primate amygdala as “Focal quantitative expansion”.
3.5 The primate thalamus: “focal quantitative and cell lineage expansion”
The human thalamus (Figure 4D) is larger than the rat thalamus (Figure 3G), but, contrary to the amygdala, there are also qualitative differences in the cytoarchitectonic parcellation of thalamic nuclei across these species. Comparable functional nuclear groups are identified in the rat and human thalamus according to their synaptic connections (Figures 10A–H), but some of them, like the pulvinar complex and the ventral motor nuclei, are expanded and include further subdivisions in humans that are not identified in rats.
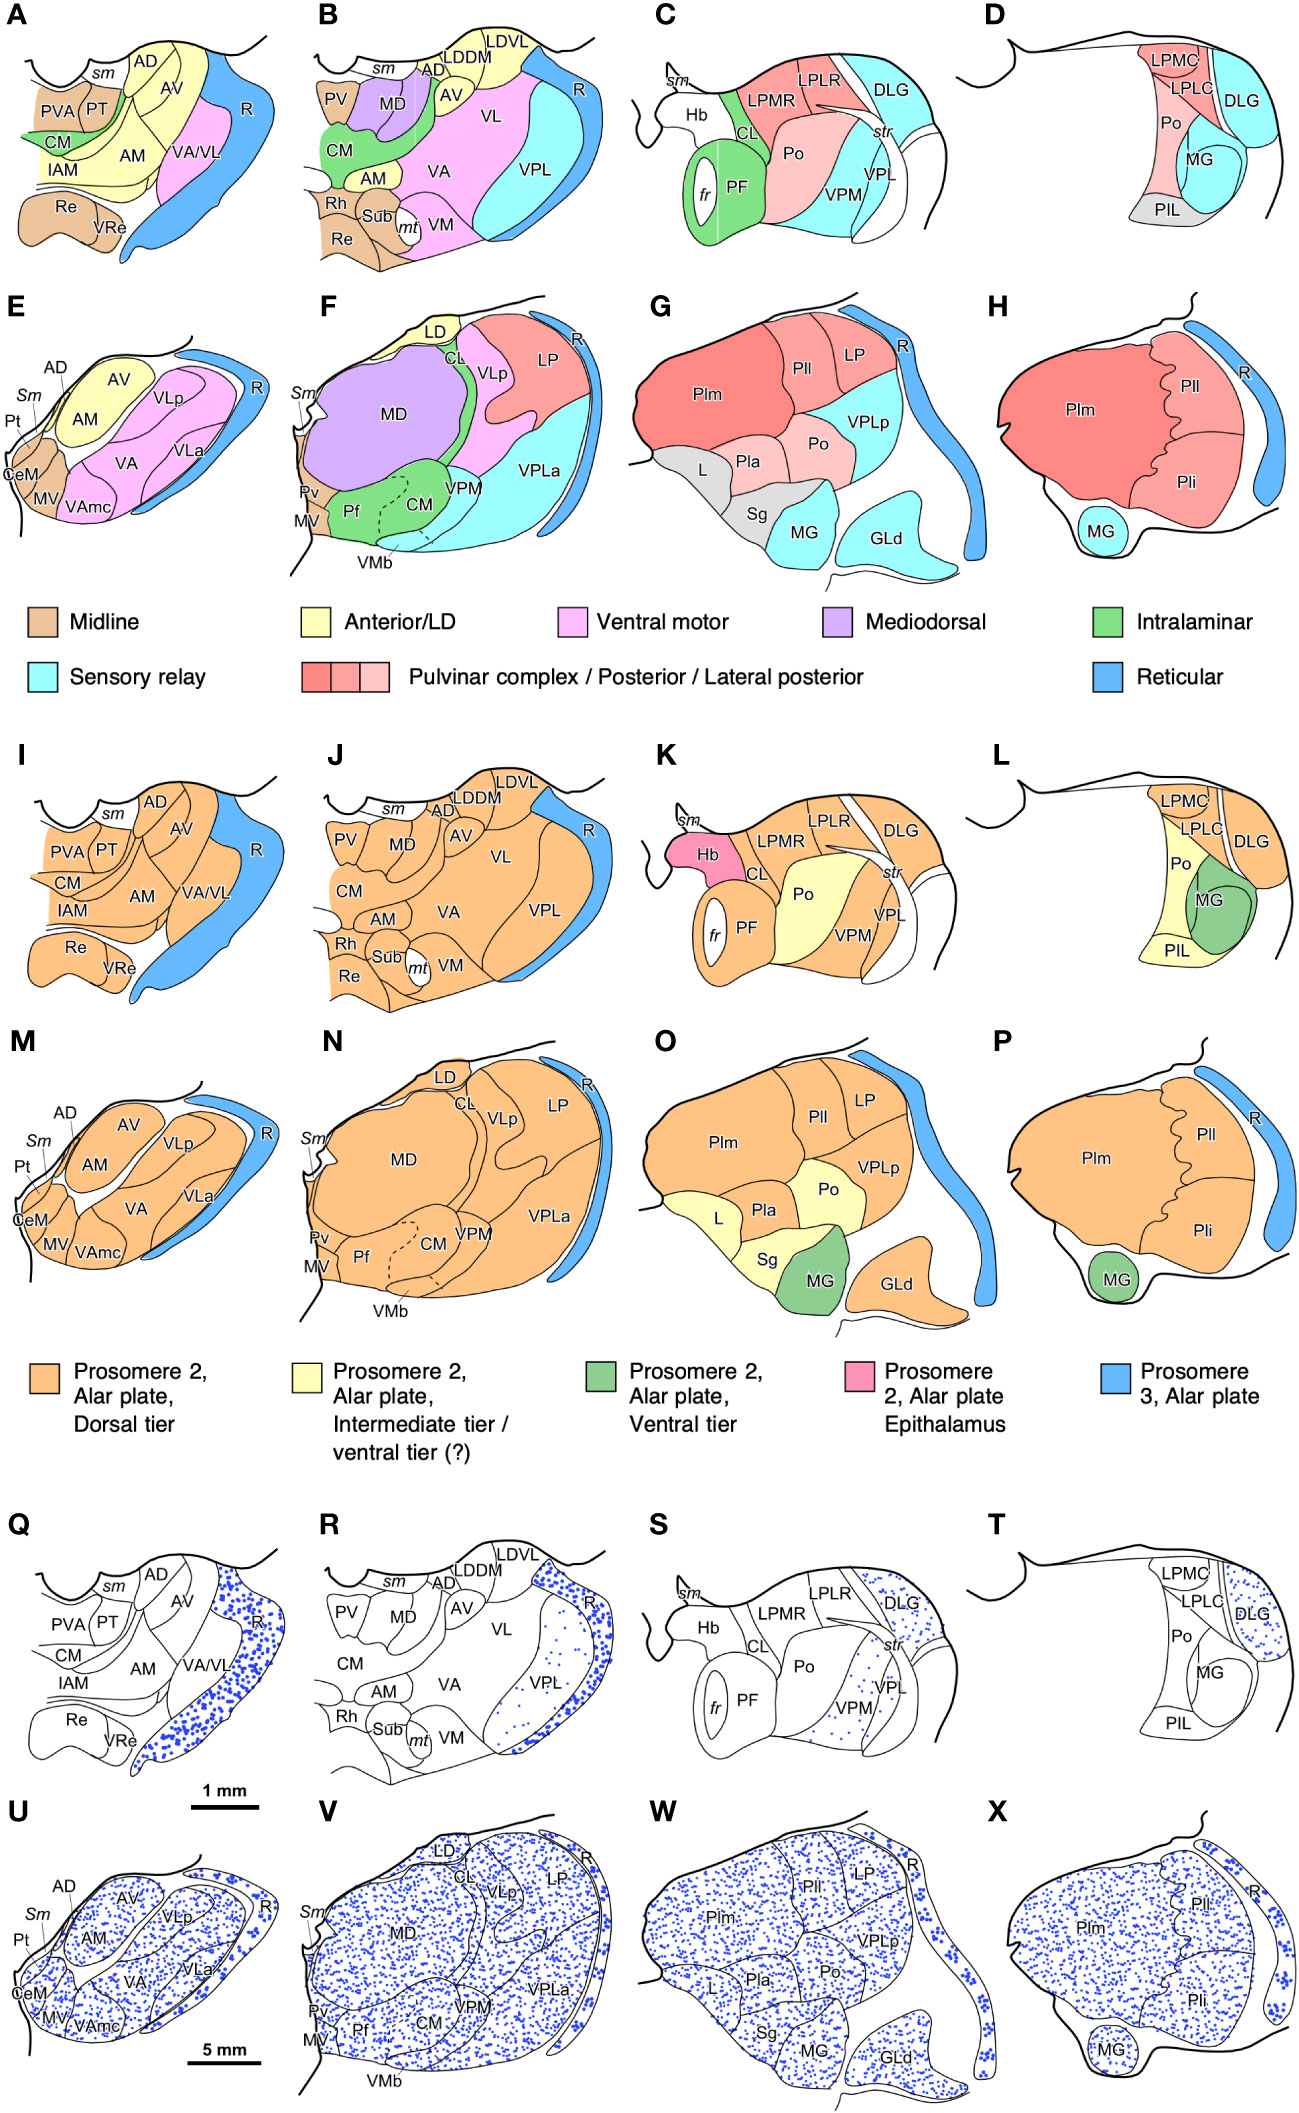
Figure 10 Maps of thalamic nuclei drawn from rat and human brain coronal sections. (A–D), Maps of rat [according to Paxinos and Watson (2007)] and (E–H) human thalamic nuclei [according to Hirai and Jones (1989) and García-Cabezas et al. (2023b)] colored according to their synaptic connections/functions (Jones, 2007). Note how the relative size of some nuclear groups, like anterior or midline nuclei is similar in both species; while the relative size of other nuclear groups, such as Pulvinar complex/Posterior/Lateral posterior is notably increased. (I–L), Maps of rat and (M–P) human thalamic nuclei colored according to their probable FMU (Redies et al., 2000; Puelles, 2001); note that most thalamic nuclei are originated from one FMU (Dorsal Thalamus dorsal tier) in the alar plate of prosomere 2. (Q–T), Distribution of GABAergic interneurons (blue dots) in the rat and (U–X) human thalamus. In the rat thalamus (Q–T), GABAergic interneurons are almost restricted to the reticular thalamic nucleus (R) and the lateral geniculate (DLG) nucleus. In the human thalamus (U–X), GABAergic neurons are present in the reticular thalamic nucleus (R) and in all the other thalamic nuclei. Note the lower density of neurons in the human reticular thalamic nucleus, as compared to the rat reticular thalamic nucleus. GABAergic interneurons in the human dorsal thalamus are represented homogeneously distributed due to lack of precise description of their distribution; probably, these neurons are not equally distributed across the different human thalamic nuclei, as happens in the macaque thalamus (Hunt et al., 1991). Scale bar in (Q) applies to (A–D), (I–L), and (Q–T); Scale bar in (U) applies to (E–H), (M–P), and (U–X). For abbreviations of the rat thalamus see Paxinos and Watson (2007), for the human thalamus see Hirai and Jones (1989) and García-Cabezas et al. (2023b).
The developmental origin of thalamic nuclei has been traced to four FMUs in the alar plate of p2, with the exception of the thalamic reticular nucleus, which is originated in the alar plate of p3 (Figure 2D). This FMUs are the Epithalamus, the Dorsal Thalamus dorsal tier (DTd), the Dorsal Thalamus intermediate tier (DTi), the Dorsal Thalamus ventral tier (DTv), and the Dorsal Thalamus anteroventral tier (DTav) (Redies et al., 2000; Puelles, 2001; Martinez-Ferre and Martinez, 2012; Botella-Lopez et al., 2019). The thalamic nuclei originated in each of these FMUs are represented in Figures 10I–L for the rat thalamus and in Figures 10M–P for the human thalamus. Most nuclei in the rat and human thalamus originate from DTd, which rises the following question: Are smaller FMUs specified within DTd that would give rise to specific sets of thalamic nuclei, like pulvinar or ventral motor nuclei? Further developmental studies may identify smaller thalamic FMUs like those recently described in the pallial amygdala (García-Calero et al., 2020).
Regarding neuron composition, there is a significant difference between the rat and human thalamus. It has been known since the studies of Ramón y Cajal (1903; 1966) that the human thalamus is enriched in interneurons, which are scarce in the rodent thalamus. These interneurons, like the thalamic reticular neurons, are GABAergic (Arcelli et al., 1997) and in the rat thalamus are mostly restricted to the dorsal lateral geniculate nucleus (Figures 10Q–T); in contrast, in the primate thalamus there are GABAergic interneurons across all nuclei (Hunt et al., 1991) (Figures 10U–X). Thus, in the primate thalamus there are more GABAergic interneurons than in the rodent thalamus. In addition, thalamic GABAergic interneurons also have an outstanding feature that makes them a “game changer” for primate thalamic circuits. They have dendrites endowed with flat and pleomorphic GABA-containing vesicles that can be the presynaptic element in symmetric (GABAergic) synapses with other dendrites (Peters et al., 1991; Tai et al., 1995). Presynaptic inhibitory dendrites in the primate thalamus contribute to the formation of complex synaptic arrangements (Kultas-Ilinsky and Ilinsky, 1991; Timbie et al., 2020) that increase the complexity of thalamic circuits compared to rodents. Therefore, we describe the expansion mode of the primate thalamus as “Focal quantitative and cell lineage expansion”.
4 Potential causal mechanisms of expansion modes in the primate nervous system
In the previous sections we have defined several expansion modes according to differences in the cytoarchitecture and cell type composition of several expanded nervous system regions in primates compared to rodents. In Table 3 we summarize these expanded structures, their corresponding FMU, and the expansion modes features. In the following sections, we discuss the potential developmental causal mechanisms underlying the expansion modes in relation to the primary and secondary developmental events in the corresponding FMUs.
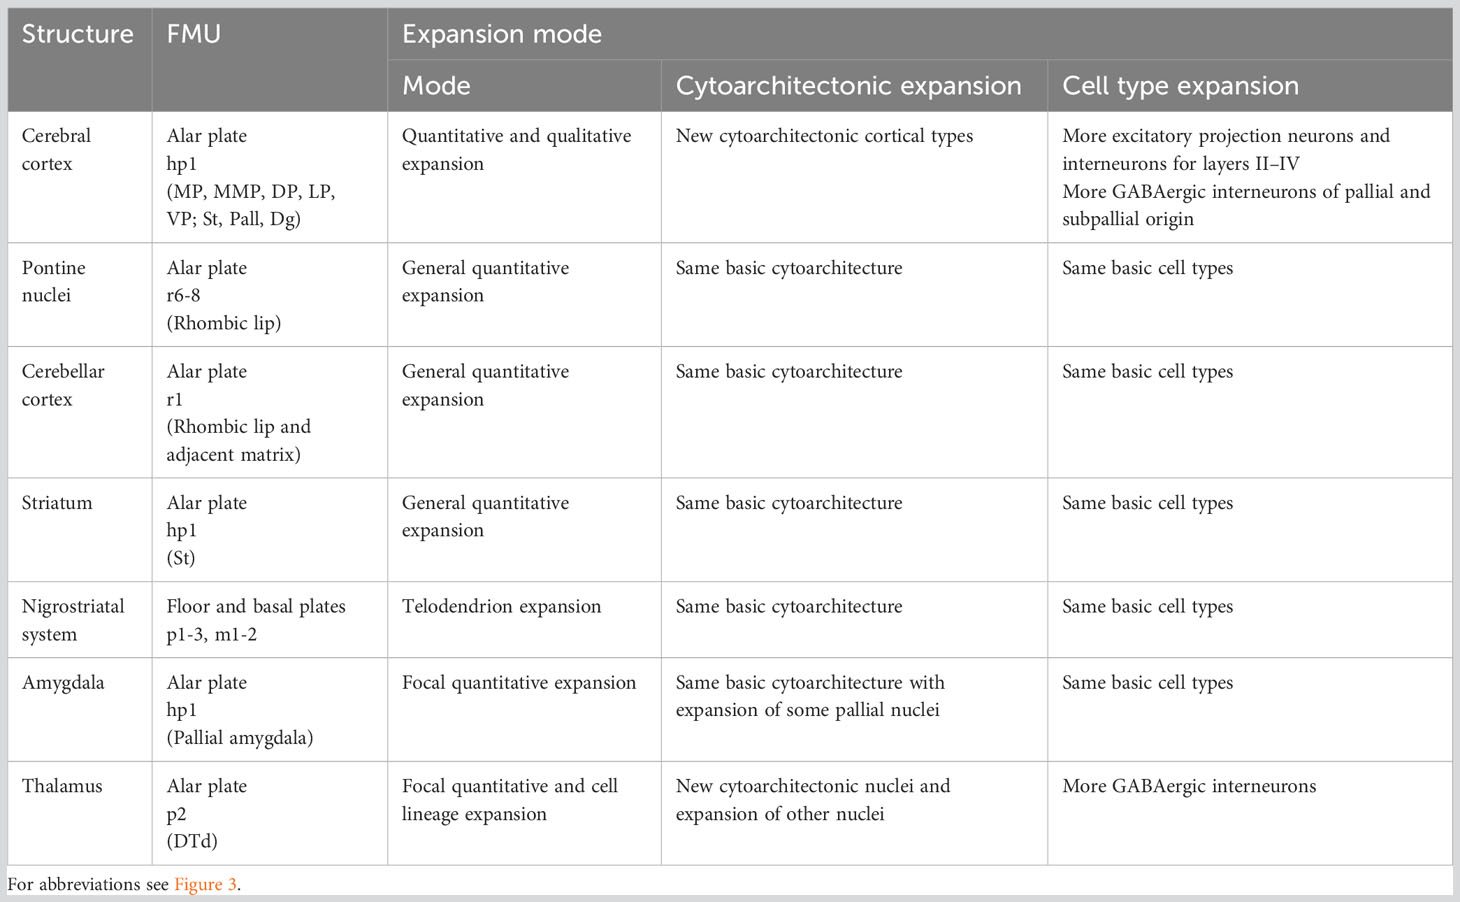
Table 3 Expansion modes of human nervous system structures.
4.1 Neurogenetic heterochrony across species
The different expansion modes of nervous system structures in human and non-human primates compared to rodents described in the previous sections (Table 3) have been quantified volumetrically in several scaling models [e. g., Finlay and Darlington (1995); Yopak et al. (2010)]. Differences in volume can be due to differences in several cellular factors like the total neuron number, the extension of dendritic arborizations, the length of telodendrions, or the amount of myelin. Of all these cellular factors, which are the result of secondary events of histogenesis (Table 2), the total neuron number is the most comparable across species because it can be unbiasedly quantified using stereological methods (Figure 11). The total encephalic, the total cerebral cortex, and the cerebellum neuron number in humans are nearly one order of magnitude higher than in macaques and two orders of magnitude higher than in rodents (Figures 11A–C; the data summarized in this figure were obtained from studies that used unbiased stereological methods – see figure legend and Supplementary Material File). This raises the question of whether the human brain expansion is “concerted” (isometric expansion of all human brain parts) or “mosaic” [some parts expand more than other; Barton and Harvey (2000); Charvet et al. (2011)]. In general, it is acknowledged that, in vertebrates, some brain parts expand more than others [e. g., birds have larger optic tectum, which develops in the alar plate of neuromere m1 (Puelles, 2016; Puelles, 2018), than mammals; Charvet et al. (2010)] and such differential expansions have been related to differential neurogenesis in the prospective expanded regions compared to the non-expanded [e. g., zebra finches -Passerines- have larger telencephalon and thicker proliferative pallial and subpallial subventricular zone than quails -Galliformes-; Charvet and Striedter (2009a)]. A recent study compared neurogenesis in lizard, chicken, and rat embryos and concluded that relative size differences of nervous system parts must result from developmental proliferative heterochrony (Amat et al., 2022). In fact, the vast number of neurons that are generated during human prenatal development implies longer neurogenetic periods, especially in the most expanded regions like the cerebral and cerebellar cortices. The classic article of Kahle (1951), who performed a semi quantitative description of the germinal matrix across developing neural structures in human embryos (Figure 12A), showed that alar plate derivatives (like the cerebral cortex, the striatum, the thalamus, or the spinal cord posterior horn) start and finalize their neurogenetic period later than basal plate derivatives (like the spinal cord anterior horn) resulting in longer neurogenetic periods. Actually, some of the alar plate derivatives have extended periods of neurogenesis in human embryos: in the cerebral cortex and the striatum neurogenesis ends by gestational week 26 (Kostovic et al., 2019; Kostovic et al., 2022) and in the cerebellum there is neurogenesis until the first years of postnatal life (Ten Donkelaar and Lammens, 2009; Iskusnykh and Chizhikov, 2022); in contrast, other alar plate derivatives, like the thalamus, finalized their neurogenesis by gestational week 10.
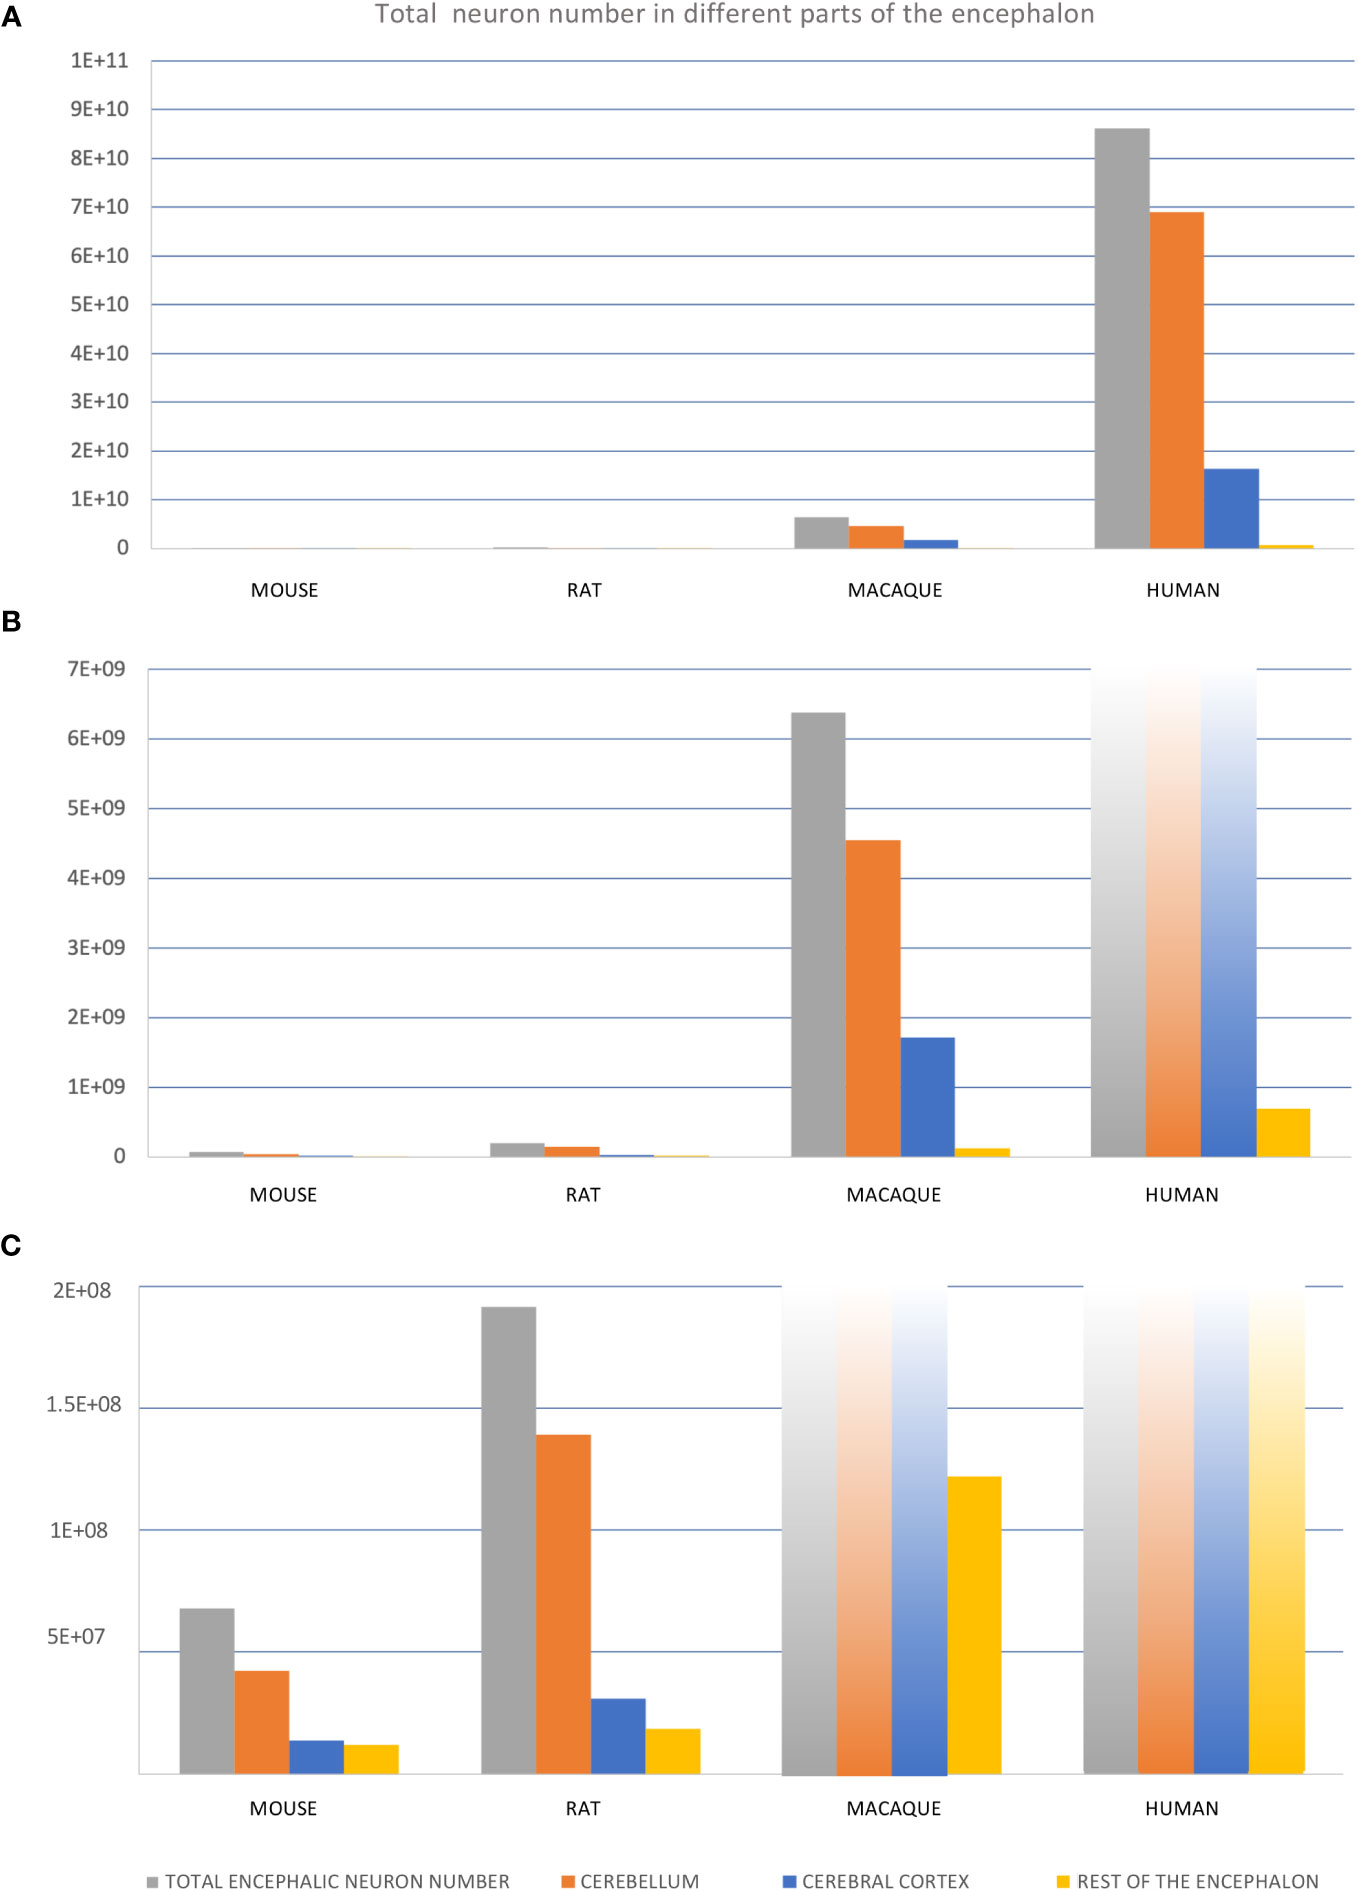
Figure 11 Total neuron number in different regions of mouse, rat, macaque, and human encephalon. (A–C), Three graphics containing the same information but represented in different scales to permit visualization of different orders of magnitude: from tens of billions (A) to tens/hundreds of millions (C). Total number of neurons for “total encephalic neuron number”, “cerebellum”, “cerebral cortex”, and “rest of the encephalon” were obtained from Herculano-Houzel et al. (2015); see also Supplementary Data File.
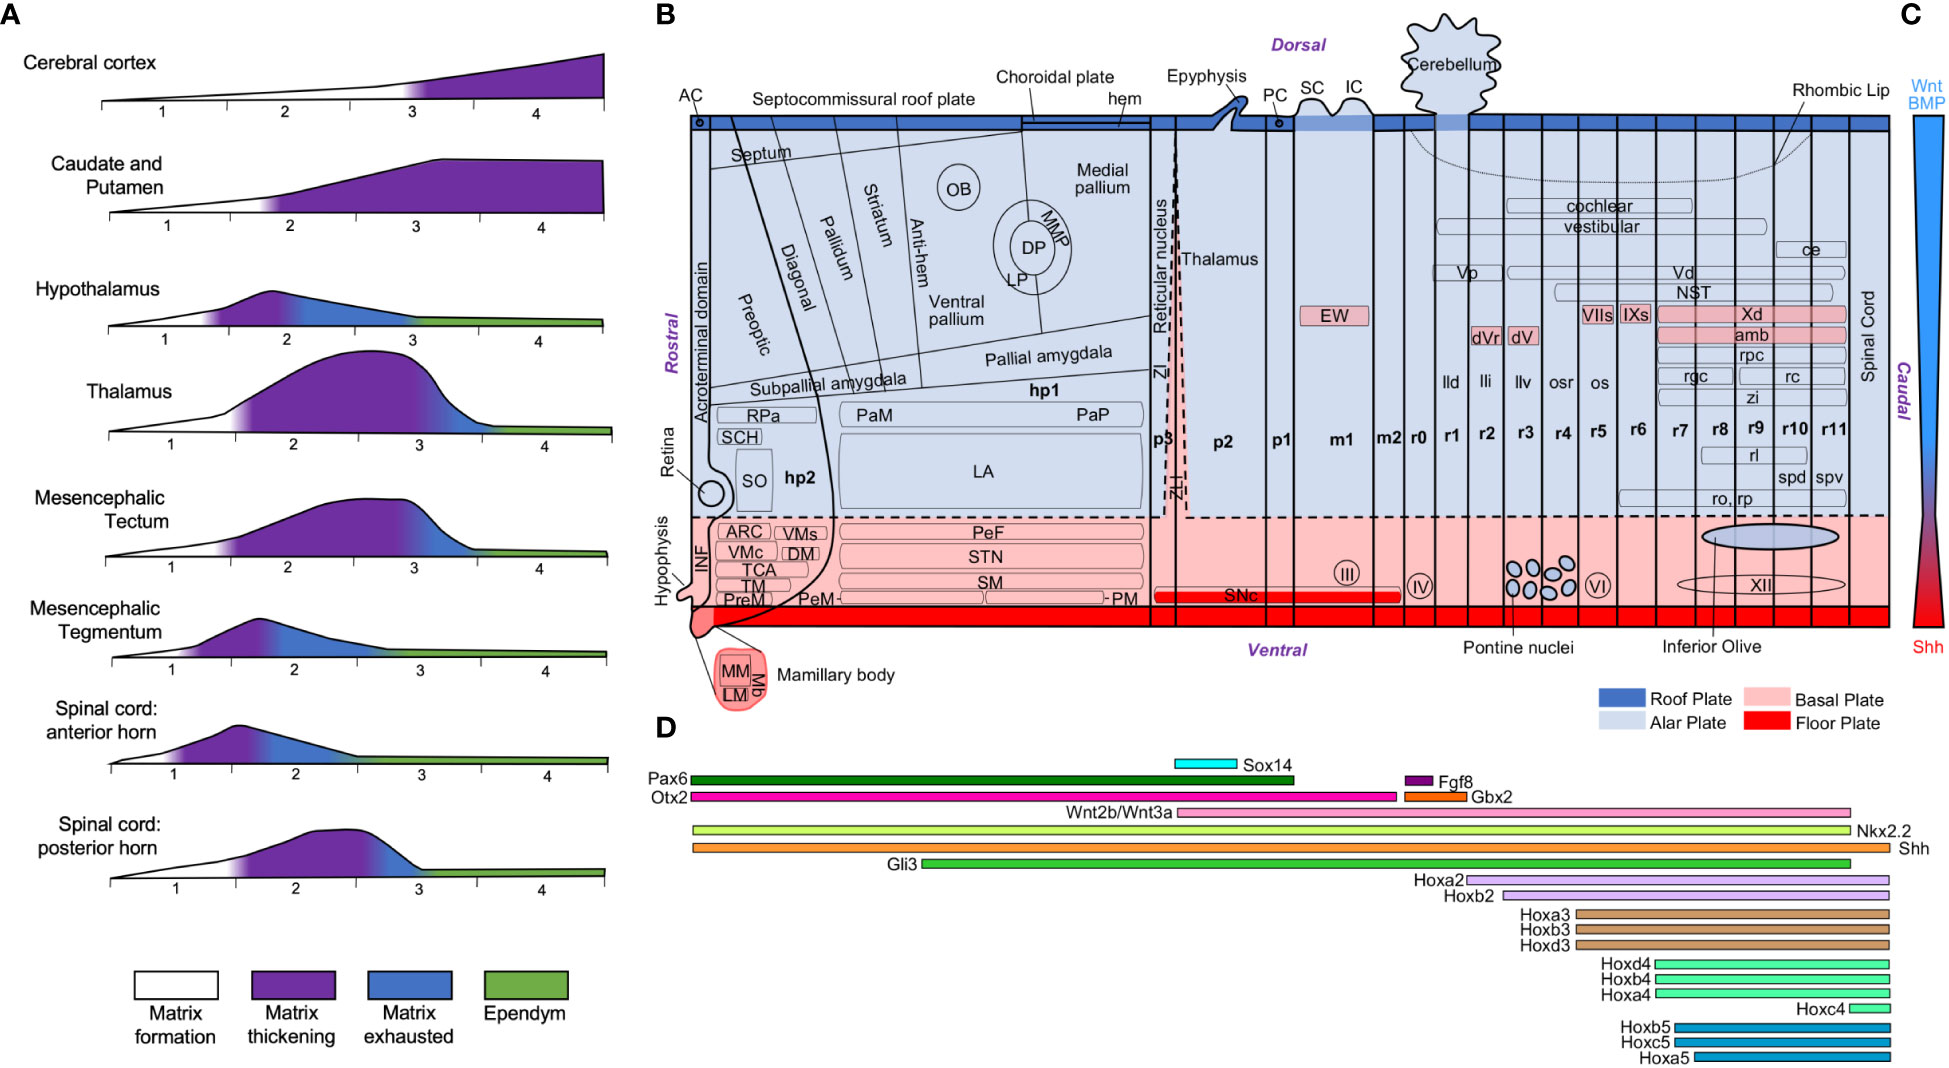
Figure 12 Neurogenetic heterochrony and molecular patterning of the neural tube. (A), Time-course of neurogenesis across central nervous system regions in human embryos [modified from Figures 10 and 11 in Kahle (1951)]. The phases of the germinal matrix [formation (white), thickening (purple), exhaustion (blue), and ependyma (green)] are represented for the brain regions indicated on the left. Numbers below each graphic indicate intrauterine months. (B), Technical scheme of the neural tube showing the intersection of longitudinal plates and transverse neuromeres. Alar plate derivatives are colored in light blue, including those that invade the basal plate, and basal plate derivatives are colored in pink, including those that invade the alar plate. The roof plate is colored in dark blue and the floor plate in red. This technical scheme has been produced with information from Puelles and Verney (1998); Marin et al. (2005); Puelles et al. (2008); Nieuwenhuys (2011); Puelles and Rubenstein (2015); Puelles et al. (2019); and Wells et al. (2020). (C), Gradient of morphogenetic transcription factors along the dorsoventral axis of the neural tube. (D), Gene expression profiles along the rostrocaudal axis of the neural tube. The information of gene expression has been obtained from Martinez-Ferre and Martinez (2012); Kratochwil et al. (2017); and Diek et al. (2022). AC, anterior commissure; amb: ambiguous motor nucleus; ARC, arcuate nucleus; ce, external cuneate nucleus; DM, dorsomedial nucleus; DP, dorsal pallium; dV, dorsal trigeminal motor nucleus; dVr, rostral part of dorsal trigeminal motor nucleus; EW, Edinger-Westphal nucleus; hp1-2, hypothalamic neuromeres 1-2; IC, inferior colliculus; III, oculomotor nerve; INF, infundibulum; IV, trochlear nerve; IXs, superficial glossopharyngeal motor nucleus; LA, lateral hypothalamic area; lld, nucleus lemnisci lateralis, pars dorsalis; lli, nucleus lemnisci lateralis, pars intermedia; llv, nucleus lemnisci lateralis, pars ventralis; LM, lateral mamillary nucleus; LP, lateral pallium; m1-2, mesomeres; Mb, mamillary bodies; MM, medial mamillary nucleus; MMP, mesomedial pallium; NST, nucleus of the solitary tract; OB, olfactory bulb; os, superior olivary nucleus; osr, rostral part of superior olivary nucleus; p1-3, prosomeres 1-3; PaM, paraventricular complex, magnocellular group; PaP, paraventricular complex, parvicellular group; PC, posterior commissure; PeF, Perifornical nucleus; PeM, Perimamillary nucleus; PM, paramamillary nucleus; PreM, premamillary nucleus; r0-11, rhombomeres 0-11; rc, central reticular nucleus; rgc, gigantocellular reticular nucleus; rl, lateral reticular nucleus; ro, nucleus raphe obscurus; rp, nucleus raphe pallidus; RPa, rostral paraventricular nucleus; rpc, parvicellular reticular nucleus; SC, superior colliculus; SCH, suprachiasmatic nucleus; SM, supramamillary area; SNc, substantia nigra pars compacta; SO, supraoptic nucleus; spd, dorsal supraspinal motor nucleus; spv, ventral supraspinal motor nucleus; STN, subthalamic nucleus; TCA, area of the tuber cinereum; TM, tuberomammillary nucleus; Vd, descending nucleus of the trigeminal nerve; VI, abducens nerve; VIIs, superficial facial motor nucleus; VMc, Core part of the ventromedial nucleus; VMs, Shell part of the ventromedial nucleus; Vp, principal nucleus of the trigeminal nerve; Xd, descending nucleus of the vagal nerve; XII, hypoglossal nerve; ZI, zona incerta; zi, zona intermedia; ZLI, zona limitans intrathalamica. For gene abbreviations see Martinez-Ferre and Martinez (2012); Kratochwil et al. (2017); and Diek et al. (2022).
The study of Kahle suggest that embryonic plates have intrinsic different neurogenetic capacity. All the expanded human nervous system structures analyzed in the present article are alar plate derivatives, except the SNc. Why the logarithmic volumetric increase of the primate striatum along phylogeny has not been paralleled by logarithmic increase in the number of dopaminergic SNc neurons? The answer may be in the developmental constrains of the FMUs that give rise to the SNc, which is a plurisegmental nucleus whose neurons are originated in the paramedian subdomain of the floor plate and in the adjacent medial sector of the basal plate along neuromeres p1-3 and m1-2; later, SNc neurons tangentially migrate to the superficial stratum of the basal plate in the neuromere where they were originated (Puelles and Verney, 1998; Verney et al., 2001; Marin et al., 2005). Importantly, the neurogenetic period that gives rise to the SNc in macaques lasts from embryonic day 36 (E36) to E43 (Levitt and Rakic, 1982), a much shorter neurogenesis period compared to macaque alar plate derivatives like the thalamus [from E25 to E50; Spadory et al. (2022)], the striatum [from E36 to E80; Brand and Rakic (1979); Brand and Rakic (1980)], the mesocortex [from E40 to E70; Granger et al. (1995)], and the koniocortex [from E45 to E102; Rakic (1974)]. This points to a severe constrain in the neurogenetic capacity of the floor and basal plates, whose shorter periods of neurogenesis and earlier maturation compared to the alar plate (Charvet and Finlay, 2014) were already observed by Wilhelm His (1897; 1904).
In summary, some FMUs, like those in the floor and basal plates, have developmental constrains that impede their phylogenetic expansion. In contrast, alar FMUs seem to have higher phylogenetic flexibility and differentially expand across vertebrates (e. g., the optic tectum in birds, the cerebral cortex in mammals, the pontine nuclei in primates). These different developmental constrains would explain “mosaic” expansion of some nervous system parts over others.
4.2 Genetic regulation of primary and secondary developmental events
Some studies have addressed neurogenetic heterochrony in different vertebrate species [e. g., Charvet and Striedter (2008); Striedter and Charvet (2008); Charvet and Striedter (2009a); Charvet and Striedter (2010)] and related those differences with genetic regulation of primary events of specification and secondary events of histogenesis [summarized in Charvet et al. (2011) and Montgomery et al. (2016)]. Several mechanisms have been described to account for nervous system “mosaic” expansion. First, the gene expression boundaries (primary events of specification) can vary in different species (Menuet et al., 2007; Sylvester et al., 2010) and, thus, modify the FMU limits resulting in larger or smaller progenitor populations. Second, the neurogenetic period in a given FMU can last longer in different species (Striedter and Charvet, 2009; Amat et al., 2022). Finally, cell rate-division can be shorter (Charvet and Striedter, 2009b). Of these three developmental mechanisms for “mosaic” expansion the first one (primary event modification) is probably the less frequent because the Prosomeric Bauplan and its gene regulatory networks (Figures 12B–D) seem to be strongly conserved across vertebrates. The other two mechanisms can explain larger production of neurons, which would account for some of the expansion modes described in the present article. Thus, most, but not all, differences in nervous system structure across vertebrates must be due to the time-course and magnitude of secondary events of histogenesis in already specified FMUs.
The tangential expansion of the primate cerebral cortex shows the most complex expansion mode (“Quantitative and qualitative”) described in the present article. The primate cerebral cortex is larger, has new cytoarchitectonic cortical types, more excitatory neurons, and more GABAergic interneurons compared to the rodent cerebral cortex. This expansion may imply changes in the primary events of specification in the early primate pallium that may specify novel FMUs (compare Figure 3C with Figure 4B) with more intermediate progenitors in the outer subventricular zone, as suggested by García-Cabezas et al. (2023a). Also, the expanded primate cortex has significantly increased neurogenesis probably by longer neurogenetic periods in the pallial FMUs, whose neuroblasts radially migrate to the cortical plate. Finally, more GABAergic interneurons are produced both in pallial and subpallial FMUs; those produced in the latter tangentially migrate to their cortical destination. Importantly, primate cortical GABAergic interneurons do have different morphology [as already noted by Ramón y Cajal et al. (1988)] and are classified in different biochemical subclasses (DeFelipe, 1997) than rodent cortical GABAergic interneurons [reviewed in Barbas et al. (2018)], which may imply the specification of new cell lineages. Altogether, the “Quantitative and qualitative” expansion mode of the primate cerebral cortex may be due to variations in the primary events of specification in the pallium together with variations in the secondary events of histogenesis of pallial and subpallial FMUs.
In contrast to the cerebral cortex, other primate alar pate derivatives, like the cerebellar cortex, the pontine nuclei, and the striatum, show “General quantitative expansion” without significant cytoarchitectonic modification or new cell types compared to rodents. Contrary to the cerebral cortex, the expansion modes of these other alar plate derivatives may not involve the specification of novel FMUs and are probably due to variations in the secondary events of histogenesis, like neurogenesis, in the corresponding FMUs. These differences in secondary events should be regulated by the morphogenetic genes that specify the FMUs (Figures 12C, D). For instance, the transcription factor Gbx2 is expressed in prospective cerebellar granule cell neurons (Hagan et al., 2017) and restricts the expression of her5, a repressor of neurogenesis (Nakayama et al., 2017). Thus, different modulation of Gbx2 in the primate cerebellum compared to other species could direct the expansion of the granule cell progenitor pool.
The primate amygdala shows “Focal quantitative expansion” in some pallial nuclei, without the addition of new cytoarchitectonic nuclei, with the only probable exception of the paralaminar nucleus (Figure 9). The most expanded nuclei are originated in several small FMUs identified in the pallial amygdalar sector; interestingly, these small FMUs also give rise to pallial nuclei that do not significantly expand, like the cortical amygdalar nuclei (García-Calero et al., 2020). The primate thalamus shows “Focal quantitative expansion” in some nuclei, but, contrary to the amygdala, it also shows the appearance of new nuclei (like some ventral and the pulvinar nuclei) that are not identified in rodents; further genoarchitectonic studies may identify novel FMUs in the primate p2 alar plate that may give rise to the “newer” thalamic nuclei. The primate thalamus also shows a significant “cell lineage expansion” of GABAergic interneurons. In rodents, these neurons are originated in the midbrain and the forebrain (Jager et al., 2021), but they have not been traced to specific FMUs. Thus, the thalamic expansion in primates compared to rodents may involve the specification of novel FMUs, longer neurogenetic periods, and the expansion of the GABAergic interneuron progenitors in several neuromeres.
Finally, the primate nigrostriatal system “Telodendrion expansion” may be the only possible mechanism to provide dopaminergic innervation to the expanded primate striatum because of the developmental constrains in the neurogenetic capacity of floor and basal plates, as commented in the previous section. The “Telodendrion expansion” mode in the primate nigrostriatal system could be due to the downregulation of repressive signals that inhibit nigrostriatal axon growth (a secondary event of histogenesis). Actually, it has been shown that the downregulation of Zinc finger E-box-binding homeobox 2 (Zeb2) in the rat developing midbrain neurons increases Bone Morphogenetic Proteins (BMP) signaling, which promotes axon growth. Thus, the Zeb2 knockout mouse has normal SNc dopaminergic neurons numbers, but dopaminergic hyperinnervation of the striatum (Hegarty et al., 2017). Therefore, variations in the expression of transcription factors like Zeb2 could explain the primate nigrostriatal “Telodendrion expansion” mode.
An intriguing question posed by the expansion modes described in the present article is that several alar plate derivatives (cerebral cortex, cerebellum, striatum, pontine nuclei, thalamus) seem to expand in concert along phylogeny. These alar plate derivatives are originated in different neuromeres (Figures 2, 5); some of them are specified by the expression of Otx-2 and others by Hox genes (Figures 12B, D). At what level of gene regulatory networks is the concerted expansion of these alar plate derivatives regulated? Developmental gene regulatory networks are hierarchical (Peter and Davidson, 2015). This means that the generation of spatial gene expression profiles during the early pre- and postgastrular embryos is encoded at the highest level of the networks (1st specification level in Table 2); in a lower level are encoded the spatial gene expression profiles that specify FMUs (2nd and 3rd specification level in Table 2); and, finally, in the lowest level are encoded the gene expression profiles that specify cell types and other secondary events of histogenesis (4th specification level in Table 2). The primate alar plate derivative expansion could be coded in the lower level by coincident independent modifications in the regulation of each alar FMU; alternatively, there could be an intermediate level where regulatory modifications could impact downstream the regulation of secondary events in several alar FMUs.
5 Conclusions
In the present article we have described five different expansion modes of human and non-human primate nervous system parts and traced them back to their corresponding Prosomeric Model FMUs. These modes confirm that neural structures originated in the alar plate can significantly expand in the primate nervous system both quantitatively, by the production of more neurons, and qualitatively, by the expansion of some cell types and, maybe, the specification of novel FMUs. The human cerebral cortex shows a large tangential quantitative (volume and number of neurons) expansion but also a significant qualitative expansion with the appearance of new cytoarchitectonic cortical types; the new types have more neurons in layers II–IV and more GABAergic interneurons originated in pallial and subpallial FMUs. Some alar plate derivatives, like the pontine nuclei, the cerebellar cortex, and the striatum, are “just” quantitatively expanded by the addition of more neurons. Other alar plate derivatives, like the amygdala and the thalamus, show volume expansion in some nuclei and, in the case of the thalamus, the appearance of new nuclei together with an extraordinary expansion of the GABAergic interneuron population. Our analysis also confirms that neural structures originated in the floor and basal plates have severe developmental constrains that do not allow for significant phylogenetic neuron number expansion; thus, the nigrostriatal system is expanded by “Telodendrion expansion” to provide dopaminergic innervation to the enlarged primate striatum. The expansion and branching of telodendrions also probably plays major roles in the diversification and specialization of alar plate neural circuit in primates compared to rodents, as showed for the thalamus (Parent and Parent, 2005).
The expansion modes in primate nervous system structures can be traced back to variations in the primary events of specification (like the specification of novel FMUs) and secondary events of histogenesis (like longer neurogenetic periods, expansion of cell lineages, or axon growth disinhibition) in the corresponding FMUs. Variation in primary events should be encoded in the intermediate level of gene regulatory networks; on the other hand, variation in secondary events should be encoded in the lower levels of gene regulatory networks, although some modifications in intermediate regulatory levels could account for the concerted expansion of primate alar plate derivatives. It must be acknowledged that the speculations advanced in the present article are based on the comparative analysis of primate and rodent adult brains (thus, after the tertiary events of morphogenesis are finalized) and lack experimental confirmation from developmental studies in primate embryos. Such confirmation may be obtained in future studies of the gene regulatory networks of primary and secondary developmental events in each Prosomeric Model FMU in primates and other mammals. These studies could provide the necessary insight to identify the developmental and phylogenetic causal mechanisms of the expansion modes described in the present article.
Data availability statement
The original contributions presented in the study are included in the article/Supplementary Materials. Further inquiries can be directed to the corresponding author.
Author contributions
MG-C developed the study conception and design. MG-C, SR-C, JZ-D, and IP-S reviewed the literature cited in the text and the figures. SR-C, JZ-D, IP-S, and MG-C assembled the figures. MG-C secured funding. JZ-D contributed to the data curation, formal analysis, visualization, and writing - review and editing. All authors contributed to the article and approved the submitted version.
Funding
This work was supported by a Grant for I+D Projects by the Madrid Government (Comunidad de Madrid-Spain) under the Multiannual Agreement with Universidad Autónoma de Madrid in the line of action encouraging young research doctors, in the context of the V PRICIT (Regional Program of Research and Technological Innovation; grant number SI2/PBG/2020-00014). MAG-C was the recipient of a Beatriz Galindo senior research position in the Faculty of Medicine at Universidad Autónoma de Madrid (BEAGAL18/00098; Spanish Government). JZ-D was the recipient of a Margarita Salas Aid for Requalification at Universidad Autónoma de Madrid (CA1/RSUE/2021-00621; Spanish Ministry of Universities). IP-S was the recipient of a grant from the Chair in Neuroscience UAM-Fundación Tatiana Pérez de Guzmán el Bueno.
Acknowledgments
We thank Dr. Cesar Porrero (Department of Anatomy, Histology and Neuroscience; School of Medicine, Autónoma University of Madrid; Madrid, Spain) for the precious gift of the Nissl-stained mouse brain sections photographed in Figure 8. We also thank Dr. Carmen Cavada (Department of Anatomy, Histology and Neuroscience: School of Medicine, Autónoma University of Madrid; Madrid, Spain) for the precious gift of the Nissl-stained rat, macaque, and human brain sections photographed in Figures 4, 8. The use of human brain tissue was approved by the Ethics Committee for Research of Autónoma University of Madrid (Authorization CEI-104- 2011). We also gratefully acknowledge Dr. Carmen Cavada for giving us access to the microscopes and cameras in her laboratory.
Conflict of interest
The authors declare that the research was conducted in the absence of any commercial or financial relationships that could be construed as a potential conflict of interest.
The author MAG-C declared that they were an editorial board member of Frontiers, at the time of submission. This had no impact on the peer review process and the final decision.
Publisher’s note
All claims expressed in this article are solely those of the authors and do not necessarily represent those of their affiliated organizations, or those of the publisher, the editors and the reviewers. Any product that may be evaluated in this article, or claim that may be made by its manufacturer, is not guaranteed or endorsed by the publisher.
Supplementary material
The Supplementary Material for this article can be found online at: https://www.frontiersin.org/articles/10.3389/fmamm.2023.1241573/full#supplementary-material
References
Alam G., Edler M., Burchfield S., Richardson J. R. (2017). Single low doses of MPTP decrease tyrosine hydroxylase expression in the absence of overt neuron loss. Neurotoxicology 60, 99–106. doi: 10.1016/j.neuro.2017.03.008
Amat J. A., Martinez-de-la-Torre M., Trujillo C. M., Fernandez B., Puelles L. (2022). Neurogenetic heterochrony in chick, lizard, and rat mapped with wholemount acetylcholinesterase and the prosomeric model. Brain Behav. Evol. 97 (1-2), 48–82. doi: 10.1159/000524216
Aparicio-Rodríguez G., García-Cabezas MÁ (2023). Comparison of the predictive power of two models of cortico-cortical connections in primates: The Distance Rule Model and the Structural Model. Cereb Cortex 33 (13), 8131–8149. doi: 10.1093/cercor/bhad104
Arcelli P., Frassoni C., Regondi M. C., De Biasi S., Spreafico R. (1997). GABAergic neurons in mammalian thalamus: a marker of thalamic complexity? Brain Res. Bull. 42 (1), 27–37. doi: 10.1016/s0361-9230(96)00107-4
Arey L. B. (1965). Developmental anatomy: a textbook and laboratory manual of embryology. 7th edn (Philadelphia: Saunders).
Ariëns Kappers C. U., Huber G. C., Crosby E. C. (1936). The comparative anatomy of the nervous system of vertebrates, including man (New York: Macmillan).
Asanuma C., Thach W. T., Jones E. G. (1983). Distribution of cerebellar terminations and their relation to other afferent terminations in the ventral lateral thalamic region of the monkey. Brain Res. 286, 237–265. doi: 10.1016/0165-0173(83)90015-2
Baizer J. S. (2014). Unique features of the human brainstem and cerebellum. Front. Hum. Neurosci. 8. doi: 10.3389/fnhum.2014.00202
Baquet Z. C., Williams D., Brody J., Smeyne R. J. (2009). A comparison of model-based (2D) and design-based (3D) stereological methods for estimating cell number in the substantia nigra pars compacta (SNpc) of the C57BL/6J mouse. Neuroscience 161 (4), 1082–1090. doi: 10.1016/j.neuroscience.2009.04.031
Barbas H., de Olmos J. (1990). Projections from the amygdala to basoventral and mediodorsal prefrontal regions in the rhesus monkey. J. Comp. Neurol. 300 (4), 549–571. doi: 10.1002/cne.903000409
Barbas H., García-Cabezas MÁ (2016). How the prefrontal executive got its stripes. Curr. Opin. Neurobiol. 40, 125–134. doi: 10.1016/j.conb.2016.07.003
Barbas H., Wang J., Joyce M. K. P., García-Cabezas MÁ (2018). Pathway mechanism for excitatory and inhibitory control in working memory. J. Neurophysiol. 120 (5), 2659–2678. doi: 10.1152/jn.00936.2017
Barton R. A., Harvey P. H. (2000). Mosaic evolution of brain structure in mammals. Nature 405 (6790), 1055–1058. doi: 10.1038/35016580
Beckstead R. M., Domesick V. B., Nauta W. J. (1979). Efferent connections of the substantia nigra and ventral tegmental area in the rat. Brain Res. 175 (2), 191–217. doi: 10.1016/0006-8993(79)91001-1
Belliveau S., Kang W., Bovaird S., Hamadjida A., Bedard D., Dancause N., et al. (2021). Stereological investigation of 5-HT(3) receptors in the substantia nigra and dorsal raphe nucleus in the rat. J. Chem. Neuroanat 111, 101881. doi: 10.1016/j.jchemneu.2020.101881
Bergquist H., Kallen B. (1954). Notes on the early histogenesis and morphogenesis of the central nervous system in vertebrates. J. Comp. Neurol. 100 (3), 627–659. doi: 10.1002/cne.901000308
Bolam J. P., Pissadaki E. K. (2012). Living on the edge with too many mouths to feed: why dopamine neurons die. Mov Disord. 27 (12), 1478–1483. doi: 10.1002/mds.25135
Botella-Lopez A., Garcia-Lopez R., Pombero A., Martinez S. (2019). Radial glia fibers translate Fgf8 morphogenetic signals to generate a thalamic nuclear complex protomap in the mantle layer. Brain structure Funct. 224 (2), 661–679. doi: 10.1007/s00429-018-1794-y
Brand S., Rakic P. (1979). Genesis of the primate neostriatum: [3H]thymidine autoradiographic analysis of the time of neuron origin in the rhesus monkey. Neuroscience 4 (6), 767–778. doi: 10.1016/0306-4522(79)90005-8
Brand S., Rakic P. (1980). Neurogenesis of the nucleus accumbens septi and neighboring septal nuclei in the rhesus monkey: a combined [3H]thymidine and electron microscopic study. Neuroscience 5 (12), 2125–2138. doi: 10.1016/0306-4522(80)90128-1
Caligiore D., Pezzulo G., Baldassarre G., Bostan A. C., Strick P. L., Doya K., et al. (2017). Consensus paper: towards a systems-level view of cerebellar function: the interplay between cerebellum, basal ganglia, and cortex. Cerebellum 16 (1), 203–229. doi: 10.1007/s12311-016-0763-3
Charvet C. J., Finlay B. L. (2014). Evo-devo and the primate isocortex: the central organizing role of intrinsic gradients of neurogenesis. Brain Behav. Evol. 84 (2), 81–92. doi: 10.1159/000365181
Charvet C. J., Sandoval A. L., Striedter G. F. (2010). Phylogenetic origins of early alterations in brain region proportions. Brain Behav. Evol. 75 (2), 104–110. doi: 10.1159/000300573
Charvet C. J., Striedter G. F. (2008). Developmental species differences in brain cell cycle rates between northern bobwhite quail (Colinus virginianus) and parakeets (Melopsittacus undulatus): implications for mosaic brain evolution. Brain Behav. Evol. 72 (4), 295–306. doi: 10.1159/000184744
Charvet C. J., Striedter G. F. (2009a). Developmental origins of mosaic brain evolution: Morphometric analysis of the developing zebra finch brain. J. Comp. Neurol. 514 (2), 203–213. doi: 10.1002/cne.22005
Charvet C. J., Striedter G. F. (2009b). Developmental basis for telencephalon expansion in waterfowl: enlargement prior to neurogenesis. Proc. Biol. Sci. 276 (1672), 3421–3427. doi: 10.1098/rspb.2009.0888
Charvet C. J., Striedter G. F. (2010). Bigger brains cycle faster before neurogenesis begins: a comparison of brain development between chickens and bobwhite quail. Proc. Biol. Sci. 277 (1699), 3469–3475. doi: 10.1098/rspb.2010.0811
Charvet C. J., Striedter G. F., Finlay B. L. (2011). Evo-devo and brain scaling: candidate developmental mechanisms for variation and constancy in vertebrate brain evolution. Brain Behav. Evol. 78 (3), 248–257. doi: 10.1159/000329851
Crum W. R., Sawiak S. J., Chege W., Cooper J. D., Williams S. C. R., Vernon A. C. (2017). Evolution of structural abnormalities in the rat brain following in utero exposure to maternal immune activation: A longitudinal in vivo MRI study. Brain Behav. Immun. 63, 50–59. doi: 10.1016/j.bbi.2016.12.008
DeFelipe J. (1997). Types of neurons, synaptic connections and chemical characteristics of cells immunoreactive for calbindin-D28K, parvalbumin and calretinin in the neocortex. J. Chem. Neuroanat 14 (1), 1–19. doi: 10.1016/s0891-0618(97)10013-8
DeFelipe J. (2011). The evolution of the brain, the human nature of cortical circuits, and intellectual creativity. Front. Neuroanat 5. doi: 10.3389/fnana.2011.00029
Delgado R. N., Allen D. E., Keefe M. G., Mancia Leon W. R., Ziffra R. S., Crouch E. E., et al. (2022). Individual human cortical progenitors can produce excitatory and inhibitory neurons. Nature 601 (7893), 397–403. doi: 10.1038/s41586-021-04230-7
Del Rey N. L., García-Cabezas MÁ (2023). Cytology, architecture, development, and connections of the primate striatum: Hints for human pathology. Neurobiol. Dis. 176, 105945. doi: 10.1016/j.nbd.2022.105945
Del Rey N. L., Trigo-Damas I., Obeso J. A., Cavada C., Blesa J. (2022). Neuron types in the primate striatum: Stereological analysis of projection neurons and interneurons in control and parkinsonian monkeys. Neuropathol. Appl. Neurobiol. 48 (5), e12812. doi: 10.1111/nan.12812
de Olmos J. (1990). “Amygdaloid nuclear gray complex,” in The Human nervous system. Ed. Paxinos G. (San Diego: Academic Press), 583–710.
Diaz C., Puelles L. (2020). Developmental genes and malformations in the hypothalamus. Front. Neuroanat 14. doi: 10.3389/fnana.2020.607111
Diek D., Smidt M. P., Mesman S. (2022). Molecular organization and patterning of the medulla oblongata in health and disease. Int. J. Mol. Sci. 23, (16). doi: 10.3390/ijms23169260
Dombrowski S. M., Hilgetag C. C., Barbas H. (2001). Quantitative architecture distinguishes prefrontal cortical systems in the rhesus monkey. Cereb Cortex 11 (10), 975–988. doi: 10.1093/cercor/11.10.975
Echevarria D., Vieira C., Gimeno L., Martinez S. (2003). Neuroepithelial secondary organizers and cell fate specification in the developing brain. Brain Res. Brain Res. Rev. 43 (2), 179–191. doi: 10.1016/j.brainresrev.2003.08.002
Emborg M. E., Ma S. Y., Mufson E. J., Levey A. I., Taylor M. D., Brown W. D., et al. (1998). Age-related declines in nigral neuronal function correlate with motor impairments in rhesus monkeys. J. Comp. Neurol. 401 (2), 253–265. doi: 10.1002/(SICI)1096-9861(19981116)401:2<253::AID-CNE7>3.0.CO;2-X
Fertuzinhos S., Krsnik Z., Kawasawa Y. I., Rasin M. R., Kwan K. Y., Chen J. G., et al. (2009). Selective depletion of molecularly defined cortical interneurons in human holoprosencephaly with severe striatal hypoplasia. Cereb Cortex 19 (9), 2196–2207. doi: 10.1093/cercor/bhp009
Finlay B. L., Darlington R. B. (1995). Linked regularities in the development and evolution of mammalian brains. Science 268 (5217), 1578–1584. doi: 10.1126/science.7777856
Freese J. L., Amaral D. G. (2009). “Neuroanatomy of the primate amygdala,” in The human amygdala. Eds. Whalen P. J., Phelps E. A. (New York: Guilford Press), 3–42.
García-Cabezas MÁ, Hacker J. L., Zikopoulos B. (2020). A protocol for cortical type analysis of the human neocortex applied on histological samples, the Atlas of Von Economo and Koskinas, and magnetic resonance imaging. Front. Neuroanat 14. doi: 10.3389/fnana.2020.576015
García-Cabezas MÁ, Hacker J. L., Zikopoulos B. (2023a). Homology of neocortical areas in rats and primates based on cortical type analysis: an update of the Hypothesis on the Dual Origin of the Neocortex. Brain structure Funct. 228 (5), 1069–1093. doi: 10.1007/s00429-022-02548-0
García-Cabezas MÁ, Joyce M. K. P., John Y. J., Zikopoulos B., Barbas H. (2017). Mirror trends of plasticity and stability indicators in primate prefrontal cortex. Eur. J. Neurosci. 46 (8), 2392–2405. doi: 10.1111/ejn.13706
García-Cabezas MÁ, Perez-Santos I., Cavada C. (2023b). Mapping the primate thalamus: historical perspective and modern approaches for defining nuclei. Brain structure Funct. 228 (5), 1125–1151. doi: 10.1007/s00429-022-02598-4
García-Cabezas MÁ, Zikopoulos B., Barbas H. (2019). The Structural Model: A theory linking connections, plasticity, pathology, development and evolution of the cerebral cortex. Brain structure Funct. 224 (3), 985–1008. doi: 10.1007/s00429-019-01841-9
García-Calero E., Martinez-de-la-Torre M., Puelles L. (2020). A radial histogenetic model of the mouse pallial amygdala. Brain structure Funct. 225 (7), 1921–1956. doi: 10.1007/s00429-020-02097-4
García-Calero E., Puelles L. (2020). Histogenetic radial models as aids to understanding complex brain structures: The amygdalar radial model as a recent example. Front. Neuroanat 14. doi: 10.3389/fnana.2020.590011
García-López M., Abellán A., Legaz I., Rubenstein J. L., Puelles L., Medina L. (2008). Histogenetic compartments of the mouse centromedial and extended amygdala based on gene expression patterns during development. J. Comp. Neurol. 506 (1), 46–74. doi: 10.1002/cne.21524
Granger B., Tekaia F., Le Sourd A. M., Rakic P., Bourgeois J. P. (1995). Tempo of neurogenesis and synaptogenesis in the primate cingulate mesocortex: comparison with the neocortex. J. Comp. Neurol. 360 (2), 363–376. doi: 10.1002/cne.903600212
Hagan N., Guarente J., Ellisor D., Zervas M. (2017). The temporal contribution of the Gbx2 lineage to cerebellar neurons. Front. Neuroanat 11. doi: 10.3389/fnana.2017.00050
Hajek T., Gunde E., Slaney C., Propper L., MacQueen G., Duffy A., et al. (2009). Striatal volumes in affected and unaffected relatives of bipolar patients–high-risk study. J. Psychiatr. Res. 43 (7), 724–729. doi: 10.1016/j.jpsychires.2008.10.008
Hamezah H. S., Durani L. W., Ibrahim N. F., Yanagisawa D., Kato T., Shiino A., et al. (2017). Volumetric changes in the aging rat brain and its impact on cognitive and locomotor functions. Exp. Gerontol 99, 69–79. doi: 10.1016/j.exger.2017.09.008
Hegarty S. V., Wyatt S. L., Howard L., Stappers E., Huylebroeck D., Sullivan A. M., et al. (2017). Zeb2 is a negative regulator of midbrain dopaminergic axon growth and target innervation. Sci. Rep. 7 (1), 8568. doi: 10.1038/s41598-017-08900-3
Heimer L. (2008). “The anatomy of the basal forebrain,” in Anatomy of neuropsychiatry : the new anatomy of the basal forebrain and its implications for neuropsychiatric illness. Eds. Heimert L., Van Hoesen G. W., Trimble M., Zahm D. S. (Amsterdam: Boston Academic Press/Elsevier), 27–67.
Herculano-Houzel S., Catania K., Manger P. R., Kaas J. H. (2015). Mammalian brains are made of these: A dataset of the numbers and densities of neuronal and nonneuronal cells in the brain of glires, primates, scandentia, eulipotyphlans, afrotherians and artiodactyls, and their relationship with body mass. Brain Behav. Evol. 86 (3-4), 145–163. doi: 10.1159/000437413
Herrick C. J. (1910). The morphology of the forebrain in amphibia and reptilia. J. Comp. Neurol. 20, 413–547. doi: 10.1002/cne.920200502
Herrick C. J. (1933). Morphogenesis of the brain. J. Morphol 54, 233–258. doi: 10.1002/jmor.1050540202
Herrick C. J. (1948). The brain of the tiger salamander, Ambystoma tigrinum (Chicago: Univ. of Chicago Press).
Hirai T., Jones E. G. (1989). A new parcellation of the human thalamus on the basis of histochemical staining. Brain Res. Brain Res. Rev. 14 (1), 1–34. doi: 10.1016/0165-0173(89)90007-6
His W. (1897). Address upon the development of the brain. Trans. R. Acad. Med. Ireland XV, 1–19. doi: 10.1007/BF03172388
Hochstetter F. (1919). Beiträge zur Entwicklungsgeschichte des menschlichen Gehirns Vol. I (Vienna & Leipzig: Franz Deuticke).
Hoistad M., Barbas H. (2008). Sequence of information processing for emotions through pathways linking temporal and insular cortices with the amygdala. Neuroimage 40 (3), 1016–1033. doi: 10.1016/j.neuroimage.2007.12.043
Hunt C. A., Pang D. Z., Jones E. G. (1991). Distribution and density of GABA cells in intralaminar and adjacent nuclei of monkey thalamus. Neuroscience 43 (1), 185–196. doi: 10.1016/0306-4522(91)90426-O
Ip C. W., Cheong D., Volkmann J. (2017). Stereological estimation of dopaminergic neuron number in the mouse Substantia nigra using the optical fractionator and standard microscopy equipment. J. Vis. Exp. 127. doi: 10.3791/56103
Iskusnykh I. Y., Chizhikov V. V. (2022). Cerebellar development after preterm birth. Front. Cell Dev. Biol. 10. doi: 10.3389/fcell.2022.1068288
Jager P., Moore G., Calpin P., Durmishi X., Salgarella I., Menage L., et al. (2021). Dual midbrain and forebrain origins of thalamic inhibitory interneurons. Elife 10, e59272. doi: 10.7554/eLife.59272
John Y. J., Zikopoulos B., García-Cabezas MÁ, Barbas H. (2022). The Cortical Spectrum: a robust structural continuum in primate cerebral cortex revealed by histological staining and magnetic resonance imaging. Front. Neuroanat. 16 (897237). doi: 10.3389/fnana.2022.897237
Kahle W. (1951). [Studies on the matrix phases and the local differences in maturation in the embryonic human brain; I. matrix phases general]. Dtsch Z Nervenheilkd 166 (4), 273–302.
Kahle W., Leonhardt H., Platzer W. (1986). Color atlas and textbook of human anatomy (New York: Thieme, Stuttgart), 3rd rev. edn.
Kingsbury B. F. (1920). The extent of the floor-plate of his and its significance. J. Comp. Neurol. 32, 113–135. doi: 10.1002/cne.900320106
Kostovic I., Dzaja D., Raguz M., Kopic J., Blazevic A., Krsnik Z. (2022). Transient compartmentalization and accelerated volume growth coincide with the expected development of cortical afferents in the human neostriatum. Cereb Cortex 33 (2), 434–457. doi: 10.1093/cercor/bhac076
Kostovic I., Sedmak G., Judas M. (2019). Neural histology and neurogenesis of the human fetal and infant brain. Neuroimage 188, 743–773. doi: 10.1016/j.neuroimage.2018.12.043
Kratochwil C. F., Maheshwari U., Rijli F. M. (2017). The long journey of pontine nuclei neurons: from rhombic lip to cortico-ponto-cerebellar circuitry. Front. Neural Circuits 11. doi: 10.3389/fncir.2017.00033
Kuhlenbeck H. (1954). The human diencephalon. A summary of development, structure, function, and pathology. Confinia Neurologica 14 (Suppl.), 1–230. doi: 10.1159/isbn.978-3-318-02902-4
Kuhlenbeck H. (1967–1978). The central nervous system of vertebrates; a general survey of its comparative anatomy with an introduction to the pertinent fundamental biologic and logical concepts (Basel, New York: S. Karger).
Kultas-Ilinsky K., Ilinsky I. A. (1991). Fine structure of the ventral lateral nucleus (VL) of the Macaca mulatta thalamus: cell types and synaptology. J. Comp. Neurol. 314 (2), 319–349. doi: 10.1002/cne.903140209
Langman J., Sadler T. W. (1990). Langman's medical embryology. 6th edn (Baltimore: Williams and Wilkins).
Larsell O., Jansen J. (1967). The comparative anatomy and histology of the cerebellum (Minneapolis: University of Minnesota Press).
Letinic K., Rakic P. (2001). Telencephalic origin of human thalamic GABAergic neurons. Nat. Neurosci. 4 (9), 931–936. doi: 10.1038/nn0901-931
Leto K., Arancillo M., Becker E. B., Buffo A., Chiang C., Ding B., et al. (2016). Consensus paper: cerebellar development. Cerebellum 15 (6), 789–828. doi: 10.1007/s12311-015-0724-2
Levitt P., Rakic P. (1982). The time of genesis, embryonic origin and differentiation of the brain stem monoamine neurons in the rhesus monkey. Brain Res. 256 (1), 35–57. doi: 10.1016/0165-3806(82)90095-5
Li Y., Yuan K., Cai C., Feng D., Yin J., Bi Y., et al. (2015). Reduced frontal cortical thickness and increased caudate volume within fronto-striatal circuits in young adult smokers. Drug Alcohol Depend 151, 211–219. doi: 10.1016/j.drugalcdep.2015.03.023
Lynd-Balta E., Haber S. N. (1994). The organization of midbrain projections to the striatum in the primate: sensorimotor-related striatum versus ventral striatum. Neuroscience 59 (3), 625–640. doi: 10.1016/0306-4522(94)90182-1
Mancall E. L., Brock D. G., Gray H. (2011). Gray's clinical neuroanatomy : the anatomic basis for clinical neuroscience (Philadelphia, PA: Elsevier Saunders).
Marburg O. (1904). Mikroskopisch-topographischer Atlas des menschlichen Zentralnervensystem (Leipzig: Deuticke).
Marin F., Herrero M. T., Vyas S., Puelles L. (2005). Ontogeny of tyrosine hydroxylase mRNA expression in mid- and forebrain: neuromeric pattern and novel positive regions. Dev. Dyn 234 (3), 709–717. doi: 10.1002/dvdy.20467
Marin O., Muller U. (2014). Lineage origins of GABAergic versus glutamatergic neurons in the neocortex. Curr. Opin. Neurobiol. 26, 132–141. doi: 10.1016/j.conb.2014.01.015
Martinez S., Andreu A., Mecklenburg N., Echevarria D. (2013). Cellular and molecular basis of cerebellar development. Front. Neuroanat 7. doi: 10.3389/fnana.2013.00018
Martinez-Ferre A., Martinez S. (2012). Molecular regionalization of the diencephalon. Front. Neurosci. 6. doi: 10.3389/fnins.2012.00073
Medina L., Bupesh M., Abellan A. (2011). Contribution of genoarchitecture to understanding forebrain evolution and development, with particular emphasis on the amygdala. Brain Behav. Evol. 78 (3), 216–236. doi: 10.1159/000330056
Menuet A., Alunni A., Joly J. S., Jeffery W. R., Retaux S. (2007). Expanded expression of Sonic Hedgehog in Astyanax cavefish: multiple consequences on forebrain development and evolution. Development 134 (5), 845–855. doi: 10.1242/dev.02780
Mihailoff G. A., McArdle C. B., Adams C. E. (1981). The cytoarchitecture, cytology, and synaptic organization of the basilar pontine nuclei in the rat. I. Nissl and Golgi studies. J. Comp. Neurol. 195 (2), 181–201. doi: 10.1002/cne.901950202
Millhouse O. E. (1986). The intercalated cells of the amygdala. J. Comp. Neurol. 247 (2), 246–271. doi: 10.1002/cne.902470209
Millhouse O. E., DeOlmos J. (1983). Neuronal configurations in lateral and basolateral amygdala. Neuroscience 10 (4), 1269–1300. doi: 10.1016/0306-4522(83)90112-4
Montgomery S. H., Mundy N. I., Barton R. A. (2016). Brain evolution and development: adaptation, allometry and constraint. Proc. Biol. Sci. 283, (1838). doi: 10.1098/rspb.2016.0433
Nakayama Y., Inomata C., Yuikawa T., Tsuda S., Yamasu K. (2017). Comprehensive analysis of target genes in zebrafish embryos reveals gbx2 involvement in neurogenesis. Dev. Biol. 430 (1), 237–248. doi: 10.1016/j.ydbio.2017.07.015
Nguyen V. T., Tieng Q. M., Mardon K., Zhang C., Chong S., Galloway G. J., et al. (2020). Magnetic Resonance Imaging and Micro-Computed Tomography reveal brain morphological abnormalities in a mouse model of early moderate prenatal ethanol exposure. Neurotoxicol Teratol 77, 106849. doi: 10.1016/j.ntt.2019.106849
Nieuwenhuys R. (2011). The structural, functional, and molecular organization of the brainstem. Front. Neuroanat 5. doi: 10.3389/fnana.2011.00033
Nieuwenhuys R. (2017). Principles of current vertebrate neuromorphology. Brain Behav. Evol. 90 (2), 117–130. doi: 10.1159/000460237
Nieuwenhuys R., Puelles L. (2016). Towards a New Neuromorphology (Heidelberg, New York: Springer International Publishing). doi: 10.1007/978-3-319-25693-1
O'Kusky J., Colonnier M. (1982). A laminar analysis of the number of neurons, glia, and synapses in the adult cortex (area 17) of adult macaque monkeys. J. Comp. Neurol. 210 (3), 278–290. doi: 10.1002/cne.902100307
Omelchenko N., Roy P., Balcita-Pedicino J. J., Poloyac S., Sesack S. R. (2016). Impact of prenatal nicotine on the structure of midbrain dopamine regions in the rat. Brain structure Funct. 221 (4), 1939–1953. doi: 10.1007/s00429-015-1014-y
Oorschot D. E. (1996). Total number of neurons in the neostriatal, pallidal, subthalamic, and substantia nigral nuclei of the rat basal ganglia: a stereological study using the cavalieri and optical disector methods. J. Comp. Neurol. 366 (4), 580–599. doi: 10.1002/(SICI)1096-9861(19960318)366:4<580::AID-CNE3>3.0.CO;2-0
Parent M., Parent A. (2005). Single-axon tracing and three-dimensional reconstruction of centre median-parafascicular thalamic neurons in primates. J. Comp. Neurol. 481 (1), 127–144. doi: 10.1002/cne.20348
Park I. S., Lee K. J., Han J. W., Lee N. J., Lee W. T., Park K. A., et al. (2011). Basketball training increases striatum volume. Hum. Mov Sci. 30 (1), 56–62. doi: 10.1016/j.humov.2010.09.001
Paxinos G., Watson C. (2007). The rat brain in stereotaxic coordinates. 6th edn (AmsterdamBoston: Academic Press/Elsevier).
Peter I. S., Davidson E. H. (2015). Genomic control process: Development and Evolution (London, UK ; San Diego, CA, USA: Academic Press is an imprint of Elsevier).
Peters A., Palay S. L., Webster Hd (1991). The fine structure of the nervous system (New York, Oxford: Oxford University Press).
Puelles L. (2001). Thoughts on the development, structure and evolution of the mammalian and avian telencephalic pallium. Philos. Trans. R Soc. Lond B Biol. Sci. 356 (1414), 1583–1598. doi: 10.1098/rstb.2001.0973
Puelles L. (2016). Comments on the limits and internal structure of the mammalian midbrain. Anatomy 10, 60–70. doi: 10.2399/ana.15.045
Puelles L. (2018). Developmental studies of avian brain organization. Int. J. Dev. Biol. 62 (1-2-3), 207–224. doi: 10.1387/ijdb.170279LP
Puelles L. (2021). Recollections on the origins and development of the prosomeric model. Front. Neuroanat 15. doi: 10.3389/fnana.2021.787913
Puelles L. (2022). Prosomeric classification of retinorecipient centers: a new causal scenario. Brain structure Funct. 227 (4), 1171–1193. doi: 10.1007/s00429-022-02461-6
Puelles L., Alonso A., Garcia-Calero E., Martinez-de-la-Torre M. (2019). Concentric ring topology of mammalian cortical sectors and relevance for patterning studies. J. Comp. Neurol. 527 (10), 1731–1752. doi: 10.1002/cne.24650
Puelles L., Amat J. A., Martinez-de-la-Torre M. (1987a). Segment-related, mosaic neurogenetic pattern in the forebrain and mesencephalon of early chick embryos: I. Topography AChE-positive neuroblasts up to stage HH18. J. Comp. Neurol. 266 (2), 247–268. doi: 10.1002/cne.902660210
Puelles L., Domenech-Ratto G., Martinez-de-la-Torre M. (1987b). Location of the rostral end of the longitudinal brain axis: review of an old topic in the light of marking experiments on the closing rostral neuropore. J. Morphol 194 (2), 163–171. doi: 10.1002/jmor.1051940205
Puelles L., Ferran J. L. (2012). Concept of neural genoarchitecture and its genomic fundament. Front. Neuroanat 6. doi: 10.3389/fnana.2012.00047
Puelles L., Harrison M., Paxinos G., Watson C. (2013). A developmental ontology for the mammalian brain based on the prosomeric model. Trends Neurosci. 36 (10), 570–578. doi: 10.1016/j.tins.2013.06.004
Puelles L., Martinez S., Martínez de la Torre M. (2008). Neuroanatomía (Madrid, Spain: Panamericana).
Puelles L., Medina L. (2002). Field homology as a way to reconcile genetic and developmental variability with adult homology. Brain Res. Bull. 57 (3-4), 243–255. doi: 10.1016/s0361-9230(01)00693-1
Puelles L., Morales-Delgado N., Merchan P., Castro-Robles B., Martinez-de-la-Torre M., Diaz C., et al. (2016). Radial and tangential migration of telencephalic somatostatin neurons originated from the mouse diagonal area. Brain structure Funct. 221 (6), 3027–3065. doi: 10.1007/s00429-015-1086-8
Puelles L., Rubenstein J. L. (1993). Expression patterns of homeobox and other putative regulatory genes in the embryonic mouse forebrain suggest a neuromeric organization. Trends Neurosci. 16 (11), 472–479. doi: 10.1016/0166-2236(93)90080-6
Puelles L., Rubenstein J. L. (2015). A new scenario of hypothalamic organization: rationale of new hypotheses introduced in the updated prosomeric model. Front. Neuroanat 9. doi: 10.3389/fnana.2015.00027
Puelles L., Verney C. (1998). Early neuromeric distribution of tyrosine-hydroxylase-immunoreactive neurons in human embryos. J. Comp. Neurol. 394 (3), 283–308. doi: 10.1002/(sici)1096-9861(19980511)394:3<283::aid-cne2>3.0.co;2-y
Rakic P. (1974). Neurons in rhesus monkey visual cortex: systematic relation between time of origin and eventual disposition. Science 183 (4123), 425–427. doi: 10.1126/science.183.4123.425
Ramón y Cajal S., DeFelipe J., Jones E. G. (1988). “Cajal on the cerebral cortex: An annotated translation of the complete writings,” in History of neuroscience, vol. 1. (New York: Oxford University Press).
Redies C., Ast M., Nakagawa S., Takeichi M., Martinez-de-la-Torre M., Puelles L. (2000). Morphologic fate of diencephalic prosomeres and their subdivisions revealed by mapping cadherin expression. J. Comp. Neurol. 421 (4), 481–514. doi: 10.1002/(sici)1096-9861(20000612)421:4<481::aid-cne3>3.0.co;2-h
Reillo I., Romero C. D., García-Cabezas M. A., Borrell V. (2011). A role for intermediate radial glia in the tangential expansion of the mammalian cerebral cortex. Cereb Cortex 21 (7), 1674–1694. doi: 10.1093/cercor/bhq238
Reinoso Suárez F. (1966). “Development of the human diencephalon,” in Evolution of the forebrain, Frankfurt/Main-Niederrad. Eds. Hassler R. G., Stephan H. (Stuttgart, Germany: George Thieme Verlag), 296–304.
Rendahl H. (1924). Embryologische und morphologische Studien über das Zwischenhirn beim Huhn. Acta Zool 5, 241–344. doi: 10.1111/j.1463-6395.1924.tb00169.x
Richardson M. K., Keuck G. (2022). The revolutionary developmental biology of Wilhelm His C.OMMAS.R.X.X.X. Biol. Rev. Camb Philos. Soc. 97 (3), 1131–1160. doi: 10.1111/brv.12834
Rubenstein J. L., Martinez S., Shimamura K., Puelles L. (1994). The embryonic vertebrate forebrain: the prosomeric model. Science 266 (5185), 578–580. doi: 10.1126/science.7939711
Sanides F. (1962). Architectonics of the human frontal lobe of the brain. With a demonstration of the principles of its formation as a reflection of phylogenetic differentiation of the cerebral cortex. Monogr. Gesamtgeb Neurol. Psychiatr. 98, 1–201.
Sanides F. (1970). “Functional architecture of motor and sensory cortices in primates in the light of a new concept of neocortex evolution,” in The Primate Brain: Advances in Primatology. Eds. Noback C. R., Montagna W. (New York: Appleton-Century-Crofts Educational Division/Meredith Corporation), 137–208.
Schmahmann J. D., Pandya D. N. (1997). Anatomic organization of the basilar pontine projections from prefrontal cortices in rhesus monkey. J. Neurosci. 17 (1), 438–458. doi: 10.1523/JNEUROSCI.17-01-00438.1997
Schmahmann J. D., Pandya D. N. (2008). Disconnection syndromes of basal ganglia, thalamus, and cerebrocerebellar systems. Cortex 44 (8), 1037–1066. doi: 10.1016/j.cortex.2008.04.004
Selemon L. D., Begovic A. (2020). Reduced midbrain dopamine neuron number in the adult non-human primate brain after fetal radiation exposure. Neuroscience 442, 193–201. doi: 10.1016/j.neuroscience.2020.07.005
Smeyne R. J., Breckenridge C. B., Beck M., Jiao Y., Butt M. T., Wolf J. C., et al. (2016). Assessment of the effects of MPTP and paraquat on dopaminergic neurons and microglia in the substantia nigra pars compacta of C57BL/6 mice. PloS One 11 (10), e0164094. doi: 10.1371/journal.pone.0164094
Spadory T., Duque A., Selemon L. D. (2022). Spatial-temporal topography in neurogenesis of the macaque thalamus. Brain structure Funct. 227 (5), 1673–1682. doi: 10.1007/s00429-022-02463-4
Striedter G. F., Charvet C. J. (2008). Developmental origins of species differences in telencephalon and tectum size: morphometric comparisons between a parakeet (Melopsittacus undulatus) and a quail (Colinus virgianus). J. Comp. Neurol. 507 (5), 1663–1675. doi: 10.1002/cne.21640
Striedter G. F., Charvet C. J. (2009). Telencephalon enlargement by the convergent evolution of expanded subventricular zones. Biol. Lett. 5 (1), 134–137. doi: 10.1098/rsbl.2008.0439
Sylvester J. B., Rich C. A., Loh Y. H., van Staaden M. J., Fraser G. J., Streelman J. T. (2010). Brain diversity evolves via differences in patterning. Proc. Natl. Acad. Sci. U.S.A. 107 (21), 9718–9723. doi: 10.1073/pnas.1000395107
Tai Y., Yi H., Ilinsky I. A., Kultas-Ilinsky K. (1995). Nucleus reticularis thalami connections with the mediodorsal thalamic nucleus: a light and electron microscopic study in the monkey. Brain Res. Bull. 38 (5), 475–488. doi: 10.1016/0361-9230(95)02018-M
Ten Donkelaar H. J., Lammens M. (2009). Development of the human cerebellum and its disorders. Clin. Perinatol 36 (3), 513–530. doi: 10.1016/j.clp.2009.06.001
Timbie C., García-Cabezas MÁ, Zikopoulos B., Barbas H. (2020). Organization of primate amygdalar-thalamic pathways for emotions. PloS Biol. 18 (2), e3000639. doi: 10.1371/journal.pbio.3000639
Tomas-Roca L., Corral-San-Miguel R., Aroca P., Puelles L., Marin F. (2016). Crypto-rhombomeres of the mouse medulla oblongata, defined by molecular and morphological features. Brain structure Funct. 221 (2), 815–838. doi: 10.1007/s00429-014-0938-y
Ulfig N., Setzer M., Bohl J. (2003). Ontogeny of the human amygdala. Ann. N Y Acad. Sci. 985, 22–33. doi: 10.1111/j.1749-6632.2003.tb07068.x
Verney C., Zecevic N., Puelles L. (2001). Structure of longitudinal brain zones that provide the origin for the substantia nigra and ventral tegmental area in human embryos, as revealed by cytoarchitecture and tyrosine hydroxylase, calretinin, calbindin, and GABA immunoreactions. J. Comp. Neurol. 429 (1), 22–44. doi: 10.1002/1096-9861(20000101)429:1<22::aid-cne3>3.0.co;2-x
Vidyadhara D. J., Yarreiphang H., Raju T. R., Alladi P. A. (2017). Admixing of MPTP-resistant and susceptible mice strains augments nigrostriatal neuronal correlates to resist MPTP-induced neurodegeneration. Mol. Neurobiol. 54 (8), 6148–6162. doi: 10.1007/s12035-016-0158-y
von Kupffer K. (1906). “Die morphogenie des zentralnervensystems,” in Handbuch der Vergleichenden und Experimentellen Entwicklungslehere der Wirbeltiere, vol. 2 . Ed. Hertwig O. (Jena, Germany: Gustav Fischer).
Wells A. M., García-Cabezas M. A., Barbas H. (2020). Topological atlas of the hypothalamus in adult rhesus monkey. Brain structure Funct. 225 (6), 1777–1803. doi: 10.1007/s00429-020-02093-8
Yeterian E. H., Pandya D. N. (1991). Prefrontostriatal connections in relation to cortical architectonic organization in rhesus monkeys. J. Comp. Neurol. 312 (1), 43–67. doi: 10.1002/cne.903120105
Yeterian E. H., Pandya D. N. (1993). Striatal connections of the parietal association cortices in rhesus monkeys. J. Comp. Neurol. 332 (2), 175–197. doi: 10.1002/cne.903320204
Yeterian E. H., Pandya D. N. (1995). Corticostriatal connections of extrastriate visual areas in rhesus monkeys. J. Comp. Neurol. 352 (3), 436–457. doi: 10.1002/cne.903520309
Yeterian E. H., Pandya D. N. (1998). Corticostriatal connections of the superior temporal region in rhesus monkeys. J. Comp. Neurol. 399 (3), 384–402. doi: 10.1002/(SICI)1096-9861(19980928)399:3<384::AID-CNE7>3.0.CO;2-X
Yin D., Valles F. E., Fiandaca M. S., Forsayeth J., Larson P., Starr P., et al. (2009). Striatal volume differences between non-human and human primates. J. Neurosci. Methods 176 (2), 200–205. doi: 10.1016/j.jneumeth.2008.08.027
Yopak K. E., Lisney T. J., Darlington R. B., Collin S. P., Montgomery J. C., Finlay B. L. (2010). A conserved pattern of brain scaling from sharks to primates. Proc. Natl. Acad. Sci. U.S.A. 107 (29), 12946–12951. doi: 10.1073/pnas.1002195107
Keywords: genoarchitecture, columnar model, field homology, fundamental morphological unit, histogenesis, morphogenesis, cerebral cortex, rhombic lip
Citation: Ruiz-Cabrera S, Pérez-Santos I, Zaldivar-Diez J and García-Cabezas MÁ (2023) Expansion modes of primate nervous system structures in the light of the Prosomeric Model. Front. Mamm. Sci. 2:1241573. doi: 10.3389/fmamm.2023.1241573
Received: 16 June 2023; Accepted: 03 October 2023;
Published: 08 November 2023.
Edited by:
Ruth Benavides-Piccione, Spanish National Research Council (CSIC), SpainReviewed by:
Muhammad A. Spocter, Des Moines University Osteopathic Medical Center, United StatesDavid M. Feliciano, Clemson University, United States
Copyright © 2023 Ruiz-Cabrera, Pérez-Santos, Zaldivar-Diez and García-Cabezas. This is an open-access article distributed under the terms of the Creative Commons Attribution License (CC BY). The use, distribution or reproduction in other forums is permitted, provided the original author(s) and the copyright owner(s) are credited and that the original publication in this journal is cited, in accordance with accepted academic practice. No use, distribution or reproduction is permitted which does not comply with these terms.
*Correspondence: Miguel Ángel García-Cabezas, Z2FyY2lhLmNhYmV6YXNAdWFtLmVz