 Astrid Bracher1,2*
 Heather A. Bouman3
 Robert J. W. Brewin4,5
 Annick Bricaud6,7
 Vanda Brotas8
 Aurea M. Ciotti9
 Lesley Clementson10
 Emmanuel Devred11
 Annalisa Di Cicco12Stephanie Dutkiewicz13
 Nick J. Hardman-Mountford14
 Anna E. Hickman15
 Martin Hieronymi16
 Takafumi Hirata17,18
 Svetlana N. Losa1
 Colleen B. Mouw19
 Emanuele Organelli4
 Dionysios E. Raitsos4
 Julia Uitz6,7
 Meike Vogt20Aleksandra Wolanin1,2,21
- 1Phytoooptics Group, Climate Sciences, Alfred-Wegener-Institute Helmholtz Centre for Polar and Marine Research, Bremerhaven, Germany
- 2Department of Physics and Electrical Engineering, Institute of Environmental Physics, University Bremen, Bremen, Germany
- 3Department of Earth Sciences, University of Oxford, Oxford, UK
- 4Remote Sensing Group, Plymouth Marine Laboratory, Plymouth, UK
- 5National Centre for Earth Observation, Plymouth Marine Laboratory, Plymouth, UK
- 6Sorbonne Universités, UPMC-Université Paris-VI, UMR 7093, LOV, Observatoire Océanologique, Villefranche/Mer, France
- 7Centre National de la Recherche Scientifique, UMR 7093, LOV, Observatoire Océanologique, Villefranche/Mer, France
- 8Faculdade de Ciencias da Universidade de Lisboa, MARE, Lisboa, Portugal
- 9CEBIMar, Universidade de São Paulo, São Paulo, Brazil
- 10CSIRO Oceans and Atmosphere, Hobart, TAS, Australia
- 11Department of Fisheries and Oceans, Bedford Institute of Oceanography, Dartmouth, NS, Canada
- 12Institute of Atmospheric Sciences and Climate, Italian National Research Council (CNR-ISAC), Rome, Italy
- 13Department of Earth, Atmospheric and Planetary Sciences, Massachusetts Institute of Technology, Cambridge, MA, USA
- 14CSIRO Oceans and Atmosphere, Perth, WA, Australia
- 15Ocean and Earth Science, National Oceanography Centre Southampton, University of Southampton, Southampton, UK
- 16Department of Remote Sensing, Institute of Coastal Research, Helmholtz-Zentrum Geesthacht, Geesthacht, Germany
- 17Faculty of Environmental Earth Science, Hokkaido University, Sapporo, Japan
- 18CREST, Japan Science and Technology Agency, Tokyo, Japan
- 19Graduate School of Oceanography, University of Rhode Island, Narragansett, RI, USA
- 20Department of Environmental Systems Science, Institute for Biogeochemistry and Pollutant Dynamics, ETH Zürich, Zürich, Switzerland
- 21GeoForschungsZentrum Potsdam, Potsdam, Germany
To improve our understanding of the role of phytoplankton for marine ecosystems and global biogeochemical cycles, information on the global distribution of major phytoplankton groups is essential. Although algorithms have been developed to assess phytoplankton diversity from space for over two decades, so far the application of these data sets has been limited. This scientific roadmap identifies user needs, summarizes the current state of the art, and pinpoints major gaps in long-term objectives to deliver space-derived phytoplankton diversity data that meets the user requirements. These major gaps in using ocean color to estimate phytoplankton community structure were identified as: (a) the mismatch between satellite, in situ and model data on phytoplankton composition, (b) the lack of quantitative uncertainty estimates provided with satellite data, (c) the spectral limitation of current sensors to enable the full exploitation of backscattered sunlight, and (d) the very limited applicability of satellite algorithms determining phytoplankton composition for regional, especially coastal or inland, waters. Recommendation for actions include but are not limited to: (i) an increased communication and round-robin exercises among and within the related expert groups, (ii) the launching of higher spectrally and spatially resolved sensors, (iii) the development of algorithms that exploit hyperspectral information, and of (iv) techniques to merge and synergistically use the various streams of continuous information on phytoplankton diversity from various satellite sensors' and in situ data to ensure long-term monitoring of phytoplankton composition.
User Needs for Phytoplankton Diversity from Space
Marine phytoplankton play an important role in the global carbon cycle via the biological carbon pump (e.g., IPCC, 2013) and contribute about 50% to the global primary production (Field et al., 1998). Over the past 30 years, ocean color remote sensing has revolutionized our understanding of marine ecosystems and biogeochemical processes by providing continuous global estimates of surface chlorophyll a concentration (chl-a, mg m−3), a proxy for phytoplankton biomass (e.g., McClain, 2009). However, chl-a alone does not provide a full description of the complex nature of phytoplankton community structure and function. Phytoplankton have different morphological (size and shape) and physiological characteristics (growth and mortality rates, nutrient uptake kinetics, temperature, and light requirements) as well as different biogeochemical and ecological functions (e.g., silicification, calcification, nitrogen fixation, aggregation and sinking rates, lipid production, energy transfer; e.g., Le Quéré et al., 2005). Phytoplankton community structure is thus important to many fundamental biogeochemical processes, including: nutrient uptake and cycling, energy transfer through the marine food web, deep-ocean carbon export, and gas exchange with the atmosphere. Phytoplankton community composition also has important consequences for fisheries (e.g., fish recruitment) and specific species (Harmful Algal Blooms, HABs; a list of all abbreviations is given in Table 1) can directly impact human health (e.g., Cullen et al., 1997).
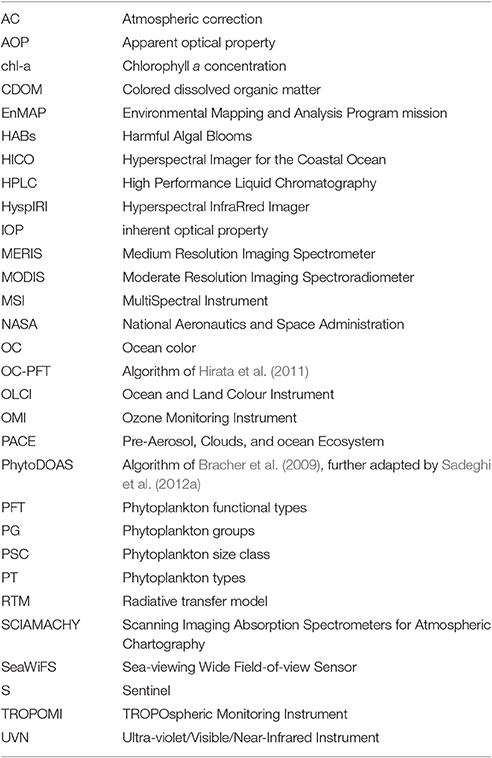
Table 1. Abbreviations and acronyms used throughout the text.
The ability to observe the spatial-temporal distribution (including phenology) and variability of different phytoplankton groups is a scientific priority for understanding the marine food web, and ultimately predicting the ocean's role in regulating climate and responding to climate change on various time scales. Thus, identifying the drivers of phytoplankton composition on global and regional scales is required to assess climate ecosystem interactions and to increase our understanding of the role of the ocean's biodiversity for marine ecosystem service provision. Coasts are especially vulnerable to major human threats caused by harmful algal blooms, eutrophication, hypoxia, and other processes deteriorating water quality. High resolution data on phytoplankton diversity is urgently needed for many socio-economic applications (e.g., fisheries, aquaculture, and coastal management, see IOCCG, 2009).
Some fishery models (e.g., Jennigs et al., 2008) already utilize information on phytoplankton biomass derived from ocean color satellites, however information on size and taxonomic composition from satellite is highly desirable to improve stock assessments (IOCCG, 2009). To better represent the variable biogeochemical state of the ocean, Earth System, and climate models (including those used in the IPCC assessments) have increasingly included a larger amount of biological complexity in their ocean biogeochemistry modules. To simplify the representation of the vast planktonic diversity, plankton have been grouped into plankton functional types according to their biogeochemical functions (e.g., Le Quéré et al., 2005). Biogeochemical models now commonly include 3–10 plankton functional types (e.g., Bopp et al., 2013; Laufkötter et al., 2015), with a few models including up to 100 or more types (Follows et al., 2007; Dutkiewicz et al., 2015; Masuda et al., 2017). Since in situ observations on plankton biogeography and abundance are scarce and many vast oceanic regions are too remote to be routinely monitored, biogeochemical modelers rely on surface ocean estimates of phytoplankton composition from satellite observations to evaluate model simulations and help to develop and validate their models. Increased biological realism in these models has been suggested as a mean to reduce the large uncertainty in future projections of net primary production, and carbon export (Bopp et al., 2013; Laufkötter et al., 2015). Information on global phytoplankton community composition from ocean color satellites is therefore highly desirable for Earth system model development and the quantification of key processes related to present and future global biogeochemical cycles. Particularly for the quantification of carbon fluxes in the world's ocean, high quality remote sensing data on phytoplankton community composition are a first priority (see science plan of the EXPORT project, Siegel et al., 2016).
Thus, continuous, global-scale, high-resolution satellite ocean color products that go beyond bulk chl-a and provide information on phytoplankton diversity is urgently needed to improve near-real time and forecasting models for marine services facilitating the above-mentioned applications. User requests for satellite data on phytoplankton diversity as an essential ocean/climate variable is providing impetus for its incorporation into international climate change initiatives and mission (capability) planning. In this article the current state of the art regarding algorithms, their validation and application is reviewed, then the gaps to meet user requirements are discussed, and finally detailed recommendations for future medium and long term actions are provided.
State of the Art
Diversity of phytoplankton, often represented by species richness and evenness, can be characterized in multiple dimensions (e.g., taxonomic, phylogenetic, morphological, or functional diversity, among others). This diversity is staggeringly large and even within a species there are often a large range of ecotypes with different environmental niches, life stages and/or morphological, and physiological characteristics (e.g., Bouman et al., 2006). For almost all purposes scientists tend to cluster species into groups specific to the purposes of their research. For instance, climate scientists and marine biogeochemists define phytoplankton functional types (PFT) based on their biogeochemical functions (e.g., diatoms as silicifying PFT). Based on satellite products, we here refer to any clustering of species (and ecotypes) as “Phytoplankton Groups” (PG). PG defined based on taxonomic criteria are referred to as phytoplankton types (PT), and PG defined based on their size range are referred to as phytoplankton size classes (PSC).
Satellite ocean-color remote sensing is unsurpassed in its ability to characterize the state of the surface ocean biosphere at high temporal and spatial scales. Beyond chl-a, increasing efforts have been invested internationally over the last two decades to develop ocean color algorithms to retrieve information on phytoplankton composition and size structure (see recent summary in IOCCG, 2014 and list of global approaches applied to satellite data in Table 2). These developments provide an opportunity to yield new operational satellite products. Ocean color algorithms to assess phytoplankton diversity make use of information originating from phytoplankton abundance, cell size, bio-optical properties (such as pigment composition, absorption, and backscattering characteristics) to differentiate PG (Table 2, Figure 1 left). The abundance based approaches of Uitz et al. (2006), Brewin et al. (2010), Brewin et al. (2015), and Hirata et al. (2011) use satellite chl-a as input to derive PSC or PT based on empirical relationships linking in situ marker pigments to chl-a which are determined using high precision liquid chromatography (HPLC). Abundance-based approaches use satellite chl-a as input and by that exploit the largest signal in water leaving radiance to extract variability due to PG out of chl-a. This is then a simple calculation and can be applied easily to chl-a products from different sensors. However, they cannot predict atypical associations and may not hold in a future ocean.
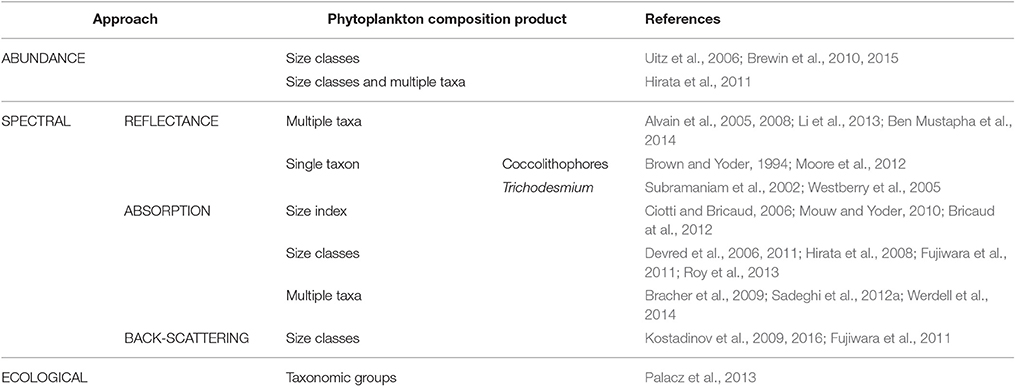
Table 2. A compilation of global algorithms to retrieve phytoplankton composition from satellite data.
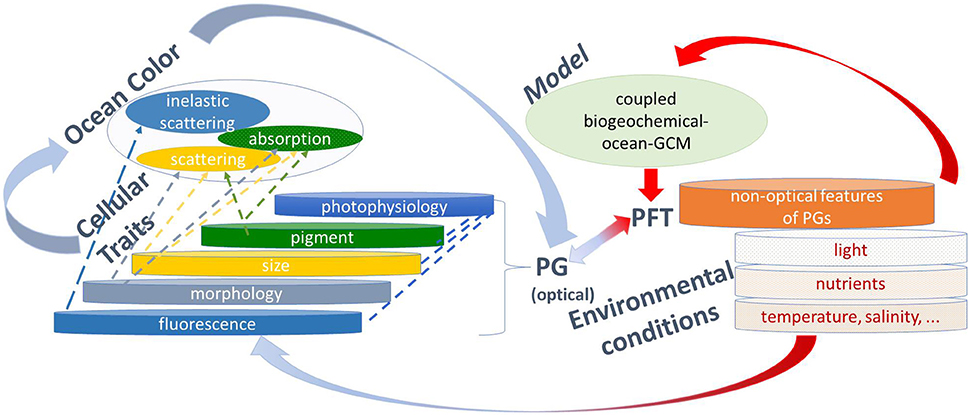
Figure 1. Illustration of phytoplankton diversity as found in nature impacted by environmental conditions, and how it can be derived from observations and modeling. Through in situ measurements (which represent the most real conditions), phytoplankton are grouped according to cellular traits that influence their optical properties such as pigments, size, morphology, and fluorescence, all also responding to photophysiology, which are named optical features of phytoplankton groups (PG). In addition, inferences can be made about PG through non-optical features, such as nutrient requirements, stoichiometry, etc. The optical properties can be measured by ocean color and used to infer PG from remote sensing (highlighted by blue arrows). Coupled biogeochemical-ocean general circulation models (GCM) produce projections of phytoplankton functional types (PFT) which are, with PG classified according to functions, mainly incorporating non-optical and rarely optical properties (highlighted by red arrows). PG information from ocean color and ecosystem models can be combined (highlighted by blue-red arrows) to improve our knowledge. For instance, ocean-color PG can be used for model improvements and evaluation, and models could be re-developed to explicitly include optical properties of which the ocean-color PG use which will help to advance the application of ocean color PG.
Another class of algorithms relies on spectral features in reflectance, absorption, and/or backscattering spectra caused by the variation in phytoplankton structure and pigment composition (Brown and Yoder, 1994; Subramaniam et al., 2002; Alvain et al., 2005, 2008; Westberry et al., 2005; Ciotti and Bricaud, 2006; Devred et al., 2006, 2011; Hirata et al., 2008; Bracher et al., 2009; Kostadinov et al., 2009, 2016; Mouw and Yoder, 2010; Fujiwara et al., 2011; Bricaud et al., 2012; Moore et al., 2012; Sadeghi et al., 2012a; Li et al., 2013; Roy et al., 2013; Ben Mustapha et al., 2014; Werdell et al., 2014). Spectral-based approaches exploit as much of the backscattered spectrum observed by satellite as necessary to extract the signatures of specific PG to ocean color. Generally, these methods are computationally much more expensive and require specific adaptations for each sensor. However, these algorithms rely on much less empirical relationships than the abundance based approaches and are based on physical principles (radiative transfer). Differences exist on the different satellite inputs (e.g., radiance, absorption, backscattering) and the underlying principles (for a comprehensive overview Mouw et al., 2017). Another approach incorporates various environmental parameters to predict PT based on their ecological preferences (Raitsos et al., 2008; Palacz et al., 2013). This method uses artificial neural networks to link the different biological and physical data sets. While the approach of Raitsos et al. (2008) was regionally developed for the North-Atlantic, the approach by Palacz et al. (2013) is not purely based on remote sensing data but also requires a coupling to a dynamic plankton model.
Products obtained from the PG algorithms (Table 2) are typically dominance (Brown and Yoder, 1994; Alvain et al., 2005; Moore et al., 2012; Ben Mustapha et al., 2014), presence or absence of a certain PT (Westberry et al., 2005; Werdell et al., 2014), fraction or concentration of chl-a of the three PSC (Devred et al., 2006, 2011; Uitz et al., 2006; Hirata et al., 2008, 2011; Kostadinov et al., 2009, 2016; Brewin et al., 2010, 2015; Fujiwara et al., 2011; Li et al., 2013; Roy et al., 2013) or a size factor characterizing the contribution of pico- (or micro-) phytoplankton to the phytoplankton community (Ciotti and Bricaud, 2006; Mouw and Yoder, 2010; Bricaud et al., 2012). Currently, only the products OC-PFT (Hirata et al., 2011) and PhytoDOAS (Bracher et al., 2009; Sadeghi et al., 2012a) enable the simultaneous determination of chl-a for several PT. PhytoDOAS retrieves the imprints of absorption characteristics of specific phytoplankton groups among all other atmospheric and oceanic absorbers from top of atmosphere data of the hyperspectral satellite sensor SCIAMACHY (Scanning Imaging Absorption Spectrometers for Atmospheric Chartography). All other satellite-based PG algorithms (Table 2) have been applied to water-leaving reflectance data from multispectral sensors [e.g., SeaWiFS (Sea-viewing Wide Field-of-view Sensor), MERIS (Medium Resolution Imaging Spectrometer), MODIS (Moderate Resolution Imaging Spectroradiometer)].
To be able to detect unexpected changes in phytoplankton community composition, satellite PG data based on exploiting the spectral signatures, and based on limited empirical assumptions are preferred. In the few last years, radiative transfer models (RTM) have been used to develop and assess the sensitivity of analytical (spectral) PG retrievals or to find suitable spectral characteristics necessary for ocean color sensors to retrieve PG. Werdell et al. (2014) and Wolanin et al. (2016) used the GIOP (Generalized Inherent Optical Property) model software (Werdell et al., 2013) to invert reflectance spectra (either water-leaving or top of atmosphere), and Wolanin et al. (2015) used the coupled ocean-atmosphere RTM SCIATRAN (Rozanov et al., 2014) to test the sensitivity of a PT retrieval (PhytoDOAS). Evers-King et al. (2014) and Xi et al. (2015) used the ocean RTM HydroLight (Sequoia Scientific.) to specifically model the variation of composition of PSC or certain (dominant) PT, respectively, and assessed the potential of retrievals in different water types. Werdell et al. (2014) optimized the inversion scheme of GIOP to finally retrieve absence or presence of Noctiluca miliaris from MODIS data, while Wolanin et al. (2016) used this method to identify optimal band placements for multi- and hyper-spectral satellite data for successful retrievals of certain PT. The results of this study indicate that four additional bands (381, 473, 532, and 594 nm) for the Ocean and Land Colour Instrument (OLCI) would potentially enable absorption-based quantitative retrievals of diatoms, cyanobacteria, and coccolithophores. Recent methods have been developed to retrieve PG from in situ hyperspectral algal or particulate absorption coefficients, and validated using in situ measurements (Moisan et al., 2013; Organelli et al., 2013; Zhang et al., 2015). As absorption coefficients can be estimated from satellite measurements using inverse bio-optical models, this opens the way to applications of these methods to satellite data.
Some PG algorithms (most of the ones listed in Table 2) have been inter-compared at the global scale: firstly using in situ PSC (derived from HPLC pigments) in terms of dominance (Brewin et al., 2011) and secondly, under the 2nd Satellite PFT Algorithm International Intercomparison Project: http://pft.ees.hokudai.ac.jp/satellite/index.shtml. The initiative strengthens the links between algorithm developers at a global scale which will help also to guide modelers and policy makers on the specific assumptions underlying each product: the inter-comparison among most algorithms presented in Table 2 and to an ensemble mean of Earth System Models is presented in Kostadinov et al. (2017). A user guide for application to open ocean waters on the most common algorithms (Mouw et al., 2017) explains the current global PG algorithms and their associated uncertainties and also includes a discussion on the advantages and disadvantages of these algorithms. A global in situ dataset of HPLC and optical properties is being developed to further evaluate these algorithms. This initiative organized and held breakout sessions at the International Ocean Color Symposia (IOCS) in 2013 and 2015 and at a specific expert International Ocean-Colour Coordinating Group (IOCCG) and National Aeronautics and Space Administration (NASA)-sponsored workshop in 2014, which focused on PG algorithms development, validation, and user needs. For each meeting the outcome resulted in a written summary of recommendation for community actions and the planning of future activities (see IOCS, 2013; Bracher et al., 2015a; IOCS, 2015) which also form the baseline for Section Recommendations toward Operational Products of Phytoplankton Diversity from Space.
To date, the majority of existing PG satellite retrieval approaches have relied on HPLC pigment data to derive in situ PG data: for developing and validating algorithms large in situ PT (e.g., Alvain et al., 2005; Hirata et al., 2011; Soppa et al., 2014; Swan et al., 2016) and PSC (e.g., Uitz et al., 2006; Brewin et al., 2010) data sets have been complied, complemented by the global pigment data set compiled under the MAREDAT project (Peloquin et al., 2013) and recent submissions to public data bases: e.g., SEABASS (http://seabass.gsfc.nasa.gov/), BODC (http://www.bodc.ac.uk), LTER Network Data Portal (https://portal.lternet.edu/nis/home.jsp), PANGAEA Data Publisher for Earth & Environmental Science (https://www.pangaea.de). Among all available in situ PG data sets, HPLC-phytoplankton pigment data contain the largest number of observations resulting in the greatest spatial coverage with standardized quality control protocols (Hooker et al., 2012). However, size fractionated in situ data of chl-a serve as a more direct validation data set for assessing satellite retrievals on PSC (e.g., Brewin et al., 2014). The long-term and spatially extended Continuous Plankton Recorder (CPR) data sets have been used for constructing and evaluating ecological algorithms focusing on larger phytoplankton (Raitsos et al., 2008). The CPRs, especially with the recent global data effort (Global Alliance of CPR Surveys, http://www.globalcpr.org/), may provide a unique platform on taxonomic information to modern satellite sensors for several oceanic regions around the globe. Inline (coupled) flow cytometry and microscopy techniques have been developed and enable a more precise classification of the phytoplankton groupings than HPLC marker pigments (e.g., Sosik and Olson, 2007). In addition, phytoplankton group specific Inherent Optical Properties (IOPs, i.e., absorption and backscattering) determined in the field have been used as algorithm inputs for several spectral approaches (Ciotti and Bricaud, 2006; Bracher et al., 2009; Mouw and Yoder, 2010; Fujiwara et al., 2011; Sadeghi et al., 2012a). Hyperspectral IOP measurements when obtained via continuous measurements (e.g., Boss et al., 2013) can help validating satellite-derived PG by increasing the number of match-ups, assessing variability within a satellite pixel, and quantifying the uncertainties in the two-step satellite methods (i.e., from water-leaving reflectance to IOP to PG).
Satellite PG time series data have already been used to assess regionally and globally the variability and trend of phytoplankton community composition (e.g., Brewin et al., 2012; Sadeghi et al., 2012b) and PG phenology (Alvain et al., 2013; Soppa et al., 2016a) also linking to environmental variables. In addition, satellite PG data were used to assess globally particulate organic carbon export (Mouw et al., 2016), for detection of regional HAB events (e.g., Kurekin et al., 2014), the estimation of recruitment of juvenile fish (Trzcinski et al., 2013) and for inferring globally oceanic emissions of volatile organic compounds (Arnold et al., 2009; Booge et al., 2016).
All ocean color data are limited in coverage to sun-light, cloud and ice-free conditions, and only deliver information on the surface ocean (first optical depth which is 4.6 times shallower than the euphotic depth). Therefore, for many applications, additional methods have to be used to resolve variability and trends of phytoplankton community structure and abundance. Satellite-derived algorithms are increasingly compared not only to in situ data but to global model output from Earth System Models. Starting over two decades ago, biogeochemical models began incorporating multiple PT (e.g., Baretta et al., 1995; Le Quéré et al., 2005; Gregg and Casey, 2007) mainly to incorporate their biogeochemical relevance. As a first step models incorporated a “diatom” group given their importance in the silica cycle, but also given their potential important role in carbon export compared to other PT (e.g., Chai et al., 2002). As models became more sophisticated and started to simulate nitrogen biogeochemistry, many added a “diazotroph” class. Given the biogeochemical importance of these groups of phytoplankton, the modeling community refers to them as PFT (see Figure 1 right). This classification is the closest to ocean color PT products as defined above. Though less common, models can also group phytoplankton in terms of size: the model of Ward et al. (2012) includes 25 size classes of phytoplankton. The advantage of such an approach is that it can use empirical allometric relationships of key growth parameters (e.g., maximum growth rates). Such a model output is more compatible with ocean color PSC products.
Since 2009, marine ecosystem modelers collaborate systematically with the remote sensing community in the MARine Ecosystem Model Intercomparison Project (MAREMIP). MAREMIP fosters the development of models based on PFT. Complementary to the Coupled Model Intercomparison Project Phase 5 and Phase 6 efforts (see http://cmip-pcmdi.llnl.gov/), MAREMP thus specifically targets the inter-comparison of the representation of current and future marine biology in global ocean models, and promotes the interactions between modelers and observationalists and the development of targeted observations. MAREMIP, as well as many single model studies conducted by marine ecosystem modelers worldwide (e.g., Ye et al., 2012; Dutkiewicz et al., 2015), have been using satellite-derived PT products for the evaluation of model performance in terms of plankton biogeography and global biogeochemical cycling (e.g., Hashioka et al., 2013; Vogt et al., 2013; Laufkötter et al., 2015). Initial studies have shown that models and satellite estimates of phytoplankton biogeography diverge, for example (a) in the timing of the phytoplankton bloom (Hashioka et al., 2013), (b) in phytoplankton dominance patterns and the global contribution of diatoms to total phytoplankton biomass (Vogt et al., 2013), and (c) in net primary production (Laufkötter et al., 2015).
Gap Analysis
Current satellite data sets on phytoplankton composition (PG) are not generally available in a format readily adoptable by a wide user community. Some potential users (e.g., fishery managers) still use chl-a rather than satellite PG data, in part due to a lack of confidence in the PG products, and climate modelers use only a limited fraction of the currently existing products, due to the lack of uncertainty estimates associated with each product, and issues related to the compatibility between model and satellite output. In the following section, we detail the gaps, which need to be addressed if we want to respond to user needs and promote the use of a wider range of new remote sensing products (see summary in Table 3, left columns).
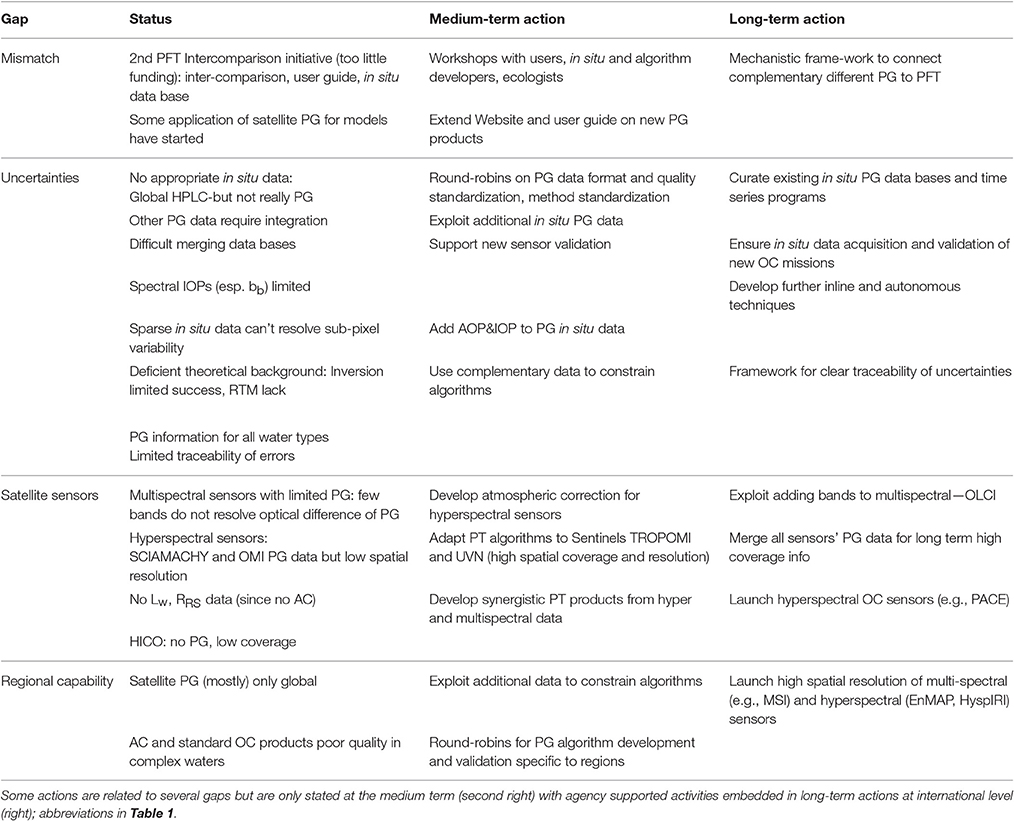
Table 3. Summary of gap analysis for phytoplankton composition from space: gap (left), status of existing work (second left), and recommendations for actions (right columns).
Gap 1: Information Mismatch between Satellite-Derived Phytoplankton Composition Products and User Group Target Variables
At present, there is a mismatch between the PG detected from satellite (and which differ between algorithms) and the groupings required by the user community. Figure 1 illustrates PFT as they may be found in the environment, and which respond to environmental conditions based on the interplay of different variables (nutrients, temperature, salinity, light, and others). Optical (size, morphology, pigmentation, fluorescence) and non-optical (e.g., nutrient requirements, stoichiometry) properties of phytoplankton allow for distinctive groupings. The optical properties include photo-physiological responses which are driven by photoadaptation associated with certain PG, and photacclimation which is mostly independent of PG. From ocean color (Figure 1 top-level left) absorption, scattering, and fluorescence properties of different PG can be derived. Coupled biogeochemical ocean models (Figure 1 top-level right) often use groupings in terms functional groups (e.g., calcifiers, nitrogen fixers, etc.) which necessarily do not link to the optically based PG which are for example, either picophytoplankton (PSC algorithms), prokaryotic phytoplankton (e.g., Bracher et al., 2009), Synechococcus like cyanobacteria (e.g., Alvain et al., 2005), prochlorophytes (e.g., Hirata et al., 2011) or Trichodesmium only (e.g., Westberry et al., 2005) and not just nitrogen fixers. This highlights the need to enhance linkages between optical and functional PG to improve our knowledge. The algorithms listed above also provide results in different units (e.g., size factor, fraction of total chl-a, chl-a, dominance or just presence of a PG), which do not always match with users requirements (e.g., a numerical model might require carbon biomass). There are also substantial differences in the PG definitions among the users themselves (see IOCCG, 2014). While biogeochemical and RT models require a quantitative assessment of PT or PSC, end users for coastal environmental management need PG products as indicators for water quality, HAB presence, eutrophication and fisheries stock assessment. To help users selecting the appropriate PG data sets, the work already accomplished by inter-comparing (Kostadinov et al., 2017) and by setting up a user guide (Mouw et al., 2017) on global satellite PG needs to be extended to new algorithms and more explicit recommendations on which algorithm is best suited for specific users and science questions. The later can only be done when the uncertainties of these algorithms have been evaluated more consistently (see Gap 2). Improvements are also needed in terms of the representation of PG in the current generation of models to better constrain present and future projections of marine biogeochemistry. Furthermore, as the community is moving toward biogeochemical models of increased complexity, information on phytoplankton community composition from space including all PT, or other indices of biodiversity (pigments, size) will provide valuable resources for the next generation modelers. Thus, there is a need for on-going product development along with effective communication between remote-sensing scientists, biological oceanographers, and modelers to ensure future developments are consistent and comparable between parties and that ultimately improve climate predictions.
Gap 2: Lack of Traceability of Uncertainties in PG Algorithms
The quantitative assessment of uncertainty in PG satellite products is still insufficient. This is due to the above mentioned mismatch definition (see Gap 1), the limited theoretical background to connect optical signatures to diversity of phytoplankton communities across different environments and limitations in appropriate in-situ data.
At the cellular level, a detailed understanding of how pigment packaging (function of cell size and intracellular pigment concentration; Morel and Bricaud, 1981) and pigment composition that both govern the shape and magnitude of chl-a specific absorption (especially in the blue-green regions of the spectrum, which is commonly used in PG algorithms) requires further work. Both reconstruction (Bidigare et al., 1990) and decomposition (Hoepffner and Sathyendranath, 1993) methods are often applied separately to bio-optical datasets to explore the link between pigments and phytoplankton absorption. Reconstruction approaches conventionally apply a single pigment-specific absorption coefficient to a particular pigment or pigment type (e.g., photosynthetic and photoprotective carotenoids), often obtained from measurements of extracted pigments in solvent. Only a handful of studies have examined the absorptive properties of pigment-protein complexes (e.g., Johnsen and Sakshaug, 2007), yet differences in the spectral shape once pigments are embedded in proteins can be significant. Improved models on phytoplankton photoacclimation combined with new approaches in determining cell size should assist in improving our understanding of how pigment packaging influences the spectral signature of natural phytoplankton assemblages. Efforts inverting hyperspectral reflectance and absorption spectra to obtain PG have shown limited success, leading to identification of certain PT with no quantification (Werdell et al., 2014; Kudela et al, 2015; Xi et al., 2015) of PSC fractions (Organelli et al., 2013) or quantification of accessory pigments in addition to chl-a (Chase et al., 2013; Moisan et al., 2013; Bracher et al., 2015b). PT specific absorption properties are available but large spectral variability is related to algal culturing and variations in size, pigment composition and pigment packaging due to physiological responses of PT. In contrast, due to high measuring uncertainties spectral scattering properties (including back-scattering and volume scattering function) are still less known (Tan et al., 2015; Harmel et al., 2016). Thus, PG related specific IOPs are not adequately represented in RTMs. This further limits tracing uncertainty in algorithms, pointing to the need for coincident IOP observations along with expended in situ datasets of phytoplankton composition.
Other errors in algorithms are also difficult to assess, for instance the accuracy of in situ data used as input or for validation of algorithms due to mostly non-standardized acquisition (see details below), the above mentioned mismatch definition (see Gap 1), and the spatial and temporal upscaling of specific PT and PSC signatures of diverse communities. Several studies have demonstrated that adding spectrally-resolved optics to biogeochemical models improves model skill (e.g., Dutkiewicz et al., 2015) as well as comparability to observed optical properties (e.g., Fujii et al., 2007; Baird et al., 2016). A minority of global numerical models resolve the bio-optical properties of different PG (Gregg and Casey, 2007; Dutkiewicz et al., 2015; Baird et al., 2016). These advancements may provide a way forward to investigate the biological realism of phytoplankton biogeography using a larger range of satellite PG products.
In addition, the reliance on HPLC for development and validation presents challenges to quantitatively assess the uncertainty of PG satellite products. However, inputs to HPLC PG datasets are (diagnostic) accessory pigment concentrations, which are only to a certain degree congruent with taxonomy or phytoplankton size. Size can vary considerably within certain functional or taxonomic groups, e.g., diatoms can range from 3 to 500 μm but are characterized by the same diagnostic pigment (fucoxanthin) across this size range. Similarly, grouping by accessory pigments can be problematic as there is substantial variability in pigment concentration as a function of physiological response to the environmental conditions and more importantly a given biomarker pigment is present in several PT (e.g., fucoxanthin in diatoms and haptophytes). Some PT, e.g., coccolithophores, cannot be inferred from HPLC pigments. In consideration of the expanding satellite sensor capabilities, there is a need for coordinated efforts to compile and generate comprehensive in situ datasets (not just HPLC) for assessing phytoplankton composition. There is also a need to provide best practice guidance to merge the different types of datasets (e.g., HPLC, microscopy, flow cytometry) into an integrated product that encompasses different ways of grouping phytoplankton species.
Gap 3: Missing Capabilities of Current Ocean Color Satellite Measurements
Differences among PT in their spectral absorption are small: many PT contain, despite specific marker pigments, the same suites of pigments or pigments of similar absorptive properties (note that besides the pigment absorption properties, spectral absorption is also ruled by the algal community size structure). Given the limited number of wavebands and the broad band resolution of current multi-spectral sensors can provide only limited information on the variability in phytoplankton spectral absorption caused by shifts in community structure (Bricaud et al., 2004; Organelli et al., 2011). This restricts all multispectral satellite phytoplankton composition products based on spectral principles to either indicating dominance, presence of PT or identifying major size class fractions within the total phytoplankton community to a high level of uncertainty.
Satellite instruments, with a very high spectral resolution (1 nm and better, originally designed for atmospheric applications), provide additional opportunities for distinguishing multiple PT based on their optical properties. The capability to retrieve quantitatively major PT groups based on their optical signature has been clearly shown with the PhytoDOAS method (Bracher et al., 2009; Sadeghi et al., 2012a) in the open ocean using hyperspectral satellite data from the atmospheric sensor SCIAMACHY. However, the exploitation of hyperspectral satellite data for ocean color has been so far very limited because hyperspectral sensors like SCIAMACHY (spectral resolution <0.5 nm) do not provide operational water-leaving radiance products and have very large foot-prints (30 by 60 km per pixel) and low global coverage (6 days). This provides a major constraint on assessing the retrieval's accuracy with in situ point measurements. It also limits the application of such PT satellite data sets. The difficulty of working with SCIAMACHY data is that one has to handle strong atmospheric absorbers (true for all hyperspectral satellite data) and the heterogeneity of big pixels; hence, the PhytoDOAS algorithm was designed to retrieve three PT directly from top of atmosphere radiances, by separating their high frequency absorptions from each other and relevant atmospheric absorbers, while accounting for broad band effects by using a low order polynomial. This method requires high spectral resolution (<1 nm). SCIAMACHY data acquisition ended with the lost contact to the ENVISAT satellite (April 2012). First results from adapting PhytoDOAS to the Ozone Monitoring Instrument (OMI) sensor (measuring since 2004) are very promising (Oelker et al., 2016) and will enable the extension of the spectrally derived PT data into the future with much improved global coverage (daily) and smaller foot print (13 × 24 km). OMI is also the precursor instrument to the in 2017 launched Sentinel-5-Precursor (S-5-P) with TROPOspheric Monitoring Instrument (TROPOMI) and in the 2020s launched Ultra-violet/Visible/Near-Infrared Instrument (UVN) instruments on Sentinel-4 and Sentinel-5 (all with a pixel size of 3.5 × 7 km).
The Hyperspectral Imager for the Coastal Ocean (HICO) provided data with high spatial (100 m) and spectral (~6 nm) resolution and limited coverage (only a restricted number of scenes globally). However, so far lack of robust atmospheric correction for HICO (see current implementation in http://seadas.gsfc.nasa.gov/) has prevented the exploitation of the full spectrum. Eventually, not much more than standard phytoplankton information (chlorophyll, fluorescence line height) as for multispectral data was derived (Ryan et al., 2014). It is a big challenge to provide spectrally consistent high quality atmospheric correction for PG retrievals.
The new ocean-color sensor OLCI on Sentinel-3 already provides two more bands in the visible range than its predecessor MERIS. It is anticipated that the number of bands will further increase for future multispectral ocean-color sensors. In addition, hyperspectral missions like Pre-Aerosol, Clouds, and ocean Ecosystem (PACE; global, high coverage, 1 km pixels, launch 2022) and Environmental Mapping and Analysis Program mission (EnMAP; regional, low coverage, 30 m pixels, launch 2019) are planned for operating in the near future. However, hyperspectral instruments like ENMAP or PACE with 5 nm resolution are still very different from atmospheric instruments like SCIAMACHY. Hence, algorithms will have to be developed (or adapted) to retrieve the PT from these new instruments.
To monitor marine ecosystem and assess their vulnerability to future anthropogenic and climate change, beyond a good spatial-temporal resolution of existing data long-term time series data are needed to monitor trends in phytoplankton community structure, and its variability on inter-annual to decadal time scales. The average cloud-free repeat time per pixel for an ocean color sensor is only 100 observations per year for the temperate and tropical zones (Werdell et al., 2007), while it is much lower for high latitudes (e.g., 12 per year for the East Greenland Sea, Cherkasheva et al., 2014). Yet, merged ocean-color products significantly increase this temporal coverage (Maritorena et al., 2010; Racault et al., 2015). The development of long time series of PG satellite products, covering more than a decade, has just started (e.g., references given in Mouw et al., 2017). Such data sets are necessary to respond to user needs. Efforts have been taken to apply the multispectral PG algorithms not only to SeaWiFS but also to MODIS and MERIS. Synergistic use of multiple sensors will enable creating long-term time series moving from monthly to daily resolution, but also provides an opportunity to improve performance of individual retrievals. The ESA project SynSenPFT is an example for that where an algorithm was developed by synergistically using PT information from SCIAMACHY-PhytoDOAS and Ocean Color Climate Change Initiative chl-a-OC-PFT retrievals. This was done to obtain high spatially and temporally resolved PT chl data using their spectral imprints retrieved from high spectrally resolved satellite data and a global PT data set was developed, from 2002 to 2012 on 4 by 4 km daily resolution (Soppa et al., 2016b).
Gap 4: Lack of Regional Capability of PG Algorithms
Thus far, most PG algorithms work globally or some of them have been validated on restricted regions, but nearly all are limited to open ocean conditions. A spatial pattern matching between modeled- and satellite PG showed a relatively large discrepancy on smaller spatial scales than larger scales, especially around continental shelves (Hirata et al., 2013). However, PG satellite products retrieved are necessary especially for coastal areas and inland waters where water quality and HABs issues are most urgent. In these optically complex waters, optical constituents vary independently making ocean color retrievals challenging. In extremely high colored dissolved organic matter (CDOM) and low scattering waters, CDOM absorption dominates the whole visible spectrum resulting in very low water-leaving reflectance (<1%) and thus, the phytoplankton signal itself is weak. By contrast, the main problems in highly scattering waters are the masking of pigment absorption by non-algal (mineral) particle absorption and significant near infrared water reflectance (IOCCG, 2000). Successful results in these types of water are hampered by limited spatial and spectral resolution of sensors. This already makes it difficult to achieve accurate atmospheric correction and obtain reliable ocean color standard products. It also inhibits the observation of the patchy distribution of phytoplankton communities. To derive certain PT beyond size- and/or pigment-based discrimination of phytoplankton requires developing empirical methods that rely on covariation: Via the exploitation of additional data (light, temperature, nutrients, …), retrievals and optical modeling for specific regions could be further constrained (and optimized), as for example in the study by Brewin et al. (2015) where information on ambient light field extracted from satellite information was combined with an abundance based PSC approach.
Recommendations Toward Operational Products of Phytoplankton Diversity from Space
In the following we give recommendations how to fill the gaps identified in the previous chapter. Table 3 summarizes the mid- and long-term actions that are detailed below. Note, that several actions will address several gaps simultaneously. We recommend that the implementation of these actions is done in communication and collaboration between ocean color scientists, observationalists, numerical modelers, and other users. This will ensure that products are aligned to new in situ and satellite observational techniques and fulfill the ever changing needs of the wide range of user communities.
Improving Match between Satellite PG and Users' Needs
A mechanistic framework needs to be developed which draws the complementary use of the various PG data and links them to PFT (Figure 1). This will assure that users are aware of the actual specific groups in the different satellite products and how they compare to the groups they require in their specific application. Such a framework requires an international effort and funding, including experts in in situ measurements (HPLC, microscopy, flow cytometry, genetics, bio-optics), algorithm developers and representatives of the user communities (modeling, marine services). Certain medium-term actions should be taken:
– Regular workshops to improve communications between users (biogeochemical-, ecosystem-, RT-modelers, taxonomists, ecologists, fishery managers, HAB, and water quality experts) and algorithm developers should be held to achieve a common understanding and a consistent and comprehensive definition of the “groups” in PG algorithms, but also of their metrics [% vs. chl-a (or carbon) vs. dominance]. This could potentially lead in joint future proposals.
– A website informing on PG algorithms activities and development (user guide, algorithm inter-comparison and validation protocols, forum, …) should be sustained.
– A “living” user guide (regularly updated) should describe available PG and PSC algorithms and satellite products including their definition, uncertainty, strengths, and limitations.
Curation and Acquisition of In situ Data for Improving and Assessing PG Retrievals
Within international cooperation of space agencies the curation of existing measurements of in situ PG abundance (HPLC, microscopy, flow cytometry, particle imaging, genomics, …) and corresponding optical [IOPs, apparent optical properties (AOPs)] data needs to be secured:
– Specific comprehensive datasets should be selected that include coincident IOPs, AOPs, and phytoplankton composition that serve as a resource for PG algorithm development, refinement, and validation, and improve the ability to inter-compare validation metrics.
– Standardized data quality, nomenclature, and format among different data bases (e.g., SEABASS, LTER, PANGAEA, BODC, …) should be assured to enable easy compilation and expansion.
– Pigment databases used for testing, validating and refining PT algorithms should be archived along with complete information on all detected pigments to allow rigorous inter-comparison studies and sensitivity analysis.
– Methods to convert from in situ data to PG biomass or fractions should be assessed and protocols for merging different datasets (e.g., HPLC, microscopy, …) should be formulated.
– Existing time series sites of phytoplankton composition collected at fixed sites, covering a range of oceanic regimes, including the coastal ocean should be utilized to inter-compare algorithms and to assess their uncertainties considering seasonal and multiannual effects.
– In situ measurements need to be calibrated and standardized to advance the knowledge of phytoplankton composition in situ with defined uncertainties.
– Existing relevant (hyperspectral and/or PG related) IOP data from laboratory studies need to be curated, so they can be used as algorithm input and to develop the necessary theoretical background.
– Agency directed programs need to sustain the in situ data acquisition in order to secure assessment of accuracy of PG and related (e.g., atmospheric correction, CDOM, total suspended matter) satellite products. The following is recommended:
– The protocols of data acquisition need to be standardized by internationally run round-robin exercises and calibrations. Currently, various NASA WGs are updating the ocean optics protocols (Mueller et al., 2003), specifically for HPLC pigments and IOPs which should be supported also by other agencies.
– Methodological errors associated with different approaches of measuring phytoplankton absorption (filter pad method and methods measuring directly a water sample) need to be identified and quantified. This also includes the inter-comparison of in situ and bench top techniques over a range of environmental settings (optically complex to oligotrophic open ocean). For that, universal protocols for data collection and processing need to be established.
– Methodological errors associated with different approaches of measuring phytoplankton absorption (filter pad method and methods measuring directly a water sample) need to be identified and quantified which also include the inter-comparison of in situ and benchtop techniques over a range of environmental settings (optically complex to oligotrophic open ocean). For that universal protocols for data collection and processing need to be established, such as those currently prepared by NASA.
– Differences in various particle imaging and identification technologies (e.g., holography, flow cytometry, flow cam, etc.) need to be assessed.
– Following the launch of new ocean color sensors (particularly now OLCI on S-3), there is a need for validation activities to be funded across all AOPs and IOPs to PG products.
– Additional phytoplankton composition observational capability needs to be added to existing time series sites.
– Target locations for future field sampling (informed by existing products), uncertainty assessments, and potentially supported by modeling need to be identified.
– New technologies for in-line and autonomous measurements should be supported via the use of robotic platforms (e.g., profiling floats, autonomous surface water vehicles) to increase the spatial and vertical coverage of measurements. The development of new miniature sensors that can be deployed on these platforms to provide accurate measurement of phytoplankton community and carbon (e.g., miniature imaging flow cytometers, sensors for metagenomics hyperspectral IOPs and AOPs) should also be supported to ensure appropriate evaluation of satellite PG products performance on their spatial and temporal resolution.
Theoretical Background to Further Develop PG Retrievals and Assess Their Uncertainty
To fill Gap 2, the development of a framework for clear traceability of uncertainties in PG satellite products needs to be supported by the specific assessment of mismatch definition, in situ error, retrieval error, or errors due to the spatial and temporal upscaling of specific PG signatures in diverse communities. This requires the steps mentioned in Section Improving Match between Satellite PG and Users' Needs and in Section Curation and Acquisition of In situ Data for Improving and Assessing PG Retrievals, but also steps linked to improving PG algorithms (see also Section Sustaining Long-Term PG Satellite Data) which require a solid theoretical background.
On one hand inverse modeling needs to be optimized by further developing the theoretical background to connect optical signatures to diversity of phytoplankton communities across different environments (especially in optically complex waters). The degree of independent information in hyperspectral wavelength signals will depend on the water type (e.g., waters optically dominated by phytoplankton alone, or other particles, or CDOM) and will determine whether different phytoplankton products can be independently derived from a given hyperspectral spectrum. This statistical-informational problem needs to be considered in the application of (global or regional) inversion algorithms. Measurements on spectral specific IOPs (in particular scattering properties) on natural and cultured samples will lead to a better description of optics in RTM. On the other hand, developing a mechanistic understanding of the spectral properties of PG to retrieve bio-optical indices of diversity requires a better utilization of expertise crossing a wide range of fields, including taxonomy and molecular ecology in connection with optically-derived PG. The usage of global numerical models which resolve the bio-optical properties of different PG will provide a way forward for connecting more specifically a larger range of satellite PG products (highlighted in Figure 1 with red-blue arrow connecting optical PG with PFT). Models could group their “model phytoplankton-analogs” according to more dimensions of diversity (e.g., accessory pigments, scattering characteristics, etc.—see optical PG in Figure 1) that link closer to the satellite PG definitions than the more classical PFT designations (e.g., nitrogen fixers, silicifiers,…). Models that include spectrally-resolved optics and bio-optical properties of phytoplankton could also prove to be a powerful tool for exploring the inter-dependency and regionally varying skill of different satellite PG approaches.
Sustaining Long-Term PG Satellite Data
As outlined in Section Gap 3: Missing Capabilities of Current Ocean Color Satellite Measurements, long-term data sets of sufficient spatial and temporal resolution are needed to be established which are also adequate for regional applications (see Section Gap 4: Lack of Regional Capability of PG Algorithms).
At first, the exploitation of hyperspectral data needs to be intensified in order to base those data on deriving the spectral imprints of phytoplankton groups in ocean color:
– In preparation for the exploitation of future hyperspectral ocean color sensor [PACE, EnMAP or Hyperspectral InfraRred Imager (HyspIRI) and hopefully more] missions, much more effort needs to be put into the development of atmospheric correction for hyperspectral satellite data; methods should be developed over open ocean and complex waters, with the help of RTM, and considering multispectral atmospheric correction methods. Also current hyperspectral satellite data sets, such as SCIAMACHY, HICO, OMI (and from 2017 also TROPOMI), should be explored further.
– Hyperspectral and quantitative spectral PT and PSC algorithms should be adapted, extended and applied at global and regional scales to data with high spectral resolution from former, current and near-future “atmospheric” satellite sensors such as SCIAMACHY, OMI, TROPOMI and also, where possible, to the HICO data to set-up time series of hyperspectral PG data from 2002 onwards.
– Hyperspectral and quantitative spectral PT and PSC algorithms should be adapted, extended and applied at global and regional scales to data with high spectral resolution from former, current and near-future “atmospheric” satellite sensors such as SCIAMACHY, OMI, TROPOMI, and also, where possible, to the HICO data to set-up time series of hyperspectral PG data from 2002 onwards.
– The potential of spectral PG quantitative satellite retrievals for future satellite sensor should be further explored based on assessment via RTM, hyperspectral satellite, and in situ data to retrieve as many as possible of the PG requested by users from hyper- (e.g., like PACE, ENMAP) and multispectral data sets (e.g., like OLCI bands and a few additional bands).
In addition a framework is needed at an international level for integrating PG information from different sensors (hyper-/multispectral, global coverage/high spatial, and/or temporal resolution) to meet user requirements across different scales with special focus to regional applications (in order to fill Gap 4, see Section Gap 4: Lack of Regional Capability of PG Algorithms).
– At first, a workshop with experts across the different disciplines (in situ, algorithm, modeling) is necessary to define round-robin exercises for the regional (thematic) assessment of algorithms (validation, uncertainties) under specified protocols. When these regional algorithm inter-comparisons and assessments with different kinds of in situ optical and PG data are executed, best practice to use different kinds of PG data to obtain synergistic PG information should also be developed.
– PG data merged from all low spatial resolution hyperspectral available sources to date (incl. TROPOMI) should be used synergistically with multispectral derived PG products for building up high spatially resolved PG long-term global records from 1997 into the future.
– In addition, PG retrievals should be optimized on trigonal scale based on other environmental and ecological information (e.g., from remote sensing, climatology) such as sea surface temperature, available light, wind speed, mixed layer depth, nutrients fluorescence, and optically active water constituents (CDOM, total suspended matter) and better links to biogeography.
Based on the outcome of the activities to foster hyperspectral data exploitation, synergistic use of new satellite sensors for detection of phytoplankton diversity across all oceanic, coastal, and inland water environments should allow for merged PG products. This will secure the prolongation of PG data time series as climate data records.
Conclusions
Synoptic observations on phytoplankton diversity, obtained from satellite ocean color data, have the potential to improve models for assessing and predicting climate change and for managing marine services, and they are currently the only means available for high resolution, long-term monitoring of changes in marine ecosystem structure at the regional to global scale. Yet, to meet the requirements of an essential ocean/climate variable (highly accurate and error-characterized) further scientific investment into existing and further developed methods is needed. In particular, the satellite phytoplankton group products should: (i) match those requested by the user communities; (ii) provide quantitative per-pixel uncertainty; (iii) exploit past, current and future hyperspectral remote-sensing; (iv) be tuned for regional applications (including coastal and inland-water regions); and (v) exploit better the various streams of satellite information, from the various sensors in space. Improved understanding of how the optical signatures (inherent optical properties) of phytoplankton groups vary will also aid algorithm development. These actions can only be achieved with coordinated and sustained investment, across national and international agencies, and through interdisciplinary co-operation between satellite algorithm developers, in situ experts and end users (e.g., ecosystem modelers).
Author Contributions
AB organized the specific CLEO session, lead its discussion, and the writing team which set up the outline of this manuscript. She wrote the draft version and synoptically implemented the revisions by all other coauthors. HB, VB, SD, AH, MH, TH, SL, JU, MV, and AW planned and participated in the writing session after the workshop and substantially helped to revise several versions of the manuscript. In addition also several experts who could not participate in the discussion and writing sessions provided substantial comments and suggestions to improve the manuscript: ABri, RB, AC, LC, ED, AD, NH, CM, EO, and DR.
Funding
The ESA SEOM SY-4Sci Synergy project (No. 400112410/14/I-NB) funded partially the contribution of AB, ABri, RB, SL, and AW. SD acknowledges NASA (NNX13AC34G) for funding. CM acknowledges funding from NNX13AC34G for this effort.
Conflict of Interest Statement
The authors declare that the research was conducted in the absence of any commercial or financial relationships that could be construed as a potential conflict of interest.
Acknowledgments
We thank ESA/ESRIN within the context of activities of the ESA Scientific Exploitation of Operational Missions (SEOM) for funding the “Phytoplankton Diversity at Global and Regional Scale” Session at the Colour and Light from Earth Observation (CLEO) workshop and International Satellite Functional Type Algorithm Intercomparison Project (http://pft.ees.hokudai.ac.jp/satellite/), with funding from JAXA, UK National Centre for Earth Observation, and the IOCCG for facilitation of a series of meetings that led to the development of this manuscript.
References
Alvain, S., Le Quéré, C., Bopp, L., Racault, M. F., Beaugrand, G., Dessailly, D., et al. (2013). Rapid climatic driven shifts of diatoms at high latitudes. Remote Sens. Environ. 132, 195–201. doi: 10.1016/j.rse.2013.01.014
Alvain, S., Moulin, C., Dandonneau, Y., and Breon, F. (2005). Remote sensing of phytoplankton groups in case 1 waters for global SeaWiFS imagery. Deep Sea Res. I 52, 1989–2004. doi: 10.1016/j.dsr.2005.06.015
Alvain, S., Moulin, C., Dandonneau, Y., and Loisel, H. (2008). Seasonal distribution and succession of dominant phytoplankton groups in the global ocean: a satellite view. Global Biogeochem. Cycles 22:GB3001. doi: 10.1029/2007gb003154
Arnold, S. R., Spracklen, D. V., Williams, J., Yassaa, N., Sciare, J., Bonsang, B., et al. (2009). Evaluation of the global oceanic isoprene source and its impacts on marine organic carbon aerosol. Atmos. Chem. Phys. 9, 1253–1262. doi: 10.5194/acp-9-1253-2009
Baird, M. E., Cherukuru, N., Jones, E. M., Margvelashvili, N., Mongin, M., Oubelkheir, K., et al. (2016). Remote-sensing reflectance and true colour produced by a coupled hydrodynamic, optical, sediment, biogeochemical model of the Great Barrier Reef, Australia: comparison with remotely-sensed data. Environ. Modell. Softw. 78, 79–96. doi: 10.1016/j.envsoft.2015.11.025
Baretta, J. W., Ebenhöh, W., and Ruardij, P. (1995). The European regional seas ecosystem model, a complex marine ecosystem model. Neth. J. Sea Res. 33, 233–246. doi: 10.1016/0077-7579(95)90047-0
Ben Mustapha, Z., Alvain, S., Jamet, C., Loisel, H., and Dessailly, D. (2014). Automatic classification of water-leaving radiance anomalies from global SeaWiFS imagery: application to the detection of phytoplankton groups in open ocean waters. Remote Sens. Environ. 146, 97–112. doi: 10.1016/j.rse.2013.08.046
Bidigare, R. R., Ondnwk, M. E., Marrow, J. H., and Kiefer, D. A. (1990). In vivo absorption of algal pigments. SPIE 1302, 290–302.
Booge, D., Marandino, C. A., Schlundt, C., Palmer, P. I., Schlundt, M., Atlas, E. L., et al. (2016). Can simple models predict large scale surface ocean isoprene concentrations? Atmos. Chem. Phys. 16, 11807–11821. doi: 10.5194/acp-16-11807-2016
Bopp, L., Resplandy, L., Orr, J. C., Doney, S. C., Dunne, J. P., Gehlen, M., et al. (2013). Multiple stressors of ocean ecosystems in the 21st century: projections with CMIP5 models. Biogeosciences 10, 6225–6245. doi: 10.5194/bg-10-6225-2013
Boss, E., Picheral, M., Leeuw, T., Chase, A., Karsenti, E., Gorsky, G., et al. (2013). The characteristics of particulate absorption, scattering and attenuation coefficients in the surface ocean; Contribution of the Tara Oceans expedition. Methods Oceanogr. 7, 52–62. doi: 10.1016/j.mio.2013.11.002
Bouman, H. A., Ulloa, O., Scanlan, D. J., Zwirglmaier, K., Li, W. K., Platt, T., et al. (2006). Oceanographic basis of the global surface distribution of Prochlorococcus ecotypes. Science 312, 918–921. doi: 10.1126/science.1122692
Bracher, A., Hardman-Mountford, N., Hirata, T., Bernard, S., Brewin, R., Bricaud, A., et al. (2015a). Report on IOCCG Workshop “Phytoplankton Composition from SPACE: towards a Validation Strategy for Satellite Algorithms,” NASA Tech. Memo 2015-217528_01-22-15, Portland, ME. Available online at: http://www.ioccg.org/groups/PFT-TM_2015-217528_01-22-15.pdf (Accessed October 25–26, 2014)
Bracher, A., Taylor, M. H., Taylor, B. B., Dinter, T., Röttgers, R., and Steinmetz, F. (2015b). Using empirical orthogonal functions derived from remote sensing reflectance for the prediction of phytoplankton pigment concentrations. Ocean Sci. 11, 139–158. doi: 10.5194/os-11-139-2015
Bracher, A., Vountas, M., Dinter, T., Burrows, J. P., Röttgers, R., and Peeken, I. (2009). Quantitative observation of cyanobacteria and diatoms from space using PhytoDOAS on SCIAMACHY data. Biogeosciences 6, 751–764. doi: 10.5194/bg-6-751-2009
Brewin, R. J. W., Hardman-Mountford, N. J., Lavender, S. J., Raitsos, D. E., Hirata, T., Uitz, J., et al. (2011). An inter-comparison of bio-optical techniques for detecting dominant phytoplankton size class from satellite remote sensing. Remote Sens. Environ. 115, 325–339. doi: 10.1016/j.rse.2010.09.004
Brewin, R. J. W., Hirata, T., Hardman-Mountford, N. J., Lavender, S. J., Sathyendranath, S., and Barlow, R. (2012). The influence of the Indian Ocean Dipole on interannual variations in phytoplankton size structure as revealed by Earth Observation. Deep Sea Res. II 77–80, 117–127. doi: 10.1016/j.dsr2.2012.04.009
Brewin, R. J. W., Sathyendranath, S., Hirata, T., Lavender, S. J., Barciela, R. M., and Hardman-Mountford, N. J. (2010), A three-component model of phytoplankton size class for the Atlantic Ocean. Ecol. Model. 221, 1472–1483. doi: 10.1016/j.ecolmodel.2010.02.014
Brewin, R. J. W., Sathyendranath, S., Jackson, T., Barlow, R., Brotas, V., Airs, R., et al. (2015). Influence of light in the mixed-layer on the parameters of a three-component model of phytoplankton size class. Remote Sens. Environ. 168, 437–450. doi: 10.1016/j.rse.2015.07.004
Brewin, R. J. W., Sathyendranath, S., Lange, P. K., and Tilstone, G. (2014). Comparison of two methods to derive the size-structure of natural populations of phytoplankton. Deep Sea Res. Part I 85, 72–79. doi: 10.1016/j.dsr.2013.11.007
Bricaud, A., Ciotti, A. M., and Gentili, B. (2012), Spatial-temporal variations in phytoplankton size and colored detrital matter absorption at global and regional scales, as derived from twelve years of SeaWiFS data (1998–2009). Global Biogeochem. Cycles 26:GB1010. doi: 10.1029/2010GB003952
Bricaud, A., Claustre, H., Ras, J., and Oubelkheir, K. (2004). Natural variability of phytoplanktonic absorption in oceanic waters: influence of the size structure of algal populations. J. Geophys. Res. 109:C11010. doi: 10.1029/2004jc002419
Brown, C. W., and Yoder, J. A. (1994). Coccolithophorid blooms in the global ocean. J. Geophys. Res. 99, 7467–7482. doi: 10.1029/93JC02156
Chai, F., Dugdale, R. C., Peng, T.-H., Wilkerson, F. P., and Barber, R. T. (2002). One-dimensional ecosystem model of the equatorial Pacific upwelling system. Part I. Model development and silicon and nitrogen cycle. Deep Sea Res. II 49, 2713–2745. doi: 10.1016/S0967-0645(02)00055-3
Chase, A., Boss, E., Zaneveld, R., Bricaud, A., Claustre, H., Ras, J., et al. (2013). Decomposition of in situ particulate absorption spectra. Methods Oceanogr. 7, 110–124. doi: 10.1016/j.mio.2014.02.002
Cherkasheva, A., Bracher, A., Melsheimer, C., Köberle, C., Gerdes, R., Nöthig, E.-M., et al. (2014). Influence of the physical environment on phytoplankton blooms: a case study in the Fram Strait. J. Mar. Syst. 132, 196–207. doi: 10.1016/j.jmarsys.2013.11.008
Ciotti, A. M., and Bricaud, A. (2006). Retrievals of a size parameter for phytoplankton and spectral light absorption by colored detrital matter from water-leaving radiances at SeaWiFS channels in a continental shelf region off Brazil. Limnol. Oceanogr. Methods, 4, 237–253. doi: 10.4319/lom.2006.4.237
Cullen, J. J., Ciotti, A. M., Davis, R. F., and Lewis, M. R. (1997). Optical detection and assessment of algal blooms. Limnol. Oceanogr. 42, 1223–1239. doi: 10.4319/lo.1997.42.5_part_2.1223
Devred, E., Sathyendranath, S., and Stuart, V. (2006). A two-component model of phytoplankton absorption in the open ocean: theory and applications. J. Geophys. Res. 111:C03011. doi: 10.1029/2005jc002880
Devred, E., Sathyendranath, S., Stuart, V., and Platt, T. (2011). A three component classification of phytoplankton absorption spectra: application to ocean-color data. Remote Sens. Environ. 115, 2255–2266. doi: 10.1016/j.rse.2011.04.025
Dutkiewicz, S., Hickman, A. E., Jahn, O., Gregg, W. W., Mouw, C. B., and Follows, M. J. (2015). Capturing optically important constituents and properties in a marine biogeochemical and ecosystem model. Biogeosciences 12, 4447–4481. doi: 10.5194/bg-12-4447-2015
Evers-King, H., Bernard, S., Lain, L. R., and Probyn, T. A. (2014). Sensitivity in reflectance attributed to phytoplankton cell size: forward and inverse modelling approaches. Opt. Express 22, 11536–11551. doi: 10.1364/OE.22.011536
Field, C. B., Behrenfeld, M. J., Randerson, J. T., and Falkowski, P. G. (1998). Primary production of the biosphere: integrating terrestrial and oceanic components. Science 281, 237–240. doi: 10.1126/science.281.5374.237
Follows, M. J., Dutkiewicz, S., Grant, S., and Chisholm, S. W. (2007). Emergent biogeography of microbial communities in a model ocean. Science 315, 1843–1846. doi: 10.1126/science.1138544
Fujii, M., Boss, E., and Chai, F. (2007). The value of adding optics to ecosystem models: a case study. Biogeosciences 4, 817–835. doi: 10.5194/bg-4-817-2007
Fujiwara, A., Hirawake, T., Suzuki, K., and Saitoh, S.-I. (2011). Remote sensing of size structure of phytoplankton communities using optical properties of the Chukchi and Bering Sea shelf region. Biogeosciences 8, 3567–3580. doi: 10.5194/bg-8-3567-2011
Gregg, W. W., and Casey, N. W. (2007). Modeling coccolithophores in the global ocean. Deep Sea Res. II 54, 447–477. doi: 10.1016/j.dsr2.2006.12.007
Harmel, T., Hieronymi, M., Slade, W., Röttgers, R., Roullier, F., and Chami, M. (2016). Laboratory experiments for inter-comparison of three volume scattering meters to measure angular scattering properties of hydrosols. Opt. Express 24, A234–A256. doi: 10.1364/OE.24.00A234
Hashioka, T., Vogt, M., Yamanaka, Y., Le Quéré, C., Noguchi Aita, M., Alvain, S., et al. (2013). Phytoplankton competition during the spring bloom in four Plankton Functional Type Models. Biogeosciences 10, 6833–6850. doi: 10.5194/bg-10-6833-2013
Hirata, T., Aiken, J., Hardman-Mountford, N., Smyth, T. J., and Barlow, R. (2008). An absorption model to determine phytoplankton size classes from satellite ocean color. Remote Sens. Environ. 112, 3153–3159. doi: 10.1016/j.rse.2008.03.011
Hirata, T., Hardman-Mountford, N. J., Brewin, R. J. W., Aiken, J., Barlow, R., Suzuki, K., et al. (2011). Synoptic relationships between surface Chlorophyll-a and diagnostic pigments specific to phytoplankton functional types. Biogeosciences 8, 311–327. doi: 10.5194/bg-8-311-2011
Hirata, T., Saux-Picart, S., Hashioka, T., Aita-Noguchi, M., Sumata, H., Shigemitsu, M., et al. (2013). A comparison between phytoplankton community structure derived from a global 3D ecosystem model and satellite observation. J. Mar. Syst. 109–110, 129–137. doi: 10.1016/j.jmarsys.2012.01.009
Hoepffner, N., and Sathyendranath, S. (1993). Determination of the major groups of phytoplankton pigments from the absorption spectra of total particulate matter. J. Geophys. Res. 98, 22784–22803. doi: 10.1029/93jc01273
Hooker, S. B., Clementson, L., Thomas, C. S., Schlüter, L., Allerup, M., Ras, J., et al. (2012). The Fifth SeaWiFS HPLC Analysis Round-Robin Experiment (SeaHARRE-5), Vol. 98. Greenbelt, MD: NASA Tech. Memo 2012–217503; NASA Goddard Space Flight Center.
IOCCG (2000). “Remote sensing of ocean color in coastal, and other optically Complex, Waters,” in Reports of the International Ocean Color Coordinating Group, No. 3, ed S. Sathyendranath (Dartmouth, NS: IOCCG), 140.
IOCCG (2009). “Remote sensing in fisheries and aquaculture: the societal benefits,” in Report of the International Ocean-Colour Coordinating Group, No. 8, eds M.-H. Forget, V. Stuart, and T. Platt (Dartmouth, NS: IOCCG), 98.
IOCCG (2014). “Phytoplankton functional types from space,” in Reports of the International Ocean Color Coordinating Group, No. 15, ed S. Sathyendranath (Dartmouth, NS: IOCCG), 156.
IOCS (2013). “Splinter session 10: phytoplankton community structure from ocean color,” in Proceedings of the International Ocean color Symposium (IOCS) 2013, eds A. Bracher and T. Hirata (Darmstadt), 54–58. Available online at: http://iocs.ioccg.org/wp-content/uploads/report-iocs-2013-meeting.pdf
IOCS (2015). “Breakout session 1: remote sensing of phytoplankton composition - possibilities, applications and future needs,” in Proceedings of the International Ocean color Symposium (IOCS) 2015, eds C. Mouw, A. Bracher, N. Hardman-Mountford (San Francisco, CA), 22–23. Available online at: http://iocs.ioccg.org/wp-content/uploads/2012/10/report-iocs-2015-meeting.pdf
IPCC (2013). “Climate change 2013: the physical science basis,” in Contribution of Working Group I to the Fifth Assessment Report of the Intergovernmental Panel on Climate Change, eds T. F. Stocker, D. Qin, G.-K. Plattner, M. M. B. Tignor, S. K. Allen, J. Boschung, A. Nauels, Y. Xia, V. Bex, P. M. Midgley (Cambridge, UK; New York, NY, USA: Cambridge University Press), 1535.
Jennigs, S., Melin, F., Blanchard, J. L., Forster, R. M., Dulvy, N. K., and Wilson, R. W. (2008). Global-scale predictions of community and ecosystem properties from simple ecological theory. Proc. Biol. Sci. 275, 1375–1383. doi: 10.1098/rspb.2008.0192
Johnsen, G., and Sakshaug, E. (2007). Biooptical characteristics of PSII and PSI in 33 species (13 pigment groups) of marine phytoplankton, and the relevance for pulse-amplitude-modulated and fast-repetition-rate fluorometry. J. Phycol. 43, 1236–1251. doi: 10.1111/j.1529-8817.2007.00422.x
Kostadinov, T. S., Siegel, D. A., and Maritorena, S. (2009). Retrieval of the particle size distribution from satellite ocean color observations. J. Geophys. Res. 114:C09015. doi: 10.1029/2009JC005303
Kostadinov, T., Cabré, A., Vedantham, H., Marinov, I., Bracher, A., Brewin, R., et al. (2017). Intercomparison of phytoplankton functional types derived from ocean color algorithms and earth system models: phenology. Remote Sens. Environ. 190, 162–177. doi: 10.1016/j.rse.2016.11.014
Kostadinov, T., Milutinovic, S., Marinov, I., and Cabré, A. (2016). Carbon-based phytoplankton size classes retrieved via ocean color estimates of the particle size distribution. Ocean Sci. 12, 561–575. doi: 10.5194/os-12-561-2016
Kudela, R., Palacios, S. L., Austerberry, D. C., Accorsi, E. K., Guild, L. S., and Torres-Perez, J. (2015). Application of hyperspectral remote sensing to cyanobacterial blooms in inland waters. Remote Sens. Environ. 167, 196–205. doi: 10.1016/j.rse.2015.01.025
Kurekin, A. A., Miller, P. I., and van der Woerd, H. J. (2014). Satellite discrimination of Karenia mikimotoi and Phaeocystis harmful algal blooms in European coastal waters: merged classification of ocean color data. Harmf. Algae 31, 163–176. doi: 10.1016/j.hal.2013.11.003
Laufkötter, C., Vogt, M., Gruber, N., Aita-Noguchi, M., Aumont, O., Bopp, L., et al. (2015). Drivers and uncertainties of future global marine primary production in marine ecosystem models. Biogeosciences 12, 6955–6984. doi: 10.5194/bg-12-6955-2015
Le Quéré, C., Harrison, S. P., Colin Prentice, I., Buitenhuis, E. T., Aumont, O., Bopp, L., et al. (2005). Ecosystem dynamics based on plankton functional types for global ocean biogeochemistry models. Glob. Chang. Biol. 11, 2016–2040. doi: 10.1111/j.1365-2486.2005.01004.x
Li, Z., Li, L., Song, K., and Cassar, N. (2013). Estimation of phytoplankton size fractions based on spectral features of remote sensing ocean color data. J. Geophys. Res. Oceans 118, 1445–1458. doi: 10.1002/jgrc.20137
Maritorena, S., Fanton d'Andon, O. H., Mangin, A., and Siegel, D. A. (2010). Merged satellite ocean color data products using a bio-optical model: characteristics, benefits and issues. Remote Sens. Environ. 114, 1791–1804. doi: 10.1016/j.rse.2010.04.002
Masuda, Y., Yamanaka, Y., Hirata, T., and Nakano, H. (2017). Competition and community assemblage dynamics within a phytoplankton functional group: simulation using an eddy-resolving model to disentangle deterministic and random effects. Ecol. Modell. 343, 1–14. doi: 10.1016/j.ecolmodel.2016.10.015
McClain, C. R. (2009). A decade of satellite ocean color observations. Ann. Rev. Mar. Sci. 1, 19–42. doi: 10.1146/annurev.marine.010908.163650
Moisan, T. A. H., Moisan, J. R., Linkswiler, M. A., and Steinhardt, R. A. (2013). Algorithm development for predicting biodiversity based on phytoplankton absorption. Cont. Shelf Res. 55, 17–28. doi: 10.1016/j.csr.2012.12.011
Moore, T. S., Dowell, M. D., and Franz, B. A. (2012). Detection of coccolithophore blooms in ocean color satellite imagery: a generalized approach for use with multiple sensors. Remote Sens. Environ. 117, 249–263. doi: 10.1016/j.rse.2011.10.001
Morel, A., and Bricaud, A. (1981). Theoretical results concerning light absorption in a discrete medium, and application to specific absorption of phytoplankton. Deep Sea Res. 28, 1375–1393. doi: 10.1016/0198-0149(81)90039-X
Mouw, C. B., and Yoder, J. A. (2010). Optical determination of phytoplankton size composition from global SeaWiFS imagery. J. Geophys. Res. 115:C12018. doi: 10.1029/2010JC006337
Mouw, C. B., Barnett, A., McKinley, G. A., Gloege, L., and Pilcher, D. (2016). Phytoplankton size impact on export flux in the global ocean. Global Biogeochem. Cycles 30, 1542–1562. doi: 10.1002/2015GB005355
Mouw, C. B., Hardman-Montford, N., Alvain, S., Bracher, A., Brewin, R., Bricaud, A., et al. (2017). A Consumer's guide to satellite remote sensing of multiple phytoplankton groups in the global ocean. Front. Mar. Sci. 4:41. doi: 10.3389/fmars.2017.00041
Mueller, J. L., Fargion, G. S., and McClain, C. R. (2003). Ocean Optics Protocols for Satellite Ocean Color Sensor Validation, Revision 4, Volume III: Radiometric Measurements and Data Analysis Protocols. NASA/TM-2003-211621/Rev4-Vol. III, NASA Goddard Space Flight Center, Greenbelt, MD.
Oelker, J., Dinter, T., Richter, A., Burrows, J. P., and Bracher, A. (2016). “Towards improved spatial resolution of hyper-spectral phytoplankton functional type products,” in Oral presentation at ‘Colour and Light in the Ocean from Earth Observation (CLEO) Relevance and Applications Products from Space and Perspectives from Models’ (Frascati: ESA-ESRIN). Available online at: http://esaconferencebureau.com/docs/default-source/16c12-presentations/d2_12-05_oelker.pdf?sfvrsn=2 (September 6–8, 2016).
Organelli, E., Bricaud, A., Antoine, D., and Uitz, J. (2013). Multivariate approach for the retrieval of phytoplankton size structure from measured light absorption spectra in the Mediterranean Sea (BOUSSOLE site). Appl. Opt. 52, 2257–2273. doi: 10.1364/AO.52.002257
Organelli, E., Nuccio, C., Melillo, C., and Massi, L. (2011). Relationships between phytoplankton light absorption, pigment composition and size structure in offshore areas of the Mediterranean Sea. Adv. Oceanogr. Limnol. 2, 107–123. doi: 10.4081/aiol.2011.5320
Palacz, A. P., St. John, M. A., Brewin, R. J. W., Hirata, T., and Gregg, W. W. (2013). Distribution of phytoplankton functional types in high-nitrate low-chlorophyll waters in a new diagnostic ecological indicator model. Biogeosciences 10, 7553–7574. doi: 10.5194/bg-10-7553-2013
Peloquin, J., Swan, C., Gruber, N., Vogt, M., Claustre, H., and Ras, J. (2013). The MAREDAT global database of high performance liquid chromatography marine pigment measurements (NetDCF) - Contribution to the MAREDAT World Ocean Atlas of Plankton Functional Types. Earth Syst. Sci. Data 5, 109–123. doi: 10.5194/essd-5-109-2013
Racault, M.-F., Raitsos, D. E., Berumen, M. L., Brewin, R. J. W., Platt, T., Sathyendranath, S., et al. (2015). Phytoplankton phenology indices in coral reef ecosystems: application to ocean-colour observations in the Red Sea. Remote Sens. Environ. 160, 222–234. doi: 10.1016/j.rse.2015.01.019
Raitsos, D. E., Lavender, S. J., Maravelias, C. D., Haralambous, J., Richardson, A. J., and Reid, P. C. (2008). Identifying phytoplankton functional groups from space: an ecological approach. Limnol. Oceanogr. 53, 605–613. doi: 10.4319/lo.2008.53.2.0605
Roy, S., Sathyendranath, S., Bouman, H., and Platt, T. (2013). The global distribution of phytoplankton size spectrum and size classes from their light-absorption spectra derived from satellite data. Remote Sens. Environ. 139, 185–197. doi: 10.1016/j.rse.2013.08.004
Rozanov, V. V., Rozanov, A., Kokhanovsky, A., and Burrows, J. P. (2014). Radiative transfer through atmosphere and ocean: software package SCIATRAN. J. Quant. Spectrosc. Rad. Transf. 133, 13–71. doi: 10.1016/j.jqsrt.2013.07.004
Ryan, J. P., Davis, C. O., Tufillaro, N. B., Kudela, R. M., and Gao, B.-C. (2014). Application of the hyperspectral imager for the coastal ocean to phytoplankton ecology studies in Monterey Bay, CA. Remote Sens. 6, 1007–1025. doi: 10.3390/rs6021007
Sadeghi, A., Dinter, T., Vountas, M., Taylor, B. B., Altenburg-Soppa, M., and Bracher, A. (2012a). Improvement to the PhytoDOAS method for identification of coccolithophores using hyper-spectral satellite data. Ocean Sci. 8, 1055–1070. doi: 10.5194/os-8-1055-2012
Sadeghi, A., Dinter, T., Vountas, M., Taylor, B., Altenburg-Soppa, M., Peeken, I., et al. (2012b). Remote sensing of coccolithophore blooms in selected oceanic regions using the PhytoDOAS method applied to hyper-spectral satellite data. Biogeosciences 9, 2127–2143. doi: 10.5194/bg-9-2127-2012
Siegel, D. A., Buesseler, K. O., Behrenfeld, M. J., Benitez-Nelson, C., Boss, E., Brzezinski, M. A., et al. (2016). Prediction of the export fate of global ocean net primary production: the EXPORTS science plan. Front. Mar. Sci. 3:22. doi: 10.3389/fmars.2016.00022
Soppa, M. A., Hirata, T., Silva, B., Dinter, T., Peeken, I., Wiegmann, S., et al. (2014). Global retrieval of diatoms abundance based on phytoplankton pigments and satellite. Remote Sens. 6, 10089–10106. doi: 10.3390/rs61010089
Soppa, M. A., Völker, C., and Bracher, A. (2016a). Diatom phenology in the southern ocean: mean patterns, trends and the role of climate oscillations. Remote Sens. 8:420. doi: 10.3390/rs8050420
Soppa, M., Dinter, T., Losa, L., Wolanin, A., and Bracher, A. (2016b). SY-4Sci Synergy R & D Study 4: Phytoplankton Functional Types (SynSenPFT), D1.2 Algorithm Theoretical Base Document (ATBD), Version 8.1, ESRIN Contract No.: 4000112410/14/I-NB. Available online at: https://www.awi.de/fileadmin/user_upload/AWI/Forschung/Klimawissenschaft/Physikalische_Ozeanographie_der_Polarmeere/SEOM-SynSenPFT-ATBD-D1.2_v8.1.pdf (Accessed September 15, 2016).
Sosik, H. M., and Olson, R. J. (2007). Automated taxonomic classification of phytoplankton sampled with imaging-in-flow cytometry. Limnol. Oceanogr. Methods 5, 204–216. doi: 10.4319/lom.2007.5.204
Subramaniam, A., Brown, C. W., Hood, R. R., Carpenter, E., and Capone, D. G. (2002). Detecting Trichodesmium blooms in SeaWiFS imagery. Deep Sea Res. II 49, 107–121. doi: 10.1016/S0967-0645(01)00096-0
Swan, C., Vogt, M., Gruber, N., and Laufkötter, C. (2016). A global seasonal surface ocean climatology of phytoplankton types based on CHEMTAX analysis of HPLC pigments. Deep Sea Res. I 109, 137–156. doi: 10.1016/j.dsr.2015.12.002
Tan, H., Oishi, T., Tanaka, A., and Doerffer, R. (2015). Accurate estimation of the backscattering coefficient by light scattering at two backward angles. Appl. Opt. 54, 7718–7733. doi: 10.1364/AO.54.007718
Trzcinski, M. K., Devred, E., Platt, T., and Sathyendranath, S. (2013). Variation in ocean color may help predict cod and haddock recruitment. Mar. Ecol. Prog. Ser. 491, 187–197. doi: 10.3354/meps10451
Uitz, J., Claustre, H., Morel, A., and Hooker, S. B. (2006). Vertical distribution of phytoplankton communities in open ocean: an assessment based on surface chlorophyll. J. Geophys. Res. 111:C08005. doi: 10.1029/2005JC003207
Vogt, M., Hashioka, T., Payne, M., and Buitenhuis, E. T. (2013). The distribution, dominance patterns and ecological niches of plankton functional groups in Dynamic Green Ocean Models and satellite estimates. Biogeosci. Discuss. 10, 17193–17247. doi: 10.5194/bgd-10-17193-2013
Ward, B. A., Dutkiewicz, S., Jahn, O., and Follows, M. J. (2012). A size structured food-web model for the global ocean. Limnol. Oceanogr. 57, 1877–1891. doi: 10.4319/lo.2012.57.6.1877
Werdell, J., Franz, B. A., Bailey, S. W., Harding, L. W. Jr., and Feldman, G. C. (2007). Approach for the long-term spatial and temporal evaluation of ocean color satellite data products in a coastal environment. Proc. SPIE Int. Soc. Opt. Eng. 6680:12. doi: 10.1117/12.732489
Werdell, P. J., Franz, B. A., Bailey, S. W., Feldman, G. C., Boss, E., and Brando, V. E. (2013). Generalized ocean color inversion model for retrieving marine inherent optical properties. Appl. Opt. 52:2019. doi: 10.1364/AO.52.002019
Werdell, P. J., Roesler, C. S., and Goes, J. I. (2014). Discrimination of phytoplankton functional groups using an ocean reflectance inversion model. Appl. Opt. 53:4833. doi: 10.1364/AO.53.004833
Westberry, T. K., Siegel, D. A., and Subramaniam, A. (2005). An improved bio-optical model for the remote sensing of Trichodesmium spp. blooms. J. Geophys. Res. 110:C06012. doi: 10.1029/2004JC002517
Wolanin, A., Dinter, T., and Bracher, A. (2015). SY-4Sci Synergy R & D Study 4: Phytoplankton Functional Types (SynSenPFT), D2.1 - Report on Using Radiative Transfer Modelling to Develop a Correction Scheme and Investigate the Sensitivity of the Improved PhytoDOAS (Version 3.0) Algorithm. Version 1, ESRIN Contract No.: 4000112410/14/I-NB, https://www.awi.de/fileadmin/user_upload/AWI/Forschung/Klimawissenschaft/Physikalische_Ozeanographie_der_Polarmeere/SEOM-SynSenPFT-D2.1_v1.pdf (Accessed October 30, 2015).
Wolanin, A., Soppa, M. A., and Bracher, A. (2016). Investigation of spectral band requirements for improving retrievals of phytoplankton functional types. Remote Sens. 8:871. doi: 10.3390/rs8100871
Xi, H., Hieronymi, M., Röttgers, R., Krasemann, H., and Qiu, Z. (2015). Hyperspectral Differentiation of phytoplankton taxonomic groups: a comparison between using remote sensing reflectance and absorption spectra. Remote Sens. 7, 14781–14805. doi: 10.3390/rs71114781
Ye, Y., Voelker, C., Bracher, A., Taylor, B., and Wolf-Gladrow, D. (2012). Environmental controls on N2 fixation by Trichodesmium in the tropical eastern North Atlantic. Deep Sea Res. I 64, 104–117. doi: 10.1016/j.dsr.2012.01.004
Keywords: ocean color, phytoplankton functional types, algorithms, satellite sensors, roadmap
Citation: Bracher A, Bouman HA, Brewin RJW, Bricaud A, Brotas V, Ciotti AM, Clementson L, Devred E, Di Cicco A, Dutkiewicz S, Hardman-Mountford NJ, Hickman AE, Hieronymi M, Hirata T, Losa SN, Mouw CB, Organelli E, Raitsos DE, Uitz J, Vogt M and Wolanin A (2017) Obtaining Phytoplankton Diversity from Ocean Color: A Scientific Roadmap for Future Development. Front. Mar. Sci. 4:55. doi: 10.3389/fmars.2017.00055
Received: 30 November 2016; Accepted: 15 February 2017;
Published: 03 March 2017.
Edited by:
Laura Lorenzoni, University of South Florida, USAReviewed by:
Matthew J. Oliver, University of Delaware, USACatherine Mitchell, Bigelow Laboratory for Ocean Sciences, USA
Copyright © 2017 Bracher, Bouman, Brewin, Bricaud, Brotas, Ciotti, Clementson, Devred, Di Cicco, Dutkiewicz, Hardman-Mountford, Hickman, Hieronymi, Hirata, Losa, Mouw, Organelli, Raitsos, Uitz, Vogt and Wolanin. This is an open-access article distributed under the terms of the Creative Commons Attribution License (CC BY). The use, distribution or reproduction in other forums is permitted, provided the original author(s) or licensor are credited and that the original publication in this journal is cited, in accordance with accepted academic practice. No use, distribution or reproduction is permitted which does not comply with these terms.
*Correspondence: Astrid Bracher, YXN0cmlkLmJyYWNoZXJAYXdpLmRl