 Anni Djurhuus1*
 Jesse Port2
 Collin J. Closek2,3
 Kevan M. Yamahara4Ofelia Romero-Maraccini2Kristine R. Walz4
 Dawn B. Goldsmith1Reiko Michisaki4
 Mya Breitbart1
 Alexandria B. Boehm2,3
 Francisco P. Chavez4
- 1College of Marine Science, University of South Florida, St. Petersburg, FL, United States
- 2Center for Ocean Solutions, Stanford University, Stanford, CA, United States
- 3Department of Civil and Environmental Engineering, Stanford University, Stanford, CA, United States
- 4Monterey Bay Aquarium Research Institute, Moss Landing, CA, United States
Metabarcoding of marine environmental DNA (eDNA), originating from tissue, cells, or extracellular DNA, offers the opportunity to survey the biological composition of communities across multiple trophic levels from a non-invasive seawater sample. Here we compare results of eDNA metabarcoding of multiple trophic levels from individual seawater samples collected from a kelp forest in Monterey Bay, California in order to establish methods for future cross-trophic level eDNA analysis. Triplicate 1 L water samples were filtered using five different 47 mm diameter membrane filters (PVDF, PES, GFF, PCTE, and NC) and DNA was extracted from triplicates of each filter-type using three widely-used extraction methods (the DNeasy Blood and Tissue kit, the MoBio PowerWater DNA Isolation kit, and standard phenol/chloroform methods) resulting in 45 individual eDNA samples prepared with 15 workflow combinations. Each DNA extract was amplified using PCR primers for the 16S rRNA gene (microorganisms; Bacteria and Archaea), 18S rRNA gene (phytoplankton), and the 12S rRNA gene (vertebrates), and PCR products were sequenced on an Illumina MiSeq platform. The richness and community composition of microbial, phytoplankton, and vertebrate OTUs were not significantly different between any of the 0.2 μm pore-size filter types extracted with the DNeasy or MoBio kits. However, phenol/chloroform extraction resulted in significantly different community structures. This study provides insight into multiple choices for extraction and filtration methods to use eDNA metabarcoding for biodiversity assessment of multiple trophic levels from a single sample. We recommend any combination of either DNeasy or MoBio with PES, PCTE, PVDF, or NC filters for a cross trophic level comparison.
Introduction
Marine environmental DNA (eDNA) is the DNA suspended in seawater in the form of tissue, cells, or extracellular DNA. Biodiversity studies using eDNA involve sampling environmental media (e.g., water, soil, air), extracting genomic DNA, and using metabarcoding to determine the diversity of organisms present. The application of metabarcoding (i.e., PCR amplification and sequencing of specific gene targets) to eDNA present in both marine and terrestrial environments has opened new windows into monitoring species diversity (Thomsen and Willerslev, 2015; Kelly et al., 2017). For over three decades, researchers have used metabarcoding to amplify marker genes from complex mixtures of single-celled organisms, often captured on filters from liquid matrices, to describe the diversity and composition of marine microbial and phytoplankton communities (Pace et al., 1985; Pace, 1997; Hugenholtz et al., 1998). Recent research has expanded upon these methods by exploiting the fact that multi-cellular organisms release eDNA into the marine environment. The majority of eDNA investigations have used taxon-specific sampling and processing methods to identify target organisms, with lower trophic levels, microorganisms (Wu et al., 2010) and phytoplankton (Cermeño et al., 2010), receiving the greatest attention. Recently, methods for eDNA metabarcoding to assess taxon-specific biodiversity of higher organisms such as invertebrates (Machida et al., 2009; Yu et al., 2012; Klymus et al., 2015; Aylagas et al., 2016) and vertebrates (Kelly et al., 2016; Port et al., 2016) have been developed and benchmarked against well-established techniques (e.g., dive-surveys and microscopy).
The discovery that eDNA is released into the marine environment by higher trophic levels (e.g., Foote et al., 2012; Thomsen et al., 2012) opens up the possibility of utilizing a single water sample collection (i.e., the same filter and DNA extract) to assess biodiversity from multiple trophic levels (Kelly et al., 2016). The capture, extraction, amplification, and analysis of eDNA originating from organisms from multiple trophic levels offers a practical and comprehensive means for monitoring marine biodiversity over vast spatial domains and over time. In order to perform cross-trophic level analyses of biodiversity from a single water sample and to ensure accurate comparisons across multiple locations and studies, a critical first step is evaluating the results of multiple eDNA filtration and extraction methods. For a one-size-fits-all approach, a balance must be struck between reducing false-negative rates (i.e., maximizing the likelihood of identifying a given species present in a sample) and capturing biodiversity across multiple trophic levels (Kelly et al., 2016). In this study, we assess the influence of filter membrane and DNA extraction method on the detection of eDNA from three genetic loci representing different trophic levels, ranging from microbes (bacteria and archaea) to vertebrates. Although previous studies have compared different genetic markers (Kelly et al., 2017), filters (Pilliod et al., 2013), or extraction methods (Lakay et al., 2006; Roh et al., 2006) on eDNA samples, this study is the first to our knowledge to investigate comprehensive outputs of next generation sequencing of different filter types, extraction types, and different genetic markers simultaneously.
We aim to highlight the response of three genetic markers (16S rRNA, 18S rRNA, and 12S rRNA) to different treatments, with the ultimate goal of reducing the methodological uncertainty in marine eDNA analysis and providing recommendations for suitable methods for the simultaneous analysis of several trophic levels using eDNA to fulfill the needs of emerging programs such as the Marine Biological Observation Networks (MBON).
Methods
Sample Collection and Filtration
A total of 45 L of seawater were collected in November 2014 within Lovers Point—Julia Platt State Marine Reserve in Monterey Bay, California, using a 10% HCl acid-rinsed, hand-deployed 5 L Niskin bottle at ~10 m depth from a single location adjacent to kelp beds and ~200 m offshore from Hopkins Marine Station (Stanford University). Sampled water was homogenized by mixing and combining into 10% HCl acid-rinsed carboys. The 45 L sample was divided into fifths and each 9 L volume assigned to one of five different 47 mm diameter filter membrane types: Polyvinylidene difluoride (PVDF, 0.2 μm, Fisher Scientific, SVHV 010 RS), Polyethersulfone (PES, 0.2 μm, Sterlitech Corporation, PES0247100), Nitrocellulose (NC, 0.2 μm, Millipore, GSWP4700), Polycarbonate Track Etch (PCTE, 0.2 μm, Sterlitech Corporation, PCT0247100), and Glass microfiber filter (GFF, 0.7 μm, Whatman, 28418314; Figure 1). The 1 L aliquots were vacuum-filtered through each filter type (n = 9 filters per filter type) and stored in 5 ml sterile transport tubes (E&K Scientific) at –80°C until DNA extraction (within 2 months). In parallel with sample filtering, 1 L of MilliQ water was filtered through a single filter of each type to serve as a filtration blank for monitoring contamination during the filtration process.
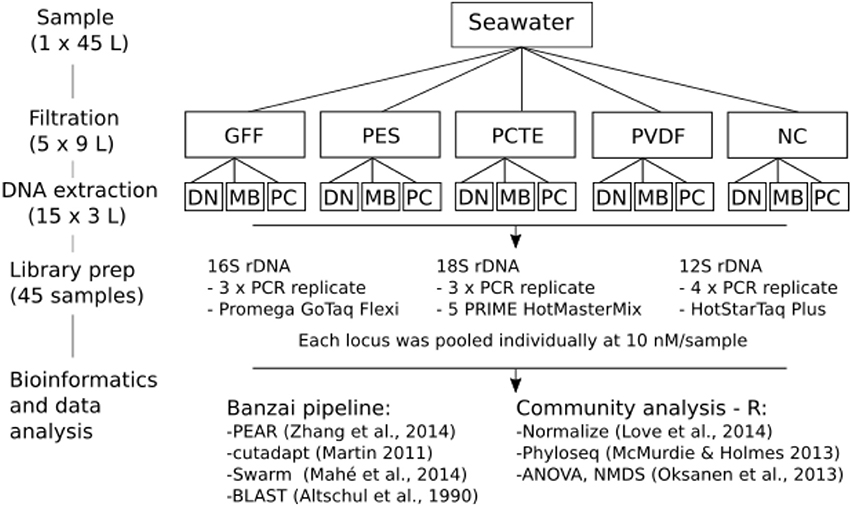
Figure 1. Schematic of sampling and laboratory protocols. Extraction protocols include DN: DNeasy Blood and Tissue Kit (DNeasy), MB: MoBio PowerWater DNA Isolation Kit (MoBio), and phenol/chloroform (PC). Amplification targeted different conserved gene regions for three taxonomic groups—16S rRNA gene: microorganisms, 18S rRNA gene: phytoplankton, and 12S rRNA gene: vertebrates. Community analysis was done in the statistical software R.
DNA Extraction
Each set of 9 filters of a given type was divided into three subsets and DNA was extracted from each subset (n = 3 filters) using the Qiagen DNeasy Blood and Tissue Kit (DNeasy), the MoBio PowerWater DNA Isolation Kit (MoBio), or the phenol/chloroform method (Ph-Ch; Figure 1). An extraction blank (i.e., the extraction method run using the methods outlined below but without a membrane filter) and a filtration blank (defined above) were included for each combination of filter type and extraction method. The GFF-MoBio treatment combination yielded no DNA and was omitted from further analyses.
DNeasy Blood and Tissue Kit
The DNeasy protocol was modified to include an initial bead-beating step whereby 1 g of 0.5 mm and 1 g of 0.1 mm glass beads (BioSpec Products) along with 900 μl ATL Buffer (Qiagen) were added to each filter tube. Before use, glass beads were sterilized by soaking in a 10% bleach solution for 20 min and rinsing at least three times with MilliQ water to remove the bleach. Beads were then dried by incubating overnight at 65°C. Tubes were shaken in a vortexer with a bead-beater adapter at maximum speed for 45 s, followed by incubation at 56°C for 30 min and a second round of bead-beating and incubation. Next, 100 μl of Proteinase K (2 mg/L final concentration) was added to each tube, vortexed for 10 s, and then incubated at 56°C for 2 h in a shaking incubator. Samples were then vortexed for 15 s and centrifuged for 1 min (4,000 × g). The supernatant from each tube (650–900 μl; volume dependent on the filter type) was transferred into a new 2 ml tube and centrifuged for 1 min at 13,000 × g. Then 650 μl of bead-free supernatant was transferred to a new 2 ml tube. Hereafter the manufacturer's protocol was followed with the following modifications: 650 μl AL Buffer, 650 μl ethanol, and final elution steps of 2 × 50 μl AE Buffer for each sample.
MoBio PowerWater DNA Isolation Kit
For the MoBio extraction, manufacturer's instructions were followed including a 5 min bead-beating step.
Phenol/Chloroform
The third extraction method was a Ph-Ch extraction; here 900 μl SDS buffer (10 mM Tris-HCl, 100 mM EDTA, 200 mM NaCl, 1% SDS) and 100 μl of lysozyme (1 mg/ml final conc.) were added to each filter tube and incubated at 37°C for 30 min (Sambrook and Russell, 2001; Corell and Rodríguez-Ezpeleta, 2014). Next, 50 μl proteinase K (~1 mg/ml, final conc.) was added to each tube and incubated overnight at 55°C in a shaking incubator (Boström et al., 2004; Corell and Rodríguez-Ezpeleta, 2014). Then, tubes were vortexed for 15 s and centrifuged at 4,000 × g for 1 min. One milliliter of the supernatant was transferred to a clean 2 ml tube, mixed with 1 ml of phenol/chloroform/isoamyl alcohol 25:24:1, vortexed for 5 s, and centrifuged at 12,000 × g for 10 min. The aqueous phase (800 μl) was transferred to a new 2 ml tube, mixed with 800 μl (one volume) of chloroform/isoamyl alcohol 24:1, vortexed for 5 s, and centrifuged at 12,000 × g for 10 min. The supernatant containing the DNA (650 μl) was mixed with 65 μl (1/10 volume) of 5 M NaCl and 1.3 ml (2 volumes) of 100% ethanol and incubated at –20°C overnight (Barnes et al., 2014; Deiner and Altermatt, 2014; Renshaw et al., 2015). Next, the DNA was isolated by centrifuging at 20,000 × g for 20 min at 4°C and the ethanol was poured out. Salts were removed by washing the pellet twice with 500 μl of 70% ethanol, centrifuging at 20,000 × g for 20 min at 4°C, and removing the ethanol. Once dried, the pellet was dissolved in 100 μl AE Buffer (Qiagen).
Quality Control of DNA Extractions
To account for the presence of inhibitory factors in seawater, DNA extracts were subsequently purified using One-step PCR inhibitor removal columns (Zymo Research; McKee et al., 2015). Subsequently, total DNA was quantified using a Qubit 2.0 Fluorometer and the Qubit dsDNA HS assay (Invitrogen, CA, USA). DNA extracts were divided into three aliquots and distributed to three separate research laboratories for marker-specific processing: 16S rRNA gene at the University of South Florida, 18S rRNA gene at the Monterey Bay Aquarium Research Institute, and the 12S rRNA gene at Stanford University. For the 12S rRNA gene analysis, we generated mock vertebrate communities to serve as positive controls for sequencing. The mock community represented a mix of total DNA extracts from tissues of ten species of bony fishes in equal concentrations (extractions performed with the Qiagen DNeasy Blood and Tissue Kit) as in Port et al. (2016).
PCR and Library Prep
DNA extracts were amplified with primer sets targeting different trophic levels (Table 1). The 16S rRNA gene was amplified from microbes, the 18S rRNA gene was amplified from phytoplankton, and a vertebrate-specific primer set was used to amplify the mitochondrial 12S rRNA gene of birds, fishes, and marine mammals. Sample-specific indexing, library preparation, and PCR profiles varied between the primer sets, utilizing previously optimized protocols for each gene as specified below. No attempts to standardize library preparation conditions were made because this study solely focused on determining the effects of filter-extraction combinations and not on comparing loci. In particular, the goal was to determine which filters and extraction methods would produce DNA of a sufficient quantity and quality to enable individual research groups, who each focused on a specific trophic level, to successfully analyze biodiversity through eDNA metabarcoding. Prior to sequencing, the PCR products for each gene were pooled into an equimolar concentration of 10 nM/sample to produce a similar sequencing depth per sample for accurate comparisons of results obtained from an equal amount of DNA. For samples with a concentration below detection limits (<0.5 ng/μl; i.e., negatives and extraction blanks), 3 μl of PCR product was used for the 16S rRNA and 18S rRNA genes, however for the 12S rRNA gene the entire volume was added. All sequencing was performed at the Stanford Functional Genomics Facility on an Illumina MiSeq platform using paired-end sequencing (Miseq Reagent kit v2) and a 20% PhiX174 spike-in control to improve the quality of low-diversity samples for 12S rRNA gene and 18S rRNA gene (Kircher et al., 2009); since the 16S rRNA gene captures diverse communities the addition of PhiX174 was lower (10%). Library construction for Illumina sequencing followed the KAPA low-throughput library prep kit with real-time library amplification protocol (KAPA Biosystems). Library size and concentration were assessed using a Bioanalyzer with the High Sensitivity DNA assay (Agilent Technologies).
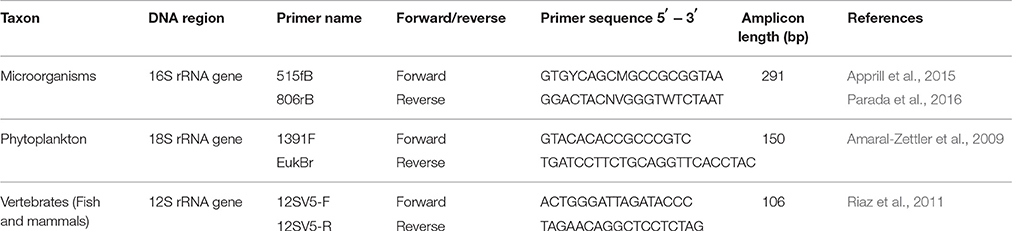
Table 1. List of primers used in this study.
Microorganisms (16S rRNA Gene)
Both forward (515fB) and reverse (806rB) primers for the 16S rRNA gene, targeting microorganisms, were tagged yielding dual-indexed reads (Kozich et al., 2013; Apprill et al., 2015; Parada et al., 2016; Table 1). PCR reactions were carried out in triplicate according to Apprill et al. (2015) with 1:10 dilutions on all extracts. Briefly, 1 μl DNA template was added to the master mix consisting of 14.75 μl sterile water, 5.0 μl 5X buffer AE (Qiagen), 0.5 μl dNTPs, 0.25 μl Taq polymerase (Promega GoTaq Flexi) and MgCl2 and 0.5 μl of each primer at a final concentration of 5 μM). Cycling parameters were 95°C for 2 min followed by 30 cycles of 95°C for 20 s, 55°C for 15 s, and 72°C for 5 min, and lastly 72°C for 10 min. The PCR products were run through a 1.5% agarose gel stained with ethidium bromide to confirm the presence of the targeted band and clean negative controls. All non-template controls (NTCs) and blanks were negative. PCR product concentrations were quantified using a Qubit dsDNA HS Assay Kit with a Qubit 3.0 Fluorometer according to the manufacturer's instructions.
Phytoplankton (18S rRNA Gene)
PCR reactions were run in triplicate 25 μl reactions for each sample using 12-basepair Golay barcoded reverse primers (Amaral-Zettler et al., 2009; Table 1). PCR reactions for the 18S rRNA gene were carried out using 1 μl DNA extract (no dilution), 10.0 μl 5 PRIME HotMasterMix (5 PRIME Inc, USA), 1 μl each of forward and reverse primers (final concentration 5 μM), 4 μl 10 μM mammalian blocking primer (Earth Microbiome Project; Vestheim and Jarman, 2008), and 8 μl molecular-biology grade water (Sigma-Aldrich). PCR reactions were run in 96-well plates with a NTC run in triplicate for each plate. Cycling parameters were 94°C for 3 min followed by 35 cycles of 94°C for 45 s, 65°C for 15 s, 57°C for 30 s, and a final step of 72°C for 90 s. The pooled PCR products were run through a 1.5% agarose gel stained with Gelgreen (Biotium Inc.) to confirm the presence of target bands and clean NTCs and absence of any non-specific amplification. All NTCs were negative. PCR products were purified and size selected using the Agencourt AMPure XP bead system (Beckman Coulter, USA). A second agarose gel was run to confirm primer removal and retention of target amplicons after purification. Purified products were then quantified using Quant-It Picogreen dsDNA Assay (Life Technologies) on an FMAX Molecular Devices Fluorometer with SoftMaxPro v1.3.1.
Vertebrates (12S rRNA Gene)
The forward and reverse 12S rRNA gene primers (Table 1; Riaz et al., 2011) were modified by the addition of sample-specific nucleotide tags on the 5′ ends to allow for the assignment of sequence reads to the correct sample during bioinformatic processing (Valentini et al., 2009). Tags were designed using the OLIGOTAG program (Coissac, 2012) with a Hamming distance of at least three bases between tags. Tags were preceded by NNN (De Barba et al., 2014) and the forward and reverse primers for a given sample had identical tags.
PCR reactions were carried out using 5 μl DNA template, 12.5 μl HotStarTaq Plus Master Mix (Qiagen), 1 μl of each primer (10 μM) and 5.5 μl molecular-biology grade water (Sigma-Aldrich). Cycling parameters were 95°C for 5 min followed by 40 cycles of 95°C for 15 s, 55°C for 30 s and 72°C for 30 s. Four replicate PCR assays were performed for each sample and then pooled. A negative control was included for each filter by extraction replicate to account for master mixes with different tagged primer sets. The pooled PCR products were run through a 1.5% agarose gel stained with ethidium bromide to confirm the presence of the 12S rRNA gene target band and clean NTCs and absence of any non-specific amplification. All NTCs were negative. PCR products were purified and size selected using the Agencourt AMPure XP bead system (Beckman Coulter) and then quantified using the Qubit 2.0 Fluorometer and the Qubit dsDNA HS Assay Kit (Invitrogen).
Two pools were prepared to allow the same tag to be sequenced more than once and subsequently de-multiplexed during data analysis.
Bioinformatics
All data from this study can be accessed from GenBank (SUB2901791). Sequence data were processed using a Unix shell script written to analyze Illumina-generated eDNA data (https://github.com/jimmyodonnell/banzai). This pipeline includes the following steps: merging of paired reads using PEAR v0.9.2 (Zhang et al., 2014), quality filtering with USEARCH (Edgar, 2010), demultiplexing by primer tag or library barcode with the programming language AWK, primer removal with cutadapt v.1.4.2 (Martin, 2011) allowing for no mismatches in the primer sequence, de-replication, singleton removal, Operational Taxonomic Unit (OTU) clustering using Swarm (Mahé et al., 2014), taxonomic annotation by nucleotide BLAST (BLASTN; Altschul et al., 1990) against a reference database (Table 2), and secondary taxonomic assignment using the lowest common ancestor (LCA) algorithm in MEGAN (Huson et al., 2007). Parameters for these programs were locus-specific (Table 2). To minimize the presence of chimeric sequences and tag jumping, only those reads containing the same tag sequence at both the 5′ and 3′ ends were retained (Schnell et al., 2015). For all primer sets, reads with homopolymers >7 bases were also omitted.
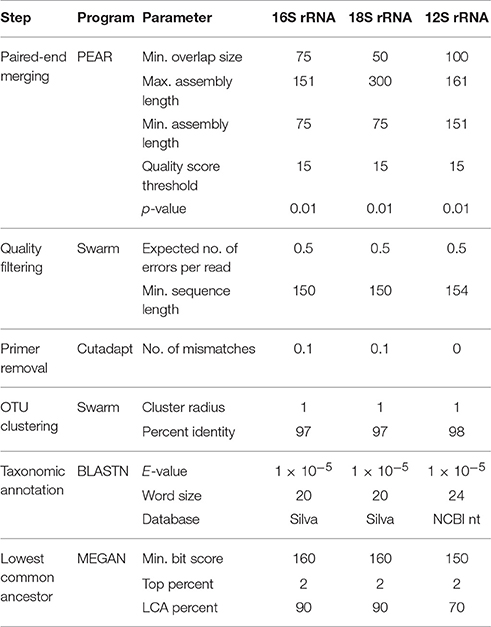
Table 2. Bioinformatic parameters used for data processing by primer set.
We further filtered the OTU tables using a suite of R scripts (https://github.com/marinebon/MBON). We removed putative contamination (cross-contamination among samples or contamination sourced from the field or lab) by calculating the maximum proportional representation of each OTU across all control samples [i.e., positive (mock community) and negative controls (Kelly et al., 2016)]. These OTU proportions were then subtracted from each OTU in the field samples.
Statistics
Sequence counts were normalized per locus with the R package DESEQ2 v1.6.2 (Love et al., 2014). This method accounts for differential sample depth (correcting for uneven numbers of reads per tag) and is appropriate for normalizing high-variance data sets from high-throughput sequencing (McMurdie and Holmes, 2014). All other statistical analyses were performed using the VEGAN package v2.2.0 in R (Oksanen et al., 2013). A binary version of the data set was created to determine species richness. Species richness was calculated by summing the number of taxa present per treatment (i.e., filter-type with DNA extraction combination) after data filtering, whereby a taxon was deemed present if its sequence was present in one or more of the three replicates per treatment. Prior to any statistical analyses the data were checked for a normal distribution with a Shapiro–Wilk test of normality. Analyses of variance (ANOVAs) followed by Tukey Honest Significant Difference (Tukey HSD) tests were performed to determine whether DNA concentration before amplification or species richness significantly differed across treatments. Non-metric multidimensional scaling (NMDS) was performed using the Bray-Curtis dissimilarity indices with the function metaMDS. The adonis function was used to parse the data according to the different treatments [permutational multivariate analysis of variance (PERMANOVA)]. For the heatmap the top 20 ranks were picked based on total abundance from all samples using the R package PHYLOSEQ (McMurdie and Holmes, 2013). The heatmap was plotted using the package “superheat” (Barter and Yu, 2015). All analyses were done using the statistical software R (R Development Team, 2009) and can be accessed on https://github.com/marinebon/MBON.
Results
DNA Yield
DNA yield was highly variable between the three different extraction methods, especially between different filter types extracted with the DNeasy Blood and Tissue Kit (DNeasy; Figure 2). The NC-DNeasy combination yielded the highest concentration of DNA of any method (34 ± 0.67 ng/μl) and GFF-MoBio PowerWater DNA Isolation Kit (MoBio) had the lowest yield (<0.5 ng/μl). Regardless of extraction method, the NC and PVDF filters yielded higher DNA concentrations than PCTE and GFF filters. The PES filter yielded the lowest DNA concentration for DNeasy but highest for MoBio and phenol/chloroform (Ph-Ch) extraction methods (Figure 2).
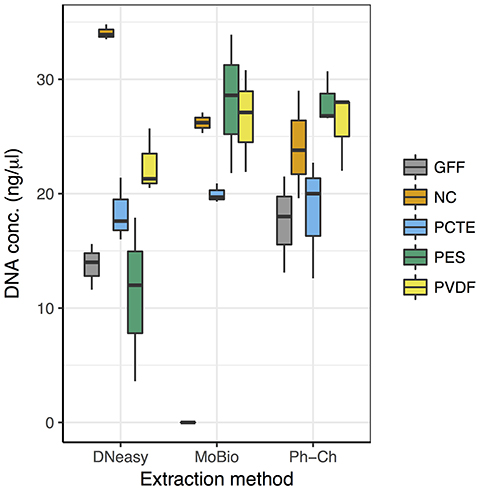
Figure 2. Distributions of DNA concentrations (ng/μl) in extractions obtained using the 15 different combinations of filter types and extraction methods. n = 3 for each box.
For DNeasy there was a statistically significant difference in DNA yield between NC and all other filter types, with NC-DNeasy having the highest DNA yield of all treatments. For MoBio there was a statistically significant difference between GFF and all other filters (Tukey HSD: adjusted p < 0.01) with GFF-MoBio yielding the lowest amount of DNA of all treatments. DNA yield between the filter types extracted with Ph-Ch was fairly uniform with no significant difference between the extractions from Ph-Ch (Figure 2).
OTU Richness and Community Structure
Microorganisms (16S rRNA Gene)
The average richness per sample of microbial communities as measured through 16S rRNA gene sequencing was 1,575 OTUs. The highest average richness was obtained from the PCTE-DNeasy combination and the lowest from the NC-MoBio combination (Figure 3 and Table 3); however, based on the ANOVA there was no significant difference in richness between any of the filter types or extraction methods for 16S rRNA gene (Figures S1, S2). Rank abundances between all extraction methods were similar and the dominant annotated OTU, SAR11, was the same between all filters and extraction methods (Figure 4).
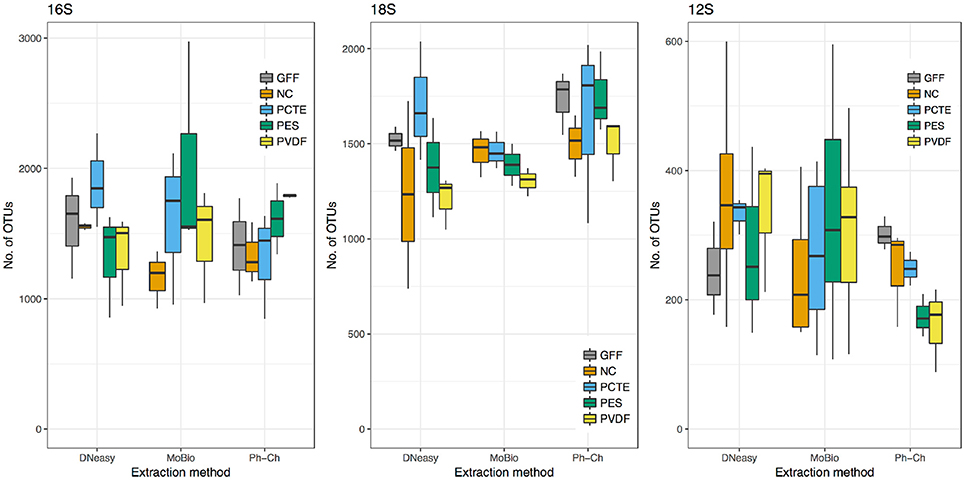
Figure 3. Distributions of the number of OTUs obtained for the 14 treatments (excluding GFF-MoBio which did not yield DNA) for the 16S rRNA gene (microbes), the 18S rRNA gene (phytoplankton), and the 12S rRNA gene (vertebrates). n = 3 for each box, note the difference in scales for each marker gene.
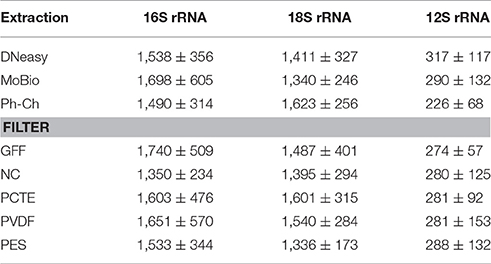
Table 3. Number of OTUs per treatment and genetic marker with their respective standard deviations.
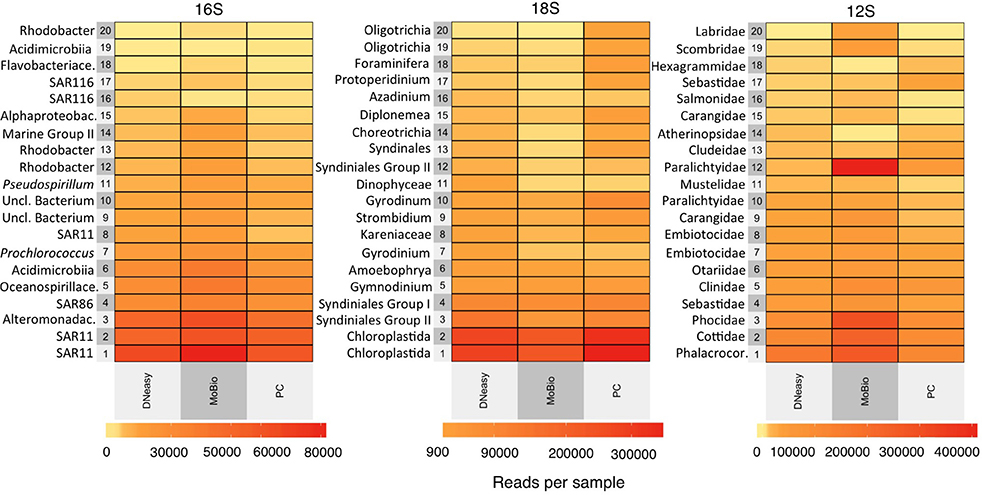
Figure 4. Differences in the top 20 most abundant OTUs obtained overall from the 16S rRNA gene, the 18S rRNA gene, and the 12S rRNA gene metabarcoding showing their relative abundance with the three different extraction methods [DNeasy Blood and Tissue Kit (DNeasy), MoBio PowerWater DNA Isolation Kit (MoBio), and phenol/chloroform (Ph-Ch)]. The relative abundance was calculated for all data (all filters combined) per extraction method. The taxonomy of the 20 most abundant OTUs visualized in the heatmap are specified on y-axis of each figure. The ranks are listed to the lowest taxonomic resolution possible.
Phytoplankton (18S rRNA Gene)
The average richness of phytoplankton communities as measured through 18S rRNA gene sequencing was 1,458 OTUs. The highest average richness was obtained from the PCTE- Ph-Ch combination (Figure 3 and Table 3) and the lowest from the NC-DNeasy combination. The differences between 18S rRNA gene richness are most notable between the MoBio and Ph-Ch extraction methods, with Ph-Ch yielding a significantly higher average richness than MoBio (Tukey HSD: p = 0.034; Figure 3 and Figure S1). There are fewer shifts in the rank abundance of dominant species between the DNeasy and MoBio extractions methods than between MoBio and Ph-Ch (Figure 4). This is also reflected in the NMDS analysis, as the phytoplankton community was significantly different between Ph-Ch and the other two extraction methods (PERMANOVA: df = 2, p = 0.0019). In addition, the filter membrane PCTE had a community structure that was significantly different from the other filter types on an OTU level (PERMANOVA: df = 4, p = 0.043). The top four highest ranked phytoplankton OTUs were the same between all extraction methods for this marker. The two most abundant OTUs were both annotated as Chloroplastida, and the third and fourth most abundant OTUs were annotated as Syndiniales group II and Syndiniales group I, respectively.
Vertebrates (12S rRNA Gene)
The average richness of vertebrate communities as measured through 12S rRNA gene sequencing was 277 OTUs distributed among 51 families (Table 3). The DNeasy-PVDF combination yielded the highest average richness and the PES-Ph-Ch combination yielded the lowest (Figure 3 and Table 3). The difference in richness was not significant between any pair of extraction method and filter type treatment combinations (Figure S1, S2). However, within Ph-Ch extractions, the filter types PVDF and GFF yielded statistically different numbers of OTUs (Tukey HSD: adjusted p = 0.039; Figure 3). There are a few variations in rank abundance between DNeasy, MoBio, and Ph-Ch extraction methods (Figure 4). The top five overall ranks (families: Phalacrocoracidae (cormorant), Cottidae (sculpins), Phocidae (earless seal), Sebastidae (rockfish), and Clinidae (blennies) (Figure 4) shift in order between the three extraction methods but remain the top five ranks for all treatments. There is one notable change between DNeasy and MoBio where the 12th ranked OTU (Paralichthyidae: Flounder) in the DNeasy extraction was the most abundant OTU in the MoBio extraction. The only significant difference in the total community structure on an OTU level appears between Ph-Ch and the other extraction methods (PERMANOVA, df = 2, p = 0.0039; Figure 5).
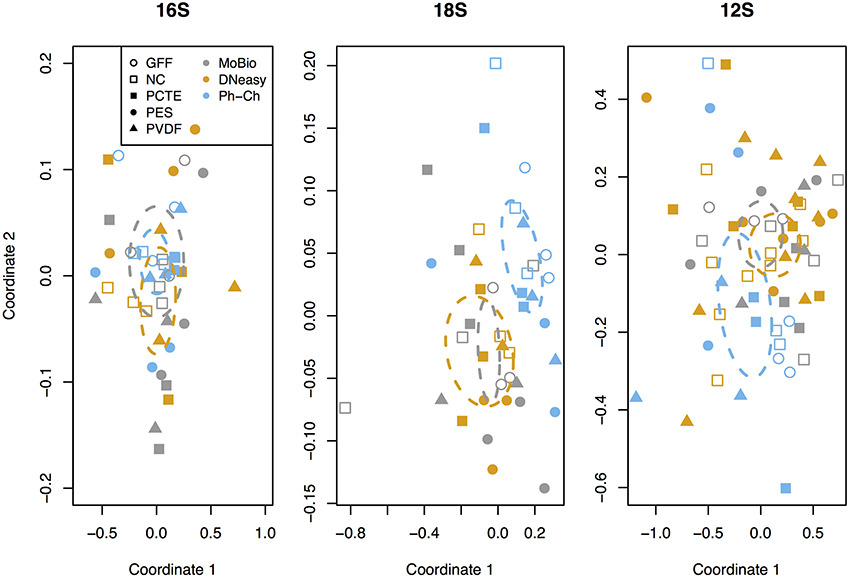
Figure 5. Non-metric multidimensional scaling plot (Bray-Curtis distance metric) for the sequences obtained for the three genetic markers (the 16S rRNA gene, the 18S rRNA gene, and the 12S rRNA gene). Filter types are indicated with different symbols and extraction methods with different colors. The community structure was significantly different between Ph-Ch (phenol/chloroform) and the other two extraction methods for the 12S rRNA gene and the 18S rRNA gene on an OTU level (PERMANOVA: p = 0.0039, df = 2, and p = 0.00199, df = 2, respectively). The ellipses indicate the 95% standard error of each extraction method (indicated by their individual colors).
Discussion
DNA Yield and Richness Differences between Treatments
In contrast to Pilliod et al. (2013) this study found differences in DNA yield and species richness between some of the different filter type and extraction treatment combinations. Overall, DNA extraction using the three techniques on samples collected on the 0.2 μm pore-size filters tested in this study (PCTE, NC, PES, PVDF) resulted in similar DNA yields and richness estimates across the three loci. The differences observed among 0.2 μm filters, although not statistically significant, could have resulted from biological heterogeneity. Although the total water-mass for collection was mixed thoroughly prior to filtration, patchiness could still occur (Port et al., 2016).
DNA yield from GFF filters was poor relative to other filters (Figure 2). The very low DNA recovery using the MoBio kit was likely due to the absorbance of lysis buffer by the GFF filters, which resulted in reduced lysate recovery volumes. However, another contributing factor to the lower DNA yield from GFF filters is that the effective pore size of GFF filters is 0.5 μm (Chavez et al., 1995), while the other filters tested were all 0.2 μm pore size and therefore would likely have captured more small particles. Environmental DNA ranges from 1 to 10 μm in size (Turner et al., 2014) and phytoplankton should be retained on all filters tested in this study; however, microorganisms are often smaller than 0.5 μm and would in some cases pass through filters with pore sizes larger than 0.2 μm (Azam and Godson, 1977; Rappé et al., 2002). An important conclusion of this study is that DNeasy or Ph-Ch extraction methods are more effective than MoBio for extracting DNA from GFF filters (Figure 2) and that these filters provide similar taxa richness to the other filters for all loci (Figure 3). These filters can be used for phytoplankton, zooplankton, and vertebrate eDNA but are not optimal for studies involving microorganisms as they may miss free-living small microorganisms or bias the community composition toward those associated with particles (DeLong et al., 1993).
OTU Community Structure with Treatment
Similar to the results of Kelly et al. (2017) each of our survey methods yielded a distinct set of organisms from the same location. DNeasy and MoBio extraction methods resulted in similar community compositions for both the 12S rRNA gene and the 18S rRNA gene that were different from those obtained with Ph-Ch (Figures 4, 5), suggesting that the Ph-Ch extraction method selects for or against certain organisms. The relationship between sequence abundance and cell abundance is not always straightforward and biases are inevitable in amplification and sequencing (Caporaso et al., 2012). For microorganisms there is a continuous progression of primer redesign to enhance the specificity and inclusiveness of amplification of the desired target region of the 16S rRNA gene and ensure that the amplified community reflects the initial community composition (Caporaso et al., 2011; Apprill et al., 2015; Parada et al., 2016). This effort has most likely improved the relatively conserved rank order of dominant OTUs observed amongst extraction methods in this study. In addition, the microbial cells targeted with the 16S rRNA gene primers are smaller and generally easier to lyse than individual plant cells, the targets of the 18S rRNA gene (Yuan et al., 2015). Some phytoplankton and plant cell walls are composed of cellulose (macroalgae) and silica formed into frustule (diatoms), which require manual lysis (i.e., bead beating) to break down the cell wall to release the cell's nucleic acids. The chemical lysis of the Ph-Ch extraction does not lyse cells as thoroughly as manual lysis (Yuan et al., 2015). For both MoBio and DNeasy we performed bead beating, which we suspect is the reason that these methods yield a different community structure than the Ph-Ch extraction. Therefore, Ph-Ch extraction is not recommended for cross-trophic level comparisons (Deiner et al., 2015; Yuan et al., 2015).
The MoBio kit is the most common extraction method recommended for large observation networks such as the Earth Microbiome Project (EMP) and Ocean Sampling Day (OSD; Gilbert et al., 2011). Since MoBio achieved good DNA yield for most of the filter types (except GFF) and comparable richness estimates for all genetic markers, this extraction method is appropriate for cross-trophic level analyses. In addition, the MoBio method is less time consuming compared to DNeasy and does not require manual filling of tubes with beads for bead beating. However, our results show that either DNeasy or MoBio with any of the 0.2 μm filter types (PCTE, PES, NC, and PVDF) will produce an OTU richness and community structure that enable cross-study comparisons.
The 12S rRNA gene is the least studied of the genetic markers used in this study (Port et al., 2016). Since there is limited information on the variability in sequencing data from this genetic marker, it is worth noting that the PVDF-DNeasy combination yielded the highest richness. This combination could be considered when designing a study focused on vertebrates or multiple trophic levels. The use of multiple primer sets per sample can be additionally informative as different genetic markers may not be equally applicable for phylogenetic vs. quantitative analyses due to primer and gene copy variation biases (Kelly et al., 2017).
As suggested by Rees et al. (2014), a direct comparison of filtration and extraction methods to monitor the effects of different processing methods on eDNA extraction and detection would be useful. This study lays the groundwork regarding acceptable sample collection, filtration, and DNA extraction methods for cross-trophic level eDNA analyses within emerging observation frameworks (e.g., MBON) to establish baselines and monitor changes in biodiversity over space and time in marine ecosystems.
In conclusion this study analyzed three different extraction methods with five different filter-types to investigate the variability in community structure of microbes, phytoplankton, and vertebrates using the 16S rRNA gene, the 18S rRNA gene, and the 12S rRNA gene metabarcoding data, respectively. Although variation was observed between the filter-extraction combinations, several combinations (DNeasy and MoBio extraction methods and all filter-types except GFF) produced comparably high DNA yield, richness, and community structure. Due to their larger pore size, GFF filters may not capture some small (<0.5 μm) organisms and are not recommended for cross-trophic level analyses that include microorganisms. In addition, GFF filters should not be used with the MoBio extraction kit due to low DNA yields. However, GFF filters extracted with the other methods yielded similar species richness results as the 0.2 μm filters, indicating that filters collected and archived for other purposes can provide valid results, especially when extracted with the DNeasy extraction kit.
The Ph-Ch extraction method resulted in a significantly different community structure compared to DNeasy and MoBio for the 18S rRNA gene and the 12S rRNA gene; thus it is not recommended for cross-trophic level analyses due to selection for/against certain organisms, probably because this method does not utilize bead beating. Extraction of DNA using either the DNeasy or MoBio kits from 0.2 μm filters composed of NC, PCTE, PES, and PVDF can be used to obtain statistically comparable results across multiple trophic levels, making them suitable for a one-size-fits-all approach to monitoring marine biodiversity through eDNA.
Data Accessibility
Data have been deposited to NCBI with the accession number SUB2901791.
Author Contributions
JP, AD, MB, FC, KY, and AB conceived the study. JP, OR, KW, and DG conducted sample collection and lab analyses. Data analysis was done by AD, JP, CC, RM, and KY. AD and JP drafted the manuscript. All authors revised and edited the manuscript.
Conflict of Interest Statement
The authors declare that the research was conducted in the absence of any commercial or financial relationships that could be construed as a potential conflict of interest.
Acknowledgments
The authors acknowledge Kate Hubbard, Enrique Montes-Herrera, and Natalie Sawaya for their constructive feedback on evaluating these methods and discussing the outcome. This work was supported by NASA grant NNX14AP62A “National Marine Sanctuaries as Sentinel Sites for a Demonstration Marine Biodiversity Observation Network (MBON)” funded under the National Ocean Partnership Program (NOPP RFP NOAA-NOS-IOOS-2014-2003803 in partnership between NOAA, BOEM, and NASA), and the U.S. Integrated Ocean Observing System (IOOS) Program Office.
Supplementary Material
The Supplementary Material for this article can be found online at: https://www.frontiersin.org/articles/10.3389/fmars.2017.00314/full#supplementary-material
References
Altschul, S. F., Gish, W., Miller, W., Myers, E. W., and Lipman, D. J. (1990). Basic local alignment search tool. J. Mol. Biol. 215, 403–410. doi: 10.1016/S0022-2836(05)80360-2
Amaral-Zettler, L. A., McCliment, E. A., Ducklow, H. W., and Huse, S. M. (2009). A method for studying protistan diversity using massively parallel sequencing of V9 hypervariable regions of small-subunit ribosomal RNA genes. PLoS ONE 4:e6372. doi: 10.1371/annotation/50c43133-0df5-4b8b-8975-8cc37d4f2f26
Apprill, A., McNally, S., Parsons, R., and Weber, L. (2015). Minor revision to V4 region SSU rRNA 806R gene primer greatly increases detection of SAR11 bacterioplankton. Aquat. Microb. Ecol. 75, 129–137. doi: 10.3354/ame01753
Aylagas, E., Borja, Á., Irigoien, X., and Rodríguez-Ezpeleta, N. (2016). Benchmarking DNA metabarcoding for biodiversity-based monitoring and assessment. Front. Mar. Sci. 3:1809. doi: 10.3389/fmars.2016.00096
Azam, F., and Godson, R. E. (1977). Size distribution and activity of marine microheterotrophs. Limnol. Oceangr. 22, 492–501. doi: 10.4319/lo.1977.22.3.0492
Barnes, M. A., Turner, C. R., Jerde, C. L., Renshaw, M. A., Chadderton, W. L., and Lodge, D. M. (2014). Environmental conditions influence eDNA persistence in aquatic systems. Environ. Sci. Technol. 48, 1819–1827. doi: 10.1021/es404734p
Barter, R. L., and Yu, B. (2015). Superheat: an R package for creating beautiful and extendable heatmaps for visualizing complex data. arXiv:1512.01524
Boström, K., Simu, K., Hagström, Å., and Riemann, L. (2004). Optimization of DNA extraction for quantitative marine bacterioplankton community analysis. Limnol. Oceanogr. Methods 2, 365–373. doi: 10.4319/lom.2004.2.365
Caporaso, J. G., Lauber, C. L., Walters, W. A., Berg-Lyons, D., Lozupone, C. A., Turnbaugh, P. J., et al. (2011). Global patterns of 16S rRNA diversity at a depth of millions of sequences per sample. Proc. Natl. Acad. Sci. U.S.A. 108(Suppl. 1), 4516–4522. doi: 10.1073/pnas.1000080107
Caporaso, J. G., Lauber, C. L., Walters, W. A., Berg-Lyons, D., Huntley, J., Fierer, N., et al. (2012). Ultra-high-throughput microbial community analysis on the Illumina HiSeq and MiSeq platforms. ISME 6, 1621–1624. doi: 10.1038/ismej.2012.8
Cermeño, P., de Vargas, C., Abrantes, F., and Falkowski, P. G. (2010). Phytoplankton biogeography and community stability in the ocean. PLoS ONE 5:e10037. doi: 10.1371/journal.pone.0010037
Chavez, F. P., Buck, K. R., Bidigare, R. R., Karl, D. M., Hebel, D., Latasa, M., et al. (1995). On the chlorophyll a retention properties of glass-fiber GF/F filters. Limnol. Oceangr. 40, 428–433. doi: 10.4319/lo.1995.40.2.0428
Coissac, E. (2012). OligoTag: a program for designing sets of tags for next-generation sequencing of multiplexed samples. Methods Mol. Biol. 888, 13–31. doi: 10.1007/978-1-61779-870-2_2
Corell, J., and Rodríguez-Ezpeleta, N. (2014). Tuning of protocols and marker selection to evaluate the diversity of zooplankton using metabarcoding. Rev. Invest. 21, 19–39.
De Barba, M., Miquel, C., Boyer, F., Mercier, C., Rioux, D., Coissac, E., et al. (2014). DNA metabarcoding multiplexing and validation of data accuracy for diet assessment: application to omnivorous diet. Mol. Ecol. Resour. 14, 306–323. doi: 10.1111/1755-0998.12188
Deiner, K., and Altermatt, F. (2014). Transport distance of invertebrate environmental DNA in a natural river. PLoS ONE 9:e88786. doi: 10.1371/journal.pone.0088786
Deiner, K., Walser, J.-C., Mächler, E., and Altermatt, F. (2015). Choice of capture and extraction methods affect detection of freshwater biodiversity from environmental DNA. Biol. Cons. 183, 53–63. doi: 10.1016/j.biocon.2014.11.018
DeLong, E. F., Franks, D. G., and Alldredge, A. L. (1993). Phylogenetic diversity of aggregate-attached vs. free-living marine bacterial assemblages. Limnol. Oceangr. 38, 924–934. doi: 10.4319/lo.1993.38.5.0924
Edgar, R. C. (2010). Search and clustering orders of magnitude faster than BLAST. Bioinformatics 26, 2460–2461. doi: 10.1093/bioinformatics/btq461
Foote, A. D., Thomsen, P. F., Sveegaard, S., Wahlberg, M., Kielgast, J., Kyhn, L. A., et al. (2012). Investigating the potential use of environmental DNA (eDNA) for genetic monitoring of marine mammals. PLoS ONE 7:e41781. doi: 10.1371/journal.pone.0041781
Gilbert, J. A., Bailey, M., Field, D., Fierer, N., Fuhrman, J. A., Hu, B., et al. (2011). The earth microbiome project: the meeting report for the 1st international earth microbiome project conference, Shenzhen, China, June 13th-15th 2011. Stand. Genomic Sci. 5, 243–247. doi: 10.4056/sigs.2134923
Hugenholtz, P., Goebel, B. M., and Pace, N. R. (1998). Impact of culture-independent studies on the emerging phylogenetic view of bacterial diversity. J. Bacteriol. 180, 4765–4774.
Huson, D. H., Auch, A. F., Qi, J., and Schuster, S. C. (2007). MEGAN analysis of metagenomic data. Genome Res. 17, 377–386. doi: 10.1101/gr.5969107
Kelly, R. P., O'Donnell, J. L., Lowell, N. C., Shelton, A. O., Samhouri, J. F., Hennessey, S. M., et al. (2016). Genetic signatures of ecological diversity along an urbanization gradient. PeerJ 4:e2444. doi: 10.7717/peerj.2444
Kelly, R. P., Closek, C. J., O'Donnell, J. L., Kralj, J. E., Shelton, A. O., and Samhouri, J. F. (2017). $Genetic and manual survey methods yield different and complementary views of an ecosystem. Front. Mar. Sci. 3:283. doi: 10.3389/fmars.2016.00283
Kircher, M., Stenzel, U., and Kelso, J. (2009). Improved base calling for the Illumina Genome Analyzer using machine learning strategies. Genome Biol. 10:R83. doi: 10.1186/gb-2009-10-8-r83
Klymus, K. E., Richter, C. A., Chapman, D. C., and Paukert, C. (2015). Quantification of eDNA shedding rates from invasive bighead carp Hypophthalmichthys nobilis and silver carp Hypophthalmichthys molitrix. Biol. Cons. 183, 77–84. doi: 10.1016/j.biocon.2014.11.020
Kozich, J. J., Westcott, S. L., Baxter, N. T., Highlander, S. K., and Schloss, P. D. (2013). Development of a dual-index sequencing strategy and curation pipeline for analyzing amplicon sequence data on the MiSeq Illumina sequencing platform. Appl. Environ. Microbiol. 79, 5112–5120. doi: 10.1128/AEM.01043-13
Lakay, F. M., Botha, A., and Prior, B. A. (2006). Comparative analysis of environmental DNA extraction and purification methods from different humic acid-rich soils. J. Appl. Microbiol. 102, 265–273. doi: 10.1111/j.1365-2672.2006.03052.x
Love, M., Huber, W., and Anders, S. (2014). Moderated estimation of fold change and dispersion for RNA-seq data with DESeq2. Genome Biol. 15:550. doi: 10.1186/s13059-014-0550-8
Machida, R. J., Hashiguchi, Y., Nishida, M., and Nishida, S. (2009). Zooplankton diversity analysis through single-gene sequencing of a community sample. BMC Genomics 10:438. doi: 10.1186/1471-2164-10-438
Mahé, F., Rognes, T., Quince, C., de Vargas, C., and Dunthorn, M. (2014). Swarm: robust and fast clustering method for amplicon-based studies. PeerJ 2:e593. doi: 10.7717/peerj.593
Martin, M. (2011). Cutadapt removes adapter sequences from high-throughput sequencing reads. EMBnet J. 17:10. doi: 10.14806/ej.17.1.200
McKee, A. M., Spear, S. F., and Pierson, T. W. (2015). The effect of dilution and the use of a post-extraction nucleic acid purification column on the accuracy, precision, and inhibition of environmental DNA samples. Biol. Cons. 183, 70–76. doi: 10.1016/j.biocon.2014.11.031
McMurdie, P. J., and Holmes, S. (2013). phyloseq: an R package for reproducible interactive analysis and graphics of microbiome census data. PLoS ONE 8:e61217. doi: 10.1371/journal.pone.0061217
McMurdie, P. J., and Holmes, S. (2014). Waste not, want not: why rarefying microbiome data is inadmissible. PLoS Comput. Biol. 10:e1003531. doi: 10.1371/journal.pcbi.1003531
Oksanen, J., Blanchet, F. G., Kindt, R., and Legendre, P. (2013). Vegan: Community Ecology. R Package Version 1.18-28/r1569.
Pace, N. R., Stahl, D. A., Lane, D. J., and Olsen, G. J. (1985). Analyzing natural microbial populations by rRNA sequences. ASM News 51, 4–12.
Pace, N. R. (1997). A molecular view of microbial diversity and the biosphere. Science 276, 734–740. doi: 10.1126/science.276.5313.734
Parada, A. E., Needham, D. M., and Fuhrman, J. A. (2016). Every base matters: assessing small subunit rRNA primers for marine microbiomes with mock communities, time series and global field samples. Environ. Microbiol. 18, 1403–1414. doi: 10.1111/1462-2920.13023
Pilliod, D. S., Goldberg, C. S., Arkle, R. S., and Waits, L. P. (2013). Estimating occupancy and abundance of stream amphibians using environmental DNA from filtered water samples. Can. J. Fish. Aquat. Sci. 70, 1123–1130. doi: 10.1139/cjfas-2013-0047
Port, J. A., O'Donnell, J. L., Romero-Maraccini, O. C., Leary, P. R., Litvin, S. Y., Nickols, K. J., et al. (2016). Assessing vertebrate biodiversity in a kelp forest ecosystem using environmental DNA. Mol. Ecol. 25, 527–541. doi: 10.1111/mec.13481
R Development Team (2009). R: A Language and Environment for Statistical Computing. Vienna: R Foundation for Statistical Computing. Available online at: http://www.R-project.org
Rappé, M. S., Connon, S. A., Vergin, K. L., and Giovannoni, S. J. (2002). Cultivation of the ubiquitous SAR11 marine bacterioplankton clade. Nature 418, 630–633. doi: 10.1038/nature00917
Rees, H. C., Maddison, B. C., Middleditch, D. J., Patmore, J. R. M., and Gough, K. C. (2014). REVIEW: The detection of aquatic animal species using environmental DNA – a review of eDNA as a survey tool in ecology. J. Appl. Ecol. 51, 1450–1459. doi: 10.1111/1365-2664.12306
Renshaw, M. A., Olds, B. P., Jerde, C. L., McVeigh, M. M., and Lodge, D. M. (2015). The room temperature preservation of filtered environmental DNA samples and assimilation into a phenol-chloroform-isoamyl alcohol DNA extraction. Mol. Ecol. Resour. 15, 168–176. doi: 10.1111/1755-0998.12281
Riaz, T., Shehzad, W., Viari, A., Pompanon, F., Taberlet, P., and Coissac, E. (2011). ecoPrimers: inference of new DNA barcode markers from whole genome sequence analysis. Nucleic Acids Res. 39, e145–e145. doi: 10.1093/nar/gkr732
Roh, C., Villatte, F., Kim, B.-G., and Schmid, R. D. (2006). Comparative study of methods for extraction and purification of environmental DNA from soil and sludge samples. Appl. Biochem. Biotechnol. 134, 97–112. doi: 10.1385/ABAB:134:2:97
Sambrook, J. F., and Russell, D. W. (eds.). (2001). Molecular Cloning: A Laboratory Manual, 3rd Edn. Vol. 1. Cold Spring Harbor, NY: Cold Spring Harbor Laboratory Press.
Schnell, I. B., Bohmann, K., and Gilbert, M. T. (2015). Tag jumps illuminated - reducing sequence-to-sample misidentifications in metabarcoding studies. Mol. Ecol. Resour. 15, 1289–1303. doi: 10.1111/1755-0998.12402
Thomsen, P. F., and Willerslev, E. (2015). Environmental DNA – An emerging tool in conservation for monitoring past and present biodiversity. Biol. Cons. 183, 4–18. doi: 10.1016/j.biocon.2014.11.019
Thomsen, P. F., Kielgast, J., Iversen, L. L., Møller, P. R., Rasmussen, M., and Willerslev, E. (2012). Detection of a diverse marine fish fauna using environmental DNA from seawater samples. PLoS ONE 7:e41732. doi: 10.1371/journal.pone.0041732
Turner, C. R., Miller, D. J., Coyne, K. J., and Corush, J. (2014). Improved methods for capture, extraction, and quantitative assay of environmental DNA from Asian bigheaded carp (Hypophthalmichthys spp.). PLoS ONE 9:e114329. doi: 10.1371/journal.pone.0114329
Valentini, A., Miquel, C., Nawaz, M. A., Bellemain, E., Coissac, E., Pompanon, F., et al. (2009). New perspectives in diet analysis based on DNA barcoding and parallel pyrosequencing: the trnL approach. Mol. Ecol. Resour. 9, 51–60. doi: 10.1111/j.1755-0998.2008.02352.x
Vestheim, H., and Jarman, S. N. (2008). Blocking primers to enhance PCR amplification of rare sequences in mixed samples – a case study on prey DNA in Antarctic krill stomachs. Front. Zool. 5:12. doi: 10.1186/1742-9994-5-12
Wu, G. D., Lewis, J. D., Hoffmann, C., Chen, Y.-Y., Knight, R., Bittinger, K., et al. (2010). Sampling and pyrosequencing methods for characterizing bacterial communities in the human gut using 16S sequence tags. BMC Microbiol. 10:206. doi: 10.1186/1471-2180-10-206
Yu, D. W., Ji, Y., Emerson, B. C., Wang, X., Ye, C., Yang, C., et al. (2012). Biodiversity soup: metabarcoding of arthropods for rapid biodiversity assessment and biomonitoring. Methods Ecol. Evol. 3, 613–623. doi: 10.1111/j.2041-210X.2012.00198.x
Yuan, J., Li, M., and Lin, S. (2015). An improved DNA extraction method for efficient and quantitative recovery of phytoplankton diversity in natural assemblages. PLoS ONE 10:e0133060. doi: 10.1371/journal.pone.0133060
Keywords: environmental DNA, microorganisms, vertebrates, phytoplankton, trophic levels, marine ecosystems, biodiversity
Citation: Djurhuus A, Port J, Closek CJ, Yamahara KM, Romero-Maraccini O, Walz KR, Goldsmith DB, Michisaki R, Breitbart M, Boehm AB and Chavez FP (2017) Evaluation of Filtration and DNA Extraction Methods for Environmental DNA Biodiversity Assessments across Multiple Trophic Levels. Front. Mar. Sci. 4:314. doi: 10.3389/fmars.2017.00314
Received: 23 July 2017; Accepted: 15 September 2017;
Published: 13 October 2017.
Edited by:
Christian Robert Voolstra, King Abdullah University of Science and Technology, Saudi ArabiaReviewed by:
Luke Thompson, Southwest Fisheries Science Center (NOAA), United StatesEmre Keskin, Ankara University, Turkey
Copyright © 2017 Djurhuus, Port, Closek, Yamahara, Romero-Maraccini, Walz, Goldsmith, Michisaki, Breitbart, Boehm and Chavez. This is an open-access article distributed under the terms of the Creative Commons Attribution License (CC BY). The use, distribution or reproduction in other forums is permitted, provided the original author(s) or licensor are credited and that the original publication in this journal is cited, in accordance with accepted academic practice. No use, distribution or reproduction is permitted which does not comply with these terms.
*Correspondence: Anni Djurhuus, YW5uaS5kanVyaHV1c0BnbWFpbC5jb20=