 Julia Gulka
 Paloma C. Carvalho
 Edward Jenkins
 Kelsey Johnson
 Laurie Maynard
 Gail K. Davoren
- Department of Biological Sciences, University of Manitoba, Winnipeg, MB, Canada
Understanding species interactions among top marine predators and interactions with their prey can provide important insight into community-level responses to changing prey availability and the role of apex predators as indicators of ecosystem change. On the northeast Newfoundland coast, marine predators rely on capelin (Mallotus villosus), a dominant forage fish, as a food source. Capelin migrate into coastal regions to spawn during July, essentially transforming the food supply from low during early summer (i.e., pre-spawning) to high later in the summer (i.e., spawning). During July-August, 2016, we used stable isotopic ratios of nitrogen (δ15N) and carbon (δ13C) to investigate shifts in dietary niche metrics at the predator group-level (trophic position, dietary niche breadth) and community-level (niche overlap, trophic diversity) for multiple marine predators under varying capelin availability. Predator groups included non-breeding shearwaters (great shearwater Ardenna gravis, sooty shearwater A. grisea), humpback whales (Megaptera novaeangliae), and gull chicks (herring gull Larus argentatus, great black-backed gull Larus marinus). We also tested the sensitivity of community-level dietary metrics to a variety of published trophic discrimination factors. Tissue samples from shearwaters (blood cellular component), gull chicks (whole blood), and whales (skin), representing average diets over 2–3 weeks, were collected during three periods (early, mid, late) corresponding to increasing capelin availability. Isotopic niche breadth (Standard Ellipse Area, SEAb) narrowed and trophic position shifted toward higher δ15N for all predator groups as capelin availability increased, suggesting a higher reliance on capelin. Trophic diversity (distance to centroid) decreased with increased capelin availability, while pairwise niche overlap between predator groups was highly variable and sensitive to trophic discrimination factors. Findings suggest that although capelin is the dominant forage fish during the summer, predators rely on capelin as prey to varying degrees. Combining species- and community-level metrics of dietary niche and trophic diversity may provide a more complete picture of predator responses to prey availability and, thus, may be important monitoring tools to indicate changes in the food supply of marine predators.
Introduction
Understanding the complexities underlying the structure and function of marine ecosystems and the impacts of anthropogenic factors, specifically fisheries activities, are key challenges in marine ecology (Moreno et al., 2016). With global-scale overexploitation of large predatory fish (Myers and Worm, 2003, 2005), lower trophic levels (e.g., forage fish species) are increasingly targeted for commercial harvest (Pauly et al., 1998; Essington et al., 2006). Indeed, forage fish now comprise more than one-third of the world's marine fish catch (Smith et al., 2011; Pikitch et al., 2012). The impact on higher trophic levels of marine food webs under wasp-waist control are of particular concern, as significant amounts of energy are funneled through only a few forage fish species (Smith et al., 2011; Pikitch et al., 2012).
As predators are sensitive to changes in prey availability (Piatt et al., 2007; Cury et al., 2011), they may act as sentinels or indicators of ecosystem change (Cairns, 1987; Diamond and Devlin, 2003). Which predator species serve as qualitative and/or quantitative indicators, however, requires an understanding of the aspects of predator biology (e.g., foraging behavior, diet, breeding success) that respond quickly to changes in the prey base (Cairns, 1987), and aspects of prey availability (e.g., abundance, accessibility) that elicit predator responses (Grémillet and Charmantier, 2010). For seabirds, many parameters proposed as indicators exhibit non-linear relationships with prey availability (e.g., Piatt et al., 2007; Cury et al., 2011). Therefore, despite a growing literature of seabird responses to changing prey regimes, many challenges remain before using predators as indicators. Suggested approaches include incorporating multiple species and trophic levels along with multivariate approaches (Piatt et al., 2007).
As marine predator diets are easy and cheap to obtain relative to large-scale, ship-based fish surveys, using predator diets to indicate ecosystem changes remains in focus. Stable isotope analysis, primarily of carbon and nitrogen, has become an important technique to estimate the dietary niche of species (Newsome et al., 2007). Stable isotopic ratios of carbon (13C:12C) and nitrogen (15N:14N) within consumer tissues reflect those of their prey, providing a proxy of assimilated diet and reflecting both trophic position and foraging habitat (Perkins et al., 2014). A variety of niche metrics provide diverse insights, with niche position representing both prey types and trophic levels of prey consumed and niche breadth indicating the prey variety (Hutchinson, 1978). By examining multiple species simultaneously, single-species responses to shifts in prey availability can be extended to community-level responses (Bearhop et al., 2004), revealing variation in dietary niche overlap, or the degree of similarity in resource use, as well as trophic diversity and redundancy within a food web (Layman et al., 2007a). Additionally, multi-species studies allow comparisons of responses among generalist and specialist species, as indicated by dietary niche breadth. Overall, these studies provide a better understanding of potential competitive interactions and how these interactions may change with varying prey availability (Chesson and Kuang, 2008).
Comparing isotopic niche among phylogenetically different predator species, however, requires an understanding of trophic discrimination, or the degree to which isotopic ratios are changed during incorporation into consumer tissues, based on physiological factors, such as isotopic routing and fractionation (Caut et al., 2009). Trophic discrimination factors for most species are unknown, likely because controlled dietary studies of captive animals are required. Therefore, studies often use trophic discrimination factors from closely related species (Carle et al., 2014) or averages across different taxa (e.g., Steenweg et al., 2011; Ceia et al., 2012; Lavoie et al., 2012), despite many factors contributing to variation in trophic discrimination (e.g., prey type, age, breeding status, nutritional state, sex; Bond and Jones, 2009).
The goal of this study was to simultaneously investigate dietary niche dynamics of multiple marine predators both at the species- and community-level, to determine whether these metrics can indicate changes in prey availability. In the northwest Atlantic, capelin (Mallotus villosus) is the dominant forage fish linking lower and upper trophic levels (Carscadden et al., 2002). Spawning capelin migrate inshore annually to spawn in coastal Newfoundland during July, where they overwhelm the prey base and transform the predator food supply from limited (i.e., pre-spawning) to unlimited (i.e., spawning; Davoren et al., 2012; Davoren, 2013a). Our study focused on dominant marine predators on the northeast Newfoundland coast (Davoren, 2013a), including three non-breeding species (great shearwater Ardenna gravis, sooty shearwater Ardenna grisea, humpback whale Megaptera novaeangliae) and two breeding species (herring gull Larus argentatus, great black-backed gull Larus marinus). Shearwaters and humpback whales arrive in coastal Newfoundland when capelin migrate inshore to spawn (Davoren, 2013a), suggesting possible reliance on capelin as prey. In contrast, breeding gulls in coastal Newfoundland consume a wide variety of prey species and are typically characterized as generalists at the population-level (Pierotti et al., 1991; Bond, 2016), but also exhibit dietary shifts under varying capelin availability (e.g., Stenhouse and Montevecchi, 1999; Massaro et al., 2000). Using isotopic niche as a proxy of dietary niche, we hypothesized that predator group-level dietary niche metrics (i.e., niche breadth, trophic position) as well as community-level niche metrics (i.e., niche overlap, trophic diversity) are influenced by varying capelin availability. First, we predicted that niche breadth of each predator group would shift from broad to narrow and trophic position would change to reflect an increased reliance on capelin as capelin availability changed from low during early July (i.e., pre-spawning) to high during late July-August (i.e., spawning). Second, we predicted that generalist predators (i.e., gulls) would exhibit a larger change in niche breadth relative to specialist predators (i.e., shearwaters, whales), if generalists shifted to a primarily capelin-based diet. Finally, we predicted higher dietary niche overlap between predators and lower trophic diversity of the predator community as capelin availability increased. As published trophic discrimination factors for our study species are not available, a secondary objective was to assess the sensitivity of community-level niche metrics to the discrimination factors used, by applying a variety of currently available trophic discrimination factors from closely related species. Overall, further elucidation of predator-prey interactions among marine top predators and forage fish, along with interactions among predators, under changing prey availability regimes, will provide insight into changes in key ecosystem processes (e.g., energy flow pathways) resulting from overexploiting forage fish.
Methods
Study Site and Field Methods
This study was conducted off the northeast coast of Newfoundland during July and August, 2016, in a region where annually persistent biological hotspots form near pre-spawning staging areas and spawning sites of capelin (Davoren, 2013a). From the pre-spawning staging area around Greenspond Island, capelin migrate northward ~20 km to spawn at sites around Gull Island within 1–2 days (Davoren, 2013b), with marine predators following the capelin north (Figure 1). During the study period, we sampled tissues from multiple marine predators, along with capelin and another prey fish species (sandlance, Ammodytes sp.) for stable isotope analysis. All research was approved by the University of Manitoba, Fort Garry Campus Animal Care Committee in accordance with the Canadian Council of Animal Care (protocol number: F16-017).
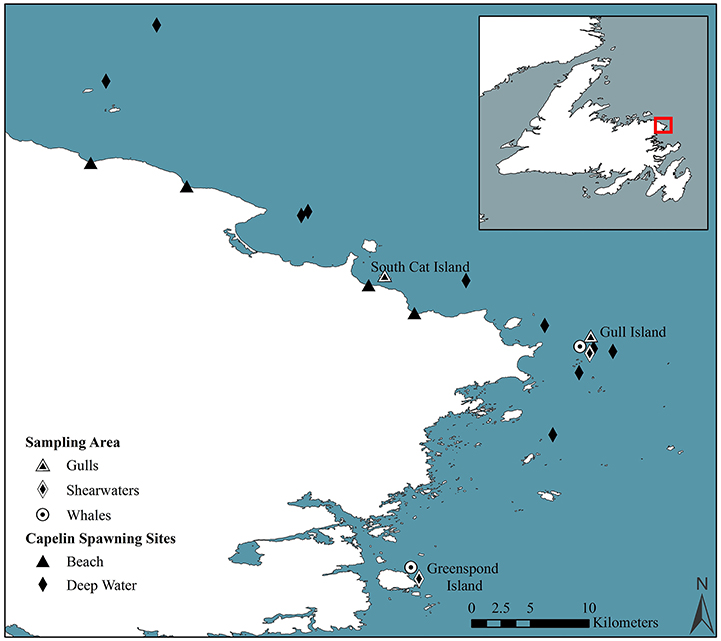
Figure 1. Map of study area on the northeastern Newfoundland coast, Canada indicating the location of the study area (box), the location of beach (black triangle) and deep-water (black diamond) spawning sites of capelin, along with sampling areas for gull chicks (triangle), shearwaters (diamond), and whales (circle).
First, gull chicks were hand-captured at breeding colonies on South Cat Island (49.307091°N 53.429359°W; n = 30) and Gull Island (49.256936°N 53.429359°W; n = 18; Figure 1). A few chicks were resampled throughout the season, but these repeat samples were excluded from analysis. Shearwaters were captured at sea nearby a capelin pre-spawning staging area (Greenspond Island; 49.071837°N 53.571453°W; n = 28) and spawning site (Gull Island; n = 20; Figure 1). Shearwaters form rafts on the sea surface at night and were captured using a spotlight and long-handled dip-net, similar to Ronconi et al. (2010b). Blood (1–2 mL) was sampled from gull chicks and adult shearwaters from the tarsal vein using a 25-gauge syringe. Blood samples from shearwaters were stored in EDTA tubes, kept on ice, and later centrifuged (<8 h) to separate plasma from the cellular component. In contrast, gull chick blood was placed in 2 mL plastic vials and frozen. For analysis, the cellular component of shearwater blood samples and whole blood of gull chicks were used. Whole blood and the cellular component have very similar stable isotopic ratios (Cherel et al., 2005), allowing direct comparison. Although, EDTA may affect the stable isotopic ratios of blood (Lemons et al., 2012), EDTA tends to stay in the plasma when blood is centrifuged, and thus the effect on the cellular component should be negligible (Käkelä et al., 2007). Humpback whale skin was sampled at sea nearby the capelin pre-spawning staging area (Greenspond Island; n = 18) and spawning sites (Gull Island; n = 12; Figure 1). Whale skin was biopsied from a small boat using a Matrix Grizzly crossbow (draw weight 200 lbs) following the methods described in Brown et al. (1995). All samples were frozen until analysis. All tissues sampled have similar tissue turnover rates (or half-life), estimated to be 2–3 weeks for shearwaters (cellular component; Barquete et al., 2013), gull chicks (whole blood; Bearhop et al., 2002; Ogden et al., 2004), and whales (skin; Todd, 1997; Browning et al., 2014).
The presence of spawning capelin in the study area was determined during the study period by monitoring persistently used beach and deep-water (15–40 m) spawning sites of capelin during July, following methods described in Crook et al. (2017). In brief, beach spawning sites were monitored to determine the presence of spawning capelin at night during high tide, while deep-water spawning sites were monitored by boat (commercial fishing vessel, Lady Easton) every 3–5 days. The period of capelin presence in the study area (i.e., high capelin availability) began when fish were first observed at spawning sites until fish were no longer observed. To compare predator stable isotopic ratios with those of capelin and the primary alternative prey fish species, sandlance, fish samples were collected opportunistically from fisherman at Greenspond Island, with fish collected from seine nets and sediment grabs near spawning sites around Gull Island (capelin: n = 15 sandlance: n = 8). Additional samples were collected using dip nets at spawning beaches (capelin: n = 7, sandlance: n = 2). After collection, ~1–2 g of dorsal muscle tissue was removed (without the skin), and stored in a 2 mL plastic vial and frozen.
Stable Isotope Analysis
Prior to analysis, all tissue samples were freeze-dried for 48 h (Haro et al., 2016) and then homogenized with a mortar and pestle. Owing to the high lipid content in whale skin and fish muscle, as indicated by C:N > 3.5, lipids were extracted from these samples to reduce biases resulting from 13C depletion of lipids (Post et al., 2007). Lipid extraction was conducted using petroleum ether in a Soxhlet for 8 h (Dobush et al., 1985). Samples were then oven dried for 48 h at 60°C (Witteveen et al., 2009). As the cellular component and whole blood of seabirds have a low lipid content (i.e., C:N < 3.5), lipid extraction from these samples was unnecessary (Post et al., 2007). A 0.400–0.600 mg subsample was removed from each dried and homogenized sample, sealed in a 5 × 9 mm tin capsule and placed in a plastic tray with labeled divides (Witteveen et al., 2009; Haro et al., 2016). Carbon and nitrogen isotopic ratios were quantified using a continuous flow mass spectrometer coupled with an elemental analyzer (University of Windsor, Ontario). Results are represented as ratios in δ notation of sample values relative to universal standards of Vienna Pee Dee Belemnite for carbon and atmospheric N2 for nitrogen (Bond and Jones, 2009). Precision assessed using the standard deviation of replicate analysis was ≤0.19‰ for δ15N and ≤0.17‰ for δ13C. Instrumental accuracy mean was ≤0.24‰ for δ15N and ≤0.06‰ for δ13C.
Data Analysis
To examine temporal shifts in species-specific and community-level dietary niche metrics, stable isotope samples were divided into three periods, representing averaged diet during overlapping periods, that correspond to low capelin availability (i.e., “early,” early-mid July) and high availability (i.e., “mid,” mid-late July; “late,” early-mid August) in the study area. Samples were divided into these three periods based on capelin presence/absence in the study area, sampling date of predator tissues and published tissue-specific turnover rates for each predator (Figure 2; Hobson et al., 1993; Todd, 1997). Due to similarity in isotopic ratios (Ronconi et al., 2010a), great and sooty shearwaters were grouped in the analysis, as were great black-backed and herring gull chicks. This resulted in comparing three predator groups (shearwaters, gulls, and whales) during three periods (early, mid, and late; Figure 2). Gull chicks fledged before the late period, thereby restricting analysis to shearwaters and whales during this period. As higher metabolism of gull chicks relative to adult shearwaters and whales likely influences their isotopic ratios (Bearhop et al., 2000), we did not directly compare isotopic ratios among predator groups, but rather changes in niche breadth over time within each predator group.
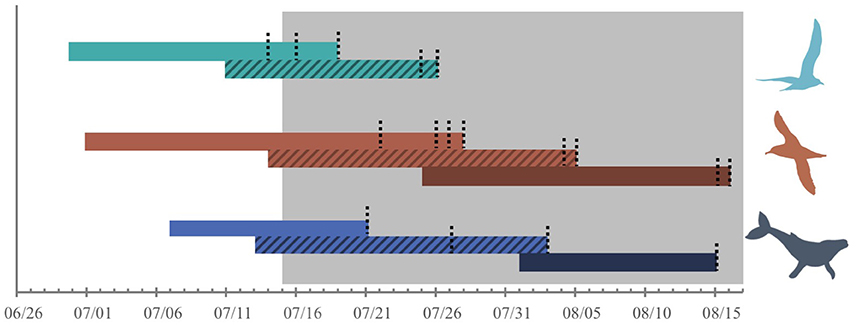
Figure 2. Periods over which diets were reflected by stable isotope samples of herring and great black-backed gull chicks (whole blood; green), great, and sooty shearwaters (blood cellular component; red), and humpback whales (skin; blue) based on tissue half-life of 2–3 weeks and sampling dates (black dotted lines). Samples from each species or predator group were divided into periods corresponding to low capelin availability (“early,” light bar) and high availability (“mid,” hatched bar; “late,” dark bar). Shading represents capelin presence in the study area.
Dietary niche breadth of each predator group within each period was quantified as the Standard Ellipse Area (SEA) of δ15N and δ13C using Stable Isotope Bayesian Ellipses (SIBER, Jackson et al., 2011) in R (R Core Team, 2016). While Standard Ellipse Areas corrected for small sample size (SEAc) are shown in isoplots and used for calculating dietary niche overlap and trophic diversity, analyses of niche breadth were run in the Bayesian framework (SEAb) to describe the range of possible values (posterior distribution). We use the mode of SEAb as an estimate of the most likely value of niche breadth for each predator group in each period. The δ15N of each predator group within each period was used as a proxy of trophic position and a linear regression was used to examine the relationship between trophic position and time (ordinal sampling date) for each predator group. Additionally, δ15N and δ13C were compared separately among periods (i.e., early, mid, late) for each predator group using one-way ANOVAs. To examine dietary niche position of predator groups in relation to capelin stable isotopic ratios, a best-fitting trophic discrimination factor was chosen for each group based on taxonomy and previous knowledge of diet. Values of 1.86‰ for δ15N and 0.46‰ δ13C for rockhopper penguins were applied to shearwater samples (Cherel et al., 2005), 3.1‰ for δ15N and −0.30‰ δ13C for ring-billed gull chicks (Hobson and Clark, 1992) were applied to gull chick samples, and 2.82‰ for δ15N and 1.28‰ δ13C for fin whales (Borrell et al., 2012) were applied to humpback whale samples.
To quantify dietary niche overlap between predator groups for each period, the percent overlap of the 95% probability ellipse area was used. While some studies have calculated niche overlap using the standard ellipse area, which represents ~40% of data points (i.e., isotopic ratios from 40% of individuals sampled), we used the 95% probability ellipse area (i.e., isotopic ratios from 95% of individuals sampled) to encompass the individual variation within predator groups. Overlap was then quantified using pairwise predator group comparisons with the following formula:
We also examined community-level dietary niche overlap by calculating mean distance to centroid as a proxy of the average isotopic (trophic) diversity of the community (Layman et al., 2007a), calculated from the communityMetricsML function in SIBER (Layman et al., 2007a). This function first calculates a community-wide centroid using the mean δ15N and δ13C for all individuals in the community and then calculates the average of the Euclidean distance from the centroid of each predator group to the community centroid. Mean trophic diversity values were compared among periods to examine quantitative and relative changes in trophic diversity over time. As there were no samples from gull chicks during the late period, this community analysis focused on early and mid periods when samples were available from all three predator groups.
To examine the sensitivity of values of community-level trophic diversity and pairwise niche overlap to different trophic discrimination factors, we quantified both metrics for all possible combinations of published discrimination factors that were relevant to our predator groups. Seven published discrimination factors were available for seabirds and three for cetaceans (Supplementary Table 1). An average of all trophic discrimination factors available was also calculated for cetaceans and seabirds separately and used in the analysis, similar to other studies that have used an average of multiple species when species-specific discrimination factors were not available (Steenweg et al., 2011; Lavoie et al., 2012). Including average values, there were three trophic discrimination values applied to gull chicks, five values applied to shearwaters, and five values applied to whales based on species taxonomy and ecology. As such, pairwise comparisons of dietary niche overlap using different discrimination factors between gulls and whales yielded 15 niche overlap values (5 × 3 values), shearwaters and whales yielded 25 niche overlap values (5 × 5 values), and shearwaters and gulls yielded 15 niche overlap values (5 × 3 values), for a total of 55 pairwise comparisons for each capelin availability period (i.e., early, mid), except the late period when gull chicks were not sampled. Additionally, comparisons of trophic diversity using these same discrimination factors resulted in 75 values (5 × 5 × 3 values) for the early and mid capelin availability periods.
Results
Mean δ15N ratios increased from early to mid and from mid to late periods for all predator groups, with decreasing variation for whales and gulls (Table 1). This trend was only significant for gull chicks [F(1, 49) = 28.611, p < 0.0001], however, but not for shearwaters [F(2, 47) = 2.958, p = 0.062] or whales [F(2, 29) = 2.3775, p = 0.112]. All predator groups showed an increase in δ15N with date, which was significant for gull chicks [F(1, 48) = 27.66, adjusted R2 = 0.3523, p < 0.01] and shearwaters [F(1, 46) = 4.84, adjusted R2 = 0.0755, p = 0.03], but not for whales [F(1, 28) = 3.33, adjusted R2 = 0.0743, p = 0.08]. Gulls had the largest increase in δ15N from early to mid periods, while whales exhibited the highest δ15N values of any group (Table 1). There was relatively little change in δ13C among periods, with no significant differences among periods for gull chicks [F(1, 49) = 0.001, p = 0.980], shearwaters [F(2, 47) = 2.477, p = 0.095] or whales [F(2, 29) = 0.751, p = 0.482]. Similarly, the change in δ13C with date was not significant for any predator group [gull chicks: F(1, 48) = 0.047, adjusted R2 = −0.02, p = 084; shearwaters: F(1, 46) = 3.77, adjusted R2 = 0.0557, p = 006; whales: F(1, 28) = 1.98, adjusted R2 = 0.0328, p = 0.17].
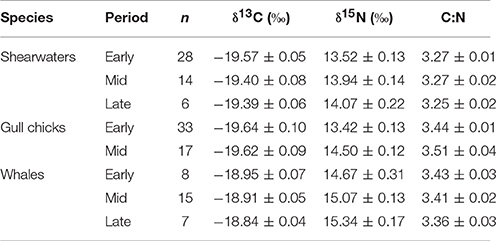
Table 1. Mean ± SE carbon (δ13C) and nitrogen (δ15N) stable isotopic ratios, sample size (n), and carbon:nitrogen (C:N) ratios for shearwaters (great and sooty; cellular component), gull chicks (herring and great black-backed; whole blood), and humpback whales (skin) during periods corresponding to low capelin availability (i.e., “early” is early-mid July) and high availability (i.e., “mid” is mid-late July; “late” is early-mid August).
Niche breadth narrowed from early to mid and late periods for all predator groups (Figures 3, 4), but to varying degrees. Based on Bayesian iterations, there was a high probability that SEAb decreased from early to mid periods for gull chicks (98.1%), whales (88.9%), and shearwaters (83.2%), as well as from mid to late period for whales (96.0%) and shearwaters (79.0%). In all cases, SEAb and SEAc showed the same pattern (Figure 3). Whales had the narrowest niche breadth during all periods, as indicated by the mode of SEAb (Figure 3), whereas gull chicks had the widest niche breadth and the greatest narrowing of breadth from early to mid sampling periods. Once data were corrected for trophic discrimination, there was a shift in dietary niche, resulting in a higher overlap with capelin stable isotopic ratios (Figure 4).
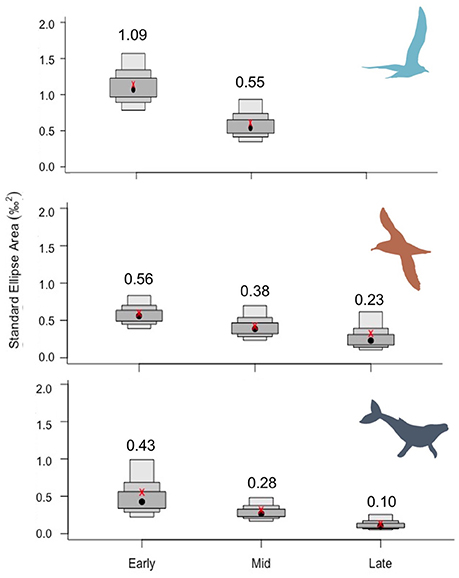
Figure 3. Shifts in dietary niche breadth among periods corresponding to low capelin availability (“early”) and high availability (“mid” and “late”) for herring and great black-backed gull chicks (Top), great, and sooty shearwaters (Middle) and humpback whales (Bottom) using a Bayesian framework. The mode of the standard ellipse area (SEAb) is indicated (black dot; numerical value given above), along with credible intervals, and standard ellipse area corrected for small sample size (SEAc, red x).
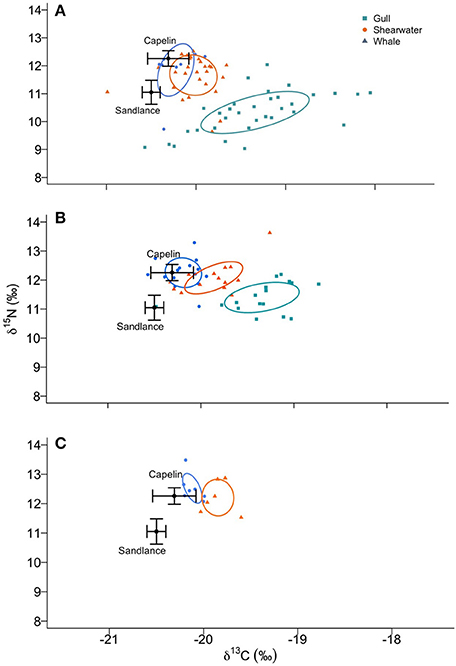
Figure 4. Shifts in dietary niche of herring and great black-backed gull chicks (green), great, and sooty shearwaters (red) and humpback whales (blue) during periods corresponding to low capelin availability (“early,” A) and high availability (“mid,” B; “late,” C). Ellipses represent SEAc, corrected using the most appropriate trophic discrimination factor. Capelin and sandlance isotopic ratios are represented as mean ± SD.
The sensitivity analysis examining the influence of trophic discrimination factors on the community-wide trophic diversity produced 75 trophic diversity measures per period (i.e., early, mid). Although the values of mean distance to centroid, used as a proxy of community trophic diversity, varied widely based on the trophic discrimination factor used for each predator group, 93.3% of the trophic diversity values decreased from the early (mean ± SE: 0.86 ± 0.03‰; range: 0.36–1.33‰) to the mid period (0.75 ± 0.03‰; range: 0.16–1.21‰), with a mean decline of 0.11 ± 0.01‰ between periods.
The sensitivity analysis examining the influence of trophic discrimination factors on pairwise predator group niche overlap produced 15–25 niche overlap values per period. Niche overlap values showed high sensitivity to trophic discrimination factors, ranging from 0.4 to 66.8% overlap between paired predator groups (Table 2). Overlap between shearwaters and whales decreased over time, whereas gull-whale overlap increased slightly and shearwater-gull overlap remained similar between periods (Table 2). All comparisons showed a great deal of variation depending on the trophic discrimination factor, in both range of values and proportion of values that yielded no overlap between predator groups (Table 2).
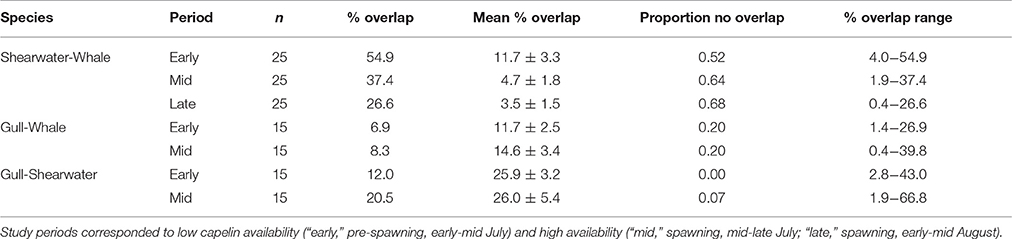
Table 2. Isotopic niche overlap between shearwaters (great and sooty), gull chicks (herring and great black-backed), and humpback whales based on 95% probability ellipse area of isotopic niche, indicating the number of niche overlap values produced from pairwise comparisons using all relevant discrimination factor values (n), % overlap based on chosen (i.e., most appropriate) trophic discrimination factor, mean ± SE % overlap of all pairwise comparisons, proportion of comparisons that showed no overlap, and the range of % overlap values that were non-zero for all comparisons.
Discussion
When capelin availability in the study area increased from early (early-mid July) to mid and late (mid-July to mid-August), all predator groups exhibited a narrowing of dietary niche breadth, indicating reduced prey diversity (Layman et al., 2007a). At the community-level, a similar pattern was found, with the relative change in mean trophic diversity (mean distance to centroid) decreasing from low (early) to high (mid) capelin availability periods. The reduction in dietary niche breadth and trophic diversity were also associated with an increasing trend in trophic position (i.e., δ15N). As basal resources likely did not vary over the short period (1–2 months) and spatial scale (<50 km) of this study, an increase in δ15N suggests that marine predators were feeding at a higher trophic level during the periods when capelin availability was high (mid and late) relative to low (early). This trophic level shift may reflect an increased dietary reliance on capelin, evidenced by isotopic ratios of all predators shifting to be more similar to capelin isotopic ratios. Although our sampling did not allow for diet reconstruction to confirm this reliance on capelin through mixing models (e.g., MixSIAR, Moore and Semmens, 2008) and it is possible that other prey species exhibit similar isotopic ratios, capelin dominates the mid trophic level in coastal Newfoundland when they arrive inshore to spawn, suggesting that the most likely interpretation is an increased reliance on capelin.
While many seabird studies have examined relationships between diet and prey availability, studies often focus on changes in the proportion of prey types in the diet (e.g., Ainley et al., 1996; Becker et al., 2007) and changes in the presence/absence of a particular prey type in the diet (e.g., Litzow et al., 2002; Thayer and Sydeman, 2007; Wanless et al., 2007), but often lack explicit information on changes in the variety of prey consumed (i.e., dietary niche). Additionally, many studies often lack independent, quantitative estimates of prey abundance (e.g., Scioscia et al., 2014; Webb and Harvey, 2014). Some studies, however, have shown similar narrowing of dietary niches under changing availability of key prey species. For instance, Kowalczyk et al. (2015) examined shifts in dietary niche breadth and trophic position of little penguins Eudyptula minor in a study area with a similar pulsed prey resource (spawning anchovy, Engraulis australis) and found that inter-annual variation in niche breadth was associated with fluctuations in the abundance of anchovy and other prey species. Similarly, multiple seabird species exhibited a wider and more omnivorous diet in years with lower fish abundance in Alaska (Baird, 1990). Marine mammals also are known to narrow their niche breadth in relation to ontogenetic-related accessibility of preferred prey (e.g., Yurkowski et al., 2016) and inter-annual increases in prey (e.g., Soto et al., 2006). At the community-level, trophic diversity decreased as forage fish availability increased in a suite of marine species in an Arctic food web (David Yurkowski, pers. comm.). When availability of main prey species decline, however, predator species with a narrow niche (i.e., specialists) may be unable to switch to other prey types (Martin, 1989) or may lack suitable alternative prey (Ainley et al., 1995; Layman et al., 2007b), leading to reduced breeding success and population declines.
While the dietary niches of all predator groups narrowed with increasing capelin availability, the degree of narrowing varied, suggesting differing reliance on capelin. As predicted, the niche breadth of gull chicks decreased more relative to other predator groups after capelin arrived in the study area, but remained broader than shearwaters and whales, suggesting that diet diversity remained relatively high. This supports previous findings that gulls are dietary generalists at the population-level (Fox et al., 1990; Pierotti and Annett, 1990; Steenweg et al., 2011; Ronconi et al., 2014). In our study, gull chicks also represented the only predator group whereby foraging (by parents) was constrained within range of the breeding colony (Orians and Pearson, 1979). When spatially constrained during breeding, gulls in coastal Newfoundland have shown dietary shifts in response to changing capelin availability within foraging ranges (Stenhouse and Montevecchi, 1999; Massaro et al., 2000). Such foraging range constraints could also explain the larger increase in δ15N for gull chicks as capelin availability increased compared to non-breeding species, given that non-breeding predators may be able to access capelin before capelin moves into gull foraging ranges. Therefore, the narrower dietary niches of non-breeding whales and shearwaters may result from their ability to forage over broader spatial scales as well as to continuously maintain contact with capelin patches, whereas parental gulls may lose track of capelin patches when returning to the colony to provision chicks, resulting in a more diverse chick diet.
Interestingly, humpback whales had the narrowest niche breadth of all predator groups, especially during the late period, which suggests a lower variety of prey in the diet and possibly a higher reliance on capelin. Although humpback whale diet in coastal Newfoundland has not been well-studied, limited dietary evidence suggests that their main prey type is capelin (Todd, 1997), which is corroborated by positive associations of whale and capelin abundance (Whitehead and Carscadden, 1985; Piatt et al., 1989). Similarly, non-breeding shearwaters congregate in coastal Newfoundland (Brown et al., 1981) and are associated with capelin spawning aggregations (Davoren, 2013a), suggesting that they rely on capelin as prey. Indeed, great and sooty shearwaters had a narrower niche breadth in years of higher relative capelin biomass (PCC unpubl. data). Overall, varying responses among predator groups provide insight into group-level reliance on capelin and, thus, potential sensitivity of each predator group to a reduction in capelin availability.
Measures of niche overlap among predator groups and community-level trophic diversity were sensitive to diet-tissue trophic discrimination factors. As these values were unavailable for our study species, we relied on published discrimination factors for other seabird and whale species. In pairwise comparisons, the degree of overlap was highly variable depending on the discrimination factor used, evidenced by niche overlap ranging from 0 to 67% between predator groups. In contrast to our prediction, niche overlap between predator groups decreased with increasing capelin availability, evidenced by the higher proportion of niche overlap values equal to zero (i.e., no niche overlap) along with lower or similar mean percent niche overlap as capelin shifted from low to high availability. Decreased niche overlap conflicts with our findings of decreasing trophic diversity and increasing trophic level as capelin availability increased, both of which suggest a shift to a more similar, likely capelin-based diet, among all predator groups. These divergent trends may result from dietary niche overlap being highly sensitivity to both varying niche breadth of predator groups and sample sizes among periods (Montevecchi et al., 2006), which are further exacerbated by the use of different trophic discrimination factors. Owing to the sensitivity of pairwise niche overlap, this metric does not appear to be a good tool to examine the influence of prey availability on marine predator interactions. In contrast, although values of mean trophic diversity varied with the trophic discrimination factor applied, the majority (93%) of trophic diversity values decreased between periods of low (early) and high (mid) capelin availability. As such, the change in mean trophic diversity proved useful and less sensitive to the trophic discrimination factor applied, thus revealing a clearer community-level response to varying prey availability along with potential changing interactions among predators.
In conclusion, trophic position, dietary niche breadth, and trophic diversity appear to be robust measures of both predator group-specific and community-level dietary niche responses to changing prey availability, and thus, may act as important monitoring tools. Indeed, narrowing of dietary niche and trophic diversity suggest that top predators exploited similar resources, thereby decreasing inter- and intraspecific niche variation and increasing trophic redundancy (Layman et al., 2007b). As stable isotope analyses provided a low effort, non-destructive method to capture an integrated view of the dietary niches of many species simultaneously, it provides a community-level view of dietary niche dynamics on multiple temporal scales. Our study and others (e.g., Bond and Jones, 2009), however, emphasize that using stable isotopes as a dietary tool requires calibration and careful consideration of factors (e.g., lipid extraction, discrimination factors) leading to appropriate interpretations of stable isotopic ratios. We recommend that future studies integrate independent, quantitative measures of prey availability with diets of many marine predators from multiple trophic levels to further increase our understanding of the degree to which dietary niche breadth of marine predators and community-level metrics of trophic diversity shift under varying prey regimes. Such multi-species approaches will provide insight into the realized niche of top predators, potential competitive interactions among predators, as well as how dietary niche metrics derived from stable isotopes might be used to indicate dynamics in forage fish abundance, energetic pathways in food webs, and marine ecosystem health.
Author Contributions
JG wrote the manuscript and worked with EJ to conduct the dietary niche overlap and community-level sensitivity analyses using different trophic discrimination factors. PC was responsible for shearwater blood sampling, sample preparation for stable isotope analysis and shearwater-specific data analysis. LM was responsible for gull blood sampling, sample preparation for stable isotope analysis and gull-specific data analysis. KJ was responsible for whale skin biopsying, sample preparation for stable isotope analysis and whale-specific data analysis. As the leader of the study, GD acquired funding for the project, led in the development of each predator-focused project, conceived of the collaborative manuscript and led the development of the manuscript. GD, PC, LM, KJ, EJ were all involved in determining appropriate data analyses, manuscript structure and editing/revising the manuscript.
Funding
Principal funding was provided by Natural Sciences and Engineering Research Council of Canada Discovery (2014-06290) and Ship Time Grants (486208-2016 to GD), along with a University of Manitoba Faculty of Science Fieldwork Support Program grant (2016) to GD. PC was funded by a Science without Border Scholarship, CAPES—Coordination for the Improvement of Higher Education Personnel (Grant No. 001203/2013-04). JG and LM were funded by Manitoba Graduate Scholarships.
Conflict of Interest Statement
The authors declare that the research was conducted in the absence of any commercial or financial relationships that could be construed as a potential conflict of interest.
The reviewer VHP and handling Editor declared their shared affiliation.
Acknowledgments
We are indebted to the captain and crew of the Lady Easton for their assistance with fieldwork. Thanks also to A. Loeppky for assistance with field work; R. Ronconi for assistance and collaboration in the field; and J. Roth and D. Yurkowski and the rest of the University of Manitoba Stable Isotope Discussion Group for providing guidance and feedback during data analysis.
Supplementary Material
The Supplementary Material for this article can be found online at: https://www.frontiersin.org/articles/10.3389/fmars.2017.00324/full#supplementary-material
References
Ainley, D. G., Spear, L. B., and Allen, S. G. (1996). Variation in the diet of Cassin's auklet reveals spatial, seasonal, and decadal occurrence patterns of euphausiids off California, USA. Mar. Ecol. Prog. Ser. 137, 1–10. doi: 10.3354/meps137001
Ainley, D. G., Sydeman, W. J., and Norton, J. (1995). Upper trophic level predators indicate interannual negative and positive anomalies in the California Current food web. Mar. Ecol. Prog. Ser. 118, 69–80. doi: 10.3354/meps118069
Baird, P. H. (1990). Influence of abiotic factors and prey distribution on diet and reproductive success of three seabird species in Alaska. Scand. J. Ornithol. 21, 224–235. doi: 10.2307/3676782
Barquete, V., Strauss, V., and Ryan, P. G. (2013). Stable isotope turnover in blood and claws: a case study in captive African Penguins. J. Exp. Mar. Bio. Ecol. 448, 121–127. doi: 10.1016/j.jembe.2013.06.021
Bearhop, S., Adams, C. E., Waldron, S., Fuller, R. A., and Macleod, H. (2004). Determining trophic niche width: a novel approach using stable isotope analysis. J. Anim. Ecol. 73, 1007–1012. doi: 10.1111/j.0021-8790.2004.00861.x
Bearhop, S., Teece, M. A., Waldron, S., and Furness, R. W. (2000). Influence of lipid and uric acid on δ 13 C and δ 15 N values of avian blood: implications for trophic studies. Auk 117, 504–507. doi: 10.1642/0004-8038(2000)117[0504:IOLAUA]2.0.CO;2
Bearhop, S., Waldron, S., Votier, S. C., and Furness, R. W. (2002). Factors that influence assimilation rates and fractionation of nitrogen and carbon stable isotopes in avian blood and feathers. Physiol. Biochem. Zool. 75, 451–458. doi: 10.1086/342800
Becker, B. H., Peery, M. Z., and Beissinger, S. R. (2007). Ocean climate and prey availability affect the trophic level and reproductive success of the marbled murrelet, an endangered seabird. Mar. Ecol. Prog. Ser. 329, 267–279. doi: 10.3354/meps329267
Bond, A. L. (2016). Diet Changes in Breeding Herring Gulls (Larus argentatus) in Witless Bay, Newfoundland and Labrador, Canada, over 40 Years. WaterbirdsSpecial Publ. 39, 152–158. doi: 10.1675/063.039.sp115
Bond, A. L., and Jones, I. L. (2009). A Practical introduction to stable-isotope analysis for seabird biologists : approaches, cautions and caveats. Mar. Ornithol. 37, 183–188.
Borrell, A., Abad-Oliva, N., Gõmez-Campos, E., Giménez, J., and Aguilar, A. (2012). Discrimination of stable isotopes in fin whale tissues and application to diet assessment in cetaceans. Rapid Commun. Mass Spectrom. 26, 1596–1602. doi: 10.1002/rcm.6267
Brown, M. R., Corkdron, P. J., Hale, P. T., Schultz, K. W., and Bryden, M. M. (1995). Evidence for a sex-segregated migration in the humpback whale (Megaptera novaeangliae). Proc. R. Soc. London Ser. B Biol. Sci. 259, 229–234. doi: 10.1098/rspb.1995.0034
Brown, R., Barker, S., Gaskin, B., and Sandeman, M. (1981). The foods of Great and Sooty Shearwaters Puffinus gravis and P. griseus in eastern Canadian waters. IBIS 123, 19–30. doi: 10.1111/j.1474-919X.1981.tb00169.x
Browning, N. E., Dold, C. I., Fan, J., and Worthy, G. A. J. (2014). Isotope turnover rates and diet-tissue discrimination in skin of ex situ bottlenose dolphins (Tursiops truncatus). J. Exp. Biol. 217, 214–221. doi: 10.1242/jeb.093963
Carle, R. D., Beck, J. N., Calleri, D. M., and Hester, M. M. (2014). Temporal and sex-specific variability in Rhinoceros Auklet diet in the central California Current system. J. Mar. Syst. 146, 99–108. doi: 10.1016/j.jmarsys.2014.08.020
Carscadden, J. E., Montevecchi, W. A., Davoren, G. K., and Nakashima, B. S. (2002). Trophic relationships among capelin (Mallotus villosus) and seabirds in a changing ecosystem. ICES J. Mar. Sci. 59, 1027–1033. doi: 10.1006/jmsc.2002.1235
Caut, S., Angulo, E., and Courchamp, F. (2009). Variation in discrimination factors (δ15N and δ13C): The effect of diet isotopic values and applications for diet reconstruction. J. Appl. Ecol. 46, 443–453. doi: 10.1111/j.1365-2664.2009.01620.x
Ceia, F. R., Phillips, R. A., Ramos, J. A., Cherel, Y., Vieira, R. P., Richard, P., et al. (2012). Short- and long-term consistency in the foraging niche of wandering albatrosses. Mar. Biol. 159, 1581–1591. doi: 10.1007/s00227-012-1946-1
Cherel, Y., Hobson, K. A., and Hassani, S. (2005). Isotopic discrimination between food and blood and feathers of captive penguins: implications for dietary studies in the wild. Physiol. Biochem. Zool. 78, 106–115. doi: 10.1086/425202
Chesson, P., and Kuang, J. J. (2008). The interaction between predation and competition. Nature 456, 235–238. doi: 10.1038/nature07248
Crook, K. A., Maxner, E., and Davoren, G. K. (2017). Temperature-based spawning habitat selection by capelin (Mallotus villosus) in Newfoundland. ICES J. Mar. Sci. 74, 1622–1629. doi: 10.1093/icesjms/fsx023
Cury, P. M., Boyd, I. L., Bonhommeau, S., Anker-Nilssen, T., Crawford, R. J. M., Furness, R. W., et al. (2011). Global seabird response to forage fish depletion - one-third for the birds. Science 334, 1703–1706. doi: 10.1126/science.1212928
Davoren, G. K. (2013a). Distribution of marine predator hotspots explained by persistent areas of prey. Mar. Biol. 160, 3043–3058. doi: 10.1007/s00227-013-2294-5
Davoren, G. K. (2013b). Divergent use of spawning habitat by male capelin (Mallotus villosus) in a warm and cold year. Behav. Ecol. 24, 152–161. doi: 10.1093/beheco/ars147
Davoren, G. K., Penton, P., Burke, C., and Montevecchi, W. A. (2012). Water temperature and timing of capelin spawning determin seabird diets. ICES J. Mar. Sci. 69, 1234–1241. doi: 10.1093/icesjms/fss032
Diamond, A. W., and Devlin, C. M. (2003). Seabirds as indicators of changes in marine ecosystems : ecological monitoring on machias seal island. Environ. Monit. Assess. 88, 153–175. doi: 10.1023/A:1025560805788
Dobush, G. R., Ankney, C. D., and Krementz, D. G. (1985). The effect of apparatus, extraction time, and solvent type on lipid extractions of snow geese. Can. J. Zool. 63, 1917–1920. doi: 10.1139/z85-285
Essington, T. E., Beaudreau, A. H., and Wiedenmann, J. (2006). Fishing through marine food webs. Proc. Natl. Acad. Sci. U.S.A. 103, 3171–3175. doi: 10.1073/pnas.0510964103
Fox, G. A., Allan, L. J., Weseloh, D. V., and Mineau, P. (1990). The diet of herring gulls during the nesting period in Canadian waters of the Great Lakes. Can. J. Zool. 68, 1075–1085. doi: 10.1139/z90-159
Grémillet, D., and Charmantier, A. (2010). Shifts in phenotypic plasticity constrain the value of seabirds as ecological indicators of marine ecosystems. Ecol. Appl. 20, 1498–1503. doi: 10.1890/09-1586.1
Haro, D., Riccialdelli, L., Acevedo, J., Aguayo-lobo, A., and Montiel, A. (2016). Trophic ecology of humpback whales (Megaptera novaeangliae) in the magellan strait as indicated by carbon and nitrogen stable isotopes. Aquat. Mamm. 42, 233–244. doi: 10.1578/AM.42.2.2016.233
Hobson, K. A., Clark, R. G., Auk, S. T., and Jul, N. (1993). Turnover of 13C in cellular and plasma fractions of blood: implications for nondestructive sampling in avian dietary studies. Auk 110, 638–641. doi: 10.2307/4088430
Hobson, K., and Clark, R. (1992). Assessing avian diets using stable isotopes I: turnover of 13C in tissues. Condor 94, 181–188. doi: 10.2307/1368807
Hutchinson, G. E. (1978). An Introduction to Population Biology. New Haven, CT: Yale University Press.
Jackson, A. L., Inger, R., Parnell, A. C., and Bearhop, S. (2011). Comparing isotopic niche widths among and within communities: SIBER - Stable Isotope Bayesian Ellipses in R. J. Anim. Ecol. 80, 595–602. doi: 10.1111/j.1365-2656.2011.01806.x
Käkelä, A., Furness, R. W., Kelly, A., Strandberg, U., Waldron, S., and Käkelä, R. (2007). Fatty acid signatures and stable isotopes as dietary indicators in North Sea seabirds. Mar. Ecol. Prog. Ser. 342, 291–301. doi: 10.3354/meps342291
Kowalczyk, N. D., Chiaradia, A., Preston, T. J., and Reina, R. D. (2015). Fine-scale dietary changes between the breeding and non-breeding diet of a resident seabird. R. Soc. Open Sci. 2:140291. doi: 10.1098/rsos.140291
Lavoie, R. A., Rail, J. F., and Lean, D. R. S. (2012). Diet composition of seabirds from Corossol Island, Canada, using direct dietary and stable isotope analyses. Waterbirds 35, 402–419. doi: 10.1675/063.035.0305
Layman, C. A., Arrington, D. A., Montaña, C. G., and Post, D. M. (2007a). Can stable isotope ratios provide for community-wide measures of trophic structure? Ecology 88, 42–48. doi: 10.1890/0012-9658(2007)88[42:CSIRPF]2.0.CO;2
Layman, C. A., Quattrochi, J. P., Peyer, C. M., and Allgeier, J. E. (2007b). Niche width collapse in a resilient top predator following ecosystem fragmentation. Ecol. Lett. 10, 937–944. doi: 10.1111/j.1461-0248.2007.01087.x
Lemons, G. E., Eguchi, T., Lyon, B. N., LeRoux, R., and Seminoff, J. A. (2012). Effects of blood anticoagulants on stable isotope values of sea turtle blood tissue. Aquat. Biol. 14, 201–206. doi: 10.3354/ab00397
Litzow, M. A., Piatt, J. F., Prichard, A. K., and Roby, D. D. (2002). Response of pigeon guillemots to variable abundance of high-lipid and low-lipid prey. Oecologia 132, 286–295. doi: 10.1007/s00442-002-0945-1
Martin, A. R. (1989). The diet of Atlantic puffin Fratercula arctica and Northern gannet Sula bassana chicks at a Shetland colony during a period of changing prey availability. Bird Study 36, 170–180. doi: 10.1080/00063658909477022
Massaro, M., Chardine, J. W., Jones, I. L., and Robertson, G. J. (2000). Delayed capelin (Mallotus villosus) availability influences predatory behaviour of large gulls on black-legged kittiwakes (Rissa tridactyla), causing a reduction in kittiwake breeding success. Can. J. Zool. 78, 1588–1596. doi: 10.1139/z00-085
Montevecchi, W. A., Garthe, S., and Davoren, G. K. (2006). “Biophysical influences on seabird trophic assessments,” in Top Predators in Marine Ecosystems: Their Role in Monitoring and Management, eds I. Boyd, S. Wanless, and C. J. Camphuysen (Cambridge: Cambridge University Press), 118–130.
Moore, J. W., and Semmens, B. X. (2008). Incorporating uncertainty and prior information into stable isotope mixing models. Ecol. Lett. 11, 470–480. doi: 10.1111/j.1461-0248.2008.01163.x
Moreno, R., Stowasser, G., McGill, R. A. R., Bearhop, S., and Phillips, R. A. (2016). Assessing the structure and temporal dynamics of seabird communities: the challenge of capturing marine ecosystem complexity. J. Anim. Ecol. 85, 199–212. doi: 10.1111/1365-2656.12434
Myers, R. A., and Worm, B. (2003). Rapid worldwide depletion of predatory fish communities. Nature 423, 280–283. doi: 10.1038/nature01610
Myers, R. A., and Worm, B. (2005). Extinction, survival or recovery of large predatory fishes. Philos. Trans. R. Soc. Lond. B Biol. Sci. 360, 13–20. doi: 10.1098/rstb.2004.1573
Newsome, S. D., Martinez del Rio, C., Bearhop, S., and Phillips, D. L. (2007). A niche for isotope ecology. Front. Ecol. Environ. 5, 429–436. doi: 10.1890/060150.1
Ogden, E., Lesley, J., Hobson, K. A., and Lank, D. B. (2004). Blood isotopic (δ13C and δ15N) turnover and diet-tissue fractionation factors in captive dunlin (Calidris alpina pacifica). Auk 121, 170–177. doi: 10.1642/0004-8038(2004)121[0170:BICANT]2.0.CO;2
Orians, G., and Pearson, N. (1979). “On the theory of central place foraging,” in Analysis of Ecological Systems, eds J. Horn, G. R. Stairs, and R. Mitchell (Columbus, OH: Ohio State Press), 155–177.
Pauly, D., Christensen, V., Dalsgaard, J., Froese, R., and Torres, F. J. (1998). Fishing down marine food webs. Science 279, 860–863. doi: 10.1126/science.279.5352.860
Perkins, M. J., McDonald, R. A., Van Veen, F. J. F., Kelly, S. D., Rees, G., and Bearhop, S. (2014). Application of nitrogen and carbon stable isotopes (δ15N and δ13C) to quantify food chain length and trophic structure. PLoS ONE 9:e93281. doi: 10.1371/journal.pone.0093281
Piatt, J. F., Methven, D. A., Burger, A. E., McLagan, R. L., Mercer, V., and Creelman, E. (1989). Baleen whales and their prey in a coastal environment. Can. J. Zool. 67, 1523–1530. doi: 10.1139/z89-217
Piatt, J. F., Sydeman, W. J., and Wiese, F. (2007). Introduction: a modern role for seabirds as indicators. Mar. Ecol. Prog. Ser. 352, 199–204. doi: 10.3354/meps07070
Pierotti, R., and Annett, C. A. (1990). Diet and reproductive output in seabirds. Bioscience 40, 568–574. doi: 10.2307/1311297
Pierotti, R., Annett, C. A., Ecology, S., Feb, N., Pierotti, R., and Annett, C. A. (1991). Diet choice in the herring gull : constraints imposed by reproductive and ecological factors. Ecology 72, 319–328. doi: 10.2307/1938925
Pikitch, E., Boersma, P. D., Boyd, I. L., Conover, D. O., Cury, P., Essington, T., et al. (2012). Little Fish, Big Impact: Managing a Crucial Link in Ocean Food Webs. Lenfest Forage Fish Task Force, 108.
Post, D. M., Layman, C. A., Arrington, D. A., Takimoto, G., Quattrochi, J., and Monta-a, C. G. (2007). Getting to the fat of the matter: models, methods and assumptions for dealing with lipids in stable isotope analyses. Oecologia 152, 179–189. doi: 10.1007/s00442-006-0630-x
R Core Team (2016). R: A Language and Environment for Statistical Computing. Available online at: https://www.r-project.org/
Ronconi, R. A., Koopman, H. N., McKinstry, C. A. E., Wong, S. N. P., and Westgate, A. J. (2010a). Inter-annual variability in diet of non-breeding pelagic seabirds Puffinus spp. at migratory staging areas: evidence from stable isotopes and fatty acids. Mar. Ecol. Prog. Ser. 419, 267–282. doi: 10.3354/meps08860
Ronconi, R. A., Steenweg, R. J., Taylor, P. D., and Mallory, M. L. (2014). Gull diets reveal dietary partitioning, influences of isotopic signatures on body condition, and ecosystem changes at a remote colony. Mar. Ecol. Prog. Ser. 514, 247–261. doi: 10.3354/meps10980
Ronconi, R. A., Swaim, Z. T., Lane, H. A., Hunnewell, R. W., Westgate, A. J., and Koopman, H. N. (2010b). Modified hoop-net techniques for capturing birds at sea and comparison with other capture methods. Mar. Ornithol. 38, 23–29.
Scioscia, G., Raya Rey, A., Saenz Samaniego, R. A., Florentin, O., and Schiavini, A. (2014). Intra- and interannual variation in the diet of the Magellanic penguin (Spheniscus magellanicus) at Martillo Island, Beagle Channel. Polar Biol. 37, 1421–1433. doi: 10.1007/s00300-014-1532-8
Smith, A. D. M., Brown, C. J., Bulman, C. M., Fulton, E. A., Johnson, P., Kaplan, I. C., et al. (2011). Impacts of fishing low-trophic level species on marine ecosystems. Science 333, 1147–1150. doi: 10.1126/science.1209395
Soto, K. H., Trites, A. W., and Arias-Schreiber, M. (2006). Changes in diet and maternal attendance of South American sea lions indicate changes in the marine environment and the abundance of prey. Mar. Ecol. Prog. Ser. 312, 277–290. doi: 10.3354/meps312277
Steenweg, R. J., Ronconi, R. A., and Leonard, M. L. (2011). Seasonal and age-dependent dietary partitioning between the great black-backed and herring gulls. Condor 113, 795–805. doi: 10.1525/cond.2011.110004
Stenhouse, I. J., and Montevecchi, W. A. (1999). Indirect effects of the availability of capelin and fishery discards: gull predation on breeding storm-petrels. Mar. Ecol. Prog. Ser. 184, 303–307. doi: 10.3354/meps184303
Thayer, J. A., and Sydeman, W. J. (2007). Spatio-temporal variability in prey harvest and reproductive ecology of a piscivorous seabird, Cerorhinca monocerata, in an upwelling system. Mar. Ecol. Prog. Ser. 329, 253–265. doi: 10.3354/meps329253
Todd, S. K. (1997). Dietary Patterns of Humpback Whales (Megaptera novaeangliae) in the Northwest Atlantic: Evidence from 13C and 15N Stable Isotopes. Doctoral (Ph.D.) thesis, Memorial University of Newfoundland.
Wanless, S., Frederiksen, M., Daunt, F., Scott, B. E., and Harris, M. P. (2007). Black-legged kittiwakes as indicators of environmental change in the North Sea: evidence from long-term studies. Prog. Oceanogr. 72, 30–38. doi: 10.1016/j.pocean.2006.07.007
Webb, L. A., and Harvey, J. T. (2014). Diet of a piscivorous seabird reveals spatiotemporal variation in abundance of forage fishes in the Monterey Bay region. J. Mar. Syst. 146, 59–71. doi: 10.1016/j.jmarsys.2014.08.011
Whitehead, H., and Carscadden, J. E. (1985). Predicting inshore whale abundance - whales and capelin off the Newfoundland Coast. Can. J. Fish. Aquat. Sci. 42, 976–981. doi: 10.1139/f85-122
Witteveen, B., Worthy, G., Wynne, K., and Roth, J. (2009). Population structure of North Pacific humpback whales on their feeding grounds revealed by stable carbon and nitrogen isotope ratios. Mar. Ecol. Prog. Ser. 379, 299–310. doi: 10.3354/meps07900
Yurkowski, D. J., Ferguson, S., Choy, E. S., Loseto, L. L., Brown, T. M., Muir, D. C. G., et al. (2016). Latitudinal variation in ecological opportunity and intraspecific competition indicates differences in niche variability and diet specialization of Arctic marine predators. Ecol. Evol. 6, 1666–1678. doi: 10.1002/ece3.1980
Keywords: trophic relationships, stable isotopes, dietary niche, indicators, marine, seabird, whale, forage fish
Citation: Gulka J, Carvalho PC, Jenkins E, Johnson K, Maynard L and Davoren GK (2017) Dietary Niche Shifts of Multiple Marine Predators under Varying Prey Availability on the Northeast Newfoundland Coast. Front. Mar. Sci. 4:324. doi: 10.3389/fmars.2017.00324
Received: 12 May 2017; Accepted: 26 September 2017;
Published: 12 October 2017.
Edited by:
Filipe Rafael Ceia, University of Coimbra, PortugalReviewed by:
Vitor H. Paiva, University of Coimbra, PortugalKyle Elliott, McGill University, Canada
Teresa Militão, University of Barcelona, Spain
Copyright © 2017 Gulka, Carvalho, Jenkins, Johnson, Maynard and Davoren. This is an open-access article distributed under the terms of the Creative Commons Attribution License (CC BY). The use, distribution or reproduction in other forums is permitted, provided the original author(s) or licensor are credited and that the original publication in this journal is cited, in accordance with accepted academic practice. No use, distribution or reproduction is permitted which does not comply with these terms.
*Correspondence: Gail K. Davoren, Z2FpbC5kYXZvcmVuQHVtYW5pdG9iYS5jYQ==