 Giuseppe Lembo1*
 Jose M. Bellido2
 Isabella Bitetto1
 Maria T. Facchini1
 Teresa García-Jiménez2
 Mavra Stithou3Vassiliki C. Vassilopoulou3
 Maria T. Spedicato1
- 1COISPA Tecnologia & Ricerca, Bari, Italy
- 2Instituto Español De Oceanografía, Murcia, Spain
- 3Hellenic Centre for Marine Research, Athens, Greece
Participatory management is a working method of paramount importance based on the principles of knowledge sharing and accountability for addressing the sustainable management of the fishery sector. To approach this multidimensional problem we applied two Multi Criteria Decision Analysis (MCDA) methods, the Analytic Hierarchy Process (AHP), and the Non-Structural Fuzzy Decision Support System (NSFDSS), which were applied incorporating uncertainty to generate probabilistic rankings. The NSFDSS technique was applied for the first time to address a fishery problem. Two surveys were carried out among Mediterranean Advisory Council (MEDAC) stakeholders with different backgrounds. By the two surveys we: (i) made an AHP test for exploring stakeholders' perception of the objectives and indicators used in the monitoring of the stocks, ecosystem, and fisheries, and (ii) introduced the NSFDSS technique, gathering feedback on stakeholders' preferences on management options for improving fishery sustainability (e.g., reducing discards, improving ecosystem state, and economic yield in the long term). In the AHP the respondents were asked to evaluate the importance of one objective against another according to a scale of semantic scores from 1 to 5, whereas a simpler scoring scale, with only three possible options, was used in the NSFDSS. The two MCDA methods were proven to be useful to elicit stakeholders' view on the potential effects of key issues on economic and environmental fishery sustainability. The results showed stakeholders' awareness of the fact that the reproductive potential should be secured by checking mortality and/or fishing intensity. Consistently, among the ecological indicators that are tracking the fisheries policy objectives, a higher rank was attributed to “mean size of the spawners,” while cost efficiency was considered to be essential for improving profits. Regarding the economic indicators, stakeholders gave higher priority to “revenue” in comparison to “production (catches),” which is a sign of awareness that increasing fish production does not necessarily turn into increased revenue. Among the different management strategies, “fleet withdrawal” (scraping) was considered as the worst option, while the “combination of measures” was considered to be the best alternative for achieving a sustainable fishery in the long term.
Introduction
Participatory management is widely recognized as a working method of paramount importance, based on the principles of knowledge sharing, accountability, and legitimacy, for addressing the sustainable development of the fishery sector. Industry–science cooperation could ensure more coherent information, enhance credibility, as well as contribute to the progressive implementation of an Ecosystem Approach to Fishery Management (EAFM). This process entails the integration of stakeholder's local and traditional knowledge on both research-based advice and identification of management directions (e.g., Garcia and Cochrane, 2005; Cochrane et al., 2007; Rochet et al., 2008; Röckmann et al., 2012). The production of the northern Mediterranean (European countries) represents approximately 35% of the production in the basin (FAO, 2016). In Mediterranean fisheries, actions are urgently needed to reverse the unsustainable exploitation of most stocks (85% overexploited according to FAO, 2016). Fisheries management is based mainly on input control rules (i.e., capacity, selectivity, and effort limitations), whereas output control is applied on a few highly migratory stocks. The former approach requires a tiered control system, so it is possible that low compliance affected its effectiveness in regard to stock recovery in the Mediterranean (e.g., Damalas and Vassilopoulou, 2013). A cooperative approach, involving stakeholders with different backgrounds, could help to increase collective awareness of this issue. It is thus fundamental to facilitate good governance and policy implementation, reducing conflicts and distrust in the advice and decision-making processes (e.g., Delaney et al., 2007; Shelton, 2007; Linke et al., 2011).
The Reform of the Common Fishery Policy (CFP) (EU Reg. 1380/20131) clearly places the role of stakeholders in a more interactive governance system, involving other actors besides scientists and policymakers. The Advisory Councils, established following the 2002 reform of the CFP, are currently the bodies where representatives from a broad set of stakeholders contribute to the decision-making process through a bottom-up approach (Aanesen et al., 2014).
However, participatory management requires that stakeholders are enabled to express their qualitative and quantitative perceptions about the current situation, being aware of the objectives and indicators used to assess the fishery's impact, the information these are able to convey, the advice procedures, and the range of applicable management options with estimates of their biological, economic, and social consequences. This is particularly relevant in the Mediterranean, where the structured participation of the stakeholders in the governance system is quite recent (Commission Decision 2008/695/EC2).
The scientific advisory process that supports the CFP commitments (e.g., Maximum Sustainable Yield, landing obligation, and EAFM, including Good Environmental Status according to the Marine Strategy Directive Framework3) is characterized by multiple attributes and objectives, involving the estimation of indicators associated with such specific objectives. Advice on the state of the stocks, fisheries, and ecosystems is the basis for the implementation of the Multiannual Management Plans (MAP), which are recognized as a more effective tool for achieving the multiple objectives of the CFP and thus for reversing the overexploitation status of several stocks while minimizing the economic and social impacts. Designing and evaluating MAPs is a complex task, which requires reliable data, specific expertise, and the involvement of stakeholders to share knowledge and improve the understanding of management measures while receiving feedback on management options and implementation strategies.
Multi Criteria Decision Analysis (MCDA; e.g., Belton and Stewart, 2002) is an area of growing interest in fisheries management, and there are several applications worldwide (e.g., Soma, 2003; Leung, 2006; Bevacqua et al., 2009; Innes and Pascoe, 2010; Aanesen et al., 2014; Kavadas et al., 2015; Rossetto et al., 2015). MCDA models are powerful for addressing specific problems characterized by multiple and often conflicting objectives, something that is common in fishery systems. However, only a limited portion of the applications reported in the literature has explicitly engaged stakeholders at any stage of the MCDA process (see Estévez and Gelcich, 2015 for a review). In addition, MCDA assessments can be affected by a range of uncertainties due to the imperfect knowledge of the specific system under study and the subjectivity of expert judgments (e.g., Banuelas and Antony, 2004; Rossetto et al., 2015). Incorporating uncertainty in the MCDA has been achieved using probabilistic judgments (e.g., Levary and Wan, 1998), fuzzy sets (Lee et al., 2001), and ranking intervals (Arbel and Vargas, 1993) to test the statistical significance of the final score and to facilitate consensus when a large number of stakeholders is involved.
In this paper, we applied two preference modeling methods that allow the transformation of qualitative judgments into quantitative judgments in order to ease their evaluation and practical use: the Analytical Hierarchy Process (AHP) (e.g., Saaty, 1980, 2003, 2008) and the Non-Structural Fuzzy Decision Support System (NSFDSS) (Tam et al., 2002, 2006). AHP has, together with ordination techniques, the highest number of applications in fishery science (Leung et al., 1998; Mardle and Pascoe, 1999; Andalecio, 2010; Pascoe et al., 2014), while NSFDSS has not yet been applied to fishery case studies.
Both techniques are decision-aiding tools for resolving multi-criteria decision problems based on the decomposition into a hierarchy of smaller problems ranked through pairwise comparisons, evaluated according to a scale of semantic scores. AHP relies upon a broad range of scores, whereas NSFDSS is based on a simpler scoring scale, with only three possible options: 0.5 (x and y are equally important), 1 (x is more important than y), and 0 (x is less important than y). This simplification eases the expression of judgment, possibly reducing inconsistencies due to human uncertainty or inaccuracy. However, this simpler scoring is reclassified inside the model into a more broad scale, using fuzzy sets (assignment of priority scores; Chen, 1998). This feature, coupled with an internal checking, makes it possible, in addition, to solve the inconsistency issues that can only be measured in AHP trough a consistency ratio, e.g., an index developed as a guide for decision-makers (Saaty, 2008).
We applied the two methods, at a pilot scale, during an ad hoc workshop carried out in collaboration with the Mediterranean Advisory Council (MEDAC) to elicit the preferences of 12 stakeholders, with different backgrounds (fishermen, representatives of fisheries associations, and of non-governmental environmental organization), belonging to the MEDAC organization. The workshop aimed to make all stakeholders aware of the general definition and specific concepts of the surveys. During the workshop we applied: (i) AHP for exploring stakeholders' perceptions about the objectives and indicators used in the monitoring of stocks, ecosystems, and fisheries; and (ii) NSFDSS for gathering feedbacks regarding stakeholders' preferences on management options to improve fishery sustainability (e.g., reducing discards and improving the ecosystem state and economic yield in the long term).
Materials and Methods
We implemented the AHP and the NSFDSS, respectively, in survey 1 and survey 2 to:
1. understand how stakeholders rank the importance of the economic, social, and biological factors affecting the fisheries;
2. evaluate how stakeholders rank the different indicators currently applied in the assessment of fishery impact;
3. quantify how stakeholders perceive a set of management options.
In both methods, the decision-making process needs to be decomposed to generate priorities in a specific way, defining the problem and structuring the decision hierarchy from the goal on top to the objectives at the intermediate level and down to the indicators/management options. Decision trees were thus identified for both survey designs.
During a dedicated workshop of MEDAC 12 equally weighed stakeholders (fishermen, representatives of fisheries associations and of non-governmental environmental organizations) were first informed about the survey objective, and then they were invited to interact in the plenary discussion; finally, they were asked to fill in two different questionnaires for the two surveys. MEDAC is a non-profit organization representing the fisheries sector (including the industrial fleet, small-scale fisheries, the processing sector, and trade unions) and other interest groups, such as, environmental organizations, consumer groups, and sports/recreational fishery associations, operating in the Mediterranean area in the framework of the CFP (http://en.med-ac.eu/chi_siamo.php).
The administration of the questionnaires followed a broad discussion on the objectives of the survey, problem structure, survey structure, and technical issues. Ethics approval was not required for this study as per institutional guidelines and Italian law and regulations. In compliance with the aforementioned guidelines, laws, and regulations, oral informed consent was obtained from the participants. Their answers were anonymized, and it is not possible to link the statements back to individual subjects.
Survey 1 (AHP)
The goal has been defined as “Contribute to a sustainable fishery management” in line with the CFP main target. Three main components were considered: Ecological state, Pressure/impact, and Economic state. Then, the hierarchic processes for the classification of the objectives and the associated indicators were defined (decision tree in Figure 1).
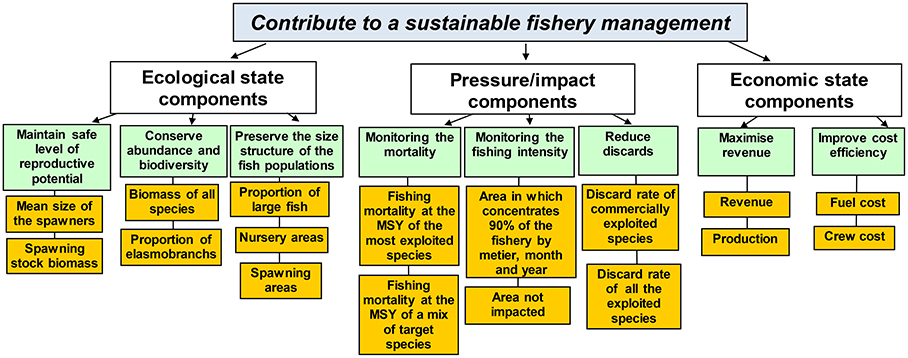
Figure 1. Decision Tree of survey 1. The AHP decision tree, indicating the goal, the three main components (ecological, pressure, and economic), and objectives (1st level green cells) with associated indicators (2nd level yellow cells).
In the AHP survey the preferences were expressed according to a scale of semantic scores from 1 to 5 (Table 1). In a pairwise comparison, the respondents were asked to evaluate the importance of one objective against another, with the value “1” representing equal importance. The stakeholders expressed their degree of preference between two alternatives (see questionnaire 1 in Supplementary Material), with the higher score indicating the higher preference.
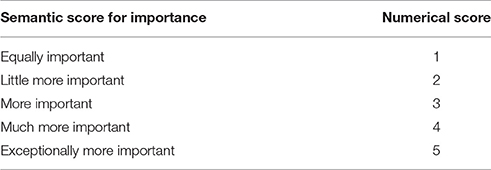
Table 1. Scale of semantic operators and relative score adopted in survey 1.
The results were elaborated using a pairwise comparison matrix A = (ai, j)i, j = 1, 2, …N, where N is the number of alternatives (objectives or indicators) and ai, j is the score assigned by the stakeholder in the pairwise comparison between the i-th and j-th alternatives. A is a positive reciprocal square N × N matrix, where a square matrix is reciprocal if . Further, we computed the weight vector in each level of the hierarchical tree through the eigenvalue/eigenvector averaging technique, according to Saaty (2003, 2008), who demonstrated that a good approximation of the priority vector is represented by the principal eigenvector of A. The eigenvector was then normalized to obtain a priorities' vector for each pairwise comparison matrix. The principal eigenvalue (or its multiple) λmax is associated to the principal eigenvector, and it is used to estimate the consistency of the answers.
It was possible to calculate a measure of consistency (Consistency Ratio) for each matrix of preferences using the following formula: , where CI is the consistency index, computed using the principal eigenvalue λmax and the number of alternatives N; the random index RI is a randomly generated value, computed assuming that the numbers in pairwise comparison matrix A are completely random (Saaty, 2008).
In this survey a questionnaire with 38 pairwise combinations was tested: 28 combinations were related to the objectives and 10 to the indicators (see questionnaire 1 in the Supplementary Material).
Survey 2 (NSFDSS)
The survey 2 has the same goal of survey 1, while the three components are ecological, economic, and social. Within this framework the objectives that can drive the choice about the possible alternative management options have been identified as in the decision tree reported in Figure 2.
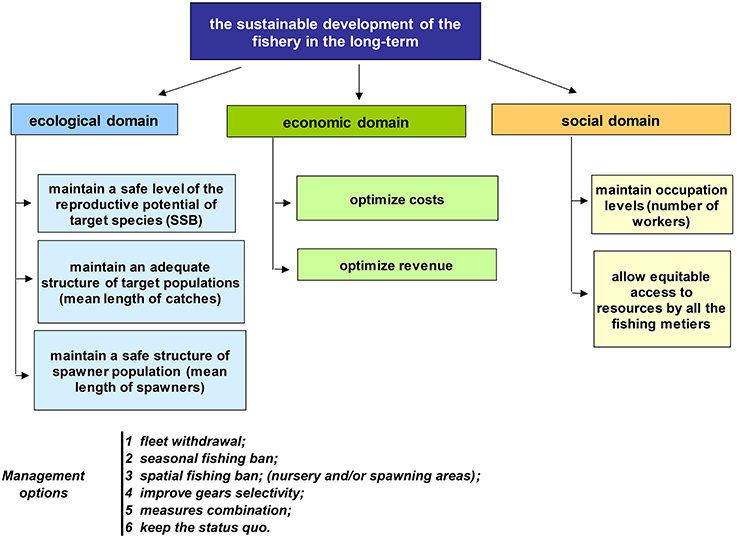
Figure 2. Decision Tree of survey 2. The NSFDSS decision tree, indicating the goal, the three main components (ecological, economic and social), the objectives, and the management options.
In the NSFDSS approach the management options were compared pairwise against each of the seven objectives. Hence, pairwise comparisons were also made among objectives (see questionnaire 2 in the Supplementary Material). The final step was the synthesis of priorities.
We recorded stakeholders' preferences in each pairwise comparison matrix A = (ai, j)i, j = 1, 2, …N, where N is the number of alternatives (objectives or management options). Then we filled the whole matrix, making a check of consistency of preferences, as follows:
Summing up the values on each row of the matrixes, the management options are rearranged in descending order with respect to each objective. With an analogous procedure, the objectives are rearranged in descending order. Based on this priority order, we assigned a semantic operator to each alternative by comparing it to the one with the highest value. Chen (1998) incorporated fuzzy set theory to the model, as described by Tam et al. (2002). Thus, each semantic operator is assigned to a semantic score within the range [0, 1]. After obtaining the priority order of the management options, it is necessary to measure the magnitude of the pairwise comparison by calculating the weights wi of the objectives, obtained normalizing the associated semantic scores. Multiplying the weights of management options by the corresponding weights of the objectives, three matrices are obtained: products, square products, and the complementary square matrices. These three matrices are necessary in order to compute the final priority vector of decisions (management options), applying the Hamming (1950) distance:
where wi is the weight of each objective, ri.j is the semantic score (Chen, 1998), and N is the number of objectives. The final priority vector was obtained taking the average of the two values of uj (for p = 1 and for p = 2).
In this survey a questionnaire with 136 pairwise combinations was tested, with 115 of these comparing the management options and 21 the objectives (see questionnaire 2 in the Supplementary Material).
Sensitivity
A sensitivity analysis was carried out to evaluate the robustness of the results, with respect to the uncertainty associated to the weights expressing the relative importance of the elements considered both in the AHP and in the NSFDSS. To this end, the Monte Carlo approach was applied to both analyses, according to the following steps:
1. Application of uncertainty to the normalized vector of weights at each hierarchical level for each stakeholder, multiplying the deterministic local weights by the factor (1 + ε), where ε is a normally distributed error with mean 0 and standard deviation 0.15 (so that 90% confidence bounds encompass the original value of the weight ±20%). A total of 1,000 extractions were made;
2. The perturbed local weights were normalized to add up to 1;
3. On the 1,000 vectors of weights for each hierarchical level, and for each element, relevant percentiles (0.05, 0.25, median, 0.75, 0.95) and statistics (minimum, maximum, mean, standard deviation and CV) were calculated;
4. For each statistic and percentile, the corresponding global vector was derived as a geometric mean among all stakeholders; this was carried out at each level of the hierarchical tree.
Estimates
First, an exploratory analysis on the perturbed weight vectors was carried out to detect possible differences between rankings. For each hierarchical level of the decision tree a global frequency was computed, taking all the runs of all the stakeholders as a whole and estimating the frequency to be the first, the second, etc. on the total perturbed rankings. This frequency has been interpreted as a proxy of the probability to get the higher preference, that is, a synthesis of the frequency of the ranking for a given objective/indicator, based on its weight and taking into account the judgment of each stakeholder (empirical probability). The results of this exploratory analysis are affected by both the uncertainty introduced in the process and the natural variability among the stakeholders' preferences. Then, ranking preferences over stakeholders were estimated using geometric means for both surveys. These global means and other associated statistics are only affected by the uncertainty introduced in the process, as the variability due to the different perceptions of stakeholders is smoothed by the mean.
All the algorithms and computations were performed using an ad hoc routine developed in R language.
Results
Survey 1
Exploratory Analysis
The objective to “maintain a safe level of reproductive potential” had the maximum empirical probability to be ranked first (25.32%), followed by improve cost efficiency (23.35%). The other objectives of the ecological and economic components received an intermediate or very low empirical probability. Among the objectives pertaining to the pressure component Monitoring the mortality reached a higher value compared to the other two objectives, while reduce discards had the higher probability to be ranked the last (25.61%; Figure 3).
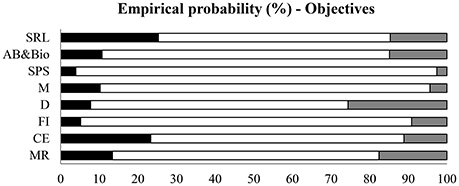
Figure 3. Survey 1—AHP (Exploratory analysis): empirical probability to be first and to be last associated to the objectives according to stakeholders' preferences, respectively, for ecological, pressure/impact, and economic components. SRL, Maintain safe level of reproductive potential; AB&Bio, Conserve abundance and biodiversity; SPS, Preserve the size structure of the fish populations; M, Monitoring the mortality; D, Reduce discards; FI, Monitoring the fishing intensity; CE, Improve cost efficiency; MR, Maximize revenue.
The empirical probability associated to the indicators showed that the fuel cost had the highest probability to be the most important (31.59%), while the indicator proportion of large fish reached the highest probability to be ranked the least important (28.59%; Figure 4). However, for the ecological component the biomass of all the species achieved a higher empirical probability compared to the other indicators, whereas for the impact component the indicator Fishing mortality at the MSY of the most exploited species achieved a higher value.
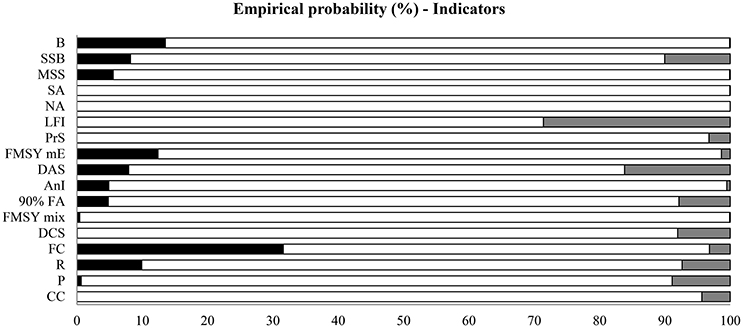
Figure 4. Survey 1—AHP (Exploratory analysis): empirical probability to be first and to be last associated to the indicators according to stakeholders' preferences, respectively, for ecological, pressure/impact, and economic components. B, Biomass of all species; SSB, Spawning stock biomass; MSS, Mean size of the spawners; SA, Spawning areas; NA, Nursery areas; LFI, Proportion of large fish; PrS, Proportion of elasmobranchs; FMSY mE, Fishing mortality at the MSY of the most exploited species; DAS, Discard rate of all the exploited species; AnI, Area not impacted by fishing gears; 90% FA, Area in which 90% of the fishery by metier, month, and year concentrates; FMSY mix, Fishing mortality at the MSY of a mix of target species; DCS, Discard rate of commercially exploited species; FC, Fuel cost; R, Revenue; P, Production; CC, Crew cost.
The Consistency Ratios were generally satisfactory and below 0.1 (a value suggested as a threshold by Saaty, 2008), except in two cases.
Ranking Preferences
The average statistics of preferences expressed by stakeholders for the objectives and indicators highlighted higher scores (Figure 5 and Table 2) for the objective maintain a safe level of reproductive potential (0.13), pertaining to the ecological component, and the lowest for the objective of the pressure/impact component reduce discard (0.08). The other objectives achieved a similar score (0.10–0.11). Likewise, in the exploratory analysis, the objective improve cost efficiency of the economic component received a higher preference compared to maximize the revenue.
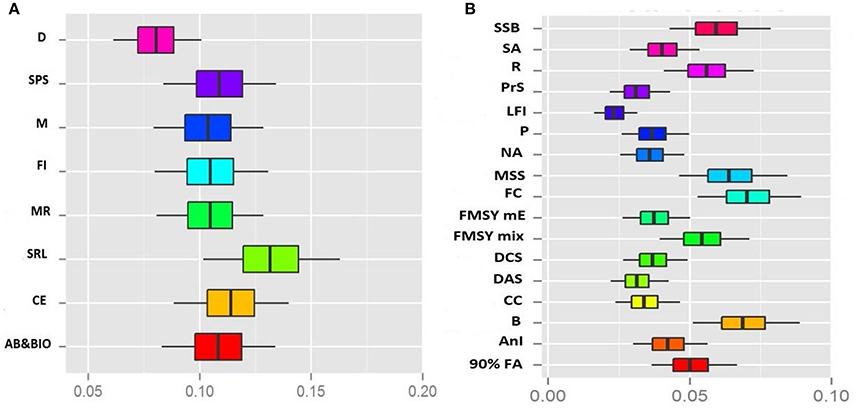
Figure 5. Survey 1—AHP (Ranking preferences): Ranking the objectives with uncertainty (box plot with median and percentile values: 0.05, 0.25, 0.75, and 0.95). (A) Level 1, D, Reduce discards; SPS, Preserve the size structure of the fish populations; M, Monitoring the mortality; FI, Monitoring the fishing intensity; MR, Maximize revenue; SRL, Maintain safe level of reproductive potential; CE, Improve cost efficiency; AB&Bio, Conserve abundance and biodiversity. (B) Level 2, SSB, Spawning stock biomass; SA, Spawning areas; R, Revenue; PrS, Proportion of elasmobranchs; LFI, Proportion of large fish; P, Production; NA, Nursery areas; MSS, Mean size of the spawners; FC, Fuel cost; FMSY mE, Fishing mortality at the MSY of the most exploited species; FMSY mix, Fishing mortality at the MSY of a mix of target species; DCS, Discard rate of commercially exploited species; DAS, Discard rate of all the exploited species; CC, Crew cost; B, Biomass of all species; AnI, Area not impacted by fishing gears; 90% FA, Area in which 90% of the fishery by metier, month, and year concentrates.
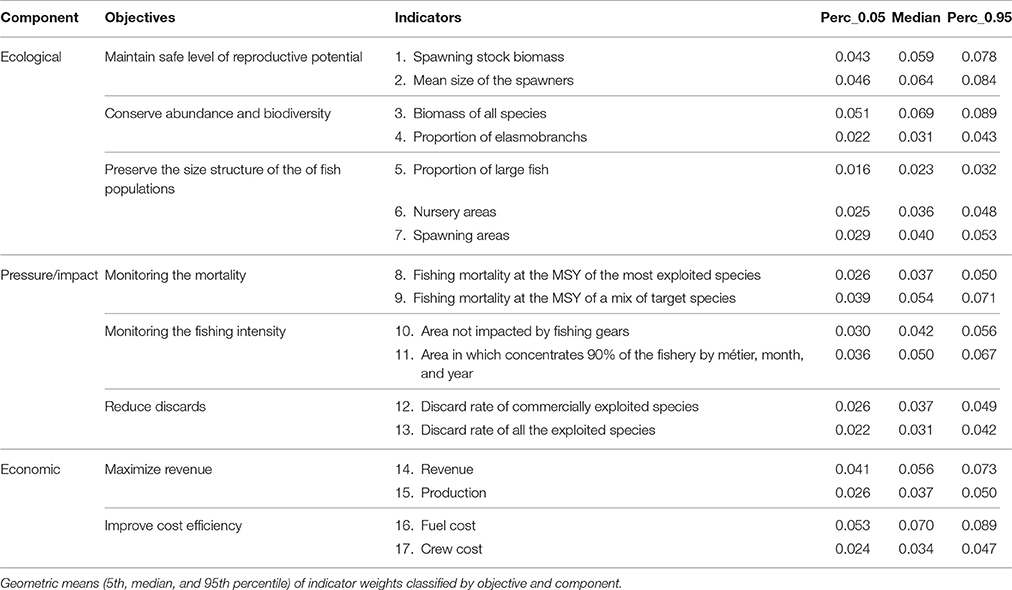
Table 2. Survey 1 (Ranking preferences).
With regard to the stakeholders' perception of the effectiveness of each indicator to track ecological objectives, a higher rank was attributed to biomass of all species (score = 0.069), mean size of the spawners (0.064), and spawning stock biomass (0.059), while the proportion of large fish was considered the less important indicator, consistent with the exploratory analysis. Among the pressure/impact indicators, the stakeholders' preference was expressed for fishing mortality at the MSY of a mix of target species (0.054), while fishing mortality at the MSY of the most exploited species received lower preferences (0.037). This result, which appears inconsistent with the exploratory analysis, is a sign of skewed stakeholder responses. Among the economic components, the fuel cost received the highest score (0.07), as in the exploratory analysis (Figure 5 and Table 2).
Survey 2
Exploratory Analysis
The objective, in the ecological domain, that had the highest empirical probability to be the most important for the sustainable development of the fishery in the long term was maintain a safe level of the reproductive potential of target species (25%). Likewise, optimize revenue and maintain occupation levels had the highest empirical probability to be the more important, respectively in the economic and social domains. The highest probability to be the least important (33.33%) was obtained by allow equitable access to resources by all the fishing métiers, belonging to the social domain (Figure 6).
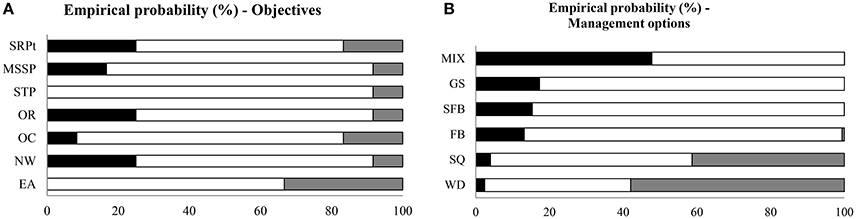
Figure 6. Survey 2—NSFDSS (Exploratory analysis): empirical probability to be first and to be last associated to (A) objectives and (B) management options, according to stakeholders' preferences, respectively, for ecological, economic, and social components. (A) SRPt, Maintain a safe level of the reproductive potential of target species; MSSP, Maintain a safe structure of spawner population; STP, Maintain an adequate structure of target populations; OR, Optimize revenue; OC, Optimize costs; NW, Maintain occupation levels; EA, Allow equitable access to resources by all the fishing metiers. (B) MIX, measures combination; GS, improve gears selectivity; SFB, spatial fishing ban; FB, seasonal fishing ban; SQ, keep the status quo; WD, fleet withdrawal.
Among the management options, measures combination (47.77%) obtained the highest empirical probability to be ranked the first option, while fleet withdrawal (57.98%) was ranked the least appropriate option, followed by keep the status quo (41.34%; Figure 6).
Ranking Preferences
Likewise, in the exploratory analysis, in the ranking preferences of objectives (Figure 7), stakeholders assigned the higher score to maintain occupation levels (0.16) and the lower score to allow equitable access to resources by all the fishing métiers (0.11). Intermediate scores (0.14) were assigned to the other objectives of the ecological and economic components: i.e., optimize revenues, optimize costs, maintain safe level of the reproductive potential of target species, and mean length of spawners.
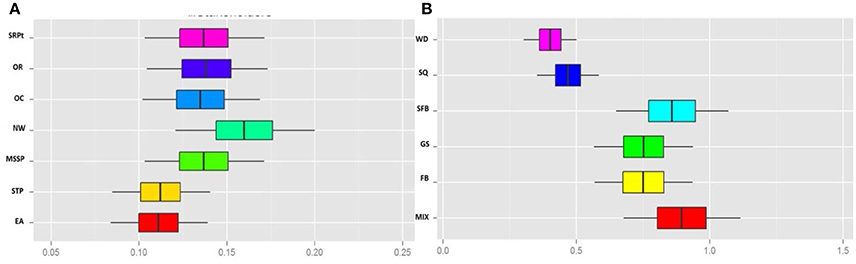
Figure 7. Survey 2—NSFDSS (Ranking preferences): (A) ranking objectives and (B) management options, according to stakeholders' preferences with uncertainty (box plot with median and percentile values: 0.05, 0.25, 0.75, and 0.95). (A) SRPt, Maintain a safe level of the reproductive potential of target species; OR, Optimize revenue; OC, Optimize costs; NW, Maintain occupation levels; MSSP, Maintain a safe structure of spawner population; STP, Maintain an adequate structure of target populations; EA, Allow equitable access to resources by all the fishing metiers. (B) WD, fleet withdrawal; SQ, keep the status quo; SFB, spatial fishing ban; GS, improve gears selectivity; FB, seasonal fishing ban; MIX, measures combination.
In the ranking preferences of management options (Figure 7), stakeholders considered the measures combination as the best option to achieve sustainable fishery management in the long term (score = 0.89), followed by the spatial fishing ban (0.86) and the seasonal fishing ban (0.75). The last choices were keep status quo (0.47) and fleet withdrawal (0.40).
Discussion
Preference modeling methods, particularly those using multi-attribute value theory, are well suited in situations where the active involvement of stakeholders is desired in the entire decision-making process. Participative MCDA is progressively applied in marine multi-objective management situations, and it is of increasing interest in fisheries management, aquaculture, and marine conservation, although the engagement of stakeholders is often limited to certain steps in the whole process (e.g., Estévez and Gelcich, 2015). We tested this methodological approach, which is a novel application to a Mediterranean case study, at a pilot scale to support a participatory procedure and elicit stakeholders' preferences as a step toward understanding and incorporating their knowledge and views. This kind of process is expected to contribute to effective fisheries management in terms of agreement on specific objectives and measures.
Information on the management and socio-economic aspects of fisheries is relatively limited in the Mediterranean and Black Seas, where there is a need for more integration of the ecosystem and socio-economic considerations into assessment procedures (Sartor et al., 2014). Full stakeholders' engagement is thus pivotal to promote tools for developing effective fisheries co-management, evolving toward an assessment of fisheries systems rather than fish stocks. Following Halls et al. (2005), such an approach can make a broader use of traditional ecological knowledge and propose co-management initiatives in data collection methods, especially for small scale fisheries.
We explored the preferences of 12 stakeholders answering to two surveys in a meeting organized by MEDAC, applying AHP and NFSDSS methods. With the former method we elicited the stakeholders' perceptions about the objectives and indicators used for stocks, ecosystem, and fisheries monitoring. Whereas, using the latter method we elicited the stakeholders' preferences about management options to improve fishery sustainability.
Regarding the AHP, which is used in a very wide range of areas with complex decision and evaluation problems (Andalecio, 2010; Kavadas et al., 2015; Rossetto et al., 2015), we identified clear benefits such as eliciting priorities among stakeholders and taking responsibilities (Nielsen and Mathiesen, 2006). AHP is also an empowering, communicating, and quantifying tool that may allow stakeholder engagement, which is usually omitted from the formal decision-making process (Leung, 2006; Brooks et al., 2015). In addition, this technique acknowledges that decision-makers may be much more comfortable in expressing semantic evaluations (e.g., equal important, much more important, etc.) and using pairwise comparisons rather than expressing attributes only in terms of numerical scores. It is worth highlighting that in our case we observed a satisfactory consistency ratio for 10 out of 12 stakeholders interviewed. In addition, excluding the two respondents with a consistency ratio slightly above the threshold value from the AHP analysis did not affect the results.
However, users of this technique have pointed out some weaknesses, with criticisms focused on the structuring of the hierarchy process, the inconsistent ranking of preferences, and the lack of a pre-defined approach for the combination of judgments. Despite its simplicity AHP is considered to be a powerful and versatile technique with merits related to both the involvement of stakeholder groups in the decision-making process and the advantageous features of the method as a communication tool (Soma, 2003).
An advantage of using NFSDSS, compared to similar methods such as AHP, is the major accuracy of the solution due to the automatic consistency checking (Tam et al., 2006). In addition, NFSDSS takes advantage of the fuzzy set theory using semantic operators to allow the improvement of expert judgment analysis (Tam et al., 2002). This leads to a further strength, as stakeholders have only three possible answers to give: prefer A to B, prefer B to A, or A and B are equally important. This simplifies the decision-making process and may reduce errors. Despite these advantages, NSFDSS, given the simplification of the questions, may sometimes lead to a reduction of the differentiation between decisions, making the selection of the best option difficult (Tam et al., 2006).
Basically, the pilot scale surveys we carried out demonstrated the suitability of both the MCDA methods, even in the light of their pros and cons.
The proposed case studies seemed feasible and conducive for stakeholders' engagement at the level of the fishing industry and non-governmental organizations (NGOs), that are members of the MEDAC. Overall, the exploratory analysis and the ranking preferences gave consistent results and showed a low level of skewness in the opinions expressed by the participants in the surveys, even though the group composition mirrored the presence of stakeholders with different backgrounds, as represented in the MEDAC. This allowed us to neglect the analysis by group, treating all the stakeholders as belonging to the same group.
Looking into the results of the surveys, it emerged that the opinions of different stakeholders linked to key issues of fisheries' sustainability (e.g., improving ecosystem state and yield in the long term, avoiding bycatches, and reducing discards) converged toward preferences for ecological state objectives, such as, maintain a safe level of reproductive potential, and for economic state objectives, such as, improve cost efficiency. The latter received a higher preference compared to the counterpart economical state objective maximize the revenue, while the lowest score was assigned to the objective of the pressure/impact component reduce discard. This result demonstrates the awareness of the key role of ecological objectives, as in Janssen et al. (2014), and also reflects the common sense of fishermen, who generally consider the spawners as the more fragile component of the stock, which necessitates protection. This is quite different from the results of Aanesen et al. (2014), who found a low interest of the industry in fostering ecological objectives.
Regarding the economic state, it was unsurprising that stakeholders considered the objective of improve cost efficiency more effective for increasing profit, given that possible limitations of effort and catches would make it more difficult to maximize revenues if cost efficiency and marketing of the fish products are not improved. The low level of preference assigned to reduce discard might be due to the perception of this objective as a further burden, considered difficult to put in practice in the short term in the multispecies–multitarget Mediterranean fisheries.
Indicators are commonly used in the communication between scientific researchers and managers as synthetic tools to monitor the stocks, the fleet, as well as the ecological state of marine resources. Each indicator is generally defined with the aim to control the achievement of a specific objective, while all the objectives concur to the attainment of the main goal (i.e., contributing to sustainable fishery management). The role of such indicators is crucial because they make it possible to describe the current situation of the fishery system and to foresee the impact of alternative management measures through the use of ad hoc bio-economic simulation models (e.g., Bevacqua et al., 2009; Johnston et al., 2010; Spedicato, 2016; Russo et al., 2017). Nevertheless, the understanding of these indicators is not always straightforward for the stakeholders, who are not fully involved in the advice process. Moreover, their practice and solid knowledge of the aspects linked to the fishery sector would have the potential to streamline the management process, improving the level of compliance to the management measures.
A glance into the ranking of the indicators (survey 1) shows that the economic and ecological ones occupy the top five places in the list. In particular, the decisive importance that stakeholders assign to fuel costs in determining the cost-effectiveness of fisheries is clear, which is consistent with the first-level objective improve cost efficiency. After that, we find three indicators (biomass of all species, mean size of the spawners, and spawning stock biomass), all belonging to the ecological component, which highlight the importance that stakeholders assign to monitoring the reproductive potential and stock abundance. Low interest is expressed for the indicator linked to the fish community structure, the Large Fish Indicator (LFI), which is related to the ecosystem state, but this is counterbalanced by the interest for the indicator biomass of all the species. The reason may be that the latter is more understandable and even easier to communicate than the former.
As in Prigent et al. (2008) we observed that the ecological indicators used by the fishermen as the basis to form their opinions were quite similar to those generally used by scientists for assessing the state of exploited marine populations and communities.
Overall, the results of the second-level objectives are quite in line with those of Aanesen et al. (2014), who observed that stakeholders belonging to the fishing industry ranked as first the economic objectives, which highlights the stakeholder's attitude to consider unrealistic achieving the objective of the biological resources sustainability without social and economic sustainability.
With regards to the economic indicators, stakeholders gave higher priority to revenue in comparison to production, which is a sign of awareness that increasing fish production does not necessarily turn into increased revenue, and they gave higher priority to fuel costs in comparison to crew costs. This is because fuel is one of the more significant variable costs in the fishing industry.
In addition, it is worth noting that the pressure/impact indicators always occupy a low rank position. Consistently with the value assigned to the first-level objectives, the indicators discard rate of commercially exploited species and discard rate of all the exploited species were considered less important compared to the ecological state and economic indicators.
As observed by Innes and Pascoe (2010), a lower relevance was given to Discard rate of commercially exploited species. Conversely, higher preferences were given to the ecological indicators, indicating that stakeholders focus more on population state indicators than on impact indicators, as also pinpointed by Nielsen and Mathiesen (2006) in an AHP application.
Among the pressure/impact indicators, only Fishing mortality at the MSY of a mix of target species reached a high priority level, probably because stakeholders perceive the need to account for the complexity of the ecosystem in terms of the number of species and their interactions rather than referring to a single stock.
Interestingly, the aggregated preferences of alternative management measures (survey 2) ranked against the objectives showed that the perceptions of the objectives were consistent with the results of survey 1, prioritizing the ecological objective Maintain a safe level of the reproductive potential of target species and the economic objective Optimize revenues. There was, however, a social concern, which is underpinned by the priority assigned to the objective Maintain occupation levels. This is clearly indicative of an individual perspective, as the objective Allow equitable access to resources by all the fishing metiers received one of the lowest scores, testifying to the peculiar aspect of highly competitive fishermen's behavior. Consistent with survey 1, objectives such as, Maintain an adequate structure of target populations received the least interest, confirming the difficulties in perceiving/understanding the consequences of fishery impact in terms of erosion of age/length groups from harvested populations.
Considering management options, the measures combination was ranked as the first option while spatial fishing ban was second. The worst option for stakeholders was scrapping of the fleet, likely showing that most of them have not yet lost hope that the fisheries could produce income, if the exploitation of the resources is sustainable. Moreover, the very low ranking of keep the status quo shows awareness that the current state of exploitation can hardly be sustained in the long run. Less consideration was given to the management strategy improve gear selectivity, which seems to reflect the view that selectivity measures alone are not very effective for the Mediterranean mixed fisheries. It is interesting to note that the spatial fishing ban was preferred to the seasonal fishing ban, which could be interpreted as showing greater confidence in the positive effect of protecting only some essential fish habitats, such as, spawner/nursery areas, in comparison to a seasonal fishing ban extended to all the areas. This is probably because spatial fishing bans leave room for the idea that some fishing activities in areas other than those that are protected could be allowed throughout the year. This would contradict to a certain extent the reluctance of stakeholders to establish marine protected areas, which was reported by Jentoft et al. (2012), who pinpointed fishermen's concerns about such spatial measures, based on the perceived risk of reduced operational flexibility and an imbalance between gains and losses. On the other hand, even in the present study, the high interest expressed toward spatial fishing ban is not corroborated by the priority assigned to indicators such as, the presence of spawning and nursery areas, which received a low rank in survey 1. This apparent contradiction could be a consequence of the range of indicators proposed, which led to higher ranks for those that were easier to interpret and, to a certain extent, also to the broader scale of semantic operators (5 possibilities) used in AHP. The preference of one management strategy compared to another one (e.g., the spatial fishing ban vs. seasonal fishing ban) is an aspect that is often neglected, but it represents important information that is useful for managers in the preparation of MAPs. Indeed, the reduction in the fishing pressure and especially the change of the exploitation patterns (increased size/age at first capture) for restoring the overexploited stocks and achieving the maximum sustainable yield (MSY) are pivotal for the implementation of the new CFP objectives. Gear selectivity has been considered insufficient or inadequate to reduce the fishing mortality on the fisheries' recruits (e.g., Suuronen, 2005). Seasonal fishing bans have been applied in the European Mediterranean countries (e.g., Greece and Italy), but they have not effectively mitigated the overexploitation of stocks, especially those mainly distributed offshore.
MCDA assessments can, however, be affected by a range of uncertainties due to the imperfect knowledge of the specific system under study, the subjectivity of expert judgments, unfamiliarity with the elicitation process, a large number of pairwise comparisons, incomplete information or knowledge, uncertainty about the outcome of events, or levels of intensity associated with stakeholder preferences (e.g., Banuelas and Antony, 2004; Rossetto et al., 2015).
In this study we addressed uncertainty issues, applying a probabilistic approach via the propagation of a normal error from the individual rankings to the synthetic rankings. Consequently, accounting for uncertainty allowed more appropriate rankings among objectives, indicators, and management options. Indeed, in our survey, a sensitivity analysis was carried out to evaluate the robustness of the results, with respect to the uncertainty associated to the weights expressing the relative importance of the elements considered in the AHP and NSFDSS. This approach is similar to the one used in Rossetto et al. (2015) and differs from the probabilistic judgments method described in Banuelas and Antony (2004), as the present work multiplicatively applies a normal distributed error to the deterministic eigenvector (in AHP) and to the objectives and management options priority vectors (in NSFDSS) to obtain the perturbed rankings.
Increased stakeholder participation and their knowledge integration are suggested to improve the EU's CFP, which is suffering from legitimacy, credibility, and compliance problems (Linke et al., 2011). The present work has made it possible to test a framework for the creation of synergies and to find common ground for a bottom-up approach in a transparent way. Two MCDA methods have been applied and proven useful for eliciting stakeholders' view on the potential effects of key issues on the economic and environmental sustainability of fisheries; for example, improving ecosystem state and yield in the long term, avoiding by catches and reducing discards, changing technical features of the gears, facing possible losses in the short term, and changing/releasing local seafood traditions/habits. The results suggest that, according to the preferences of the interviewed stakeholders, management measures aimed at reducing the environmental impacts of fishing that are more broad than simply discarding could be appropriate and sharable. In addition, to improve stakeholders' participatory role, there is a need for continuous cycles of planning, implementation, and adjustment due to the inherent complexity of monitoring fisheries, as well as the uncertainty of the fishery management process. At the same time, the ability to understand the concerns of managers (regulatory aspects, control issues, time-lines, political dimension, etc.), scientists (data availability, knowledge on species biology, population dynamic, etc.), and fishermen (practices, lifestyle, language issues, etc.) is key to ensuring a smooth process and the successful preparation and implementation of MAPs.
Author Contributions
Substantial contributions to the conception or design of the work: GL, MTS, JB, VV, MS, and TG. Acquisition, analysis and interpretation of data: IB, GL, MTS, and MF. Drafting the work: GL, IB, and MTS. Revising the work critically for important intellectual content: GL, JB, IB, MF, TG, MS, VV, and MTS. Final approval of the version to be published: GL, JB, IB, MF, TG, MS, VV, and MTS. Agreement to be accountable for all aspects of the work in ensuring that questions related to the accuracy or integrity of any part of the work are appropriately investigated and resolved: GL, JB, IB, MF, TG, MS, VV, and MTS.
Conflict of Interest Statement
The authors declare that the research was conducted in the absence of any commercial or financial relationships that could be construed as a potential conflict of interest.
Acknowledgments
This research was funded by the European Commission under the DISCATCH project (European Grant MARE/2012/24-Lot2, SI2.672370: Pilot project on catch and discard composition including solutions for limitation and possible elimination of unwanted bycatches in trawl net fisheries in the Mediterranean). We are grateful to MEDAC and the stakeholders involved in the study who have agreed to contribute with their knowledge and availability to the realization of this work.
Supplementary Material
The Supplementary Material for this article can be found online at: https://www.frontiersin.org/articles/10.3389/fmars.2017.00328/full#supplementary-material
Footnotes
1. ^Regulation (EU) No 1380/2013 of the European Parliament and of the Council of 11 December 2013 on the Common Fisheries Policy, Amending Council Regulations (EC) No 1954/2003 and (EC) No 1224/2009 and Repealing Council Regulations (EC) No 2371/2002 and (EC) No 639/2004 and Council Decision 2004/585/EC Official Journal of the European Union. Brussels.
2. ^Commission Decision (2008/695/EC). Commission Decision of 29 August 2008 Declaring Operational the Regional Advisory Council for Mediterranean Sea under the Common Fisheries Policy.
3. ^Directive 2008/56/EC of the European Parliament and of The Council of 17 June 2008 Establishing a Framework for Community Action in the Field of Marine Environmental Policy (Marine Strategy Framework Directive), EU-COM. Available online at: http://eur-lex.europa.eu/LexUriServ/LexUriServ.do?uri=OJ:L:2008:164:0019:0040:EN:PDF)
References
Aanesen, M., Armstrong, W. C., Bloomfield, H. J., and Röckmann, C. (2014). What does stakeholder involvement mean for fisheries management? Ecol. Soc. 19:35. doi: 10.5751/ES-06947-190435
Andalecio, M. (2010). Multi-criteria decision models for management of tropical coastal fisheries. A review. Agron. Sustain. Dev. 30, 557–580. doi: 10.1051/agro/2009051
Arbel, A., and Vargas, L. (1993). Preference simulation and preference programming: robustness issues in priority derivation. Eur. J. Oper. Res. 69, 200–209. doi: 10.1016/0377-2217(93)90164-I
Banuelas, R., and Antony, J. (2004). Modified analytic hierarchy process to incorporate uncertainty and managerial aspects. Int. J. Prod. Res. 42, 3851–3872. doi: 10.1080/00207540410001699183
Belton, V., and Stewart, T. (2002). Multiple Criteria Decision Analysis - An Integrated Approach. Boston, MA: Kluwer Academic Press.
Bevacqua, D., Melià, P., Crivelli, A. J., Gatto, M., and De Leo, G. A. (2009). Assessing management plans for the recovery of the European eel: a need for multi-objective analyses. Am. Fish. Soc. Symp. 69, 637–647. doi: 10.1016/j.envsoft.2014.10.008
Brooks, K., Schirmer, J., Pascoe, S., Triantafillos, L., Jebreen, E., Cannard, T., et al. (2015). Selecting and assessing social objectives for Australian fisheries management. Mar. Policy 53, 111–122. doi: 10.1016/j.marpol.2014.11.023
Chen, S. Y. (1998). Engineering Fuzzy Set Theory and Application. Beijing: State Security Industry Press.
Cochrane, K. L., Augustyn, C. J., Bianchi, G., de Barros, P., Fairweather, T., Iitembu, J., et al. (2007). Results and Conclusions of the Project “Ecosystem Approaches for Fisheries Management in the Benguela Current Large Marine Ecosystem.” FAO Fisheries Circular. No. 1026. Rome.
Damalas, D., and Vassilopoulou, V. (2013). Slack regulation compliance in the Mediterranean fisheries: a paradigm from the Greek Aegean Sea demersal trawl fishery, modelling discard ogives. Fish. Manage. Ecol. 20, 21–33. doi: 10.1111/j.1365-2400.2012.00860.x
Delaney, A. E., McLay, H. A., and van Densen, W. L. T. (2007). Influences of discourse on decision-making in EU fisheries management: the case of North Sea cod (Gadus morhua). ICES J. Mar. Sci. 64, 804–810. doi: 10.1093/icesjms/fsm015
Estévez, R. A., and Gelcich, S. (2015). Participative multi-criteria decision analysis in marine management and conservation: research progress and the challenge of integrating value judgments and uncertainty. Mar. Policy 61, 1–7. doi: 10.1016/j.marpol.2015.06.022
FAO (2016). The State of Mediterranean and Black Sea Fisheries. Rome: General Fisheries Commission for the Mediterranean.
Garcia, M., and Cochrane, K. L. (2005). Ecosystem approach to fisheries: a review of implementation guidelines. ICES J. Mar. Sci. 62, 311–318. doi: 10.1016/j.icesjms.2004.12.003
Halls, A. S., Arthur, R. I., Bartley, D., Felsing, M., Grainger, R., Hartmann, W., et al. (2005). Guidelines for Designing Data Collection and Sharing Systems for Co-managed Fisheries. Part 1: Practical Guide. FAO Fisheries Technical Paper. No. 494/1. Rome: FAO.
Hamming, R. W. (1950). Error-detecting and error-correcting codes. AT&T. Tech. J. 29, 147–160. doi: 10.1002/j.1538-7305.1950.tb00463.x
Innes, J. P., and Pascoe, S. (2010). A multi-criteria assessment of fishing gear impacts in demersal fisheries. J. Environ. Manage. 91, 932–939. doi: 10.1016/j.jenvman.2009.11.011
Janssen, R., Knudsen, S., Todorova, V., and Hosgör, A. G. (2014). Managing Rapana in the Black Sea: stakeholder workshops on both sides. Ocean Coast. Manage. 87, 75–87. doi: 10.1016/j.ocecoaman.2013.10.015
Jentoft, S., Pascual-Fernandez, J. J., De la Cruz Modino, R., Gonzalez-Ramallal, M., and Chuenpagdee, R. (2012). What stakeholders think about marine protected areas: case studies from Spain. Hum. Ecol. 40, 185–197. doi: 10.1007/s10745-012-9459-6
Johnston, F. F., Arlinghaus, R., and Dieckmann, U. (2010). Diversity and complexity of angler behavior drive socially optimal input and output regulations in a bioeconomic recreational fisheries model. Can. J. Fish. Aquat. Sci. 67, 1507–1531. doi: 10.1139/F10-046
Kavadas, S., Maina, I., Dalamas, D., Dokos, I., Pantazi, M., and Vassilopoulou, V. (2015). Multi-criteria decision analysis as a tool to extract fishing footprints: application to small scale fisheries and implications for management in the context of the Maritime spatial planning directive. Medit. Mar. Sci. 16, 294–304. doi: 10.12681/mms.1087
Lee, W., Lau, H., and Samson, T. (2001). A fuzzy analytic hierarchy process approach in modular product design. Expert Syst. 18, 32–42. doi: 10.1111/1468-0394.00153
Leung, P. S. (2006). Multiple-criteria decision making (MCDM) applications in fishery management. Int. J. Environ. Technol. Manage. 6, 96–110. doi: 10.1504/IJETM.2006.008255
Leung, P. S., Muraoka, J., Nakamoto, S. T., and Pooley, S. (1998). Evaluating fisheries management options in Hawaii using analytic hierarchy process (AHP). Fish. Res. 36, 171–183. doi: 10.1016/S0165-7836(98)00097-6
Levary, R., and Wan, K. (1998). A simulation approach for handling uncertainty in the analytic hierarchy process. Eur. J. Oper. Res. 106, 116–122. doi: 10.1016/S0377-2217(97)00134-3
Linke, S., Dreyer, M., and Sellke, P. (2011). The Regional Advisory Councils: what is their potential to incorporate stakeholder knowledge into fisheries governance? Ambio 40, 133–143. doi: 10.1007/s13280-010-0125-1
Mardle, S., and Pascoe, S. (1999). A review of applications of multiple–criteria decision-making techniques. Mar. Resour. Econ. 14, 41–63. doi: 10.1086/mre.14.1.42629251
Nielsen, J. R., and Mathiesen, C. (2006). Stakeholder preferences for Danish fisheries management of sand eel and Norway pout. Fish. Res. 77, 92–101. doi: 10.1016/j.fishres.2005.08.002
Pascoe, S., Brooks, K., Cannard, T., Dichmont, C. M., Jebreen, E., and Schirmer, J. (2014). Social objectives of fisheries management: what are managers' priorities? Ocean Coast. Manage 98, 1–10. doi: 10.1016/j.ocecoaman.2014.05.014
Prigent, M., Fontenelle, G., and Rochet, M.-J, Trenkel, V. M. (2008). Using cognitive maps to investigate fishers' ecosystem objectives and knowledge. Ocean Coast. Manage. 51, 450–462. doi: 10.1016/j.ocecoaman.2008.04.005
Rochet, M-J., Prigent, M., Bertrand, J. A., Carpentier, A., Coppin, F., Delpech, J-P., et al. (2008). Ecosystem trends: evidence for agreement between fishers' perceptions and scientific information. ICES J. Mar. Sci. 65, 1057–1068. doi: 10.1093/icesjms/fsn062
Röckmann, C., Ulrich, C., Dreyer, M., Bell, E., Borodzicz, E., Haapasaari, P., et al. (2012). The added value of participatory modelling in fisheries management – what has been learnt? Mar. Policy 36, 1072–1085. doi: 10.1016/j.marpol.2012.02.027
Rossetto, M., Bitetto, I., Spedicato, M. T., Lembo, G., Gambino, M., Accadia, et al. (2015). Multi-criteria decision-making for fisheries management: a case study of Mediterranean demersal fisheries. Mar. Policy 53, 83–93. doi: 10.1016/j.marpol.2014.11.006
Russo, T., Bitetto, I., Carbonara, P., Carlucci, R., D'Andrea, L., Facchini, M. T. G., et al. (2017). A holistic approach to fishery management: evidence and insights from a central mediterranean case study (Western Ionian Sea). Front. Mar. Sci. 4:193. doi: 10.3389/fmars.2017.00193
Saaty, T. L. (2003). Decision-making with the AHP: why is the principal eigenvector necessary. Eur. J. Oper. Res. 145, 85–91. doi: 10.1016/S0377-2217(02)00227-8
Saaty, T. L. (2008). Decision making with the analytic hierarchy process. Int. J. Services Sci. 1, 83–98. doi: 10.1504/IJSSCI.2008.017590
Sartor, P., Colloca, F., Maravelias, C., and Maynou, F. (2014). Critical assessment of the current understanding/knowledge of the framework of the ecosystem approach to fisheries in the Mediterranean and Black Seas. Sci. Mar. 78S1, 19–27. doi: 10.3989/scimar.04021.17B
Shelton, P. A. (2007). The weakening role of science in the management of groundfish off the east coast of Canada. ICES J. Mar. Sci. 64, 723–729. doi: 10.1093/icesjms/fsm008
Soma, K. (2003). How to involve stakeholders in fisheries management – a country case study in Trinidad and Tobago. Mar. Policy 27, 47–58. doi: 10.1016/S0308-597X(02)00050-7
Spedicato, M. T. (2016). Study on the Evaluation of Specific Management Scenarios for the Preparation of Multiannual Management Plans in the Mediterranean and the Black Sea. Final Report, CALL MARE/2014/27, CONTRACT NUMBER - EASME/EMFF/2014/1.3.2.7/SI2.703 193. doi: 10.2826/85917
Suuronen, P. (2005). Mortality of Fish Escaping Trawl Gears. FAO Fisheries Technical Paper. No. 478. Rome: FAO.
Tam, C. M., Tong, T. K. L., and Chiu, G. W. C. (2006). Comparing non-structural fuzzy decision support system and analytical hierarchy process in decision-making for construction problems. Eur. J. Oper. Res. 174, 1317–1324. doi: 10.1016/j.ejor.2005.03.013
Keywords: multi criteria decision analysis, data collection framework, indicators, fishery management plan, north Mediterranean Sea
Citation: Lembo G, Bellido JM, Bitetto I, Facchini MT, García-Jiménez T, Stithou M, Vassilopoulou VC and Spedicato MT (2017) Preference Modeling to Support Stakeholder Outreach toward the Common Fishery Policy Objectives in the North Mediterranean Sea. Front. Mar. Sci. 4:328. doi: 10.3389/fmars.2017.00328
Received: 28 February 2017; Accepted: 29 September 2017;
Published: 20 October 2017.
Edited by:
Simone Libralato, National Institute of Oceanography and Experimental Geophysics, ItalyReviewed by:
Matteo Zucchetta, Università Ca' Foscari, ItalyManuel J. Zetina-Rejón, Instituto Politécnico Nacional, Mexico
Copyright © 2017 Lembo, Bellido, Bitetto, Facchini, García-Jiménez, Stithou, Vassilopoulou and Spedicato. This is an open-access article distributed under the terms of the Creative Commons Attribution License (CC BY). The use, distribution or reproduction in other forums is permitted, provided the original author(s) or licensor are credited and that the original publication in this journal is cited, in accordance with accepted academic practice. No use, distribution or reproduction is permitted which does not comply with these terms.
*Correspondence: Giuseppe Lembo, bGVtYm9AY29pc3BhLml0