 Baris Salihoglu
 Sinan S. Arkin
 Ekin Akoglu
 Bettina A. Fach
- Institute of Marine Sciences, Middle East Technical University, Erdemli, Turkey
Here we present a case study toward producing quantitative scientific advice on the application of the EU Common Fisheries Policy (CFP) in the Black Sea. We provide estimates of fishing mortality rates at levels which will lead to rebuilding and maintaining stocks above biomass levels that could produce maximum sustainable yield (MSY) under the IPCC RCP4.5 future climate scenario together with the business as usual (BAU) river discharge scenario. In this study, we have implemented a coupled, basin-scale circulation-biogeochemical model and used its output to feed a food web model to test near-future changes that may be observed in the Black Sea ecosystem under the influence of contemporary fisheries exploitation conditions. In order to test model response to changes in climate and related drivers, the future climate scenario (2015–2020) simulation was compared to the present day (2000–2014) simulation. Likewise, to test the sensitivity of the higher trophic level food web model to changes in fishing pressure, a future estimate of fishing pressure was projected based on its respective contemporary value and applied to each fish stock. Using these models, fishing mortality rates that could produce the maximum sustainable yield (FMSY) in future years 2015–2020 and ensure the long-term recovery of the predatory fish stocks of the Black Sea are predicted. Future projections suggest that all fish stock will decrease in all the regions of the Black Sea except for sprat. Anchovy is expected to show the highest decrease in biomass. Analyses on FMSY estimates show that a significant reduction in fisheries exploitation is required for the sustainable management of the Black Sea ecosystems and the related services. This study, for the first time, presents future stock size, FMSY, and MSY estimates for the Black Sea for 11 fish species. FMSY values are generally lower than estimates of the scientific, technical, and economic committee for fisheries (STECF), mainly because of the explicit food web interactions that the modeling system allows to be considered.
Introduction
Reliable predictions of changing fish stocks should involve an assessment of changes in environmental factors and climate, as well as consideration of food web interactions. Quantitative approaches for making predictions of marine fish stock development are mostly based on target specie(s) rather than an ecosystem approach. Furthermore, a methodological distinction can be made between statistical and process-based models. In statistical approaches, empirical relationships are developed between a restricted number of biotic (e.g., number of recruits, spawning stock biomass, fodder zooplankton) and abiotic parameters (e.g., sea surface temperature, salinity, atmospheric teleconnections such as NAO) and observations of fish production (e.g., Daskalov, 2003; Llope et al., 2011). Typically, as is the case for most stocks, biotic and abiotic parameters act and interact simultaneously. However, although single-species statistical approaches are helpful for understanding the parameters in the past, they tend to fail for future predictions as the system itself is dynamic and the number of processes and their interactions are in a state of continuous change. When revisited with new data, as in the scope of developing management strategies, statistical approaches typically break down and have in general not proved useful for either fisheries or environmental management (e.g., Myers and Mertz, 1998).
Process-based target species models such as Individual Based Models (IBMs) (e.g., Werner et al., 2001; Paris et al., 2007), bioenergetics models (e.g., Guraslan et al., 2014), Dynamic Energy Budget (DEB) models (Kooijman, 1986, 2000) simulate the dynamics of e.g., feeding, growth, and metabolism, during some or all life stages of a species, sometimes also tracking transport of eggs, larvae, and individuals as a function of hydrodynamic and environmental conditions. Similar to the aforementioned statistical approaches, these tools only address a restricted number of the processes linked to production and are rarely tested against the actual reproductive and growth-related dynamics of stocks. They provide useful information in support of fisheries, but only partially describe the complexity of interactions occurring in marine systems. As ecosystems consists of a large number of interacting components and processes, direct effects of environmental change on a particular component may be compounded by secondary effects arising from the feedback between the different ecosystem components.
Models of Intermediate Complexity for Ecosystem assessment (MICE) provide a link between full ecosystem models and single-species models typically used in fisheries management. MICE incorporate best feature of existing single-species models and has the ability to apply standard statistical methods for parameter estimation and can include ecological interactions based on defined objectives (Plaganyi et al., 2014). However, studies performed using MICE also show the importance of including complex trophic interactions between species and the need for developing food web models or “whole of ecosystem models” to allow evaluation of impacts on a broader set of predators (Plaganyi et al., 2014; Punt et al., 2016).
Food web models not only include a broader set of interactions among species but they also capture most of the major processes and interactions occurring in the sea and permit the assessment of both primary and secondary effects of climate and management changes on selected target species. Furthermore, when driven by the outputs of coupled hydrodynamic-ecosystem models they can also integrate the response of the physical environment, planktonic ecosystems, and habitat to climate change (Akoglu, 2013).
The Black Sea is widely accepted to be one of the basins that is highly impacted by a suite of human-induced stressors in addition to climate change (Oguz et al., 2006). The main stressors include eutrophication and hypoxia, overfishing, and introduction of alien species (e.g., BSC, 2008; Oguz and Velikova, 2010). Combinations of these stressors are considered to be the main cause of the degradation of the Black Sea marine ecosystem, which has undergone dramatic changes since the early 1970s. These changes are also highly influenced by climate change (Oguz et al., 2006) and trophic interactions (Akoglu et al., 2014). For example, climate change modulates primary production in marine systems through several mechanisms: direct physiological responses of organisms to changes in water temperature, water column stability and vertical transport, circulation processes which also distribute the high nutrient land based waters. Without considering all these factors, it is not possible to do an accurate assessment of the future ecosystem development including fish populations, especially considering that an ecosystem under the effect of multiple stressors is highly susceptible to the effects of climate change (e.g., Doney et al., 2012). When developing management strategies and solutions for the Black Sea basin, it is especially important to consider the effects of the changing environment and the changing ecosystem within a single system with interacting components.
Fish stocks in the Black Sea have undergone a series of shifts in parallel to the changes in the environment and increase in fisheries pressure. After the depletion of large and medium predatory fishes, anchovy in particular, and small pelagic fish in general, started acting as the top predators by the early 1970s and were exposed to a major stock collapse at the end of 1980s. During the last 25 years, the southeastern region has been the only part of the Black Sea sustaining noticeable fish stocks. In particular, the small pelagic fishery has been limited primarily to an economically low-value anchovy at a level generally higher than the maximum sustainable catch size (STECF-15-16, 2015). The remaining areas (i.e., the western, eastern, and northern regions) have supported low fish stocks/landings, and have been under a gelatinous-controlled ecosystem state (Oguz et al., 2001).
The recent stock assessment report (STECF-15-16, 2015) gave the most up-to-date status of the Black Sea fishery. In this report, quantitative stock assessments for eight species of commercial fish in the Black Sea were carried out. Only the assessment of turbot and sprat were considered of enough quality to conduct short term forecast. For all the other fish (i.e., whiting, Mediterranean horse mackerel, Black Sea anchovy, spiny dogfish, thornback ray, and red mullet) short term forecasts were not possible. All assessments were considered to be of enough quality to define the status of the stocks in terms of fishing mortality (F) (or exploitation rate, E) with respect to FMSY (the fishing mortality or exploitation rate required to achieve maximum sustainable yield).
The recent scientific, technical and economic committee for fisheries (STECF) report STECF-15-16 advises that for spiny dogfish there should be no directed fishery and for the other stocks (turbot, red mullet, anchovy, horse mackerel, whiting, and thornback ray) catches and/or effort to be reduced until fishing mortality is below or at the proposed FMSY level, in order to avoid future loss in stock productivity and landings.
This paper is designed to provide scientific input for the future implementation of EU Common Fisheries Policy (EC regulation 1380/2013) which aims at implementing a community system for the conservation of marine biological resources and for the management of fisheries exploitation in order to guarantee ecological, economic, and social sustainability. Thus, the results of this paper provide (i) an assessment of the current status (2000–2014) of the Black Sea ecosystem, (ii) changes in ecosystem structure and fish stocks under a future climate scenario including future river nutrient load development (2015–2020), (iii) quantitative advice on fishing mortality rates that would allow rebuilding and maintaining of the fish stocks under changing environment and climate conditions.
Methods
To assess the current status of the Black Sea ecosystem an end-to-end modeling system consisting of a circulation model, a biogeochemical model, and a higher trophic level model were used to simulate the present day (2000–2014) ecosystem conditions and were validated against available in-situ and satellite derived observations. To be able to forecast changes in ecosystem structure and fish stocks in the near future, this end-to-end model was further run with atmospheric forcing generated using a climate model run under the IPCC RCP4.5 emissions scenario together with future predictions of river nutrient loads for the time frame 2015–2020. Below, the details of the modeling system are given, followed by a discussion on model validation, as well as a description of the different simulations used in this study.
Integrated Modeling System
The modeling system used in the study is composed of three models developed, used and validated for the Black Sea in previous EU 7th Framework Programme funded project OPEC (Allen et al., 2014). The different models in the modeling system are coupled with each other through an end-to-end approach with one-way coupling where the currents, mixing, and temperature predictions made by the physical model are fed into the biogeochemical model (Figure 1). There they are used to simulate the spatiotemporal distribution of biogeochemical variables including plankton densities and abiotic nutrient concentrations. The biotic components in the biogeochemical model are then fed into the higher trophic level model (Figure 2), where they are used as resources for fish and marine mammal populations. The physical model used for the Black Sea is a parallel implementation of the Princeton Ocean Model (POM) called the Stony Brook Parallel Princeton Ocean Model (sbPOM). The biogeochemical model is the Black Sea Integrated Modeling System (BIMS) which includes representations of phytoplankton growth on abiotic nutrients and light, the interaction between phytoplankton and zooplankton communities, the microbial loop as well as the redox dynamics within the sub-oxic zone (Figure 1). The higher trophic level model, Ecopath with Ecosim (EwE) includes representation of 11 commercially exploited fish species in the Black Sea (Figure 2). These are anchovy, sprat, Atlantic mackerel, horse mackerel, bonito, whiting, turbot, spiny dogfish, shad, red mullet, and bluefish. The dynamics of the higher trophic level organisms are driven by the plankton dynamics provided by the biogeochemical model as well as the trophic interactions between different higher trophic level organisms.
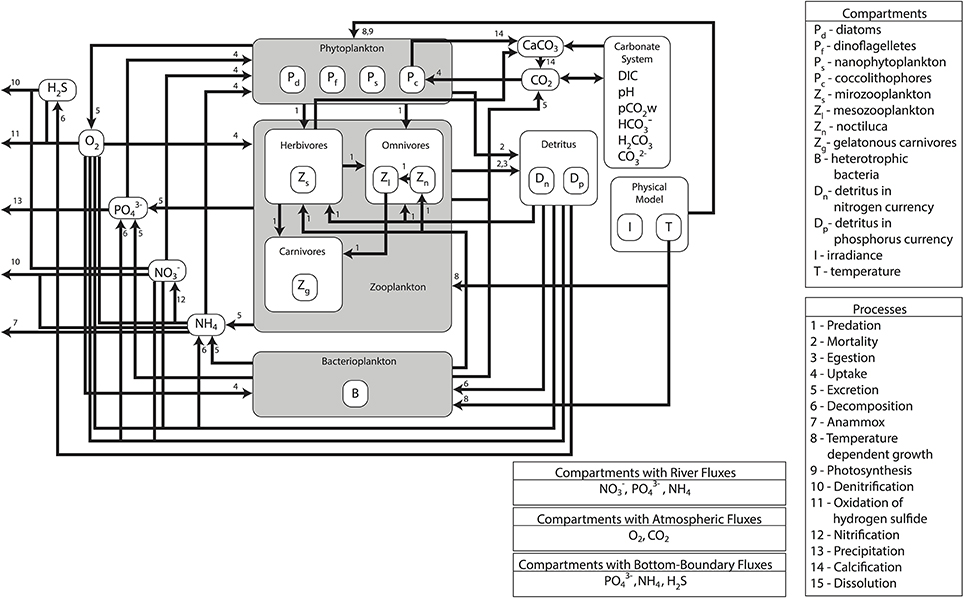
Figure 1. Schematic of the lower trophic level model setup and trophic interactions used in the study. The model includes four phytoplankton groups, three zooplankton groups, two detritus groups, bacterioplankton and nutrients (NO3, NH4, PO4) and a detailed representation of the carbonate cycle.
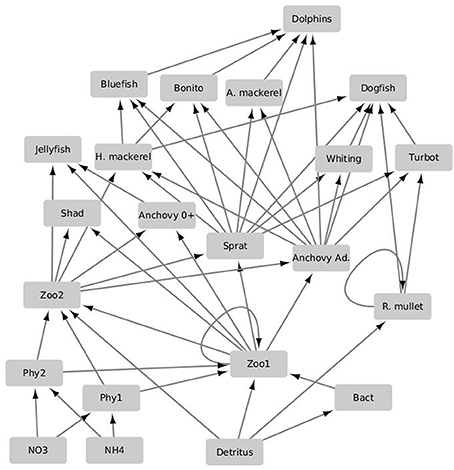
Figure 2. Schematic of the lower trophic level integrated higher trophic level model EwE used in the study. The planktonic and non-living model compartments as well as their related flows and uptakes are referenced to and parameterized according to the biogeochemical model. The arrows denote directions of predatory and uptake flows. Functional groups are abbreviated as follows: Atlantic mackerel (A. mackerel); adult anchovy (Anchovy ad.); larval anchovy (Anchovy 0+); red mullet (R. mullet); horse mackerel (H. mackerel); microzooplankton (zoo1); mesozooplankton (zoo2); dinoflagellates, diatoms and coccolithophores (phy1); nanophytoplankton (phy2); bacteria (Bact), nitrate (NO3); ammonium (NH4).
The domain of the physical model includes the whole of the Black Sea except the Sea of Azov with a 4 × 4 km horizontal grid and a 35 level, terrain-following sigma-coordinate, vertical grid. It uses Mellor-Yamada 2.5 turbulence parameterization (Blumberg and Mellor, 1987), incorporates parameterizations for the water fluxes at the Bosphorus and includes nine of the largest rivers that flow into the Black Sea. The physical model was initialized using World Ocean Atlas fields (WOA; Locarnini et al., 2013; Zweng et al., 2013) monthly climatology and spun up for 5 years. Then a hindcast simulation for the 2000–2014 period and forecast simulation for the 2015–2020 period were undertaken.
The biogeochemical model BIMS, is based on a 1D model by Oguz et al. (2001) and an earlier 3-D version of the model (Cannaby et al., 2015). The vertical grid was designed to provide sufficient resolution at the surface and sub-surface layer where most of the biogeochemical dynamics take place. The biogeochemical model contains 30 state variables that include four phytoplankton types, four zooplankton types, oxygen, hydrogen sulfide, inorganic nutrients, and detritus in both nitrogen and phosphorus currencies as well as the carbonate system variables (Figure 1). Autotrophs are represented by four types of phytoplankton; bacillariophyta (diatoms; Pd), dinophyta (non-toxic dinoflagellates; Pf), chrysophyta (coccolithophores; Pc), and the small phytoplankton group (Ps) representing picophytoplankton (e.g., Synechococcus spp., Prochlorococcus spp., picoeukaryotes) and nanophytoplankton (e.g., autotrophic flagellates). Coccolithophores are introduced as a separate group due to their special feature of calcification (CaCO3 formation).
Consumers comprise four zooplankton functional/species groups: the microzooplankton (Zs) group with a size of <200 mm (dominated by heterotrophic flagellates and ciliates), the mesozooplankton (Zl) group with a size range of 0.2–2 mm (consisting of copepods, cladocerans, and appendicularians), the opportunistic omnivorous dinoflagellate species Noctiluca scintillans (Zn) and a combined functional group consisting of the carnivorous gelatinous species Mnemiopsis leidyi and Aurelia (Zg). The bacterioplankton group (B) decomposes particulate organic nitrogen (Dn) and phosphorus (Dp) to produce inorganic nutrients ammonium (NH4) and phosphate (PO4). The model includes a simplified representation of nitrification where ammonium (NH4) is directly turned into nitrate (NO3) at a rate dependent on dissolved oxygen concentrations (O2).
Hydrogen sulfide (H2S) is an additional state variable describing the redox processes across the suboxic-anoxic interface. The processes of chemolithotrophic denitrification and anaerobic denitrification are also included in the model and control the upward fluxes of ammonia and hydrogen sulfide and the downward fluxes of nitrate in the suboxic zone. Processes related to the manganese and iron cycles are not represented explicitly, but are parameterized implicitly for simplicity. Carbon dioxide (CO2) and Calcium Carbonate (CaCO3) concentrations form two state variables of the carbonate module.
The higher trophic level (HTL) model used is the time-dynamic Ecopath with Ecosim (EwE) model of the Black Sea (Akoglu, 2013) (Figure 2). In this study, the model is slightly modified to match the biogeochemical model's trophic structure. The model includes 23 functional groups and is parameterized using spatial averages of the required lower trophic level compartments and flows between them as detailed in Libralato and Solidoro (2009). The 23 functional groups (Figure 2), are comprised of 11 fish groups; Black Sea anchovy (Engraulis encrasicolus ponticus), Black Sea sprat (Sprattus sprattus phalaericus), Pontic shad (Alosa kessleri pontica), Black Sea horse mackerel (Trachurus mediterraneaus ponticus), bonito (Sarda sarda), bluefish (Pomatomus saltator), Atlantic mackerel (Scomber scombrus), turbot (Psetta maeotica), spiny dogfish (Squalus acanthias), Black Sea whiting (Merlangius merlangus euxinus), and red mullet (Mullus barbatus ponticus). Anchovy is defined as an ontogenetic group and is separated into juvenile “0” and adult “1+” life stages. Two fishing types were defined: trawlers and purse seiners to represent the fisheries impact on the ecosystem.
In addition, it includes two jellyfish; Mnemiopsis leidyi, Aurelia, pooled into one group; three detritus groups; one group representing sediment and two representing ammonium and nitrate; two phytoplankton and two zooplankton (non-gelatinous, fodder zooplankton) groups; one bacteria group; and one dolphin group to represent the Black Sea marine mammals, which are composed of short-beaked common dolphin (Delphinus delphis), bottlenose dolphin (Tursiops truncatus), and harbor porpoise (Phocoena phocoena).
The mass-balance model was setup and balanced for the quasi-pristine conditions of the early 1960s. The diet composition matrix of the model was largely based on data available by stomach content analysis and compiled from FishBase (Froese and Pauly, 2011) and based on Akoglu et al. (2014). The specific model setup, concerning the input to the model as well as the diet composition matrix is detailed in Tables S1, S2. The initial EwE model of the Black Sea was run one-way and offline coupled with the BIMS model (Figure 2) following the methodology detailed in Libralato and Solidoro (2009).
Model Scenarios
Atmospheric forcing for the 2010–2014 period simulation was taken from the COSMO-CLM 14-km spatial resolution (Rockel et al., 2008) atmospheric fields. Atmospheric forcing of the potential future climate scenario (2015–2020) was based on the Intergovernmental Panel for Climate Change (IPCC) RCP4.5 greenhouse gas emission scenario. This scenario represents a future world in which emissions peak around mid-century and predicts a global temperature increase of about 1.8°C by the end of the century (IPCC, 2013). However, considering that the present study is only concerned with the near-future (until 2020), the particular emissions scenario used in atmospheric forcing is expected to be minimally relevant.
River water, nitrate and phosphate discharge rates for the major rivers along the Black Sea were obtained from Ludwig et al. (2009) as well as the Black Sea Commission's river database. In total nine rivers are considered in this study that make up a mean yearly discharge of 320 km3 yr−1, of which Danube contributes 2/3rd of the discharge and the four major rivers emptying on the northwestern shelf, Danube, Dniepr, Dniestr, and Southern Bug, contribute 89% of the water discharge into the Black Sea. The forecast simulation was undertaken using the “business as usual” (BAU) river discharge conditions considering the anthropogenic pressure acting on the Black Sea. This is one of five different futures of the Southern European Seas that were calculated based on the Millennium Ecosystem Assessment (MEA) (Alcamo et al., 2005). The BAU scenario assumes that fertilizer use efficiency after 2010 does not change and is predicting continuous high nutrient loads of Black Sea rivers.
To assess the regional impact of different climate scenarios, the Black Sea was divided into five different regions that cover three coastal regions (broader northwestern shelf region, southern coast, northeastern coast) as well as the eastern and western inner basins (Figure 3). The regions were defined following bottom bathymetry to divide between coastal and deep sea regions. The deep basin was divided into two regions, east and west, roughly following the semi-enclosed circulation features of the eastern and western gyre. The coastal regions were divided to define the northwestern shelf region, the region known to be a nursery region for many fishes of the Black Sea, as well as those regions influenced by the major freshwater input plume from the shelf as the region between Crimea to Zonguldak on the southern Black Sea coast. A second coastal region was defined between Zonguldak and Batumi (Georgia) where the majority of fish catches occur, so it covers the major fishing area important for anchovy and other fisheries. The last region was defined to reach from Batumi to Crimea, which is the second most important fishing ground in terms of catches following the Zonguldak-Batumi region and exploited mainly by the Russian and Georgian fleets.
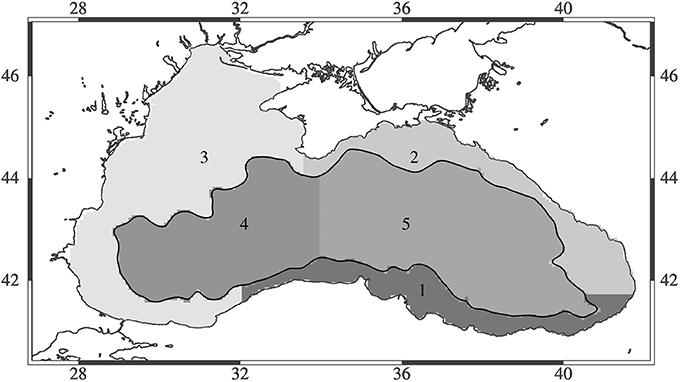
Figure 3. Map of the Black Sea showing the five different regions assessed in this study.
With the coupled hydrodynamic-biogeochemical model the following simulations were undertaken. The present-day simulation (2000–2014) was performed using the COSMO-CLM 14-km resolution atmospheric fields and the present-day river water, nitrate, and phosphate discharge rates obtained from Ludwig et al. (2009) and the Black Sea Commission's river database. Thereafter, a future climate scenario (2015–2020) was undertaken using the IPCC RCP4.5 greenhouse gas emission scenario together with the BAU river forecast scenario. The outcomes of the two periods were then compared to assess the influence of climate variability on the ecosystem in the defined regions.
With the Ecopath with Ecosim model the hindcast scenario (2000–2014) was performed using primary productivity from the biogeochemical model and fishing mortality values for exploited species from STECF report (STECF-15-16, 2015) as forcing. The present-day simulation results were fit to the catch statistics and Extended Survivors Analysis (XSA) stock estimates for fish groups from the STECF report and biogeochemical model outputs for plankton groups. The future scenario (2015–2020) was run utilizing projected primary productivity from the biogeochemical model and constant contemporary fishing mortality values of 2014 until 2020 as forcing throughout the simulation. The outcomes of the two periods were then compared to assess the influence of climate variability in the defined regions.
Once the EwE model was fit to observations and validated, varying fisheries exploitation levels were investigated to obtain FMSY values for exploited species utilizing the EwE MSY routine for each year between 2000 and 2020. The management strategies suggested in this study are based on these results. The methodology applied in this study is the “multi-species FMSY” search routine of EwE model. This routine simulates the Ecopath food web model over time under dynamic trophic interactions with varying fishing mortalities for the functional group in question, i.e., the one for which FMSY is being searched, while keeping the fishing mortalities of all other species as constant at the level of the initial Ecopath mass-balance. It runs the model to equilibrium and considers the fishing mortality (F) which corresponds to the tipping point of the maximum yield as FMSY (Marta Coll and Jeoren Steenbeek, pers. comm.).
Model Validation
To assess model skill, a quantification of the misfit between model results and observations needs to be performed (Jolliff et al., 2009). Many studies have demonstrated the importance of using a suite of metrics for model validation, e.g., Saux Picart et al. (2012). Use of multiple metrics both aids the identification of differences between the model-generated data and available observations, and provides insight into the cause of the differences. In this study a suite of univariate (e.g., Jolliff et al., 2009; Stow et al., 2009) metrics including RMSE (root mean square error), bias, unbiased RMSE, and Pearson Correlation Coefficient were used to assess the skill of and benchmark model outputs. The variables compared against data are Temperature (T), Salinity (S) as well as concentrations of nitrate (NO3), dissolved oxygen (DO), hydrogen sulfide (H2S), ammonia (NH4), Phosphare (PO4), and Chlorophyll-a (CHL).
Observational data used to validate the circulation and biogeochemical models were compiled from all available data obtained from the Black Sea database (produced following the NATO SfP ODBMS project; http://sfp1.ims.metu.edu.tr). The relative performance of the simulation in reproducing observed parameters are summarized using Taylor (2001) and Target diagrams. Simulated circulation fields are additionally compared qualitatively to satellite derived observations using the AVISO+ (Archiving, Validation, and Interpretation of Satellite Oceanographic data) Sea Level Anomalies (SLA) regional product for the Black Sea. (http://www.aviso.altimetry.fr/en/data/products/sea-surface-height-products/regional/msla-black-sea.html). The mean sea surface height provided by Korotaev et al. (2003) was added to the AVISO fields to compute the absolute dynamic height (ADT) of the Black Sea. ADT was then used to compute the geostrophic currents that were compared to model surface currents.
One way to validate the biogeochemical model is to compare model chlorophyll a concentrations with available satellite data. To do so chlorophyll data was obtained from the European Service for Ocean Color (GlobColor) Global product (http://globcolour.info), which includes reprocessed Level 3 data from satellites MERIS, MODIS AQUA, SeaWIFS, and VIIRS for the period 1998–2014. Of the different satellite data used to create this product the MERIS data was produced using the OC4Me algorithm, SeaWIFS data was produced with the OC4v5 algorithm, and the MODIS/VIIRS data were produced using the OC3v5 algorithm. The GlobColor data set consists of daily maps of near-surface chlorophyll a concentration (mg m3) with a 4-km resolution and data has been developed, validated, and distributed by ACRI-ST, France. For validating the biogeochemical model this satellite data set is the best available, however it should be noted that there are errors already associated with this data set. The OC algorithms used in this product have been developed for case 1 waters, which are bodies of water whose optical properties are mainly influenced by phytoplankton and related colored dissolved organic matter (CDOM) and detritus degradation products and often tend to be waters further offshore. The Black Sea however, is mainly composed of case 2 water, i.e., coastal waters influenced strongly by inorganic substances and CDOM whose concentrations do not covary with the phytoplankton concentration (Gordon and Morel, 1983). Hence, these algorithms overestimate chlorophyll concentrations in the Black Sea (Gregg and Casey, 2004; Sancak et al., 2005; Zibordi et al., 2013). Gregg and Casey (2004) document a positive bias of 44% across the entire range of chlorophyll observed and especially at low concentrations. This overestimation is thought to be mainly due to yellow substance or colored dissolved organic matter (CDOM) (Burenkov et al., 2000). In addition, Cokacar et al. (2001) found high reflectance in the Black Sea due to coccoliths that also may be causing overestimation. In addition, when calculating time-averages of % errors between the different satellite data sets used to compile this chlorophyll product (not shown here) this error is between 100 and 120% in the entire Black Sea basin. Only the northwestern shelf region, where satellite algorithms traditionally do poorly due to high CDOM concentrations from riverine input, displays errors below 100%, indicating all algorithms have similar difficulties detecting chlorophyll in this region. Therefore, when comparing model results with satellite data this high error associated with satellite observations should be kept in mind.
The HTL model validation of fish stocks was carried out by comparing model results with XSA estimates for biomass and catch statistics for model catch (STECF-15-16, 2015) using a suite of univariate (e.g., Jolliff et al., 2009; Stow et al., 2009) metrics similar to the physical model validation. Although, XSA is the most widely used single-species stock assessment method, it is tightly coupled to catch statistics and assumes that catch and catch-at-age data are fixed. Biomass is estimated based on this and the presence of a tuning index, whose value is assumed to be proportional to biomass at sea. This method includes uncertainties (Shepherd, 1999) also it excludes explicit trophic interactions and summarizes all the food web-related processes in one single empirically calculated term, natural mortality. Mechanistic trophic models however, such as EwE used in this study, include explicit representations of prey-predator interactions in the food web. Beyond that, statistically the fit of the model to the data were assessed using sum of squared deviations (SS) of log estimates of biomass and catches against the log data of biomass and catches of fish species and Akaike Information Criterion (AIC).
Considering that the EwE model was used to produce FMSY estimates, which the management advice from this study is based on, a Monte-Carlo type parameter search routine was carried out for the base Ecopath model parameters. The initial parameters of the Ecopath model (i.e., production per unit of biomass and production per unit of consumption) were ranged within a given coefficient of variation (10%) and the Ecosim model for the hindcast period (2000–2014) was run and its output was compared against the biogeochemical model outputs as well as XSA and catch statistics data to obtain better values for the parameters. This approach provided a better fit for the dynamic Ecosim model to the reference data, hence, addressing some uncertainty due to our parameterization. The final values used for simulations are given in Table S1.
In addition, as discussed in section Changes in Ecosystem Structure and Fish Stocks under Future Climate Scenarios we provided uncertainty ranges of our estimates. To obtain the given ranges, we carried out the FMSY estimation routine for each year in the whole simulation period by utilizing each year's corresponding fisheries exploitation and biomass levels (21 FMSY values for 21 years). This helped us to calculate what would have been the optimum fisheries exploitation level if each year's stock and fisheries exploitation levels had been considered. The optimum fisheries exploitation levels were calculated separately for each year's stock and fisheries exploitation levels. Assuming that the future stocks' progressions fluctuates within their corresponding historical ranges, the ranges given in section Changes in Ecosystem Structure and Fish Stocks under Future Climate Scenarios provide the uncertainty of our FMSY estimates.
Results
Assessment of the Current Status
The Black Sea is characterized by a basin-wide cyclonic gyre, with an intense, narrow rim current flowing along the shelf edge and a number of anticyclonic eddies along the coast (Oguz et al., 1993; Korotaev et al., 2003; Zatsepin et al., 2003). The circulation structure is predominantly driven by wind stress curl and modulated by seasonal evolution of the surface thermohaline fluxes (Kubryakov et al., 2016). The physical model correctly predicts the overall circulation characteristics of the Black Sea (Figure 4). The modeled rim current flows cyclonically along the steep bottom topography of the continental slope as expected, but is slightly faster in speed than the rim current derived from satellite data and there is a discrepancy between model and observations in the area east of the Crimean Peninsula where the model predicts currents that turn north after passing the peninsula instead of continuing directly west. Furthermore, on the northwestern shelf, model deviates from the observed flow on the northern part of the shelf where the modeled currents flow northward and eastward near the northwestern cost instead of flowing south and west as in the satellite derived fields. This was found to be due to the discrepancy between the observed and modeled wind fields in the area and leads to model uncertainty in the northwestern shelf.
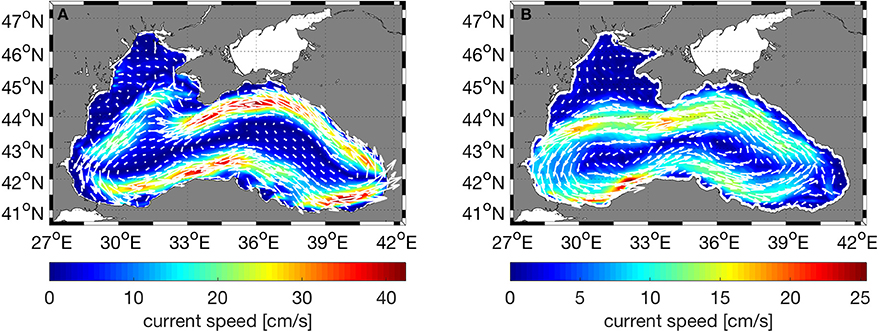
Figure 4. Comparison of (A) model surface currents (cm/s) with (B) geostrophic currents (cm/s) computed from satellite derived absolute dynamic topography. In both plots, the currents were time averaged for 5 years (2010–2014).
Models skill is best for the physical variables, T and S and also for oxygen (Figures 5A,B). The presence of oxygen is a crucial factor in determining the biogeochemical reactions that take place within the Black Sea, and therefore it is important that the model is able to predict oxygen and hydrogen sulfide concentrations relative accurately. Phosphate and ammonium correlate better with the data compared to nitrate; the bias of modeled nitrate is higher (Figures 5A,B). Comparison of chl-a concentrations with satellite data shows that the model is able to reproduce the seasonal bloom dynamics in the Black Sea (not shown here) with low chlorophyll concentrations during summer, the phytoplankton bloom starting in fall (September–October) and continuously high chlorophyll concentrations during winter (Nezlin, 2006; McQuatters-Gollop et al., 2008). Concentrations decrease again in winter with the onset of stratification. The difference in chlorophyll concentration between model and satellite observations (Figure 6) shows regional differences in model skill. The two open sea regions 4 and 5 show a good fit with observations indicating high model skill, whereas in the coastal regions of the Black Sea uncertainty increases (Figure 6). Highest discrepancy is found in the coastal areas of the northwestern shelf specifically along the Danube river mouth, which corresponds to region 3 in this study. Part of this large error is due to satellite estimations of chlorophyll grossly overestimating chlorophyll concentrations in coastal regions (Oguz and Ediger, 2006). This is especially the case for the Black Sea, given the algorithms used in the GlobColor data product. However, in part this error is due to model circulation on the northwestern shelf which is not moving cyclonically as observed but rather water is transported northeastward, reducing production levels at the western coast. Model misfit in region 1 is rather low, the model produces slightly less chlorophyll than observed. While in region 2, close to the northeastern Black Sea coast the chlorophyll values are overestimated by the model. Similar misfits are common among Black Sea models because of the complexity in the circulation and biogeochemical dynamics of the Black Sea (Korotaev et al., 2011; Miladinova et al., 2016).
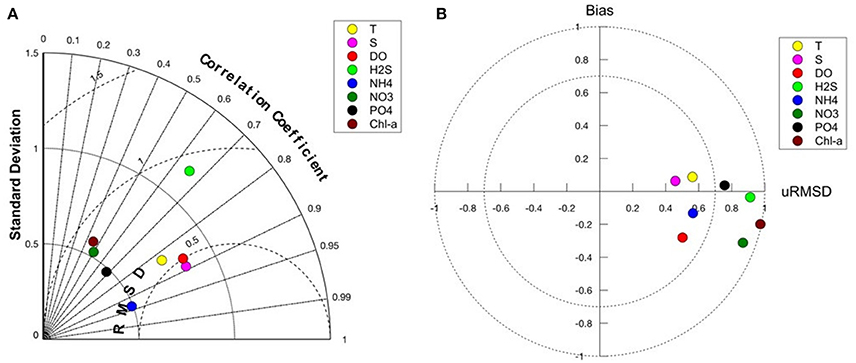
Figure 5. (A) Taylor diagram showing model-data comparison of the lower trophic level model hindcast simulation with data obtained from the Black Sea data base (http://sfp1.ims.metu.edu.tr). The angle describes the correlation between model and data, the distance from the origin is the normalized standard deviation and the dashed circles around reference point (1) on the x-axis defines the root mean squared error. (B) Target diagram of model-data comparison. The y-axis corresponds to the normalized bias, the x-axis corresponds to the unbiased RMSD (root mean square deviation).
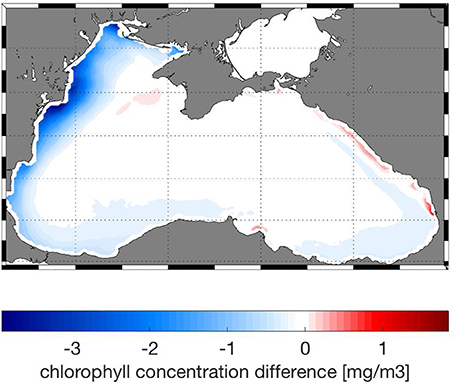
Figure 6. Absolute difference between model and satellite chlorophyll concentrations averaged over 5 years (2010–2014) in mg/m3.
Modeled biomass values of fish generally show good fit with the data (Figure 7). Apart from catches of sprat and predatory fishes; bluefish, bonito and Atlantic mackerel, the HTL model-estimated catch values also show good model skill (Figure 7). Considering sprat, the highest deviations (SS ~ 20) come from fits of sprat catches, for which the XSA biomass estimates were high but catch values reported were low compared to the predicted biomass and the fishing mortality estimates from XSA analysis. This suggests that the catches could possibly be much higher than the reported amount, or that the XSA biomass and fishing mortality estimates include high uncertainties. The same may be suggested for anchovy as well. Illegal, unreported and unregulated (IUU) catch is a common practice in the Black Sea especially for the Turkish fishing fleet, which constitutes the majority of the fishing effort and the catches in the Black Sea. Particularly for small pelagic fish such as sprat and anchovy, IUU catches were shown to be very high (Ulman et al., 2013). Hence, the model simulated catches can be considered to be comparatively more realistic than what is reported by fisheries statistics.
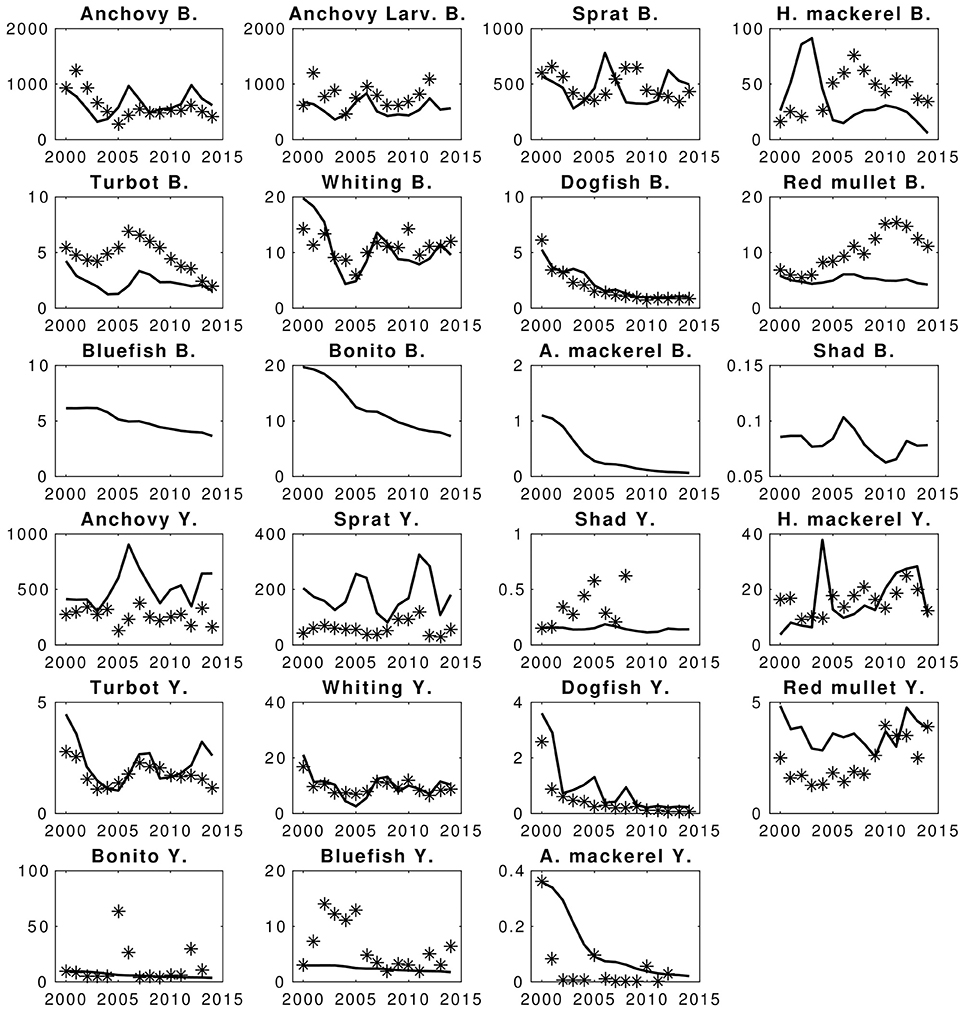
Figure 7. Hindcast simulation results of the EwE fish model and fits to the statistical catches and conventional statistical stock assessment predictions. Stars denote the compared data and lines are the simulation results. X-axis denote years and Y-axis denote catches (Y.) and biomasses (B.) The units are in kilotons.
Predatory fish do not have estimated fishing mortality values, therefore the fishing mortality values calculated for the initial conditions of the model (i.e., of year 2000) were used as constant throughout the hindcast simulation period (2000–2014). Hence, the deviations of model results from the catch values given in STECF-15-16 (2015) for these fish are the main reasons of the total deviation scores calculated for the hindcast scenario (SS ~ 14 for Bluefish catches, SS ~ 14 for Bonito catches and SS ~ 82 for Atlantic mackerel catches). Apart from the catches of these four fish species, the model skill was high (SS = 305, AIC score = 103, against 408 AIC points).
In addition, the statistical properties of the model simulation given in Figure 8 showed uncertainty of simulation results of different groups in reproducing the XSA estimates and catch statistics. The simulation results of biomass and catches of turbot, whiting and dogfish show better confidence in correlation values compared to other groups (Figure 8). However, although other groups had low correlation values with the compared data, the RMSE and bias values were comparatively low (RMSE slightly above 1 and bias of about 10–20%) for the majority of the groups except for horse mackerel and turbot catches, and whiting biomass and catches.
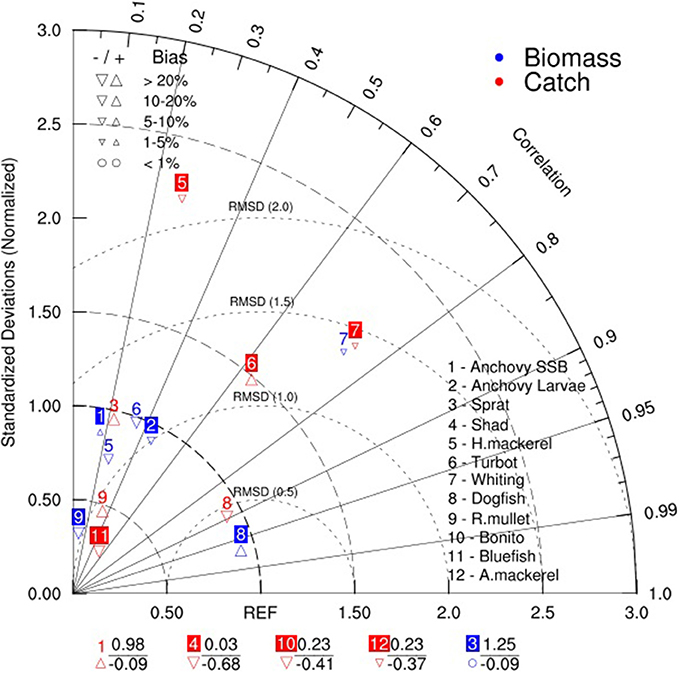
Figure 8. Taylor diagram showing comparison of the higher trophic level model hindcast simulation with data obtained from STECF-15-16 (2015). The angle describes the correlation between model and data, the distance from the origin is the normalized standard deviation and the dashed semi-circles around reference point (REF) on the x-axis define the root mean squared error/distance (RMSD). The labels at the bottom of the figure show summary statistics of groups with negative correlations (below) and their respective normalized standard deviations.
Changes in Ecosystem Structure and Fish Stocks under Future Climate Scenarios
The temporal evolution of net primary production anomalies in the five regions defined in this study (Figure 9A) show great variability in production between different regions and years, as well as seasonal variability. Region 3, the northwestern shelf region, shows the largest range in anomalies followed by the two inner basin regions 4 and 5. All net primary production anomalies are mainly negative after 2014 with region 3 again being the most extreme case with the highest variability (Figure 9A). All regions show the same general trend in anomalies during the future simulation and that is a slight increase until 2017, a sudden drop in 2018 and increase in anomalies thereafter.
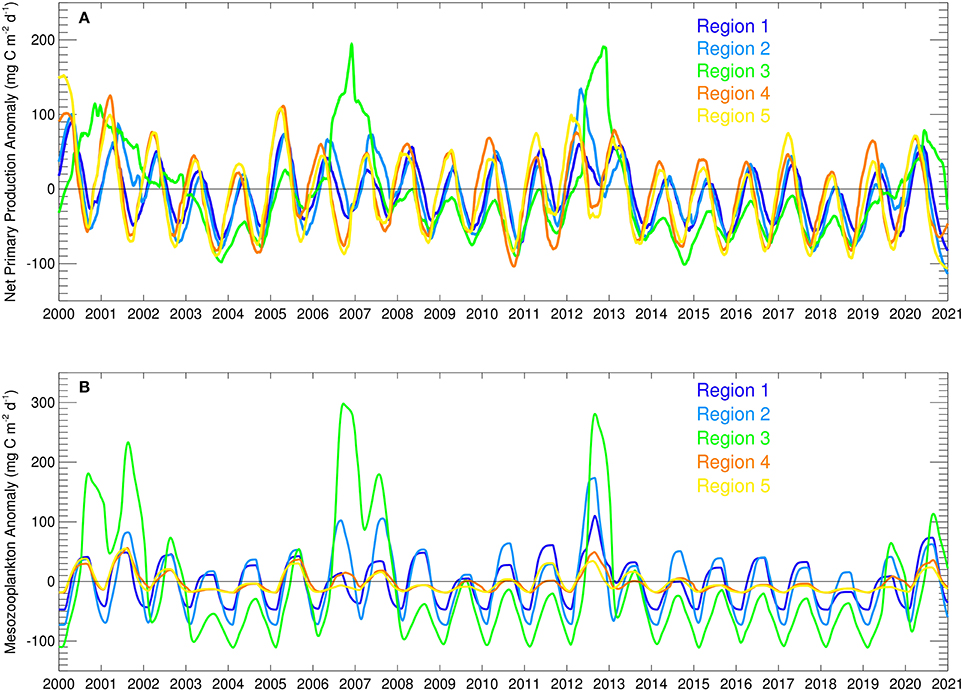
Figure 9. Time series of modeled (A) net primary production anomalies (mg C m−2 d−1) and (B) mesozooplankton biomass anomalies (mg C m−2 d−1) in the five different regions.
Mesozooplankton biomass variability in the five regions (Figure 9B), which is considered as the main food source for small pelagic fish, also show that region 3, the northwestern shelf has the largest range, followed by the other coastal regions 1 and 2. The strong variability of net primary production in region 3 translates into mesozooplankton as well, as expected. All regions show the same general trend in mesozooplankton biomass during the future simulation and that is a slight increase until 2017, a sudden drop in 2018 and increase thereafter. Differently, mesozooplankton biomass in regions 3, 4, and 5 decrease from 2014 to 2018 and only increase in 2019.
Net primary production (NPP) shows an overall decrease in all regions for the future period (Table 1). Much of the reduction in NPP is along the western coast of the Black Sea, the central basin and also along the northeastern coast (Figure 10A). At the same time, future NPP increases in the northern part of the northwestern shelf and to a rather small extent in the western central gyre. Lowest overall reduction occurs in the western gyre of the basin, region 4 (Figure 10A, Table 1). Zooplankton biomass (Table 2) follows this reduction in primary production although the magnitude of decrease is more pronounced (22 vs. 10%). The spatial pattern of increase and decrease of zooplankton follows that of net primary production (Figure 10B) as can be expected. Strongest increase in biomass occurred on the northern-central northwestern basin, while a decrease occurred at the very northern part. Strongest decrease was in a wide band along the western coast extending along the southern coast as well (Figure 10B).
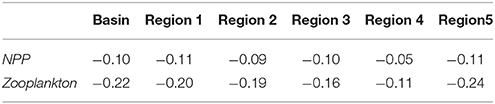
Table 1. Regional fractional changes in biogeochemical model variables between periods 2010–2014 and 2015–2020 in different regions.
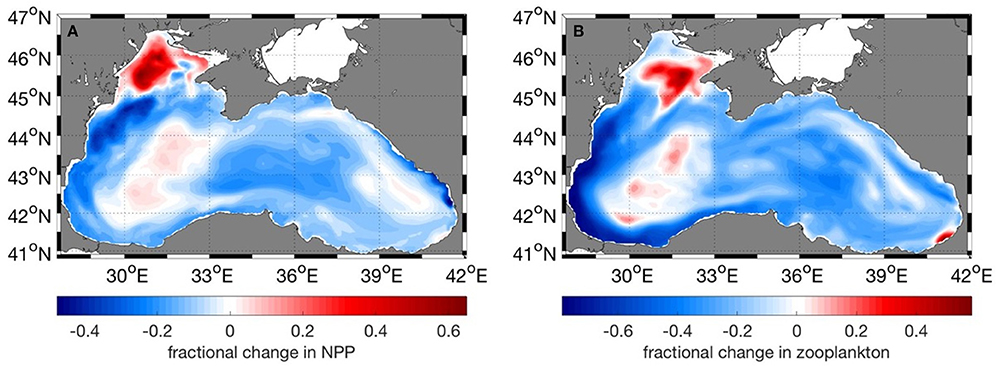
Figure 10. Fractional change of (A) Net Primary Productivity, (B) Zooplankton biomass between the present (2010–2014) and future (2015–2020) periods. Negative values mean a decrease in the years 2015–2020.
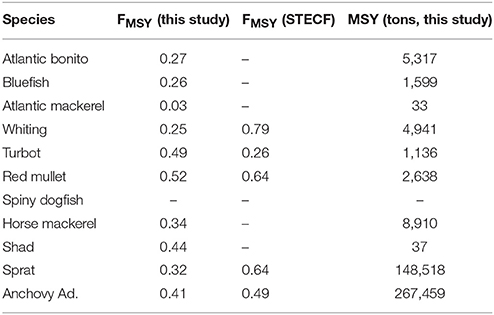
Table 2. Model predictions of fishing mortality (FMSY) and maximum sustainable yield (MSY) for sustainable fisheries exploitation of fish groups in the Black Sea and their comparison to the FMSY values reported in STECF-15-16 (2015).
Despite an average decrease in forecast averaged NPP values for the sub regions (Table 1), in general, most fish stocks are predicted to show an increase after 2018 (Figure 11). These increases are correlated to the NPP anomalies shown in Figure 9A. However, when the overall biomass of future stocks from 2015 to 2020 is compared with the past stock biomass (2000–2014), a decrease occurs for all the species except sprat. Our results show that when fishing mortality levels are kept at levels of 2014, stocks will gradually increase although the overall biomass will not exceed the past average levels. Sprat shows the highest relative increase (Figure 11) because of low fishing mortality rates during the future period.
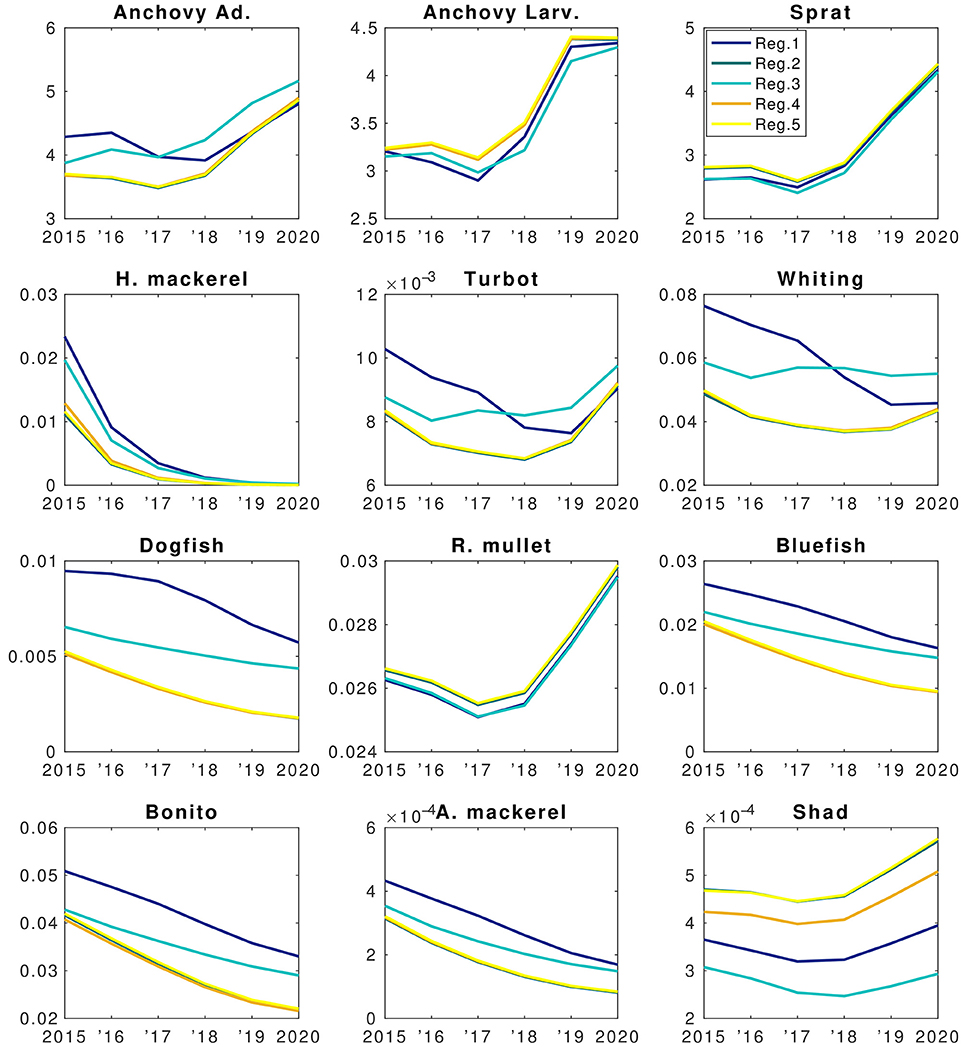
Figure 11. Forecast simulation (2015–2020) results of the EwE fish model of the BAU scenario. X-axis denote years and Y-axis denote changes in biomasses (B.) The units are in tons km−2. Colors denote different regions as explained in the top right panel.
Model results suggest that stocks of species such as horse mackerel, bonito and bluefish will continue decreasing (Figure 11) if current fisheries pressure is continued. This indicates that fishing mortality will have a stronger effect on these species than food web interactions (e.g., increase in anchovy and sprat biomass). Considering the sharp decrease of horse mackerel stocks, food web interactions come into play and predation by whiting and turbot contributes to this decrease. Dogfish also shows a continuous decrease despite lower fishing mortality values, caused indirectly by high by-catch. Increase in anchovy biomass during 2018–2020 (Figure 11) will not be sufficient to start a recovery of dogfish stocks as well as horse mackerel because from a trophic perspective, whiting and turbot outcompete these two species in exploiting the resources. This is due to the long life-cycle (low P/B in the model) of dogfish and its high by-catch (BSC, 2008).
Modeled fish biomass shows distinctive differences across regions although the initial fish biomass and fisheries pressure were assumed to be homogenously distributed. In the future in all regions fish biomass is expected to show a high fractional decrease compared to present levels other than sprat and, to an extent, anchovy (Figure 12A). However, these small factional changes in anchovy and sprat translate into a high biomass change (Figure 12B). Sprat and anchovy in region 3 are the only stocks expected to increase in the future. Small species (i.e., anchovy and sprat) and red mullet stop their decline and start an increase after 2017 whereas larger species (e.g., Atlantic mackerel and horse mackerel, whiting, bluefish, bonito) continue to decrease in all regions until the end of 2020 (Figure 11). Biomass of these species are highest in region 1 followed by region 3 which experience the highest NPP and zooplankton levels (Figures 9A,B). Results show that sprat is the only species that may show an overall increase in the future (Figure 11), if 2014 fish mortality values (cf. section Assessment of Fishing Mortality Rates) are maintained.
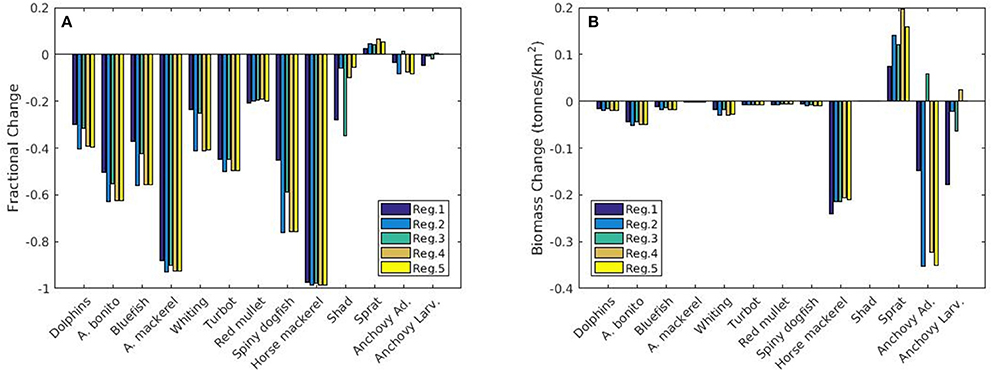
Figure 12. (A) Fractional and (B) absolute change in biomass (tonnes km−2) of different fish species for the five different regions of interest between the present (2010–2014) and future (2015–2020) periods. Negative values mean a decrease in biomass for the years 2015–2020.
Assessment of Fishing Mortality Rates
Fisheries mortality rates for the years 2000 to 2014 (Figure 13) indicate all stocks were exploited above their sustainable levels. Exploitation rates were close to 1 for most stocks; especially high for anchovy, horse mackerel, turbot, whiting, red mullet, shad, bonito, bluefish, and Atlantic mackerel. Model-based FMSY values for anchovy and red mullet are close to the STECF estimations although STECF estimates may include high uncertainties (STECF-15-16, 2015). These uncertainties stem from the single-species stock assessment method, XSA used by STECF which ignore explicit trophic interactions in the food web. However, they still represent the best catch data-based values available. On the other hand, model-based estimates for sprat, dogfish, whiting and turbot catch were lower compared to the STECF values.
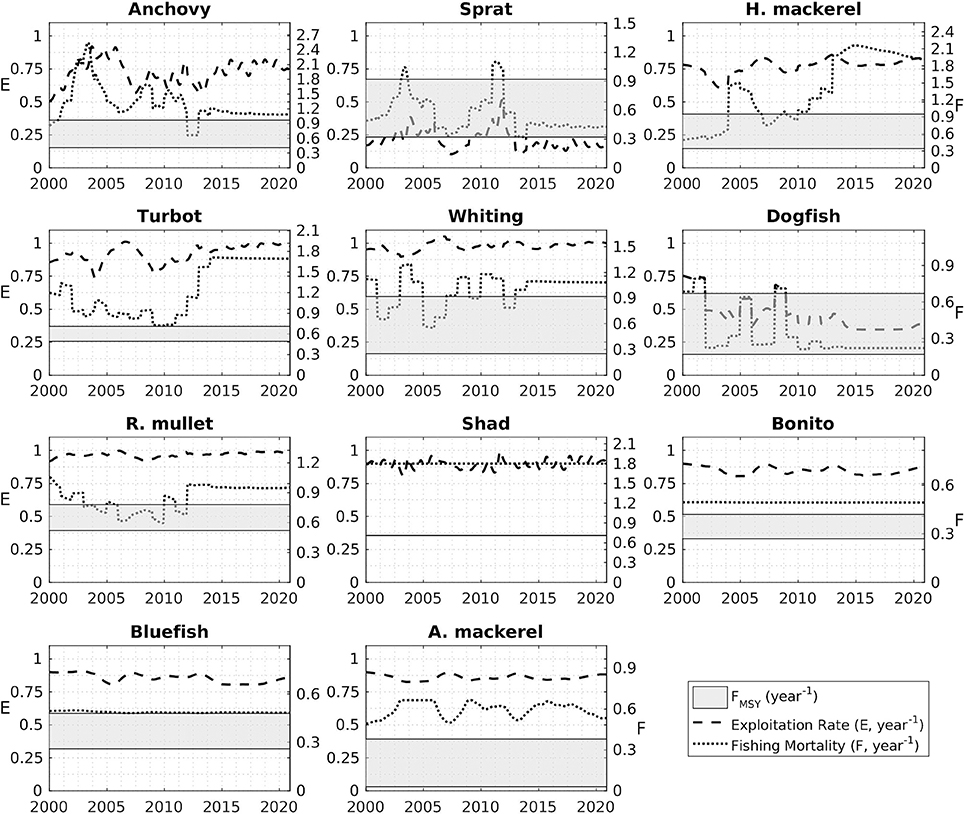
Figure 13. Exploitation rates (E, dashed line) and fishing mortalities (F, dotted line) for the modeled fish groups during the hindcast (2000–2014) and forecast (2015–2020) simulation periods. The gray shaded areas denote the range bounded by the minimum and maximum values of FMSY predicted by the model.
Discussion
The observed decrease in NPP in the biochemical model is in agreement with other modeling studies using future climate change scenarios such as the comparison of four different global models that predict lower net primary production rates for future (2012–2100) climate under IPCC's emission scenario RCP8.5 (Laufkötter et al., 2015, 2016). Several other studies of the global ocean projected global marine net primary production to decrease in response to future climate change (Bopp et al., 2001, 2013; Boyd and Doney, 2002; Steinacher et al., 2010; Marinov et al., 2013; Cabré et al., 2014). The main mechanism that has been suggested to explain such decrease was increased stratification of the water column and hence reduced supply of nutrients to the surface layer (Bopp et al., 2001; Steinacher et al., 2010). The reduced nutrient availability caused decreased phytoplankton growth and therefore reduced net primary production. In addition, increased grazing pressure caused by warmer water temperatures may be of importance of reduced net primary production as well (Laufkötter et al., 2015). A similar reduction in production has been observed and predicted for future climate in the Indian Ocean (Roxy et al., 2016). It is important to note that most of these predictions show spatial variations in net primary production increases and decreases over the area investigated, which also occurred in the current study. Holt et al. (2016) show spatial variations of net primary production for a far future simulation (2100) for different European Seas which amount to a net decrease in production only for the northeast Atlantic, contradicting our finding for the immediate near future.
The Black Sea ecosystem function is regulated by bottom-up controls since the onset of 1970s (Daskalov, 2002; Gucu, 2002; Oguz, 2007; Akoglu et al., 2014). This regulation mechanism was also observed in the hindcast simulation of this study. Small pelagic fish stocks; i.e. anchovy and sprat, are influenced by the changes in the primary productivity (Figures 7, 9A). This direct effect of NPP is also known to occur for small pelagic fish on a global scale (Blanchard et al., 2012). In years when net primary productivity was higher than the long-term average (years 2005–2007 and 2011–2013) increases in the respective small pelagic fish stocks were observed. The modeled sprat stock changes matched the peak observed in 2005 as reported in BSC (2008). A similar peak was also simulated for anchovy stocks, leading to a very high simulated catch for the years 2005 and 2006. Excluding these high production periods, small pelagic fish stocks declined under the impact of status quo fisheries exploitation, which has been classified to be “intense” by many authors (Daskalov, 2002; Oguz, 2007; Llope et al., 2011). Such increases in system NPP act as a mitigating factor for the overexploited small pelagic fish stocks without which they would collapse under conditions of continuous overexploitation. Similarly, simulated predators of small pelagic fish stocks, e.g., whiting and turbot, also benefited from the respective increases in their prey despite heavy fisheries pressure. However, this was not observed for simulated pelagic piscivorous fish, i.e., bluefish, Atlantic mackerel, and bonito, because of the extremely high exploitation rates they were exposed to and their longer life cycles (low P/B in the model).
Considering the steady decrease in stock of horse mackerel, a medium pelagic fish mainly feeding on zooplankton, anchovy and sprat, the observed and modeled dynamics were contrary to the ones observed in the stock increases of sprat and anchovy by 2020. This could partly be explained by the resource limitation for horse mackerel considering the high harvesting pressure of Black Sea fishing fleet on small pelagic fish whenever their respective stocks fluctuate for an increase so that not enough resources were left for horse mackerel. In addition, the other predators of small pelagic fish (i.e., whiting and turbot), which have been observed to fluctuate with the changes in small pelagic fish stocks, also predate on horse mackerel. The model shows a decrease in red mullet biomass, consistent with the high historical bottom trawling pressure red mullet stocks have been subjected to in the Black Sea, especially on the narrow continental shelf of the southern Black Sea (BSC, 2008). Dogfish is not directly targeted by fisheries; however, fishing mortality is caused by by-catch and this pressure was found to be high enough to cause a continued decrease in its stock.
During the forecast simulation, all regions showed an average decrease in NPP, however there was an increase in NPP and zooplankton during 2018–2020 after overall low values in the preceding years (Figure 9). Modeled anchovy results (Figure 11) mirror the impact of these changes in mesozooplankton biomass and their regional differences (Figure 9). For example, in region 3 anchovy showed the highest increase after 2017 in parallel to a high increase in mesozooplankton and in region 1 this increase started with a delay. These results show that the production, and thus climate, can affect anchovy stocks in similar magnitudes as fisheries pressure.
Species such as turbot and whiting, which feed on small species including anchovies and sprat, also suffer the effect of direct food web interactions. However, indirect interactions also have an effect in the form of resource competition with dogfish and horse mackerel. Compared to horse mackerel, which also occasionally feeds on anchovy and sprat, turbot and whiting have an advantage because in addition to sprat, they prey on horse mackerel as well. In the case of dogfish, its long life-cycle poses a significant disadvantage over its competitors. Their biomass continued to decrease after 2015 but an increase occurred in all regions during 2018–2020 due to an increase in their prey as a consequence of increased system-wide net primary production.
Larger species continued to decrease during the whole forecast period because of their extreme over-exploitation. Also, these species are limited by resources that prevent their stocks from recovering. Any stock increase of small pelagic fish is immediately exploited by fisheries and very little is left to be utilized by piscivorous fish within the food web of the Black Sea ecosystem. Such indirect trophic impact of fisheries within the food web was also shown by Ulanowicz and Puccia (1990).
This study, for the first time, presents future stock size, FMSY and MSY estimates for the Black Sea for 11 fish species (Figure 13, Table 2). In agreement with STECF-15-16 (2015), our results suggest that only sprat in the Black Sea is currently being exploited at a sustainable rate. Adjusting fishing effort to meet the FMSY is generally problematic because it is difficult to determine the mortality created by a fleet with varying fishing time every season under the simultaneous fluctuations of stock size. Therefore, as a management strategy it is practical to define a maximum allowed catch limit, i.e., total allowable catches (TAC) or MSY, to control the fishing effort and the mortality that it imposes on the exploited stocks. In this study, we propose MSY values (Table 2) as basis for defining TAC limits for the fish stocks of the Black Sea. Excluding sprat, the estimates provided here are lower compared to the average catch over the hindcast period (2000–2014) underlining that the stocks have already been exploited above their sustainable levels (also as shown in Figure 13). We hypothesize that sprat stocks could be underexploited when biomass estimates from STECF-15-16 (2015) and this study are considered.
There are two potential reasons for mismatch in model versus STECF estimates (Figure 7). First, an important uncertainty in catch estimates is the IUU catches in the Black Sea as discussed (section Assessment of the Current Status). Second, we hypothesize that the disagreement stems from the incorporation of trophodynamics in calculations of the FMSY estimates, which is absent in the single species based STECF estimates. Therefore, here we provide a range of FMSY estimates. The lowest FMSY values suggested here can be considered as a base in managing the Black Sea fish stocks and new estimations should be made as new data are obtained with every concluding fishing season, and finally carrying out a re-analysis with the complemented dataset to produce a strategy for the forthcoming fishing seasons. In addition to this strategy, improving the quality of the statistics collected by the Black Sea's non-EU riparian countries by strictly constraining the landings to designated areas where catch of each vessel is recorded and registered would help to decrease the uncertainty in the management strategies.
Another important consideration is the uncertainty in the results reported in this study. We have addressed the uncertainty in the inputs and parameters of the model as detailed in section Model Validation, as well as the uncertainty at each trophic level (section Assessment of the Current Status). Moreover, the merit of this study is that it provides a range of values by considering the uncertainty in the HTL model results for its management advice. A range of FMSY values are provided by assuming that the historical fluctuations of the fish stocks observed in the hindcast scenario are the predictors of the intrinsic uncertainty in the forecast scenarios of the model and the ecosystem. Thus, we provide a range of suggested exploitation levels together with uncertainty levels of each fish stock estimations which has never done before in any fisheries management advice study in the Black Sea.
Fishing mortality estimates from XSA and multispecies trophic models are fundamentally based on the same information, the reported catch. But while XSA includes trophic relations in only one implicit term, the natural mortality, multispecies trophic models extend much beyond this and our model explicitly incorporates full trophic (predator-prey) interactions in the food web capitalizing on the literature data on diet and stomach contents. Our proposed FMSY estimates (Table 2) are lower, and hence more conservative, than those proposed by STCEF-15-16 (2015), which is due to the differences in the approaches of two studies detailed above, among which the inclusion of trophic interactions in this study. This study also provides FMSY and MSY estimates for the stocks of pelagic piscivorous fish; bonito, bluefish and Atlantic mackerel, for which these estimates have never been scientifically developed. Managers should be provided with evidence-based information showing the need to sustain sufficient prey fish in the ecosystem in order to support the dynamics of charismatic (i.e., predatory) fish species of their particular marine ecosystem considering indirect trophic impacts of fisheries within the food web (Akoglu et al., 2014 for the Black Sea and Ulanowicz and Puccia, 1990 for theoretic background). Otherwise, an ecosystem-wide collapse as previously experienced in the Black Sea (Oguz et al., 2012) is inevitable. Our proposed management criteria will allow the recovery of these fish species of the Black Sea, i.e., bluefish, bonito, and mackerel, in addition to ensuring the sustainable utilization of other fish stocks in the long-term.
Total allowable catches or fishing opportunities, are catch limits that are set for most commercial fish stocks. At present, the Black Sea is missing multi-annual plans for setting basin-wide TACs. There are examples from other regions of how models such as Ecopath with Ecosim are used to evaluate TACs across multiple species by being utilized as management strategy evaluation tools (Grüss et al., 2016 and references therein). There are also other advances in food web models for marine systems for guiding fisheries management (Smith et al., 2011, 2015; Shin et al., 2012). Our work adds on to these efforts by proposing TAC values until 2020 based on an integrated circulation-biogeochemical model that includes the effect of environmental and climate variations.
Even though our model includes species interactions together with the effect of environmental and climate variability, results include uncertainties based on the included model forcing and assumptions in model structure as well as parameterization (see section Model Validation). Ecosystem models are very useful tools for fisheries management, especially in presenting the ecosystem under given conditions and for scenario testing, however, their results should be viewed and used considering the uncertainties.
Conclusions
This study presents the evolution of Black Sea fish stocks under changing trophic, environmental, and climate conditions both for the past 15 years and projects these estimates until 2020. Here we show the effect of primary production and secondary production versus fisheries pressure in regulating the fish stocks. Results show that changes in planktonic production have a direct effect on small pelagic fish even under the high fisheries pressure. For example, anchovy and sprat stocks are directly influenced by the fluctuations in net primary productivity. During years of higher-than-average NPP, these stocks increase even under high fisheries exploitation levels realized during the hindcast period. On the contrary during years of average or lower-than-average NPP, these stocks decline indicating their fragility. Hence, management advice should be developed considering both the productivity of the system and the fisheries exploitation levels, otherwise, unexpected collapse of these stocks might be experienced. The modeling approach used in this study, where a biogeochemical model was integrated with an HTL model, is a novel way of delivering such management advice.
This modeling study shows how a combination of fisheries, climate and food web interactions can act to regulate the fish stocks. Results have strong implications both at a regional and global scale. For long-term sustainability, exploitation levels should be reduced significantly for all species but especially for the piscivorous fish (i.e., bluefish, bonito, and Atlantic mackerel) as well as for anchovy, a species that plays a crucial role in supporting the food web as a forage fish. Short-term fisheries losses may be compensated by higher exploitation of the sprat stock compared to anchovy. In the long-term, we hypothesize that the management strategy proposed in this study will have a significant return toward sustainable utilization of Black Sea fish stocks under changing environmental and climatic conditions. And the most significant pay-off can be the recovery of predatory fish stocks and its fishery which has ever been inefficient since the onset of the 1970s after the overexploitation of these fishes during 1950s and 1960s.
The effect of gelatinous carnivores is implicitly included in the model by defining the jellyfish group in the HTL model according to the simulation outputs of the biochemical models' gelatinous carnivore compartment. A fully (two-way) coupled model would allow an assessment of direct and indirect competition between the gelatinous and fish species. Also models that include feeding and migratory behavior of fish are needed to better assess the regional differences and to provide management options at a regional scale in the Black Sea. At the moment, regional quantification that we provide includes only regional environmental and climate impacts whereas differences in fish stocks due to migratory behavior are neglected. Efforts to develop fully coupled models of biogeochemistry and food web are underway (e.g., Akoglu et al., 2015; Disa, 2016) as well as fish models that include behavior (e.g., Cowen and Sponaugle, 2009; Xu et al., 2013; Guraslan et al., 2017). However, the modeling community is limited by dependable observations. Reliable data on zooplankton levels as well as fish stocks and catch is crucial to reduce the uncertainty of integrated models that can be used to produce management options.
Author Contributions
BS conceived and designed the research. SA, BF, and EA designed and implemented the model. All authors analyzed model results and contributed significantly to the writing of the paper.
Funding
This study was partially supported the EU 7th Framework projects OPEC (contract no. 283291) and PERSEUS (contract no. 287600). The authors acknowledge support by DEKOSIM (BAP-08-11-DPT2012K120880) funded by the Turkish Ministry of Development.
Conflict of Interest Statement
The authors declare that the research was conducted in the absence of any commercial or financial relationships that could be construed as a potential conflict of interest.
Supplementary Material
The Supplementary Material for this article can be found online at: https://www.frontiersin.org/articles/10.3389/fmars.2017.00339/full#supplementary-material
References
Akoglu, E. (2013). Nonlinear Dynamics of the Black Sea Ecosystem and Its Response to Anthropogenic and Climate Variations. Ph.D. Dissertation, Middle East Technical University, Institute of Marine Sciences, Mersin.
Akoglu, E., Salihoglu, B., Libralato, S., Oguz, T., and Solidoro, C. (2014). An indicator-based model assessment of the Black Sea ecosystem structure and functioning during 1960s-1990s. J. Mar. Syst. 134, 113–125. doi: 10.1016/j.jmarsys.2014.02.010
Akoglu, E., Libralato, S., Salihoglu, B., Oguz, T., and Solidoro, C. (2015). EwE-F 1.0: an implementation of Ecopath with Ecosim in Fortran 95/2003 for coupling and integration with other models. Geosci. Model Dev. 8, 2687–2699. doi: 10.5194/gmd-8-2687-2015
Alcamo, J., Van Vuuren, D., and Cramer, W. (2005). “Changes in ecosystem services and their drivers across the scenarios,” in Ecosystems and Human Well-Being: Scenarios, eds S. R. Carpenter, P. L. Pingali, E. M. Bennett, and M. B. Zurek (Washington, DC: Island Press), 297–373.
Allen, I., Arkin, S., Cossarini, G., Butenschoen, M., Ciavatti, S., Christensen, A., et al. (2014). D2.6: Report on Reanalysis Hindcast Skill. Seventh Framework Programme SPA.2011.1.5-03 OPerational Ecology (OPEC) Ecosystem Forecast Products to Enhance Marine GMES Applications. Available online at: http://marine-opec.eu/documents/deliverables/D2.6.pdf
Blanchard, J. L., Jennings, S., Holmes, R., Harle, J., Merino, G., Allen, J. I., et al. (2012). Potential consequences of climate change for primary production and fish production in large marine ecosystems. Philos. Trans. R. Soc. B 367, 2979–2989. doi: 10.1098/rstb.2012.0231
Blumberg, A. F., and Mellor, G. L. (1987). “A description of a three-dimensional coastal ocean model,” in Three Dimensional Coastal Ocean Models, ed N. S. Heaps (Washington, DC: American Geophysical Union), 1–16.
Bopp, L., Monfray, P., Aumont, O., Dufresne, J., Le Treut, H., Madec, G., et al. (2001). Potential impact of climate change on marine export production. Global Biogeochem. Cycles 15, 81–100. doi: 10.1029/1999GB001256
Bopp, L., Resplandy, L., Orr, J. C., Doney, S. C., Dunne, J. P., Gehlen, M., et al. (2013). Multiple stressors of ocean ecosystems in the 21st century: projections with CMIP5 models. Biogeosciences 10, 6225–6245. doi: 10.5194/bg-10-6225-2013
Boyd, P. W., and Doney, S. C. (2002). Modelling regional responses by ma- rine pelagic ecosystems to global climate change. Geophys. Res. Lett. 29, 1–4. doi: 10.1029/2001GL014130
BSC (2008). “State of the environment of the Black Sea (2001 - 2006/7),” in Publications of the Commission on the Protection of the Black Sea Against Pollution (BSC) 2008-3, ed T. Oguz (Istanbul: BSC), 448.
Burenkov, V. I., Kopelevich, O. V., Sherberstov, S. V., and Vedernikov, V. I. (2000). Sea-truth measurements of the ocean color: validation of the SeaWiFS satellite scanner data. Oceanology 40, 329–334.
Cabré, A., Marinov, I., and Leung, S. (2014). Consistent global responses of marine ecosystems to future climate change across the IPCC AR5 earth system models. Clim. Dynam. 45, 1253–1280. doi: 10.1007/s00382-014-2374-3
Cannaby, H., Fach, B. A., Arkin, S. S., and Salihoglu, B. (2015). Climatic controls on biophysical interactions in the Black Sea under present day conditions and a potential future (A1B) climate scenario. J. Mar. Syst. 141, 149–166. doi: 10.1016/j.jmarsys.2014.08.005
Cokacar, T., Kubilay, N., and Oguz, T. (2001). Structure of Emiliana huxleyi blooms in the Black Sea surface waters as detected by SeaWiFS imagery. Geophys. Res. Lett. 28, 4607–4610. doi: 10.1029/2001GL013770
Cowen, R. K., and Sponaugle, S. (2009). Larval dispersal and marine population connectivity. Annu. Rev. Mar. Sci. 1, 443–466. doi: 10.1146/annurev.marine.010908.163757
Daskalov, G. M. (2002). Overfishing drives a trophic cascade in the Black Sea. Mar. Ecol. Prog. Ser. 225, 53–63. doi: 10.3354/meps225053
Daskalov, G. M. (2003). Long-term changes in fish abundance and environmental indices in the Black Sea. Mar. Ecol. Prog. Ser. 255, 259–270. doi: 10.3354/meps255259
Disa, D. (2016). Modeling the Impact of Fish and Fisheries on Marine Biogeochemistry: A Case Study in the Sargasso Sea. Mersin: Middle East Technical University, Institute of Marine Sciences.
Doney, S. C., Ruckelshaus, M., Duffy, J. E., Barry, J. P., Chan, F., English, C. A., et al. (2012). Climate change impacts on marine ecosystems. Annu. Rev. Mar. Sci. 4, 11–37. doi: 10.1146/annurev-marine-041911-111611
Froese, R., and Pauly, D. (2011). FishBase. World Wide Web electronic publication. Available online at: www.fishbase.org
Gordon, H., and Morel, A. (1983). Remote Assessment of Ocean Color for Interpretation of Satellite Visible Imagery: A Review. Lecture Notes on Coastal and Estuarine Studies, Vol. 4. New York, NY: Springer Verlag.
Gregg, W. W., and Casey, N. W. (2004). Global and regional evaluation of the SeaWiFS chlorophyll data set. Rem. Sens. Environ. 93, 463–479. doi: 10.1016/j.rse.2003.12.012
Grüss, A., Harford, W. J., Schirripa, M. J., Velez, L., Sagarese, S. R., Shin, Y. J., et al. (2016). Management strategy evaluation using the individual-based, multispecies modeling approach OSMOSE. Ecol. Model. 340, 86–105. doi: 10.1016/j.ecolmodel.2016.09.011
Gucu, A. C. (2002). Can overfishing be responsible for the successful establishment of Mnemiopsis leidyi in the Black Sea? Estuar. Coast. Shelf Sci. 54, 439–451. doi: 10.1006/ecss.2000.0657
Guraslan, C., Fach, B. A., and Oguz, T. (2014). Modeling the impact of climate variability on Black Sea anchovy recruitment and production. Fish. Oceanogr. 23, 436–457. doi: 10.1111/fog.12080
Guraslan, C., Fach, B. A., and Oguz, T. (2017). Understanding the impact of environmental variability on anchovy overwintering migration in the Black Sea and its implications for a dynamic fishing industry. Front. Mar. Sci. 4:275. doi: 10.3389/fmars.2017.00275
Holt, J., Schrum, C., Cannaby, H., Daewel, U., Allen, I., Artioli, Y., et al. (2016). Potential impacts of climate change on the primary production of regional seas: a comparative analysis of five European seas. Progr. Oceanogr. 140, 91–115. doi: 10.1016/j.pocean.2015.11.004
IPCC (2013). “Summary for policymakers,” in Climate Change 2013: The Physical Science Basis. Contribution of Working Group I to the Fifth Assessment Report of the Intergovernmental Panel on Climate Change, eds T. F. Stocker, D. Qin, G.-K. Plattner, M. Tignor, S. K. Allen, J. Boschung, A. Nauels, Y. Xia, and V. Bex (Cambridge, UK; New York, NY: Cambridge University Press), 29.
Jolliff, J. K., Kindle, J. C., Shulman, I., Penta, B., Friedrichs, M. A., Helber, R., et al. (2009). Summary diagrams for coupled hydrodynamic-ecosystem model skill assessment. J. Mar. Syst. 76, 64–82. doi: 10.1016/j.jmarsys.2008.05.014
Kooijman, S. A. L. M. (1986). “Population dynamics on basis of budgets,” in The Dynamics of Physiologically Structured Populations. Vol. 68 of Lecture Notes in Biomathematics, eds J. Metz and O. Diekmann (Berlin: Springer-Verlag), 266–297.
Kooijman, S. A. L. M. (2000). Dynamic Energy Mass Budgets in Biological Systems. Cambridge: Cambridge University Press.
Korotaev, G., Oguz, T., Nikiforov, A., and Koblinsky, C. (2003). Seasonal, interannual, and mesoscale variability of the Black Sea upper layer circulation derived from altimeter data. J. Geophys. Res. 108:3122. doi: 10.1029/2002JC001508
Korotaev, G. K., Oguz, T., Dorofeyev, V. L., Demyshev, S. G., Kubryakov, A. I., and Ratner, Y. B. (2011). Development of Black Sea nowcasting and forecasting system. Ocean Sci. 7:629. doi: 10.5194/os-7-629-2011
Kubryakov, A. A., Stanichny, S. V., Zatsepin, A. G., and Kremenetskiy, V. V. (2016). Long-term variations of the Black Sea dynamics and their impact on the marine ecosystem. J. Mar. Syst. 163, 80–94. doi: 10.1016/j.jmarsys.2016.06.006
Laufkötter, C., Vogt, M., Gruber, N., Aita-Naguchi, M., Aumont, O., Bopp, L., et al. (2015). Drivers and uncertainties of future global marine primary production in marine ecosystem models. Biogeosciences 12, 6955–6984. doi: 10.5194/bgd-12-3731-2015
Laufkötter, C., Vogt, M., Gruber, N., Aumont, O., Bopp, L., Doney, S. C., et al. (2016). Projected decreases in future marine export production: the role of the carbon flux through the upper ocean ecosystem. Biogeosciences 13, 4023–4047. doi: 10.5194/bg-13-4023-2016
Libralato, S., and Solidoro, C. (2009). Bridging biogeochemical and food web models for an End-to-End representation of marine ecosystem dynamics: the Venice lagoon case study. Ecol. Model. 220, 2960–2971. doi: 10.1016/j.ecolmodel.2009.08.017
Llope, M., Daskalov, G. M., Rouyer, T. A., Mihneva, V., Chan, K. S., Grishin, A. N., et al. (2011). Overfishing of top predators eroded the resilience of the Black Sea system regardless of the climate and anthropogenic conditions. Glob. Change Biol. 17, 1251–1265. doi: 10.1111/j.1365-2486.2010.02331.x
Locarnini, R. A., Mishonov, A. V., Antonov, J. I., Boyer, T. P., Garcia, H. E., Baranova, O. K., et al. (2013). “World Ocean Atlas 2013, Volume 1: temperature,” in NOAA Atlas NESDIS 73, eds S. Levitus and A. Mishonov (Sliver Spring, MD: National Oceanographic Data Center), 40.
Ludwig, W., Dumont, E., Meybeck, M., and Heussner, S. (2009). River discharges of water and nutrients to the Mediterranean and Black Sea: major drivers for ecosystem changes during past and future decades? Progr. Oceanogr. 80, 199–217. doi: 10.1016/j.pocean.2009.02.001
Marinov, I., Doney, S. C., Lima, I. D., Lindsay, K., Moore, J. K., and Mahowald, N. (2013). North-South asymmetry in the modeled phytoplankton community response to climate change over the 21st century. Global Biogeochem. Cycles 27, 1274–1290. doi: 10.1002/2013GB004599
McQuatters-Gollop, A., Mee, L. D., Raitsos, D. E., and Shapiro, G. I. (2008). Non-linearities, regime shifts and recovery: the recent influence of climate on Black Sea chlorophyll. J. Mar. Syst. 74, 649–658. doi: 10.1016/j.jmarsys.2008.06.002
Miladinova, S., Stips, A., Garcia-Gorriz, E., and Macias Moy, D. (2016). Changes in the Black Sea Physical Properties and Their Effect on the Ecosystem. EUR 28060 EN.
Myers, R. A., and Mertz, G. (1998). Reducing uncertainty in the biological basis of fisheries management by meta-analysis of data from many populations: a synthesis. Fish. Res. 37, 51–60. doi: 10.1016/S0165-7836(98)00126-X
Nezlin, N. P. (2006). “Seasonal and interannual variability of remotely sensed chlorophyll,” in The Black Sea Environment, eds A. G. Kostianoy and A. N. Kosarev (Berlin; Heidelberg: Springer), 333–349.
Oguz, T. (2007). Nonlinear response of Black Sea pelagic fish stocks to over-exploitation. Mar. Ecol. Prog. Ser. 345, 211–228. doi: 10.3354/meps06994
Oguz, T., and Ediger, D. (2006). Comparison of in situ and satellite-derived chlorophyll pigment concentrations, and impact of phytoplankton bloom on the suboxic layer structure in the western Black Sea during May–June 2001. Deep Sea Res. II Top. Stud. Oceanogr. 53, 1923–1933. doi: 10.1016/j.dsr2.2006.07.001
Oguz, T., and Velikova, V. (2010). Abrupt transition of the northwestern Black Sea shelf ecosystem from a euphotic to an alternative pristine state. Mar. Ecol. Prog. Ser. 405, 231–242. doi: 10.3354/meps08538
Oguz, T., Dippner, J. W., and Kaymaz, Z. (2006). Climatic regulation of the Black Sea hydro-meteorological and ecological properties at interannual-to-decadal time scales. J. Mar. Syst. 60, 235–254. doi: 10.1016/j.jmarsys.2005.11.011
Oguz, T., Ducklow, H. W., Purcell, J. E., and Malanotte-Rizzoli, P. (2001). Modeling the response of top-down control exerted by gelatinous carnivores on the Black Sea pelagic food web. J. Geophys. Res. Oceans 106, 4543–4564. doi: 10.1029/1999JC000078
Oguz, T., Latun, V. S., Latif, M. A., Vladimirov, V. V., Sur, H. I., Markov, A. A., et al. (1993). Circulation in the surface and intermediate layers of the Black Sea. Deep Sea Res. I Oceanogr. Res. Pap. 40, 1597–1612. doi: 10.1016/0967-0637(93)90018-X
Oguz, T., Salihoglu, B., Moncheva, S., and Abaza, V. (2012). Regional peculiarities of community-wide trophic cascades in strongly degraded Black Sea food web. J. Plank. Res. 34, 338–343. doi: 10.1093/plankt/fbs002
Paris, C. B., Cherubin, L. M., and Cowen, R. K. (2007). Surfing, spinning, or diving from reef to reef: effects on population connectivity. Mar. Ecol. Prog. Ser. 347, 285–300. doi: 10.3354/meps06985
Plaganyi, E. E., Punt, A. E., Hillary, R., Morello, E. B., Thebaud, O., Hutton, T., et al. (2014). Multispecies fisheries management and conservation: tactical applications using models of intermediate complexity. Fish Fish. 15, 1–22. doi: 10.1111/j.1467-2979.2012.00488.x
Punt, A. E., MacCall, A. D., Essington, T. E., Francis, T. B., Hurtado-Ferro, F., Johnson, K. F., et al. (2016). Exploring the implications of the harvest control rule for Pacific sardine, accounting for predator dynamics: a MICE model. Ecol. Modell. 337, 79–95. doi: 10.1016/j.ecolmodel.2016.06.004
Rockel, B., Will, A., and Hense, A. (2008). The regional climate model COSMO-CLM (CCLM). Meteorol. Z. 17, 347–348. doi: 10.1127/0941-2948/2008/0309
Roxy, M. K., Modi, A., Murtugudde, R., Valsala, V., Panickal, S., Kumar, S. P., et al. (2016). A reduction in marine primary productivity driven by rapid warming over the tropical Indian Ocean. Geophys. Res. Lett. 43, 826–833. doi: 10.1002/2015GL066979
Sancak, S., Besiktepe, S. T., Yilmaz, A., Lee, M., and Frouin, R. (2005). Evaluation of SeaWiFS chlorophyll-a in the Black and Mediterranean Seas. Int. J. Remote Sens. 26,10, 2045–2060. doi: 10.1080/01431160512331337853
Saux Picart, S., Butenschön, M., and Shutler, J. D. (2012). Wavelet-based spatial comparison technique for analysing and evaluating two-dimensional geophysical model fields. Geosci. Model Dev. 5, 223–230. doi: 10.5194/gmd-5-223-2012
Shepherd, J. G. (1999). Extended survivors analysis: an improved method for the analysis of catch-at-age data and abundance indices. ICES J. Mar. Sci. 56, 584–591. doi: 10.1006/jmsc.1999.0498
Shin, Y. J., Bundy, A., Shannon, L. J., Blanchard, J. L., Chuenpagdee, R., Coll, M., et al. (2012). Global in scope and regionally rich: an IndiSeas workshop helps shape the future of marine ecosystem indicators. Rev. Fish Biol. Fish. 22, 835–845. doi: 10.1007/s11160-012-9252-z
Smith, A. D., Brown, C. J., Bulman, C. M., Fulton, E. A., Johnson, P., Kaplan, I. C., et al. (2011). Impacts of fishing low–trophic level species on marine ecosystems. Science 333, 1147–1150. doi: 10.1126/science.1209395
Smith, M. D., Fulton, E. A., Day, R. W., Shannon, L. J., and Shin, Y. J. (2015). Ecosystem modelling in the southern Benguela: comparisons of Atlantis, Ecopath with Ecosim, and OSMOSE under fishing scenarios. Afr. J. Mar. Sci. 37, 65–78. doi: 10.2989/1814232X.2015.1013501
STECF-15-16 (2015). Scientific, Technical and Economic Committee for Fisheries (STECF) – Black Sea Assessments. Luxembourg: Publications Office of the European Union, 284. EUR 27517 EN, JRC 98095.
Steinacher, M., Joos, F., Frölicher, T. L., Bopp, L., Cadule, P., Cocco, V., et al. (2010). Projected 21st century derease in marine productivity: a multi-model analysis. Biogeosciences 7, 979–1005. doi: 10.5194/bg-7-979-2010
Stow, C. A., Jolliff, J., McGillicuddy, D. J., Doney, S. C., Allen, J. I., Friedrichs, M. A., et al. (2009). Skill assessment for coupled biological/physical models of marine systems. J. Mar. Syst. 76, 4–15. doi: 10.1016/j.jmarsys.2008.03.011
Taylor, K. E. (2001). Summarizing multiple aspects of model performance in a single diagram. J. Geophys. Res. Atmos. 106, 7183–7192. doi: 10.1029/2000JD900719
Ulman, A., Bekisoglu, S., Zengin, M. A., Knudsen, S., Unal, V., Methews, C., et al. (2013). From bonito to anchovy: a reconstruction of Turkey's marine fisheries catches (1950-2010). Mediterranean Mar. Sci. 14, 309–342. doi: 10.12681/mms.414
Werner, F. E., Quinlan, J. A., Lough, R. G., and Lynch, D. R. (2001). Spatially-explicit individual based modeling of marine populations: a review of the advances of the 1990s. Sarsia 86, 411–421. doi: 10.1080/00364827.2001.10420483
Xu, Y., Chai, F., Rose, K. A., Ñiquen, C. M., and Chavez, F. P. (2013). Environmental influences on the interannual variation and spatial distribution of Peruvian anchovy (Engraulis ringens) population dynamics from 1991 to 2007: a three-dimensional modeling study. Ecol. Modell. 264, 64–82. doi: 10.1016/j.ecolmodel.2013.01.009
Zatsepin, A. G., Ginzburg, A. I., Kostianoy, A. G., Kremenetskiy, V. V., Krivosheya, V. G., Poulain, P.-M., et al. (2003). Observation of Black Sea mesoscale eddies and associated horizontal mixing. J. Geophys. Res. 108, 1–27. doi: 10.1029/2002JC001390
Zibordi, G., Melin, F., Berthon, J.-F., and Canuti, E. (2013). Assessment of MERIS ocean color data products for European seas. Ocean Sci. 9, 521–533. doi: 10.5194/os-9-521-2013
Keywords: integrated ecosystem model, Black Sea, fisheries impact, climate impact, maximum sustainable yield, ecosystem-based fisheries management
Citation: Salihoglu B, Arkin SS, Akoglu E and Fach BA (2017) Evolution of Future Black Sea Fish Stocks under Changing Environmental and Climatic Conditions. Front. Mar. Sci. 4:339. doi: 10.3389/fmars.2017.00339
Received: 17 March 2017; Accepted: 12 October 2017;
Published: 21 November 2017.
Edited by:
Francesco Colloca, National Research Council—Institute for Coastal Marine Environment (CNR-IAMC), ItalyReviewed by:
Nazli Demirel, Istanbul University, TurkeyElisabetta Betulla Morello, CNR—National Research Council of Italy, ISMAR—Marine Sciences Institute, Italy
Copyright © 2017 Salihoglu, Arkin, Akoglu and Fach. This is an open-access article distributed under the terms of the Creative Commons Attribution License (CC BY). The use, distribution or reproduction in other forums is permitted, provided the original author(s) or licensor are credited and that the original publication in this journal is cited, in accordance with accepted academic practice. No use, distribution or reproduction is permitted which does not comply with these terms.
*Correspondence: Baris Salihoglu, YmFyaXNAaW1zLm1ldHUuZWR1LnRy