 Muhammad Shafeeque
 Shubha Sathyendranath
 Grinson George
 Alungal N. Balchand
 Trevor Platt
- 1Fishery Resources Assessment Division, Central Marine Fisheries Research Institute, Kochi, India
- 2School of Marine Sciences, Cochin University of Science and Technology, Kochi, India
- 3National Centre for Earth Observation, Plymouth Marine Laboratory, Plymouth, United Kingdom
- 4Plymouth Marine Laboratory, Plymouth, United Kingdom
In climate research, an important task is to characterize the relationships between Essential Climate Variables (ECVs). Here, satellite-derived data sets have been used to examine the seasonal cycle of phytoplankton (chlorophyll concentration) in the waters off Somalia, and its relationship to aerosols, winds and Sea Surface Temperature (SST). Chlorophyll-a (Chl-a) concentration, Aerosol Optical Thickness (AOT), Ångström Exponent (AE), Dust Optical Thickness (DOT), SST and sea-surface wind data for a 16-year period were assembled from various sources. The data were used to explore whether there is evidence to show that dust aerosols enhance Chl-a concentration in the study area. The Cross Correlation Function (CCF) showed highest positive correlation (r2 = 0.3) in the western Arabian Sea when AOT led Chl-a by 1–2 time steps (here, 1 time step is 8 days). A 2 × 2° box off Somalia was selected for further investigations. The correlations of alongshore wind speed, Ekman Mass Transport (EMT) and SST with Chl-a were higher than that of AOT, for a lag of 8 days. When all four variables were considered together in a multiple linear regression, the increase in r2 associated with the AOT is only about 0.02, a consequence of covariance among AOT, SST, EMT and alongshore wind speed. The AOT data show presence of dust aerosols most frequently during the summer monsoon season (June–September). When the analyses were repeated for the dust aerosol events, the correlations were generally lower, but still significant. Again, the inclusion of DOT in the multiple linear regression increased the correlation coefficient by only 2%, indicating minor enhancement in Chl-a concentration. Interestingly, during summer monsoon season, there is a higher probability of finding more instances of positive changes in Chl-a after one time step, regardless of whether there is dust aerosol or not. On the other hand, during the winter monsoon season (November–December) and rest of the year, the probability of Chl-a enhancement is higher when dust aerosol is present than when it is absent. The phase relationship in the 8-day climatologies of Chl-a and AOT (derived from NASA's SeaWiFS and MODIS-A ocean colour processing chain) showed that AOT led Chl-a for most of the summer monsoon season, except when Chl-a was very high, during which time, Chl-a led AOT. The phase shift in the Chl-a and AOT climatological relationship at the Chl-a peak was not observed when AOT from Aerosol Climate Change Initiative (Aerosol-CCI) was used.
1. Introduction
Phytoplankton, Sea-Surface Temperature (SST), sea-surface winds and aerosols are all Essential Climate Variables (ECVs) identified by the Global Climate Observation System (GCOS, 2011) as being worthy of sustained global observations at high spatial resolution and over long time scales, to aid studies of Earth's climate and climate change. As we strive to understand how the Earth system might respond holistically to climate change, it is important to explore not only the behavior of individual ECVs, but also their inter-relationships and the feedbacks between them. In the western Arabian Sea, the relationships between phytoplankton, winds and SST are better understood than that between phytoplankton and aerosols.
Yet, there are known functional links between marine aerosols and phytoplankton. For example, dust aerosols, transported by winds over the ocean, can be an important source of micronutrients such as iron, essential for phytoplankton growth (Duce and Tindale, 1991; Martin et al., 1991, 1994; Prospero et al., 2002; Cropp et al., 2005; Jickells et al., 2005; Mahowald et al., 2005; Meskhidze et al., 2005; Gallisai et al., 2014), with the proviso that not all the iron contained in dust particles is usable by phytoplankton. Winds over the ocean are also responsible for the formation of aerosols through generation of sea salt sprays (O'Dowd et al., 1997; Smirnov et al., 2003; Satheesh et al., 2006; Mulcahy et al., 2008; Glantz et al., 2009; Huang et al., 2010; Meskhidze and Nenes, 2010) and the same winds also mix the surface layer of the ocean, dictating the entrainment of nutrients from the deeper waters into the surface layer and controlling the average light available for phytoplankton growth in the layer. In addition to sea salt sprays, biological particles (for example, fragments of phytoplankton) contained in sea spray can also aid aerosol formation (Leck and Bigg, 2005; Facchini et al., 2008; Hawkins and Russell, 2010; Quinn and Bates, 2011). Feedback mechanisms (both positive and negative) have been proposed between dimethyl sulphide in the atmosphere of phytoplanktonic origin and the Earth's radiation budget, via aerosols (Charlson et al., 1987; Lovelock, 2006).
Positive (Martin et al., 1994; Jickells et al., 2005; Patra et al., 2007; Banerjee and Prasanna Kumar, 2014) and negative (Mallet et al., 2009; Paytan et al., 2009; Jordi et al., 2012) correlations between marine aerosols and phytoplankton concentration have been reported for different parts of the world ocean. Some studies have also identified regions where no relationship exists between the two (Cropp et al., 2005; Gallisai et al., 2014). Possible explanations for the positive correlations include the fertilizing role of iron contained in dust aerosols, or phytoplankton themselves, acting as a source of marine aerosols. Negative correlations might arise from high winds causing production of wind-spray aerosols, while at the same time forming deep mixed layers that may be able to support only low concentrations of phytoplankton, because of low average light levels available in the layer.
Satellite-based measurements provide a valuable tool for studies of aerosols and phytoplankton. Aerosol Optical Thickness (AOT), amenable to remote sensing, is an often-used measure of aerosol concentration. The Ångström Exponent (AE), which defines the wavelength dependence of AOT, is indicative of the type of aerosols present, and is also available through remote sensing. Dust Optical Thickness (DOT) can be inferred from AOT and the AE. Satellite data have been used to track dust aerosols for thousands of kilometers away from their source (Myhre et al., 2005). Likewise, ocean colour measured from space provides information on the concentration of chlorophyll-a (Chl-a), which is a major photosynthetic pigment contained in phytoplankton. Furthermore, estimates of winds (speed and direction) and SST, essential for understanding phytoplankton dynamics, are also available through remote sensing. An advantage of remote sensing is that it provides data at large scales and over many years, allowing studies of time-series at multiple locations in a systematic manner. But some caution should be exercised when using ocean colour derived Chl-a concentration, AOT and AE. Sometimes they are all produced from the same processing chain, and one might argue that, in the extreme case, any relationships observed between the three are purely artifacts of the processing algorithm. Furthermore, the effects of clouds on satellite retrievals are significant and sometimes lead to biases by overestimation or underestimation of aerosol data, particularly for dust aerosols (Levy et al., 2007; Torres et al., 2007; Baddock et al., 2009; Kahn et al., 2010). However, some authors have used cloud-screening techniques to reduce such errors (Kaufman et al., 2005). Therefore, the processing chain issues should be verified to arrive at conclusive results.
In this paper, we examine the relationships of Chl-a with winds, SST, AOT and dust aerosols in the western Arabian Sea, at a selected site off Somalia. The region is characterized by a high dynamic range in Chl-a values that vary seasonally, in response to the reversing wind patterns and associated upwelling (Prasanna Kumar et al., 2001; Schott and McCreary, 2001; Schott et al., 2002; Shankar et al., 2002; Wiggert et al., 2005; Lévy et al., 2007; Wiggert and Murtugudde, 2007; Prakash et al., 2012). Diverse physical forcings of both oceanic and atmospheric origins drive biological production off Somalia region. During summer monsoon season, the Somalia coastal region is characterized by strong upwelling with high primary productivity due to the swift Somali current caused by strong south-westerlies along the coast (Smith and Codispoti, 1980; Schott, 1983; Hitchcock and Olson, 1992; Brock et al., 1994; Schott et al., 2002; deCastro et al., 2016). The anti-cyclonic eddies associated with the Somali current during the same season further enhance production by transporting and mixing upwelled water (Fischer et al., 1996; McCreary et al., 1996; Schott et al., 1997; Koning et al., 2001; Schott et al., 2002; Santos et al., 2015). The consequent nutrient enrichment in the mixed layer of the ocean leads to high phytoplankton production during summer monsoon season (Banse, 1987; Owens et al., 1993). Because of its proximity to the Arabian Peninsula, the region also receives seasonally-varying dust deposition (Pease et al., 1998; Li and Ramanathan, 2002; Prospero et al., 2002; Léon and Legrand, 2003; Zhu et al., 2007; Prasanna Kumar et al., 2010). Thus, the same winds that transport dust aerosols to the western Arabian Sea during the summer monsoon season also induce upwelling, favoring phytoplankton blooms. Hence the relationship between Chl-a and aerosols in this region would be incomplete, unless we examined the effect of winds on phytoplankton dynamics as well. Here, we use 16 years of satellite data (1998–2013) to make a systematic study of the relationship of Chl-a with AOT, winds and SST in the waters off Somalia.
2. Materials and Methods
2.1. Data
Level-3 8-day composite Aerosol Optical Thickness (AOT) at 865 nm and Ångström Exponent (AE) from Sea-viewing Wide Field-of-view Sensor (SeaWiFS) during January 1998–December 2010 and Moderate Resolution Imaging Spectro-radiometer (MODIS) Aqua during January 2011–December 2013 downloaded from National Aeronautics and Space Administration's (NASA's) ocean colour website (https://oceancolor.gsfc.nasa.gov) were used in this work. The AOT and AE data from NASA are referred to here as NASA-AOT and NASA-AE respectively. The daily AOT at 550 nm and AE data from European Space Agency's (ESA's) Aerosol Climate Change Initiative (Aerosol-CCI) programme (de Leeuw et al., 2015; Popp et al., 2016, see also http://www.esa-aerosol-cci.org) were also used in this study, as an independent source of aerosol data, unconnected with ocean colour atmospheric correction routines. The AOT and AE data from the Aerosol-CCI website are referred to here as CCI-AOT and CCI-AE respectively. The data are available at 1° spatial resolution for the period from January 1998–December 2010.
The relationship between the AOT (τ) at any given wavelength λ0 and that at any other wavelength λ depends on the AE (α) through the equation:
In principle, if the optical thickness at one wavelength and the AE are known, the optical thickness can be computed at any other wavelength using Equation (1).
Chlorophyll-a (Chl-a) concentration, for the period January 1998–December 2013, was obtained from ESA's Ocean Colour-Climate Change Initiative (OC-CCI) website (Sathyendranath et al., 2016, see also https://www.oceancolour.org). One of the major reasons for the choice of the Chl-a data was the improved coverage provided by the OC-CCI data in the Arabian Sea, especially during the summer monsoon season. The 8-day composite AOT data from SeaWiFS are available at only 9 km resolution, so we used MODIS Aqua data at the same resolution (9 km) even though they are available at 4 km resolution. The Chl-a concentration from OC-CCI (version-2), which is available at 4 km resolution, was also re-gridded to 9 km resolution. Since the CCI-AOT data are available at 1° spatial resolution, the Chl-a concentration from OC-CCI was also re-gridded to 1° resolution to analyse the correlation between them. The daily value of AOT at 865 nm was calculated from daily CCI-AOT at 550 nm and CCI-AE using Equation (1). The data were merged to genereate 8-day composites and extracted for the region off Somalia. The daily 1° gridded Sea Surface Temperature (SST) data were obtained for the period January 1998–December 2013 from Woods Hole Oceanographic Institute's (WHOI's) objectively-analyzed air-sea heat fluxes available at Asia-Pacific Data-Research Centre (APDRC) website (http://apdrc.soest.hawaii.edu). The SST anomaly has been calculated using these data after merging into 8-day composites. In addition, the daily NCEP/NCAR reanalysis U-wind (zonal velocity) and V-wind (meridional velocity) data with 2.5 × 2.5° spatial resolution at 10 m above the sea surface were obtained for the same period from their official website (https://www.esrl.noaa.gov/psd). The data have been merged to generate 8-day composites and used to derive the south westerly wind component along the Somalia coast. All the above mentioned information is summarized in Table 1.

Table 1. Summary of data sets analyzed in the study.
2.2. Methods
The methods used in this study are shown schematically in Figure 1, and described below.
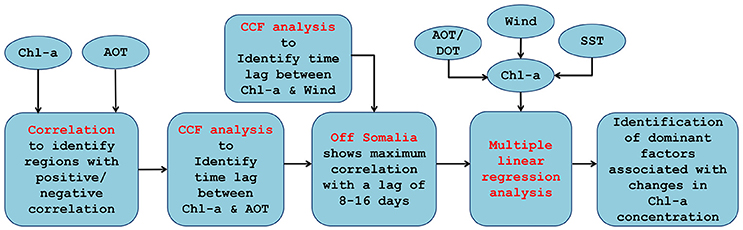
Figure 1. Schematic diagramme showing the methods and analyses used in this work.
2.2.1. Correlation between Chl-a and AOT in the Arabian Sea
Correlation between Chl-a and AOT concentration for the 1998–2013 period over the Arabian Sea was studied using the 8-day composites. The results showed areas of both positive and negative correlation. The western Arabian Sea showed strong positive correlation. A 2 × 2° box (54–56° E longitude and 10–12° N latitude) off Somalia coast, with high positive correlation, was chosen for further analyses.
2.2.2. CCF Analysis and Lagged Correlation
We studied the lags in the correlation between Chl-a and AOT using Cross Correlation Function (CCF). CCF analysis produces cross correlations in which the observations of one time series are correlated with the observations of another time series at different lags and leads, to identify the variables which are leading or lagging indicators of other variables. The basic premise is that, if the relationships between the variables were merely a processing artifact, the correlations would peak at zero lag. In instances where phytoplankton might be contributing biological material for aerosol formation, the correlation would be maximum when AOT lagged behind Chl-a concentration. On the other hand, if the oceans were fertilized by aerosols, then Chl-a would lag behind AOT.
The CCF analysis was also carried out between Chl-a concentration and alongshore component of wind speed. If wind-induced upwelling were a causative factor for the increment in Chl-a concentration in the Somalia coast, then we anticipate that the correlation between them would peak when Chl-a lagged behind wind (because of the finite time it takes for phytoplankton to bloom in response to the nutrients brought to the surface by upwelling). Though the alongshore wind speed over the Somalia coast is a fairly good indicator of upwelling strength, we have calculated the Ekman Mass Transport (EMT) as an upwelling index for the analysis. Since a surface signature of upwelling is a decrease of SST in the upwelling zone, we have also taken SST as another proxy for upwelling.
2.2.3. Ekman Mass Transport
For the Somalia region, the alongshore component of the wind stress is favorable for upwelling during summer monsoon season. A positive value for the EMT represents upwelling along the coast of Somalia. The alongshore wind stress for Somalia coast was calculated by the bulk aerodynamic formula from Koracin et al. (2004) as shown in Equation (2):
where τy is the alongshore wind stress; ρa is the density of air, which was taken to be 1.2 kg/m3; w is the magnitude of the wind speed; v is the alongshore component of wind speed in m/s; and Cd is the nonlinear drag coefficient based on Large and Pond (1981) and Trenberth et al. (1990) for low wind speeds. So, the EMT along the Somalia coast can be calculated using Equation (3):
where, Mev is mass transport by the alongshore wind, f is the Coriolis parameter (2 × Ω × sinϕ), Ω is the angular frequency of the Earth and ϕ is the latitude.
Multiple linear regression analysis with Chl-a as dependent variable and NASA-AOT (or DOT), alongshore wind speed, EMT and SST as independent variables was carried out. We used 8-day composites with lags of 1–2 time steps for this analysis (these lags correspond to the maximum correlation between Chl-a and NASA-AOT data). The analysis was repeated by replacing NASA-AOT with CCI-AOT (or DOT) with a lag of 3 time steps, corresponding to the maximum correlation between Chl-a and CCI-AOT. We have also calculated the 8-day climatologies of all these variables, and plotted against time of year, to study their phase relationships.
2.2.4. Derivation of Dust Optical Thickness (DOT)
The desert dust transported by winds over the ocean contains micronutrients such as iron, which can regulate phytoplankton activity (Martin et al., 1994; Lenes et al., 2001; Muhs et al., 2007; Donaghay et al., 2015). Since the seasonal monsoon winds bring large quantities of iron-containing dust aerosols to the study area (Li and Ramanathan, 2002; Banerjee and Prasanna Kumar, 2014), we investigated the effect of dust aerosols on Chl-a concentrations. The AE, which is often used as a qualitative indicator of aerosol particle size, and AOT, which indicates the aerosol load, can be used to differentiate dust aerosol from other types of aerosol. Generally, a higher value of AE (α>1) is indicative of fine, submicron aerosols, whereas lower values (α < 1) are representative of coarse, super-micron particles (Kaufman, 1993; Gobbi et al., 2007; Yoon et al., 2012). The AOT values are lower for fine aerosols and higher for coarse aerosols. In the literature, different criteria have been proposed to identify dust aerosols at different locations: for example, α < 0.6 (Dubovik et al., 2002; Brindley et al., 2015), α < 0.8 (Eck et al., 2005; Che et al., 2013), α < 1 (Eck et al., 1999; Schuster et al., 2006; Papaynannis et al., 2007; Yoon et al., 2012; Valenzuela et al., 2014; Zu et al., 2014; Pakszys et al., 2015) and α < 1.4 (Gobbi et al., 2007; Pereira et al., 2011; Shinozuka et al., 2011); similarly, AOT > 0.11 (Toledano et al., 2007; Balarabe et al., 2016), AOT > 0.2 (Salinas et al., 2009; Pakszys et al., 2015) and AOT > 0.25 (Guleria et al., 2012) have been recommended to identify dust aerosols. After considering all these studies, we have adopted the ranges of AOT and AE for off Somalia as follows: AE less than 1, and AOT at 440 nm (τ440) greater than 0.2 (i.e., α < 1 and τ440 > 0.2) are designated as DOT or dust aerosols. The NASA-AOT at 865 nm (τ865) and NASA-AE were used to calculate NASA-AOT at 440 nm (τ440), using Equation (1). Similarly, CCI-AOT at 550 nm (τ550) and CCI-AE were used to calculate CCI-AOT at 440 nm (τ440), using Equation (1).
3. Results
3.1. Relationship between Chl-a and AOT in the Arabian Sea
The correlation between Chl-a and NASA-AOT using 8-day time series from 1998 to 2013 data for the Arabian Sea is mapped in Figure 2. The results are based on data for all the seasons rather than for specific seasons as in Patra et al. (2007) or in Banerjee and Prasanna Kumar (2014). The western Arabian Sea exhibits high positive correlations, whereas the south eastern Arabian Sea shows low to moderate positive correlations. There are also regions (south central) where no statistically-significant correlation is evident and extensive regions (north-central and north-eastern) of significant negative correlations. The region off Somalia shows high positive correlation between Chl-a and NASA-AOT and it is located along the path of winds carrying dust aerosols emanating from South Asia, South-West Asia, North Africa (Sahara) and the eastern Horn of Africa (Pease et al., 1998; Ginoux et al., 2001; Goudie and Middleton, 2001; Prospero et al., 2002; Léon and Legrand, 2003). Although there are several studies (Banzon et al., 2004; Kayetha et al., 2007; Patra et al., 2007; Singh et al., 2008; Nezlin et al., 2010; Banerjee and Prasanna Kumar, 2014) that have examined the relationship between Chl-a and AOT in various parts of the Arabian Sea, the region off Somalia has not yet been explored in detail, and it is the region selected for our investigation.
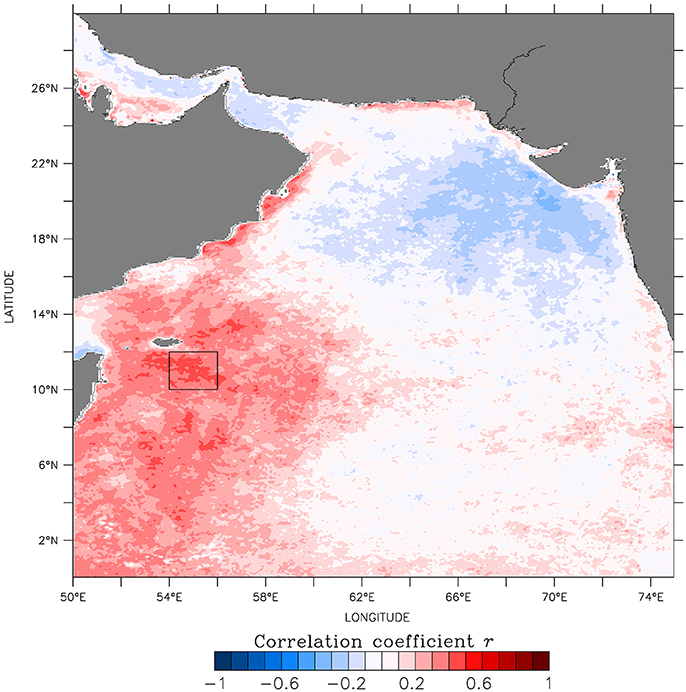
Figure 2. Correlation map between 8-day composited Chl-a and NASA-AOT during 1998–2013 for the Arabian Sea. Pale to dark red shading and pale to dark blue shading represent positive and negative correlation respectively. The black square box off Somalia shows the study area selected for further analyses.
3.2. Climatologies of Chl-a, Aerosols, Winds and SST off Somailia
The 16-year 8-day climatological seasonal cycles of Chl-a concentration, NASA-AOT, CCI-AOT, SST and along-shore wind speed are shown in Figure 3A, for the selected study area off Somalia. SST data are reported as anomalies from 8-day average. When the aerosols are identified as dust aerosols, they are indicated in the plot using black and purple filled circles. Out of 46 observations involved in both AOT data sets, for the 8-day climatology, 24 observations were dust aerosols for CCI-AOT data whereas 14 were identified as dust aerosols for NASA-AOT data. It was found that the CCI-AOT data showed the presence of dust aerosols not only during the summer monsoon season, but also during the winter monsoon season. The corresponding climatological wind vectors are shown in Figure 3B. During the first 100 days of the year, winds are north easterly, the wind speed decreasing with time. These conditions are unfavorable for upwelling off Somalia. During this period, SST increases steadily by some 3°C. At the same time, the Chl-a concentrations decrease, and AOT also remains low. After this, the winds reverse direction and intensify, resulting in upwelling (indicated by decreasing SST) that favors phytoplankton growth. We note that the initial response of phytoplankton to the intense south westerly winds is a decrease in concentration, perhaps a consequence of the phytoplankton being mixed into deeper layers. After this, the Chl-a increases, with a lag of a couple of time steps behind the increasing wind speed. Both AOT and Chl-a reach their respective maxima during the summer monsoon season.
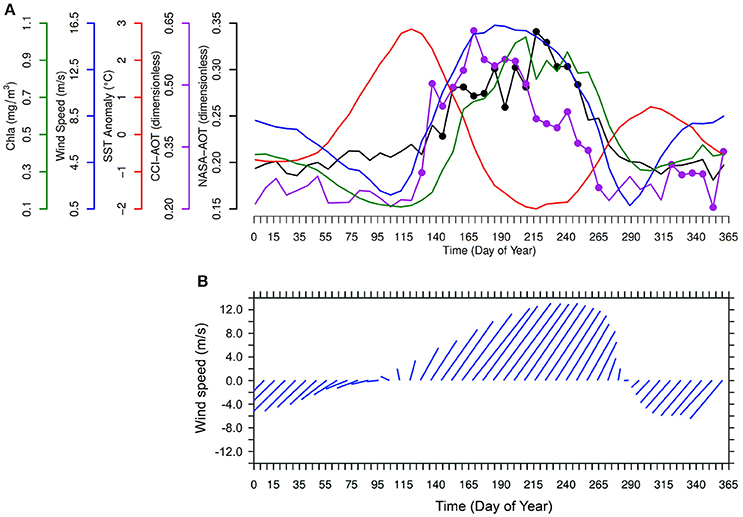
Figure 3. Time series of 8-day climatology, (A) for Chl-a, NASA-AOT, CCI-AOT, SST anomaly and Wind speed and (B) for the wind vectors. The black and purple coloured dots in the NASA-AOT and CCI-AOT graph denote the presence of dust aerosols.
In Figure 3A, the NASA-AOT and Chl-a reach their respective maxima during the summer monsoon season. Although the seasonality of CCI-AOT is more or less similar to that of NASA-AOT, the occurrence of peak values is different. The maximum value for CCI-AOT occurred during early summer monsoon season (Day of Year, DoY 170) while the Chl-a is still increasing, whereas the NASA-AOT peak occurred at DoY 224 during the waning phase of summer monsoon season and after the Chl-a peaks at DoY 216. An interesting feature in the figure is that, towards the peak of the summer monsoon (around DoY 180), when Chl-a concentration reaches ≈ 0.8 mg m−3, there is a brief period when Chl-a continues to increase and leads NASA-AOT by up to 3 time steps until DoY ≈ 220. However, this feature was not found in CCI-AOT data. Just before the Chl-a peak is reached, the wind speed starts to drop, followed by Chl-a and NASA-AOT, until all variables reach minima toward DoY 300, at which point the wind direction again reverses. SST starts to increase when the south-westerly winds drop, reaching a secondary peak at around DoY 310.
The seasonal patterns are consistent with the known geography of the area. However, there is a tantalizing suggestion in Figure 3 that when the winds speed are at their highest, and Chl-a levels are high, the NASA-AOT concentrations may be enhanced by maritime aerosols, in addition to the dust aerosols, and that some of these aerosols may have a biological origin, as indicated by Chl-a leading NASA-AOT during this period. However, this observation is not supported by CCI-AOT, and in the absence of additional information, it would be premature to conclude that such is the case. But it would be a point worthy of further investigation.
3.3. The Relationship between Chl-a, AOT and DOT off Somalia
Since Figure 3 indicates that there is a lag in the relationships between Chl-a and the other variables studied here, further analysis has been made for the 2 × 2° box using Cross Correlation Function (CCF) between Chl-a and AOT. The result (Figure 4A) shows that the highest significant positive correlation (r = 0.55) between Chl-a and NASA-AOT in the study region occurred for Chl-a lagging NASA-AOT by 1 to 2 time steps (1 time step is 8 days). The CCF analysis was also carried out between CCI-AOT and Chl-a and shows a significant positive correlation. Further, the maximum correlation (r = 0.54) occurred when Chl-a lagged behind CCI-AOT by 3 time steps (Figure 4B). So the analysis using CCI-AOT data confirmed the results obtained using NASA-AOT on the existence of a significant correlation between Chl-a and AOT in the region off Somalia, the magnitude of the correlation and also the sign of the lag.
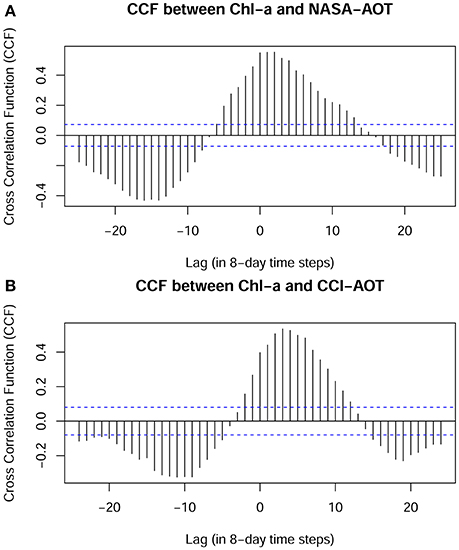
Figure 4. Cross Correlation Function between (A) Chl-a and NASA-AOT (B) Chl-a and CCI-AOT for study area off Somalia.Time step is 8 days.
The relationship between Chl-a and AOT (or DOT) with lag of 8 days is explored further in Figure 5 using NASA-AOT (or DOT). Scatter plot between Chl-a and AOT is shown in Figure 5A, with the fitted curve and the r value of 0.55 for the fit, consistent with the CCF. However, we recognize that the relationship of maritime and dust aerosols with Chl-a would be functionally different (for example, we do not anticipate that maritime aerosols could fertilize the oceans, whereas it would be plausible with dust aerosols). Dust aerosols are present more frequently during the summer monsoon season because of the favorable wind from adjacent land masses, compared with other seasons. Out of 736 observations over 16 years, around 203 observations were identified as dust aerosols. Figure 5B shows the relationship between Chl-a and DOT. We see that there is a general tendency for Chl-a to increase with DOT.
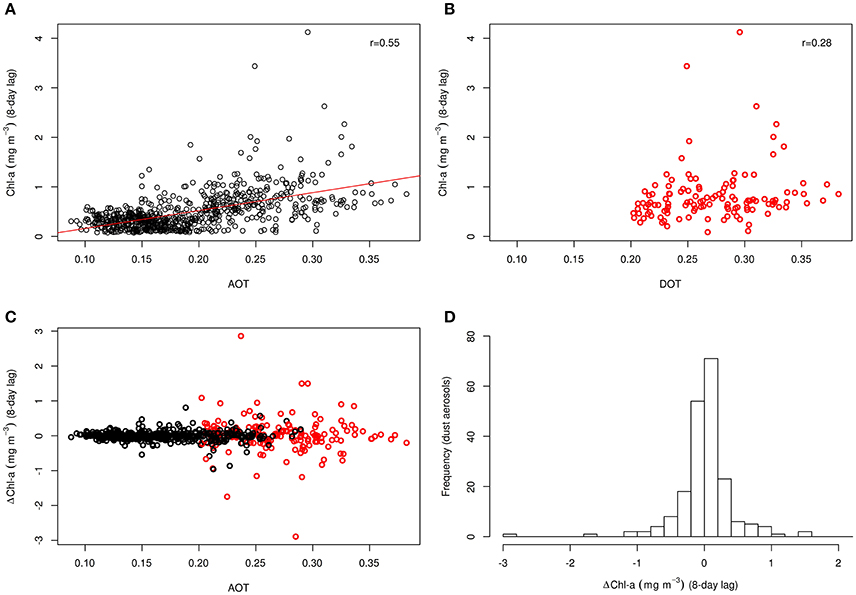
Figure 5. (A) The scatter plot between 8-day composite AOT (NASA-AOT) and Chl-a with lag of one time steps, for the study area. The straight line in red colour indicates the regression equation and the correlation coefficient (r) is shown in the top right side. (B) Scatter plot between DOT and Chl-a with lag of one time steps (subset of all the data points in (A). (C) Scatter plot between AOT and ΔChl-a with lag of one time step. The circles in red colour indicate dust aerosols. (D) Histogram for ΔChl-a during the presence of dust aerosols with lag of one time steps.
We checked further whether the presence of dust aerosols enhances the Chl-a concentration in the subsequent time steps by calculating the difference in Chl-a (ΔChl-a) in 1 time step after a dust event, and plotting it against NASA-AOT (Figure 5C). The presence of more positive ΔChl-a following high aerosol events would be indicative of a positive effect of aerosols on phytoplankton concentration. The data (Figure 5C) show no obvious relationship between aerosols and ΔChl-a either for all aerosols taken together or for dust aerosol events (circles in red colour) by themselves. However, for all the DOT events considered by themselves, the frequency of ΔChl-a is slightly skewed toward positive numbers, with some 114 values being positive out of 203 events (see histogram of ΔChl-a, Figure 5D). So the probability that Chl-a enhancement is associated with the presence of dust aerosols throughout the year is 56% (114 out of 203), compared with 238 out of 532 in the absence of dust aerosols (45%). The higher number of positive ΔChl-a observations is significant (p < 0.05) according to a binomial test. For the non-dust events, there is a higher number of negative values (294) compared with positive values (238) of ΔChl-a. These results are summarized in Table 2.
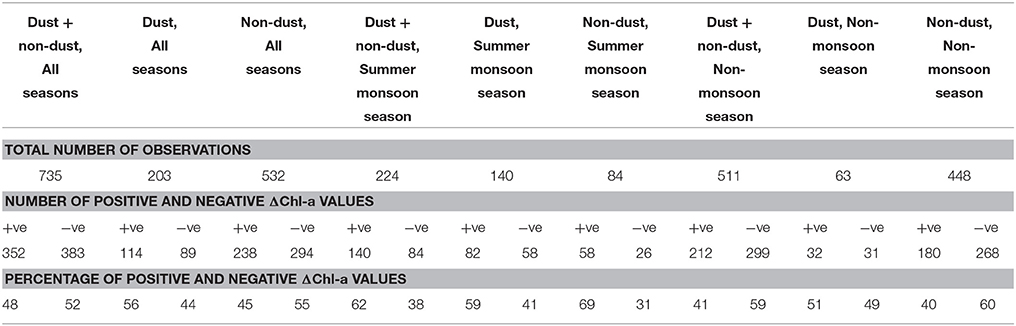
Table 2. The number of observations with enhancements in Chl-a (+ve ΔChl-a) or reductions in Chl-a (−ve ΔChl-a), for all data, and for the summer monsoon, for the non-monsoon and sorted according to whether the aerosols were identified as dust or not (here, dust aerosols were derived from NASA-AOT data).
We supplemented these calculations after splitting the data according to monsoon (summer monsoon) and non-monsoon seasons, recognizing the differences in oceanographic and meteorological conditions during these two parts of the year (Table 2). Out of 224 observations during the summer monsoon season, 140 are dust aerosol events and 84 are non-dust events. Within these 140 dust events, the number of positive ΔChl-a values is 82 (59%), compared with 58 (41%) negative values. However, for non-dust events during this season, we also find more positive ΔChl-a values (58 events, or 69%) than negative ones (26 events, or 31%). For the non-monsoon season, out of 511 total observations, 448 are non-dust aerosol events and 63 are dust events. Within these non-dust observations, there is higher number of negative values (268, or 60%) when compared with positive values (180 or 40%). But during dust events, the number of positive observations is slightly higher, with 32 (51%) positive values compared with 31 (49%) negative ones. We conclude from all of the above that the probability of Chl-a enhancement during the summer monsoon season does not depend much on the presence or absence of dust aerosols. In other words, during the summer monsoon season, there is a higher probability of finding positive ΔChl-a values, regardless of whether there is a dust event or not. On the other hand, during the rest of the year, the probability of chlorophyll enhancement is a little higher during dust events than during non-dust events.
The analysis was also repeated for CCI-AOT data to verify the above results and is presented in Table 3. For this dataset, the probability of Chl-a enhancement is again more in the presence of dust aerosols when the whole year is considered, at 53% (134 out of 251), compared with 142 out of 344 in the absence of dust aerosols (41%). Out of 208 observations during the summer monsoon season, 154 are dust aerosol events and 54 are non-dust events. Within these 154 dust events, the number of positive ΔChl-a values is 83 (54%), compared with 71 (46%) negative values. However, for non-dust events during this season, we also find more positive ΔChl-a values (31, or 57%) than negative ones (23, or 43%). The results from winter monsoon season indicate that, though the dust aerosol events are fewer in number (49) compared with non-dust (93) within 142 observations, there were more positive ΔChl-a values (28, or 57%) than negative values (21, or 43%) when dust aerosols were present in the region. But, during the absence of dust aerosols, there is a higher number of negative values (48, or 52%) compared with positive values (45 or 48%).
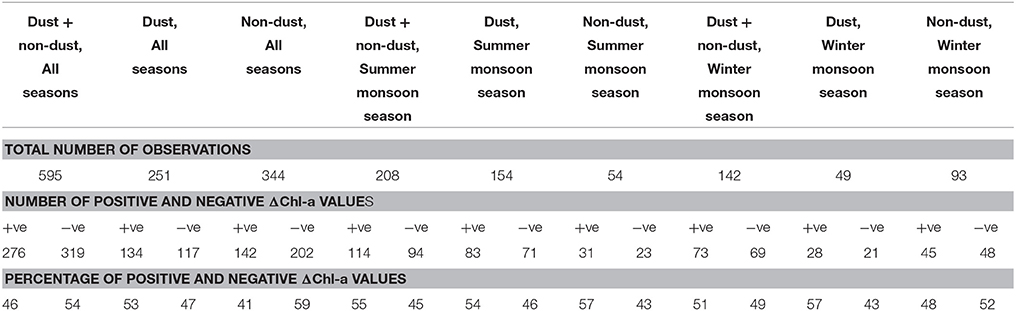
Table 3. The number of observations with enhancements in Chl-a (+ve ΔChl-a) or reductions in Chl-a (−ve ΔChl-a), for all data, and for the summer monsoon, for the winter monsoon and sorted according to whether the aerosols were identified as dust or not (here, dust aerosols were derived from CCI-AOT data).
Thus both NASA-AOT and CCI-AOT lead to the conclusion that the probability of Chl-a enhancement during the summer monsoon season does not depend on the presence or absence of dust aerosols. In other words, during the summer monsoon season, there is a higher probability of finding positive ΔChl-a values, regardless of whether there is a dust event or not. On the other hand, during the winter monsoon season and rest of the year, the probability that dust events may be associated with chlorophyll enhancement is higher than that during non-dust periods.
3.4. Relationship of Chl-a with Winds, SST, AOT, and DOT
To elucidate further the relationship between Chl-a and environmental conditions, we next examined the CCF between Chl-a and alongshore wind speed, since it is known that the alongshore winds determine upwelling, and hence influence phytoplankton dynamics in the area (Goes et al., 2005; Gregg et al., 2005; Wiggert et al., 2005; Prasanna Kumar et al., 2010); (see also Figure 3). The result (Figure 6) shows, similar to the CCF between Chl-a and NASA-AOT, that the correlation peaks with a lag of 1-2 time steps, with wind speed leading Chl-a, but with a higher correlation coefficient (r = 0.69, p < 0.05).
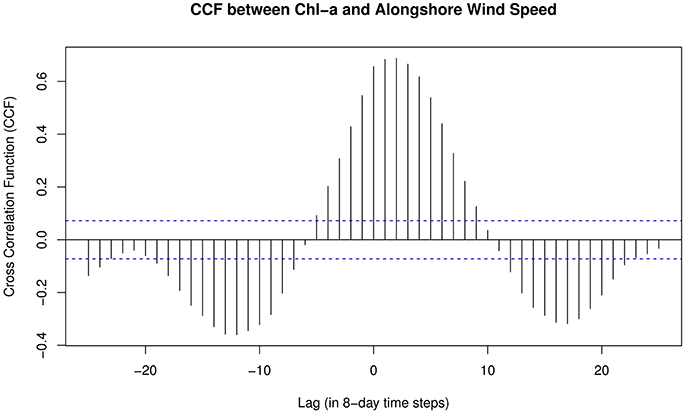
Figure 6. Cross Correlation Function between Chl-a and alongshore wind speed for study area off Somalia. Time step is 8 days.
Since the correlation coefficients of Chl-a with both aerosols and wind speed peak with a lag of 1–2 time steps, we chose a lag of 1 time step, for a linear step-wise multiple regression study with Chl-a as dependent variable, and NASA-AOT (or DOT), Ekman Mass Transport (EMT), alongshore wind speed and SST as independent variables. The upwelling indices, the wind speed and EMT both show more or less similar correlation with Chl-a. So, we excluded the EMT from the multiple linear regression analysis (but the results from the multiple linear regression including EMT are presented as Table S1). When the correlations with each of the independent variables are considered individually, the highest r2 values were found for alongshore wind speed (r2 = 0.47) for the ensemble of year-round data, with the corresponding r2 dropping to 0.17 when dust aerosol events are considered separately (140 dust events during the summer monsoon, and 63 outside of it, totalling 203), followed by SST (r2 = 0.33 and r2 = 0.20 for the same two cases respectively), and then by NASA-AOT (r2 = 0.30 and r2 = 0.08 for the corresponding cases). From the results of pair-wise regression analysis, we see that the addition of NASA-AOT (or DOT) as an independent variable, in addition to wind speed, increases r2 values by a modest 0.02. With all three variables taken together as independent variables, the explained variance (r2) is 0.52 for all data, and 0.25 for DOT events (Table 4). The results for a lag of 2 time steps (not shown) are similar to those for lag of 1 time step, but with lower correlation coefficients.
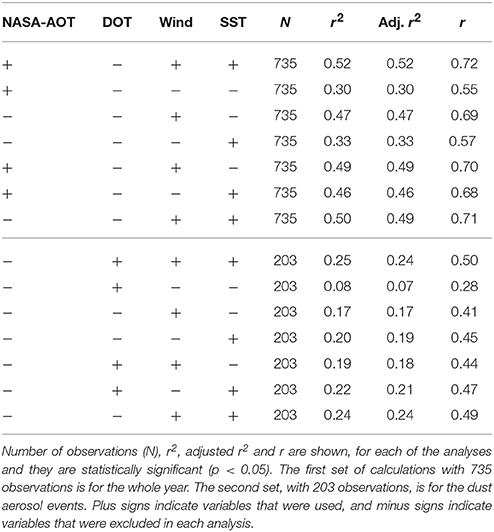
Table 4. Results of multiple linear regression analysis with Chl-a as the dependent variable and NASA-AOT or DOT, alongshore wind speed and SST as independent variables for 1 time step lag.
The multiple regression analysis was also repeated for CCI-AOT data with Chl-a as dependent variable and CCI-AOT (or DOT), alongshore wind speed and SST as independent variables (Table 5). Since the correlation coefficients of Chl-a with CCI-AOT peak with a lag of 3 time steps, we chose a lag of 3 time steps for this analysis. When the correlations with each of the independent variables are considered individually, the highest r2 values were again found for alongshore wind speed (r2 = 0.49) for year-round data and r2 = 0.38 for dust aerosol events (154 dust events during the summer monsoon, and 97 outside of it, totalling 251) considered separately, followed by SST (r2 = 0.32 and r2 = 0.15 for the same two cases respectively), and then by CCI-AOT (r2 = 0.29 and r2 = 0.09 for the corresponding cases). From the results of pair-wise regression analysis, the addition of CCI-AOT (or DOT) on wind speed as independent variables did not make any improvement in the r2 value of 0.49. However, a small increase in r2 value by 0.06 or 0.08 was found when adding CCI-AOT (or DOT) respectively to SST.
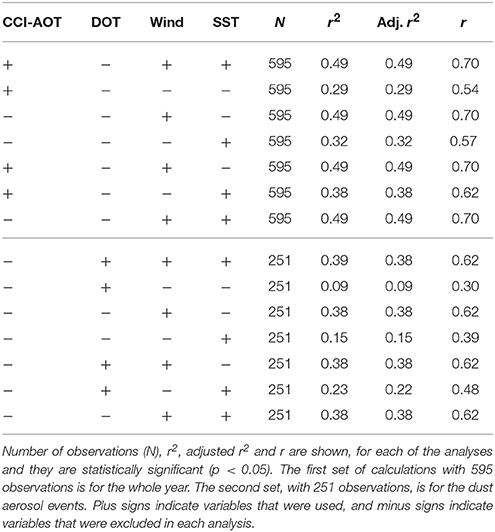
Table 5. Results of multiple linear regression analysis with Chl-a as the dependent variable and CCI-AOT or DOT, alongshore wind speed and SST as independent variables for 3 time step lag.
4. Discussion
4.1. The Satellite Data Used
Much of the interpretation of results for the region off Somalia depends on the quality of the satellite data used for the analysis, especially during the summer monsoon season, since this is a highly dynamic season, with high winds, high AOT and high Chl-a concentrations. The OC-CCI Chl-a dataset (Sathyendranath et al., 2016) was selected because of the significantly-improved seasonal coverage that the data provide in the study area, compared with other datasets, especially during the summer monsoon season. But it is important to reassure ourselves that the data are of sufficient quality for the analysis presented. Though the OC-CCI data have been validated using a global dataset as part of the project, and also for the neighboring Red Sea (Brewin et al., 2015) and the Gulf of Aden (Gittings et al., 2016), we do not have in situ data from off Somalia region for local validation. However, the data are reassuring in some respects: the first one is that, if the relationship between Chl-a and AOT were an artifact of the processing, then one would anticipate that the relationship would peak at zero lag. In fact, we see that, typically, the maximum correlation occurred with a lag, suggesting a functional relationship between the two variables, rather than an artifact. The second is that the seasonal patterns in Chl-a are consistent with the known oceanography of the area, and appear as a consequence of the seasonal changes in the oceanographic conditions, as indicated by the winds and SST. The AOT and AE data from both NASA and CCI also show seasonal changes with high AOT values and low AE during summer monsoon season and vice versa for the rest of the year.
We have used aerosol data from the NASA ocean colour web site, partly to reassure ourselves that the aerosol and Chl-a products that are outputs of the same processing chain do not show inter-dependencies associated with the assumptions that underlie the processing. In the OC-CCI processing version-2 used here, SeaWiFS and MODIS-Aqua data were processed using NASA's SeaDAS software, consistent with the processing chain that generated the aerosol products at the NASA ocean colour website. That the analysis presented here has indicated that the patterns in Chl-a and in the aerosol properties are consistent with the known oceanography of the study area, and that the correlations vary with region (Figure 2) as oceanographic and meteorological conditions change, lends some confidence to the quality of the data, in the absence of direct validation data. To further substantiate the application of satellite data to studies of relationship between aerosol and phytoplankton, Aerosol-CCI data sets were also subjected to identical analysis and the data confirmed our findings.
4.2. Aerosols and Phytoplankton in the Western Arabian Sea off Somalia
There have been a few previous studies that dealt with the influence of aerosols on phytoplankton dynamics in the Arabian Sea. A recent study (Banerjee and Prasanna Kumar, 2014) has shown that episodic dust storms could generate phytoplankton blooms in the central Arabian Sea during the winter monsoon. Nezlin et al. (2010) reported a correlation between Chl-a and aerosols when studying inter-annual variations in the Persian Gulf area. Prasanna Kumar et al. (2010) reported an increasing trend in phytoplankton in the central Arabian Sea during winter months of 1997–2007, and attributed it to increasing supply of iron by dust aerosols. Singh et al. (2008) studied a series of dust storms in the northern Arabian Sea during a 3-year period, and reported chlorophyll enhancement within 1–4 days of dust events, but also pointed out other mechanisms that might be responsible for the relationship observed.
Our results for the western Arabian Sea off Somalia indicate only a possible minor role for dust aerosols enhancing Chl-a concentration during the summer monsoon, supplementing the major role of alongshore winds inducing upwelling favorable for phytoplankton growth. The upwelling component of winds off Somalia during summer monsoon season appears to be far stronger than the classic eastern coastal upwelling zones in the world ocean (Bakun et al., 1998). In the data used here, the wind speed was greater than 15 m/s during summer monsoon season over the Somalia coast. Recently, de Castro et al. (2016) studied the evolution of Somali coastal upwelling under future warming scenarios using models. When the intensity of Somali coastal upwelling during summer monsoon season was projected for the twenty first century, the trends showed that changes in coastal upwelling were mainly related to the wind-induced Ekman transport. Further, our findings are consistent with those of Gallisai et al. (2014) for the Mediterranean: they concluded that the main driver of phytoplankton dynamics is the supply of nutrients from the deep water to the surface layers through vertical mixing. However, the results of the multiple regression presented here do not necessarily imply that the effect of aerosols on Chl-a is only 2%, but only that, because AOT covaries with the other variables, especially wind speed, it is difficult to disentangle their individual effects on Chl-a concentration. Perhaps more interesting is the possibility that the effect of dust events on Chl-a enhancement might be a little stronger during the winter monsoon season and rest of the year than during the summer monsoon season (Tables 2, 3), consistent with the results of Prasanna Kumar et al. (2010) for the central Arabian Sea during winter monsoon season. The direction of the winds during the winter monsoon would suggest an origin in the Asian subcontinent for these dust aerosols, rather than the Arabian peninsula.
We used the cross correlation function to study the phase relationship between aerosol (AOT) and phytoplankton (Chl-a) dynamics. The correlation between the two variables peaked at a lag of 1–2 time steps, with AOT leading. However, since a similar lag was found in the CCF between Chl-a and alongshore winds, it is difficult to attribute a causal relationship to the aerosols by themselves. The phase relationship also throws light on whether or not the biological particles might be enhancing the production of aerosols in the study area. If such events were commonplace, then one would expect that Chl-a enhancement might occur prior to increase in aerosol concentration. The CCF results do not support this in general, but the climatologies of the studied variables (Figure 3A) do show that there is a reversal in the phase relationship for a brief period, with Chl-a leading NASA-AOT when Chl-a concentration approaches its peak during the summer monsoon season. However, this result is not confirmed by CCI-AOT data. Thus, conclusive evidence for biological enhancement of aerosols remains elusive. The intriguing result with the NASA-AOT certainly merits further investigation.
5. Concluding Remarks
Essential Climate Variables, or ECVs, are our sentinels for observation of climate change. However, to understand climate change, it is not sufficient to study individual ECVs in isolation. Instead, it is also important to study how they interact with each other, and to understand how these interactions might change in the future. Of the marine ECVs, Chl-a concentration is the only biological ECV that is currently amenable to routine observations by remote sensing.
In this paper, we have examined one piece of the puzzle, by studying how the variability of Chl-a in the western Arabian Sea is related to those in three other ECVs: aerosols, winds and SST, focussing more on aerosol- Chl-a interactions, using 16 years of satellite data. What emerges is a complex pattern of relationships, in an area where many ECVs co-vary with each other. While it is difficult to elucidate causal relationships from simple correlations, the phase relationships between the variables can throw some light on the underlying causes.
A question that had to be addressed first, when using satellite data for the analysis, was whether there were artifacts in the patterns in Chl-a, introduced by the atmospheric correction process, which depends to some extent on aerosol optical properties. The correlation between Chl-a and NASA-AOT (a by-product of ocean colour processing) peaking with a lag provided reassurance on this point, since the peak should have been observed at zero lag had processing artifacts been the cause of the correlation. This point was reinforced by repeating the analysis with data from Aerosol-CCI products, which are derived independently of the ocean colour processing chain.
Though the NASA aerosol properties and the CCI aerosol properties are generally consistent with each other, there is a significant phase shift in the time when they peak during the summer monsoon season. The underlying causes for this difference deserve to be investigated further, but fall outside the scope of this paper. In the Somali region, under upwelling regimes, the Chl-a concentration is strongly correlated with wind. Analysis of Ekman Mass Transport supports the hypothesis that wind-induced upwelling is the underlying cause of the high correlation between wind and Chl-a. According to the linear multiple regression analysis, aerosols have a modest effect on Chl-a, at best, with a lag of one to two time steps during this period. An unexpected outcome from this study is related to the importance of dust aerosols in stimulating Chl-a enhancement during the winter monsoon season, suggesting that the abundance of dust aerosols might enhance Chl-a in the absence of wind-induced upwelling.
Author Contributions
MS carried out all the data analyses and produced the figures. MS and SS wrote the manuscript. SS conceived the scientific plan, with help from TP. TP provided scientific advice, and led the project. GG contributed to the planning and discussions, and along with AB, provided supervision.
Conflict of Interest Statement
The authors declare that the research was conducted in the absence of any commercial or financial relationships that could be construed as a potential conflict of interest.
Acknowledgments
The authors acknowledge Department of Science and Technology (DST), India for the Jawaharlal Nehru Science Fellowship (JNSF) awarded to TP. The authors thank the Director, CMFRI, Kochi for all support and encouragement. This work is a contribution to the Ocean Colour Climate Change Initiative of the European Space Agency, and to the activities of the National Centre for Earth Observations of UK. We also thank the two reviewers for their helpful comments, which have improved the manuscript.
Supplementary Material
The Supplementary Material for this article can be found online at: https://www.frontiersin.org/articles/10.3389/fmars.2017.00386/full#supplementary-material
References
Baddock, M., Bullard, J., and Bryant, R. (2009). Dust source identification using MODIS: a comparison of techniques applied to the Lake Eyre Basin, Australia. Remote Sens. Environ. 113, 1511–1528. doi: 10.1016/j.rse.2009.03.002
Bakun, A., Roy, C., and Lluch-Cota, S. (1998). Coastal Upwelling and Other Processes Regulating Ecosystem Productivity and Fish Production in the Western Indian Ocean: Large Marine Ecosystems of the Indian Ocean: Assessment, Sustainability, and Management. Malden, MA: Blackwell Science.
Balarabe, M., Abdullah, K., and Nawawi, M. (2016). Seasonal variations of aerosol optical properties and identification of different aerosol types based on AERONET data over sub-Sahara West-Africa. Atmos. Clim. Sci. 6, 13–28. doi: 10.4236/acs.2016.61002
Banerjee, P., and Prasanna Kumar, S. (2014). Dust-induced episodic phytoplankton blooms in the Arabian Sea during winter monsoon. J. Geophys. Res. Oceans 119, 7123–7138. doi: 10.1002/2014JC010304
Banse, K. (1987). Seasonality of phytoplankton chlorophyll in the central and northern Arabian Sea. Deep Sea Res. A 34, 713–723. doi: 10.1016/0198-0149(87)90032-X
Banzon, V. F., Evans, R. E., Gordon, H. R., and Chomko, R. M. (2004). SeaWiFS observations of the Arabian Sea southwest monsoon bloom for the year 2000. Deep Sea Res. Part II 51, 189–208. doi: 10.1016/j.dsr2.2003.10.004
Brewin, R., Raitsos, D., Dall'Olmo, G., Zarokanellos, N., Jackson, T., Racault, M.-F., et al. (2015). Regional ocean-colour chlorophyll algorithms for the Red Sea. Remote Sens. Environ. 165, 64–85. doi: 10.1016/j.rse.2015.04.024
Brindley, H., Osipov, S., Bantges, R., Smirnov, A., Banks, J., Levy, R., et al. (2015). An assessment of the quality of aerosol retrievals over the Red Sea and evaluation of the climatological cloud-free dust direct radiative effect in the region. J. Geophys. Res. Atmos. 120, 10862–10878. doi: 10.1002/2015JD023282
Brock, J., Sathyendranath, S., and Platt, T. (1994). A model study of seasonal mixed-layer primary production in the arabian sea. Proc. Indian Acad. Sci. (Earth Planet Sci.) 103, 163–176.
Charlson, R. J., Lovelock, J. E., Andreae, M. O., and Warren, S. G. (1987). Oceanic phytoplankton, atmospheric sulphur, cloud albedo and climate. Nature 326, 655–661. doi: 10.1038/326655a0
Che, H., Wang, Y., Sun, J., Zhang, X., Zhang, X., Zhang, X., et al. (2013). Variation of aerosol optical properties over the taklimakan desert in China. Aerosol Air Qual. Res. 13, 777–785. doi: 10.4209/aaqr.2012.07.0200
Cropp, R. A., Gabric, A. J., McTainsh, G. H., Braddock, R. D., and Tindale, N. (2005). Coupling between ocean biota and atmospheric aerosols: dust, dimethylsulphide, or artifact? Global Biogeochem. Cycles 19:GB4002. doi: 10.1029/2004GB002436
deCastro, M., Sousa, M. C., Santos, F., and Dias, J. M. M. G.-G. (2016). How will Somali coastal upwelling evolve under future warming scenarios? Sci. Rep. 6:30137. doi: 10.1038/srep30137
de Leeuw, G., Holzer-Popp, T., Bevan, S., Davies, W. H., Descloitres, J., and Grainger, R. G. (2015). Evaluation of seven European aerosol optical depth retrieval algorithms for climate analysis. Remote Sens. Environ. 162, 295–315. doi: 10.1016/j.rse.2013.04.023
Donaghay, P. L., Liss, P. S., Duce, R. A., Kester, D. R., Hanson, A. K., Villareal, T., et al. (2015). The role of episodic atmospheric nutrient inputs in the chemical and biological ecosystems. Oceanography 4, 62–70. doi: 10.5670/oceanog.1991.04
Dubovik, O., Holben, B. N., Eck, T. F., Smirnov, A., Kaufman, Y. J., King, M. D. M., et al. (2002). Variability of absorption and optical properties of key aerosol types observed in worldwide locations. J. Atmos. Sci. 59, 590–608. doi: 10.1175/1520-0469(2002)059<0590:VOAAOP>2.0.CO;2
Duce, R. A., and Tindale, N. W. (1991). Atmospheric transport of iron and its deposition in the ocean. Limnol. Oceanogr. 36, 1715–1726. doi: 10.4319/lo.1991.36.8.1715
Eck, T., Holben, B., Dubovik, O., Smirnov, A., Goloub, P., Chen, H., et al. (2005). Columnar aerosol optical properties at AERONET sites in central eastern Asia and aerosol transport to the tropical mid- Pacific. J. Geophys. Res. Atmos. 110:D06202. doi: 10.1029/2004JD005274
Eck, T., Holben, B., Reid, J., Dubovik, O., Smirnov, A., O'Neill, N., et al. (1999). Wavelength dependence of the optical depth of biomass burning, urban and desert dust aerosols. J. Geophys. Res. Atmos. 104, 31333–31349. doi: 10.1029/1999JD900923
Facchini, M. C., Rinaldi, M., Decesari, S., Carbone, C., Finessi, E., Mircea, M., et al. (2008). Primary submicron marine aerosol dominated by insoluble organic colloids and aggregates. Geophys. Res. Lett. 35:L17814. doi: 10.1029/2008GL034210
Fischer, J., Schott, F., and Stramma, L. (1996). Current and transports of the Great Whirl-Socotra Gyre system during the summer monsoon, August 1993. J. Geophys. Res. Oceans 101, 3573–3587. doi: 10.1029/95JC03617
Gallisai, R., Peters, F., Volpe, G., Basart, S., and Baldasano, J. M. (2014). Saharan dust deposition may affect phytoplankton growth in the Mediterranean sea at ecological time scales. PLoS ONE 9:e110762. doi: 10.1371/journal.pone.0110762
GCOS (2011). Systematic Observation Requirements from Satellite-based Data Products for Climate 2011 Update. Supplemental Details to the Satellite-based Component of the “Implementation Plan for the Global Observing System for Climate in Support of the UNFCCC. Technical report, No. 154, World Meteorological Organisation (WMO), Geneva.
Ginoux, P., Chin, M., Tegen, I., Prospero, J., Holben, B., Dubovik, O., et al. (2001). Sources and global distributions of dust aerosols simulated with the GOCART model. J. Geophys. Res. Atmos. 106, 20255–20273. doi: 10.1029/2000JD000053
Gittings, J., Raitsos, D., Racault, M.-F., Brewin, R., Pradhan, Y., Sathyendranath, S., et al. (2016). Seasonal phytoplankton blooms in the Gulf of Aden revealed by remote sensing. Remote Sens. Environ. 189, 56–66. doi: 10.1016/j.rse.2016.10.043
Glantz, P., Nilsson, E. D., and von Hoyningen-Huene, W. (2009). Estimating a relationship between aerosol optical thickness and surface wind speed over the ocean. Atmos. Res. 92, 58–68. doi: 10.1016/j.atmosres.2008.08.010
Gobbi, G. P., Kaufman, Y. J., Koren, I., and Eck, T. F. (2007). Classification of aerosol properties derived from AERONET direct sun data. Atmos. Chem. Phys. 7, 453–458. doi: 10.5194/acp-7-453-2007
Goes, J. I., Thoppil, P. G., Gomes Hdo, R., and Fasullo, J. T. (2005). Warming of the Eurasian landmass is making the Arabian Sea more productive. Science 308, 545–547. doi: 10.1126/science.1106610
Goudie, A. S., and Middleton, N. J. (2001). Saharan dust storms: nature and consequences. Earth Sci. Rev. 56, 179–204. doi: 10.1016/S0012-8252(01)00067-8
Gregg, W. W., Casey, N. W., and McClain, C. R. (2005). Recent trends in global ocean chlorophyll. Geophys. Res. Lett. 32:L03606. doi: 10.1029/2004GL021808
Guleria, R. P., Kuniyal, J., Sharma, N., and Dhyani, P. P. (2012). Seasonal variability in aerosol optical and physical characteristics estimated using the application of the Ångström formula over Mohal in the northwestern Himalaya, India. J. Earth Syst. Sci. 121, 697–710. doi: 10.1007/s12040-012-0194-6
Hawkins, L. N., and Russell, L. M. (2010). Polysaccharides, proteins, and phytoplankton fragments: Four chemically distinct types of marine primary organic aerosol classified by single particle spectromicroscopy. Adv. Meteorol. 2010, 1–14. doi: 10.1155/2010/612132
Hitchcock, G. L., and Olson, D. B. (1992). NE and SW Monsoon Conditions Along the Somali Coast during 1987. Oxford Publishing Co.
Huang, H., Thomas, G. E., and Grainger, R. G. (2010). Relationship between wind speed and aerosol optical depth over remote ocean. Atmos. Chem. Phys. 10, 5943–5950. doi: 10.5194/acp-10-5943-2010
Jickells, T. D., An, Z. S., Andersen, K. K., Baker, A. R., Bergametti, G., Brooks, N., et al. (2005). Global iron connections between desert dust, ocean biogeochemistry, and climate. Science 308, 67–71. doi: 10.1126/science.1105959
Jordi, A., Basterretxea, G., Tovar-Sánchez, A., Alastuey, A., and Querol, X. (2012). Copper aerosols inhibit phytoplankton growth in the Mediterranean Sea. Proc. Natl. Acad. Sci. U.S.A. 109, 21246–21249. doi: 10.1073/pnas.1207567110
Kahn, R. A., Gaitley, B. J., Garay, M. J., Diner, D. J., Eck, T. F., Smirnov, A., et al. (2010). Multiangle Imaging Spectro Radiometer global aerosol product assessment by comparison with the Aerosol Robotic Network. J. Geophys. Res. Atmos. 115:D23209. doi: 10.1029/2010JD014601
Kaufman, Y. J. (1993). Aerosol optical thickness and atmospheric path radiance. J. Geophys. Res. Atmos. 98, 2677–2692. doi: 10.1029/92JD02427
Kaufman, Y. J., Remer, L. A., Tanrè, D., Li, R.-R., Kleidman, R., Mattoo, S., et al. (2005). A critical examination of the residual cloud contamination and diurnal sampling effects on MODIS estimates of aerosol over ocean. IEEE Trans. Geosci. Remote Sens. 43, 2886–2897. doi: 10.1109/TGRS.2005.858430
Kayetha, V. K., Senthil Kumar, J., Prasad, A. K., Cervone, G., and Singh, R. P. (2007). Effect of dust storm on ocean color and snow parameters. J. Indian Soc. Remote Sens. 35, 1–9. doi: 10.1007/BF02991828
Koning, E., van Iperen, J. M., van Raaphorst, W., Helder, W., Brummer, G.-J. A., and van Weering, C. E. (2001). Selective preservation of upwelling-indicating diatoms in sediments off Somalia, NW Indian Ocean. Deep Sea Res. I 48, 2473–2495. doi: 10.1016/S0967-0637(01)00019-X
Koracin, D., Dorman, C., and Dever, E. (2004). Coastal perturbations of marine-layer winds, wind stress, wind stress curl along California and Baja California in June 1999. J. Phys. Ocean. 34, 1152–1173. doi: 10.1175/1520-0485(2004)034<1152:CPOMWW>2.0.CO;2
Large, W., and Pond, S. (1981). Open ocean momentum flux measurements in moderate to strong winds. J. Phys. Ocean. 11, 324–336.
Leck, C., and Bigg, E. K. (2005). Biogenic particles in the surface microlayer and overlaying atmosphere in the central Arctic Ocean during summer. Tellus 57, 305–316. doi: 10.3402/tellusb.v57i4.16546
Lenes, J. M., Darrow, B. P., Cattrall, C., Heil, C. A., Callahan, M., Vargo, G. A., et al. (2001). Iron fertilization and the Trichodesmium response on the West Florida shelf. Limnol. Oceanogr. 46, 1261–1277. doi: 10.4319/lo.2001.46.6.1261
Léon, J.-F., and Legrand, M. (2003). Mineral dust sources in the surroundings of the north Indian Ocean. Geophys. Res. Lett. 30, 42–1–42–4. doi: 10.1029/2002GL016690
Lévy, M., Shankar, D., André, J. M., Shenoi, S. S. C., Durand, F., and de Boyer Montégut, C. (2007). Basin-wide seasonal evolution of the Indian Ocean's phytoplankton blooms. J. Geophys. Res. Ocean 112:C12014. doi: 10.1029/2007JC004090
Levy, R., Remer, L., Mattoo, S., Vermote, E., and Kaufman, Y. (2007). Second-generation operational algorithm: retrieval of aerosol properties over land from inversion of Moderate Resolution Imaging Spectroradiometer spectral reflectance. J. Geophys. Res. Atmos. 112:D13211. doi: 10.1029/2006JD007811
Li, F., and Ramanathan, V. (2002). Winter to summer monsoon variation of aerosol optical depth over the tropical Indian Ocean. J. Geophys. Res. Atmos. 107, AAC 2–1–AAC 2–13. doi: 10.1029/2001JD000949
Lovelock, J. (2006). The Revenge of Gaia: Earth's Climate Crisis and the Fate of Humanity. New York, NY: Basic Books.
Mahowald, N. M., Baker, A. R., Bergametti, G., Brooks, N., Duce, R. A., Jickells, T. D., et al. (2005). Atmospheric global dust cycle and iron inputs to the ocean. Global Biogeochem. Cycles 19:GB4025. doi: 10.1029/2004GB002402
Mallet, M., Chami, M., Gentili, B., Sempéré, R., and Dubuisson, P. (2009). Impact of sea-surface dust radiative forcing on the oceanic primary production: a 1D modeling approach applied to the West African coastal waters. Geophys. Res. Lett. 36:L15828. doi: 10.1029/2009GL039053
Martin, J. H., Coale, K. H., Johnson, K. S., Fitzwater, S. E., Gordon, R. M., Tanner, S. J., et al. (1994). Testing the iron hypothesis in ecosystems of the equatorial Pacific Ocean. Nature 371, 123–129. doi: 10.1038/371123a0
Martin, J. H., Gordon, R. M., and Fitzwater, S. E. (1991). The case for iron. Limnol. Oceanogr. 36, 1793–1802. doi: 10.4319/lo.1991.36.8.1793
McCreary, J. P., Han, W., Shankar, D., and Shetye, S. R. (1996). Dynamics of the east India coastal current: 2. Numerical solutions. J. Geophys. Res. Oceans 101, 13993–14010. doi: 10.1029/96JC00560
Meskhidze, N., Chameides, W. L., and Nenes, A. (2005). Dust and pollution: a recipe for enhanced ocean fertilization? J. Geophys. Res. Atmos. 110:D03301. doi: 10.1029/2004JD005082
Meskhidze, N., and Nenes, A. (2010). Effects of ocean ecosystem on marine aerosol-cloud interaction. Adv. Meteorol. 2010:239808. doi: 10.1155/2010/239808
Muhs, D. R., Budahn, J. R., Prospero, J. M., and Carey, S. N. (2007). Geochemical evidence for African dust inputs to soils of western Atlantic islands: barbados, the Bahamas and Florida. J. Geophys. Res. Earth Surface 112:F02009. doi: 10.1029/2005JF000445
Mulcahy, J. P., O'Dowd, C. D., Jennings, S. G., and Ceburnis, D. (2008). Significant enhancement of aerosol optical depth in marine air under high wind conditions. Geophys. Res. Lett. 35:L16810. doi: 10.1029/2008GL034303
Myhre, G., Stordal, F., Johnsrud, M., Diner, D. J., Geogdzhayev, I. V., Haywood, J. M., et al. (2005). Intercomparison of satellite retrieved aerosol optical depth over ocean during the period September 1997 to December 2000. Atmos. Chem. Phys. 5, 1697–1719. doi: 10.5194/acp-5-1697-2005
Nezlin, N. P., Polikarpov, I. G., Al-Yamani, F. Y., Subba Rao, D. V., and Ignatov, A. M. (2010). Satellite monitoring of climatic factors regulating phytoplankton variability in the Arabian (Persian) Gulf. J. Mar. Syst. 82, 47–60. doi: 10.1016/j.jmarsys.2010.03.003
O'Dowd, C. D., Smith, M. H., Consterdine, I. E., and Lowe, J. A. (1997). Marine aerosol, sea-salt, and the marine sulphur cycle: a short review. Atmos. Environ. 31, 73–80. doi: 10.1016/S1352-2310(96)00106-9
Owens, N. J. P., Burkill, P. H., Mantoura, R. F. C., Woodward, E. M. W., Bellan, I. E., Aiken, J., et al. (1993). Size-fractionated primary production and nitrogen assimilation in the northwestern Indian Ocean. Deep Sea Res. II 40, 697–709. doi: 10.1016/0967-0645(93)90053-P
Pakszys, P., Zielinski, T., Markowicz, K., Petelski, T., Makuch, P., Lisok, J., et al. (2015). Annual Changes of Aerosol Optical Depth and Ångström Exponent over Spitsbergen. Switzerland: Springer.
Papaynannis, A., Zhang, H. Q., Amiridis, V., Ju, H. B., Chourdakis, G., Georgussis, G., et al. (2007). Extraordinary dust event over Beijing, China, during April 2006: Lidar, Sun photometric, satellite observations and model validation. Geophys. Res. Lett. 34:L07806. doi: 10.1029/2006GL029125
Patra, P. K., Kumar, M. D., Mahowald, N., and Sarma, V. V. S. S. (2007). Atmospheric deposition and surface stratification as controls of contrasting chlorophyll abundance in the North Indian Ocean. J. Geophys. Res. Ocean 112:C05029. doi: 10.1029/2006JC003885
Paytan, A., Mackeya, K. R., Chena, Y., Lima, I. D., Doney, S. C., Mahowald, N., et al. (2009). Toxicity of atmospheric aerosols on marine phytoplankton. Proc. Natl. Acad. Sci. U.S.A. 106, 4601–4605. doi: 10.1073/pnas.0811486106
Pease, P. P., Chakerian, V. P. T., and Tindale, N. W. (1998). Aerosols over the Arabian Sea: geochemistry and source areas for aeolian desert dust. J. Arid Environ. 39, 477–496. doi: 10.1006/jare.1997.0368
Pereira, S. N., Wagner, F., and Silva, A. M. (2011). Seven years of measurements of aerosol scattering properties, near the surface, in the southwestern Iberia Peninsula. Atmos. Chem. Phys. 11, 17–29. doi: 10.5194/acp-11-17-2011
Popp, T., de Leeuw, G., Bingen, C., Brühl, C., Capelle, V., Chedin, A., et al. (2016). Development, production and evaluation of aerosol climate data records from European satellite observations (Aerosol-CCI). Remote Sens. 8:421. doi: 10.3390/rs8050421
Prakash, P., Prakash, S., Rahaman, H., Ravichandran, M., and Nayak, S. (2012). Is the trend in chlorophyll-a in the Arabian Sea decreasing? Geophys. Res. Lett. 39:L23605. doi: 10.1029/2012GL054187
Prasanna Kumar, S., Madhupratap, M., Dileep Kumar, M., Muraleedharan, P. M., De Souza, S. N., Gauns, M., et al. (2001). High biological productivity in the central Arabian Sea during the summer monsoon driven by Ekman pumping and lateral advection. Curr. Sci. 81, 1633–1638.
Prasanna Kumar, S., Roshin, R. P., Narvekar, J., Dinesh Kumar, P. K., and Vivekanandan, E. (2010). What drives the increased phytoplankton biomass in the Arabian Sea? Curr. Sci. 99, 101–106.
Prospero, J. M., Ginoux, P., Torres, O., Nicholson, S. E., and Gill, T. E. (2002). Environmental characterization of global sources of atmospheric soil dust identified with the NIMBUS 7 Total Ozone Mapping Spectrometer (TOMS) absorbing aerosol product. Rev. Geophys. 40, 2–1–2–31. doi: 10.1029/2000RG000095
Quinn, P. K., and Bates, T. S. (2011). The case against climate regulation via oceanic phytoplankton sulphur emissions. Nature 480, 51–56. doi: 10.1038/nature10580
Salinas, S. V., Chew, B. N., and Liew, S. C. (2009). Retrievals of aerosol optical depth and Ångström exponent from ground-based Sun-photometer data of Singapore. Appl. Opt. 48, 1473–1484. doi: 10.1364/AO.48.001473
Santos, F., Gomez-Gesteira, M., deCastro, M., and Días, J. M. (2015). A dipole-like SST trend in the Somalia region during the monsoon season. J. Geophys. Res. Oceans 120, 597–607. doi: 10.1002/2014JC010319
Satheesh, S. K., Srinivasan, J., and Moorthy, K. K. (2006). Contribution of sea-salt to aerosol optical depth over the Arabian Sea derived from MODIS observations. Geophys. Res. Lett. 33:L03809. doi: 10.1029/2005GL024856
Sathyendranath, S., Groom, S., Grant, M., Brewin, R. J. W., Thompson, A., Chuprin, A., et al. (2016). ESA Ocean Colour Climate Change Initiative (Ocean-Colour-CCI): Version 2.0 Data. Centre for Environmental Data Analysis.
Schott, F. (1983). Monsoon response of the Somali Current and associated upwelling. Prog. Oceanogr. 12, 357–381. doi: 10.1016/0079-6611(83)90014-9
Schott, F., Dengler, M., and Schoenefeldt, R. (2002). The shallow overturning circulation of the Indian Ocean. Prog. Oceanogr. 53, 57–103. doi: 10.1016/S0079-6611(02)00039-3
Schott, F., Fischer, J., Garternicht, U., and Quadfasel, D. (1997). Summer monsoon response of the Northern Somali Current, 1995. Geophys. Res. Lett. 24, 2565–2568. doi: 10.1029/97GL00888
Schott, F., and McCreary, J. P. (2001). The monsoon circulation of the Indian Ocean. Prog. Oceanogr. 51, 1–123. doi: 10.1016/S0079-6611(01)00083-0
Schuster, G. L., Dubovik, O., and Holben, B. N. (2006). Ångström exponent and bimodal aerosol size distributions. J. Geophys. Res. Atmos. 111:D07207. doi: 10.1029/2005JD006328
Shankar, D., Vinayachandran, P. N. N., Unnikrishnan, A. S. S., and Shetye, S. R. (2002). The monsoon currents in the north Indian Ocean. Prog. Oceanogr. 52, 63–120. doi: 10.1016/S0079-6611(02)00024-1
Shinozuka, Y., Redemann, J., Livingston, J. M., Russell, P. B., Clarke, A. D., Howell, S. G., et al. (2011). Airborne observation of aerosol optical depth during ARC-TAS: vertical profiles, inter-comparison and fine-mode fraction. Atmos. Chem. Phys. 11, 3673–3688. doi: 10.5194/acp-11-3673-2011
Singh, R. P., Prasad, A. K., Kayetha, V. K., and Kafatos, M. (2008). Enhancement of oceanic parameters associated with dust storms using satellite data. J. Geophys. Res. Oceans 113:C11008. doi: 10.1029/2008JC004815
Smirnov, A., Holben, B. N., Eck, T. F., Dubovik, O., and Slutsker, I. (2003). Effect of wind speed on columnar aerosol optical properties at Midway Island. J. Geophys. Res. Atmos. 108, AAC 15–1–AAC 15–8. doi: 10.1029/2003JD003879
Smith, S. L., and Codispoti, L. A. (1980). Southwest monsoon of 1979: chemical and biological response of Somali coastal waters. Science 209, 597–600. doi: 10.1126/science.209.4456.597
Toledano, C., Cachorro, V., Benjon, A., de Frutos, A., Sorribas, M., de la Morena, B., et al. (2007). Aerosol optical depth and Ångström exponent climatology at El arenosillo AERONET site (Huelva, Spain). Q. J. R. Meteorol. Soc. 133, 795–807. doi: 10.1002/qj.54
Torres, O., Tanskanen, A., Veiheiman, B., Ahn, C., Braak, R., Bhartia, P., et al. (2007). Aerosols and surface UV products from Ozone Monitoring Instrument observations: an overview. J. Geophys. Res. Atmos. 112:D24S47. doi: 10.1029/2007JD008809
Trenberth, K. E., Large, W. G., and Olson, J. G. (1990). The mean annual cycle in global ocean wind stress. J. Phys. Oceanogr. 20, 1742–1760.
Valenzuela, A., Olmo, F., Lyamani, H., Antón, M., Titos, G., Cazorla, A., et al. (2014). Aerosol scattering and absorption Ångström exponents as indicators of dust and dust-free days over Granada (Spain). Atmos. Res. 154, 1–13. doi: 10.1016/j.atmosres.2014.10.015
Wiggert, J. D., Hood, R. R., Banse, K., and Kindle, J. C. (2005). Monsoon-driven biogeochemical processes in the Arabian Sea. Prog. Oceanogr. 65, 176–213. doi: 10.1016/j.pocean.2005.03.008
Wiggert, J. D., and Murtugudde, R. G. (2007). The sensitivity of the southwest monsoon phytoplankton bloom to variations in aeolian iron deposition over the Arabian Sea. J. Geophys. Res. Oceans 112:C05005. doi: 10.1029/2006JC003514
Yoon, J., von Hoyningen-Huene, W., Kokhanovsky, A. A., Vountas, M., and Burrows, J. P. (2012). Trend analysis of aerosol optical thickness and Ångström exponent derived from the global AERONET spectral observations. Atmos. Meas. Tech. 5, 1271–1299. doi: 10.5194/amt-5-1271-2012
Zhu, A., Ramanathan, V., Li, F., and Kim, D. (2007). Dust plumes over the Pacific, Indian, and Atlantic oceans: climatology and radiative impact. J. Geophys. Res. Atmos. 112:D16208. doi: 10.1029/2007JD008427
Keywords: essential climate variables, aerosol optical thickness, Ångström exponent, chlorophyll-a, ocean colour climate change initiative, climate change, remote sensing, dust aerosols
Citation: Shafeeque M, Sathyendranath S, George G, Balchand AN and Platt T (2017) Comparison of Seasonal Cycles of Phytoplankton Chlorophyll, Aerosols, Winds and Sea-Surface Temperature off Somalia. Front. Mar. Sci. 4:386. doi: 10.3389/fmars.2017.00386
Received: 30 March 2017; Accepted: 15 November 2017;
Published: 12 December 2017.
Edited by:
Catherine Jeandel, Centre National de la Recherche Scientifique (CNRS), FranceReviewed by:
Hubert Loisel, Université du Littoral Côte d'Opale, FranceDavid Antoine, Curtin University, Australia
Copyright © 2017 Shafeeque, Sathyendranath, George, Balchand and Platt. This is an open-access article distributed under the terms of the Creative Commons Attribution License (CC BY). The use, distribution or reproduction in other forums is permitted, provided the original author(s) or licensor are credited and that the original publication in this journal is cited, in accordance with accepted academic practice. No use, distribution or reproduction is permitted which does not comply with these terms.
*Correspondence: Shubha Sathyendranath, c3NhdEBwbWwuYWMudWs=