 Keisha D. Bahr
 Ku‘ulei S. Rodgers
- Hawai‘i Institute of Marine Biology, University of Hawai‘i, Kāne‘ohe, HI, United States
Coral bleaching events have been increasing in frequency and severity worldwide. The most prolonged global bleaching event began in 2014 and continued into 2017 impacting more reefs than any previous occurrence. Here we present the results of coral bleaching and mortality surveys conducted in Kāne‘ohe Bay O‘ahu, Hawai‘i and compare them to the only other widespread bleaching events to impact the main Hawaiian Islands in 1996 and 2014. Results from these surveys along with associated environmental factors were used to compare these events to gain a baseline understanding of the physical processes that influence localized bleaching dynamics under these extreme environmental conditions. Survey results show extensive variation in bleaching (1996–62%, 2014–45%, 2015–30%) and cumulative mortality (1996— <1%, 2014–13%, 2015–22%) between years. Bleaching prevalence was observed to decrease in certain reef areas across events, suggesting some acclimation and/or resilience, but possible increase susceptibility to mortality. Long-term monitoring sites show a similar temporal pattern of coral mortality and decline in coral cover, but revealed some reefs remained relatively un-impacted by consecutive high temperature events. Across the three bleaching events, we found that although circulation patterns can facilitate heating, the duration and magnitude of the high temperature event were the primary forcing functions for coral bleaching and mortality. Other localized primary drivers influencing water temperature such as irradiance, turbidity, and precipitation contributed to spatial variations. Recovery and resilience of this coral reef ecosystem is dependent on many factors including duration and magnitude of heating, resulting mortality levels, localized environmental factors in the bay, and coral species affected and their bleaching tolerances.
Introduction
Coral reefs throughout the world are undergoing significant ecological decline due to climate change (Aronson et al., 2002; Gardner et al., 2005; Norström et al., 2009; De'ath et al., 2012). Increases in anthropogenic atmospheric gases mainly from fossil fuel burning have resulted in significant increases in global sea surface temperatures (SST) (Sabine et al., 2004). Increased SST have resulted in more severe and more frequent coral bleaching events worldwide. 2014 marked the beginning of the longest global bleaching event on record, which continued for nearly three years and has affected more reefs than any previous worldwide bleaching event (Eakin et al., 2016). As warming continued, not only was 2015 the warmest year on record, but it also saw the single largest ocean temperature increase (0.16°C) within any given year (Heron et al., 2016).
The offshore subtropical waters of the Hawaiian Islands have experienced heating over the past 58 years (+1.15°C), which appears to have accelerated the frequency and severity of bleaching events throughout the archipelago (Hoeke et al., 2009; Bahr et al., 2015a). Previously recorded bleaching events (i.e., 1996, 2002, 2004) in the Hawaiian Archipelago were relatively short in duration and resulted in high recovery; however, reefs experienced unsurpassed bleaching on a statewide scale during the multi-year bleaching events in 2014 and 2015 (Bahr et al., 2015a).
The largest sheltered body of water in the main Hawaiian Islands, Kāne‘ohe Bay, contains among the highest coral cover in the State with numerous patch reefs, a fringing reef, and a barrier reef. This intensively studied estuarine coral reef ecosystem has been impacted by humans for over 700 years (Bahr et al., 2015b). Drastic modifications in the terrestrial environment (e.g., urbanization, stream channelization, extensive dredging) and direct release of primary sewage into the bay for nearly 20 years (circa 1960–1979) decreased species diversity, increased eutrophication, and altered ecosystem structure away from a coral dominated ecosystem (Bahr et al., 2015b). By 1973, Kāne‘ohe Bay was declared an ecosystem under stress until sewage diversion led to natural recovery of the coral reefs. The corals in Kāne‘ohe Bay have shown resilience by their capacity to respond to the numerous perturbations by recovering rapidly. Whether this is a result of a reduction in genetic diversity or that acclimatization and/or adaptations have occurred, the population has shown high resilience. Climate change now poses a significant new threat to the integrity of this unique coral reef ecosystem. Kāne‘ohe Bay has experienced initial indicators of climate change with more frequent localized storm events and flooding (i.e., freshwater kill events in 1965, 1988, 2014) and three major bleaching events (i.e., 1996, 2014, 2015). Thermally stressed corals are more susceptible to disease (Miller et al., 2009; Mydlarz et al., 2009; Burge et al., 2014), predation, bioerosion, and have reduced capacity for competition, growth, reproduction, and survival (Jokiel, 2004; Baker et al., 2008; Jones, 2008). Continued exposure to bleaching stress will eventually lead to reduced reef complexity, coral cover and biodiversity; therefore, providing lower quality habitat for fishes and marine invertebrates and consequently fewer ecosystem goods and services for dependent human communities (Munday et al., 2008).
Along with the rather unnatural history of Kāne‘ohe Bay, these corals are currently living at temperatures (+1–2°C) and acidification (average pCO2 levels ~500 μatm) regimes that will not be experienced for decades on open coastal reefs across the Hawaiian Archipelago (Bahr et al., 2015b). To determine whether these conditions increase the susceptibility of these corals to future anthropogenic and climate change stressors, we investigated the response and recovery of this coral reef ecosystem from recent bleaching events. Corals in the bay were closely monitored and documented during the previous 1996, 2014, and 2015 bleaching events. Previous work has documented the 1996 (Jokiel and Brown, 2004) and 2014 (Bahr et al., 2015a) bleaching events. The methodology and observer remained constant across all bleaching events. This presented a unique opportunity to examine all three bleaching events to determine differences in coral bleaching and mortality and their relationships with environmental factors. Furthermore, detailed long-term benthic monitoring surveys have been conducted by the Coral Reef Assessment and Monitoring Program (CRAMP) since 1999 to identify the controlling factors (i.e., natural and anthropogenic) contributing to the stability, decline, and/or recovery of the reefs in Kāne‘ohe Bay (Brown et al., 2004). Together, these data reveal the impact of these bleaching events on the resiliency of this unique coral reef ecosystem. Here we present the survey findings from the 2015 bleaching event in Hawai‘i and interpret those findings in the context of the two previously documented bleaching events. The objectives of this research were to: (1) describe the severity and extent of the 2015 bleaching event, (2) investigate the influence of the environmental drivers on bleaching variability across years, and (3) examine coral response and recovery during consecutive bleaching events to aid in understanding resiliency of the Kāne‘ohe Bay reef ecosystem.
Materials and Methods
Bay-Wide Coral Bleaching and Mortality Surveys
Documentation of the 1996 and 2014 bleaching events have been previously described in Jokiel and Brown (2004) and Bahr et al. (2015a), respectively. Here we described our detailed methods to quantify the extent of bleaching and associated mortality during the 2015 bleaching event. All bleaching surveys (1996, 2014, and 2015) were conducted using the same methodology described below.
Bay-wide coral surveys were conducted following the peak of the high temperature events for all three documented bleaching events in Kāne‘ohe Bay, O‘ahu Hawai‘i (21°28′N; 157°48′W).
The goal of our bay-wide surveys was to detect change in coral cover following the high temperature event; therefore, site selection criteria for each survey year included the same depth (1–2 m), presence of coral, and spatial coverage. Surveys were conducted between 1 and 2 m on the reef flat and slopes were coral species identification and pigmentation level could be accurately estimated without discoloration or distortion with depth. Stations were surveyed on Leeward and Windward sides of patch reefs when possible to account for potential differences in coral cover. Extent of bleaching was defined by surveying fringing, patch, and barrier reefs within Kāne‘ohe Bay across bleaching years (i.e., 1996, 2014, and 2015). To define bleaching prevalence, rapid assessments of total coral cover, species composition (% of live coral cover), and coral condition (i.e., normal, pale, bleached, dead expressed as % of live coral cover) at each site were conducted using a visual estimate technique at the same sites using the same observer (Bahr et al., 2015a). Individual coral colonies were not quantified, instead conditions of live coral area (100 m2) were estimated. These assessments were conducted from a boat at the surface under clear, calm conditions using a clear viewing box and/or snorkeling along the reef edge and across reef flats during a 5-min observation period that covered an area of 100 m2 (Bahr et al., 2015a). This method was previously compared to eight other quantitative methods (i.e., quadrat, random, point intercept transect, CRAMP assessments, video transect, towed-diver, photographic transect, NOAA ground truth) and produces comparable results in total coral cover estimates (Jokiel et al., 2015). This visual estimate technique allowed us to rapidly evaluate bleaching severity and extent across the large sampling area but may show higher variance. Coral condition was defined by visual assessment of pigmentation: “normal” (fully pigmented), “pale” (obvious pigmentation loss but retention of color), “bleached” (loss of all color), and recently “dead” skeleton as a result of bleaching mortality. These coral condition classifications follow the same methodology and classification originally established by Jokiel and Coles (1974) and were used in previous bleaching surveys (i.e., 1996 and 2014 bleaching events) at the same reef locations by the same observers (Bahr et al., 2015a).
The 2015 Bleaching Event
Bay-wide surveys (n = 24) were conducted ~25 days following peak temperature on 16 October 2015 in areas of high coral cover at a depth of 1–2 m. These sites were revisited after the 2014 surveys to confirm bleaching occurrence covering the spatial extent of the Bay. Sample intensity was lower in Oct 2015 and is accounted for in our statistical approach. Coral recovery surveys were conducted on 8 December 2015 to assess coral mortality and pigmentation on the reefs previously surveyed (n = 103 sites) using identical methods and observer. Additional surveys of coral condition, coral cover, and species composition were conducted on 11 November 2016 to determine the degree of recovery from the 2015 bleaching event (n = 100 sites). Bay-wide coral surveys from 1996, 2014, and 2015 were compared to investigate variation in bleaching response across documented bleaching events. Results from bay-wide surveys were then compared to long-term CRAMP surveys (shallow sites, 2m depth) to investigate the effects of these high temperature events on long-term coral cover changes.
Long-Term Coral Reef Assessment and Monitoring (CRAMP) Sites
The Hawai‘i CRAMP was developed in 1998 to describe changes on reefs over time in relation to natural and anthropogenic factors. This network of 62 permanent reef stations at 31 sites are stratified by depth (i.e., shallow ~3 m and deep ~10 m) across the main Hawaiian Islands. Three of these sites are located within Kāne‘ohe Bay, at two depths (2 and 8 m). The shallow sites are at comparable depths to the bay-wide surveys, thus the shallow sites were used to assess the effects of bleaching impacts on long-term coral cover trends. These sites are located in three different sections of the bay, the north bay (patch reef 44, Ka‘alaea; flow regime 4), central bay (patch reef 17, He‘eia; flow regime 5) and south bay (Moku o Lo‘e Island, flow regime 6) (Figure 1; Table 1). At each station, 10 randomly selected 10 m transects and five photo quadrats within a 200 m2 area are permanently marked with short stainless steel pins. Non-overlapping digital images estimate benthic coverage using the software program PhotoGrid (Bird, 2001). Percent coral cover, coral species richness, and coral diversity are calculated. The methodology was designed with high statistical power to distinguish an absolute change of 10% in coral cover annually within a site with statistical power increasing over time. CRAMP methodology is described in further detail in Brown et al. (2004). Coral surveys at long-term monitoring sites in 2012 and 2016 serve to provide benchmarks for the reef status before and after the consecutive bleaching events. From these data, we can deduce changes in coral cover in relation to the high temperature event rather than potential natural oscillations in coral cover. Further, CRAMP provides supporting evidence of the presence and degree of mortality and the spatial pattern documented in the bay-wide surveys.
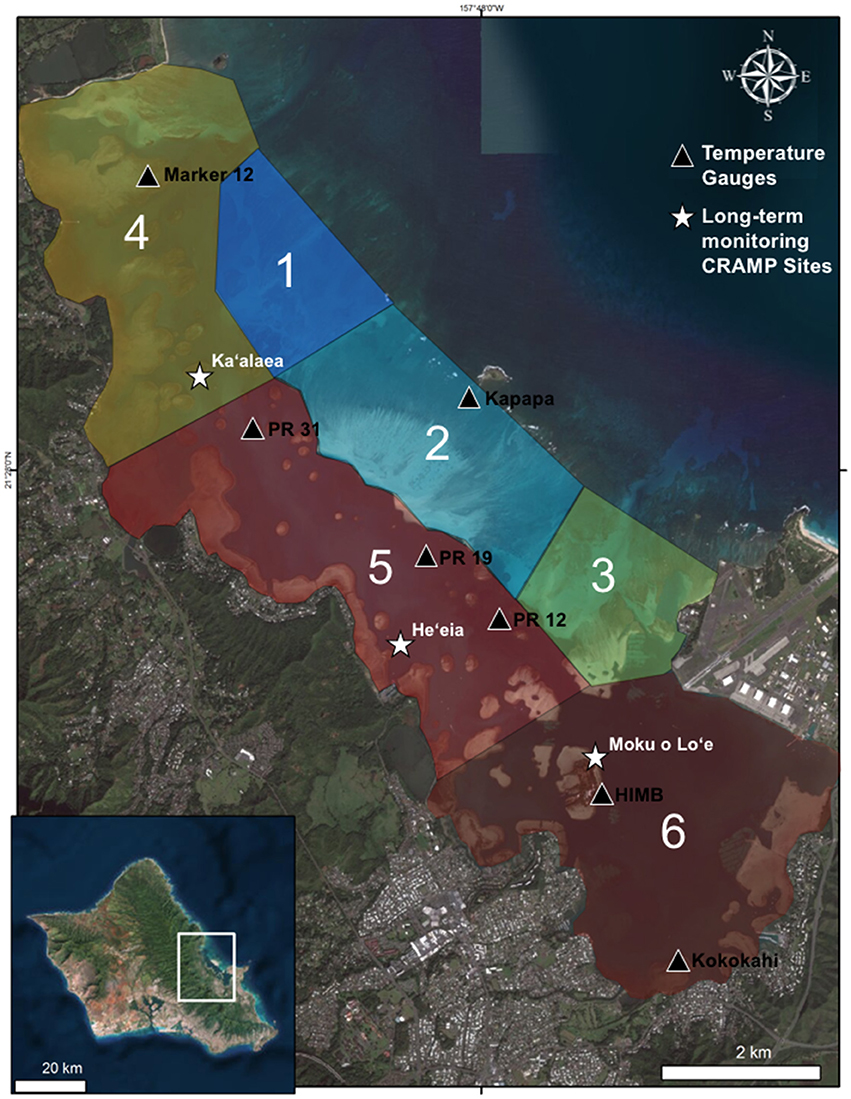
Figure 1. Map of Kāne‘ohe Bay, Hawai‘i with flow regimes (1–6) defined by Lowe et al. (2009) (Table 1), in situ temperature loggers (triangles), and long-term Coral Reef Assessment and Monitoring (CRAMP) sites (stars). Photo credit: Quickbird Digital Globe.
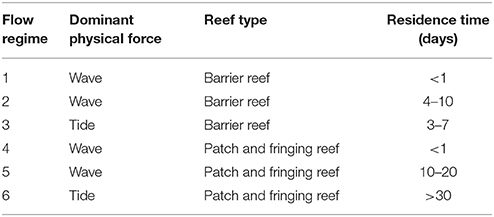
Table 1. Descriptions of residency times and flow regimes in Kāne‘ohe Bay, Hawai‘i by Lowe et al. (2009).
Meteorological Data
Meteorological data [i.e., photosynthetically active radiation (PAR), ultraviolet radiation, seawater temperature, precipitation, and wind strength and direction] were monitored continuously throughout the bleaching events (1996, 2014, 2015) at an automated weather station located on Moku o Lo‘e at the Hawai‘i Institute of Marine Biology (HIMB) (http://www.pacioos.hawaii.edu/weather/obs-mokuoloe/) (Figure 1). To investigate the influence of the environmental drivers on bleaching variability, meteorological data collected between Aug 1 and Nov 1 were compared across bleaching years (1996, 2014, and 2015).
Due to the unique bathymetry of the bay, water circulation and residency times vary between ~1 day in north bay to up to 1–2 months in south bay (Lowe et al., 2009). Continuous in situ water temperatures were recorded at 1–2 m depth at seven locations characterizing four flow regimes during the 2015 bleaching event (Table 1). Water temperatures were recorded in the following flow zones: Zone 2, on reef flat near Kapapa Island; Zone 4, on northern fringing reef near Channel Marker 12; Zone 5, on patch reefs 12, 19, 31; Zone 6, at three locations including fore reef slope of the HIMB reef adjacent to weather station, and on the reef flat of the south bay fringing reef near Kokokahi pier (Figure 1). Temperature at the HIMB weather station was recorded using a recording thermistor thermometer (Cole-Parmer Instrument Co., Vernon Hills, Illinois, USA). All other in situ water temperature measurements (i.e., Kapapa isle, Marker 12, PR 12, PR 19, PR 31, and Kokokahi) were recorded at 15-min intervals using replicate HOBO Water Temperature Pro v2 Data Loggers (Onset, MA, USA). All temperature loggers were placed in areas of well-developed coral communities in 1–2 m of water. The loggers were secured in 6″ × 12″ hand-poured concrete structures to mimic the benthic substrate, provide weight, and protect loggers from solar irradiance and associated heating (Bahr et al., 2016b).
Differences in cumulative heating between bleaching years (1996, 2014, and 2015) were calculated by adding number of degrees above optimal mid-day temperatures of 27°C (defined by Jokiel and Coles, 1990) using seawater temperatures from the HIMB weather station. Daily mid-day temperatures above 27°C were summed to determine the duration and extent of cumulative heating up to the onset of bleaching during the three documented bleaching events.
Statistical Analysis
To characterize localized temperature regimes during the 2015 bleaching event, in situ seawater temperatures (mean mid-day temperatures 11:00–14:00) during the peak (above 27°C) of the 2015 bleaching event (1 Aug-25 Sept 2015) were analyzed using a one-way ANOVA. Post-hoc Tukey tests were used to determine which sites differed from the other.
Bay-wide assessment surveys from 1996, 2014, and 2015 were compiled to investigate the influence of environmental drivers on bleaching prevalence and severity in Kāne‘ohe Bay.
A Generalized Linear Mixed-effects Model (GLMM) was conducted to investigate bleaching prevalence (% live coral) across bleaching years using October bleaching surveys. Year (i.e., 1996, 2014, 2015), flow regime, and total coral cover (%) were included as predictor variables. The GLMM allows and accounts for analysis assuming unequal group variance and analysis of longitudinal data with unequal time points and missing time points. Collinearity between candidate predictor variables were assessed with Pearson correlation coefficients (<0.7) and variance inflation factors (<5). GPS location (i.e., latitude and longitude) of each surveyed area was included in the GLMM as a repeated covariance spatial isotropic spherical structure to account for spatial autocorrelation. A Principal Component Analysis was used to identify the environmental factor drove coral bleaching prevalence across bleaching years.
Average coral mortality (including zeros) by survey month during each bleaching event was compiled and analyzed using a three-way ANOVA with fixed factors of survey month, bleaching event year, flow regime, and the interaction between year and flow regime. Tukey post-hoc analyses were used to investigate differences across factors. Average daily mid-day temperatures (°C) (2 m depth), daily wind (mph), cumulative daily Photosynthetically Active Radiation (PAR) (μmol photons m2), and log transformed total daily rainfall (mm) were analyzed using a GLMM by year with day as a random effect. All meteorological variables were recorded at the HIMB weather station on Moku o Lo‘e.
To understand the implications of the high temperature events, comparisons of changes in coral cover at long-term CRAMP sites were analyzed using a two-way ANOVA with fixed factors of site and year and their interaction. Preplanned contrasts were used to analyze changes in coral cover before bleaching (i.e., 2012) and after (i.e., 2016). All statistical analyses and descriptive statistics were conducted using JMP Pro 12 (SAS Institute Inc., USA).
Results
2015 Bleaching Event
Mean mid-day seawater temperatures varied spatially within Kāne‘ohe Bay during the peak of the bleaching event (1 Aug-25 Sept 2015) [One-way ANOVA; F(6, 391) = 32.3150; p < 0.0001]. Temperatures were at least 0.60°C warmer in the sluggish waters in south bay (Kokokahi Pier; 29.78 ± 0.11°C) compared other sites. Lower water temperatures were recorded in central bay (patch reef 19, 28.66 ± 0.08°C; patch reef 12, 28.61 ± 0.07°C), Moku o Lo‘e (28.49 ± 0.08°C), and the barrier reef site, Kapapa (28.40 ± 0.09°C; Figure 2).
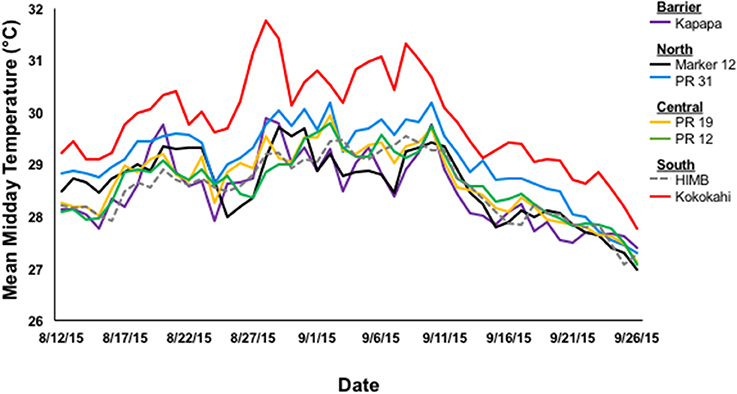
Figure 2. Mean mid-day temperature (°C) by location in Kāne‘ohe Bay, HI during the 2015 bleaching event collected at 15 min intervals with Onset ProV2 HOBO Temperature loggers.
Bay-wide coral surveys in Oct 2015 determined 46% of surveyed corals had signs of bleaching and paling and 13% showed recent mortality due to bleaching. Detailed surveys by location revealed the highest levels of bleaching and paling in the north bay (70%) with 18% mortality, while the highest mortality was observed in the south bay (28%) accompanied by 60% bleaching and paling. The lowest mortality (4%) and bleaching/paling (38%) levels were observed in the central bay. On the barrier reef where coral cover is low (5–10%), 50% of the surveyed corals revealed signs of bleaching or paling and recent bleaching mortality was estimated at 21% (Figure 3d).
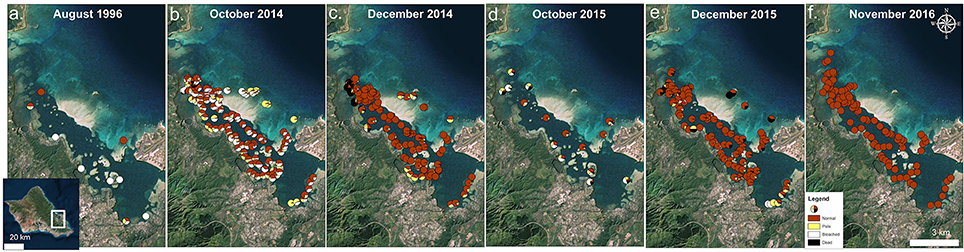
Figure 3. Times series of bay-wide surveys on 31 August 1996 (a), 14 October 2014 (b), 1 December 2014 (c), 16 October 2015 (d), 8 December 2015 (e), and 11 November 2016 (f). Proportion of surveyed corals are shown as normal (red), pale (yellow), bleached (white), and dead (black). Survey data from 1996 (Jokiel and Brown, 2004) and 2014 (Bahr et al., 2015a) bleaching events are used with permission from authors. Photo credit: Quickbird Digital Globe.
By December 2015, 2 months following the initial survey, high levels of recovery (~81% normal pigmentation) were observed (Figure 3e). Nearly 9% of surveyed corals in the bay exhibited signs of paling or bleaching, and recent mortality was estimated at 8%. A large proportion of coral mortality was attributed to the barrier reef (~56%). Recovery was delayed in the south bay where 25% of the surveyed corals remained bleached and/or pale in pigmentation. The highest recovery and lowest mortality rates (<2%) were observed in central bay. Normal pigmentation levels had returned by Nov 2016 (>99%) (Figure 3f).
Total live coral cover of surveyed area in Kāne‘ohe Bay (mean ± SE) was estimated at 59.17 ± 5.28% in Oct 2015. Higher total live coral cover was estimated during recovery surveys in December 2015 (68.95 ± 2.20%) and decreased again in November 2016 surveys (54.35 ± 1.98%; Supplementary Table 1).
Comparison of Documented Bleaching Events in Kāne‘ohe Bay, HI
Results of the 1996 and 2014 bleaching events have been previously documented in Jokiel and Brown (2004) and Bahr et al. (2015a). These data were compiled with the 2015 surveys to investigate differences in bleaching prevalence and mortality across documented events.
Bleaching Prevalence
Bleaching prevalence varied by year (p = 0.0002) and by flow regimes (p = 0.0003) (Table 2). Bleaching prevalence was ~27% higher in 1996 (62.00% ± 15.42) in comparison to 2014 (45.28% ± 1.91; p = 0.0138) even though bleaching was restricted to the inner bay and fringing reef in 1996, while bleaching extended throughout the bay to the barrier reef in 2014. Two consecutive years of bleaching revealed bleaching levels to be 15% lower in 2015 than in 2014 (Figure 4) (Supplementary Table 1). The highest bleaching prevalence was observed in zone 5 (48.93 ± 2.36%), zone 6 (45.24 ± 4.49%), and zone 4 (44.33 ± 4.82%). Bleaching prevalence was lower in areas more influenced by oceanic waters (zone 1, 29.0 ± 11.87; zone 2, 29.0 ± 9.83%; and zone 3, 17.5 ± 4.55%) across years (Figure 4B). Bleaching prevalence did not vary by total coral cover (p = 0.1429; Table 2).
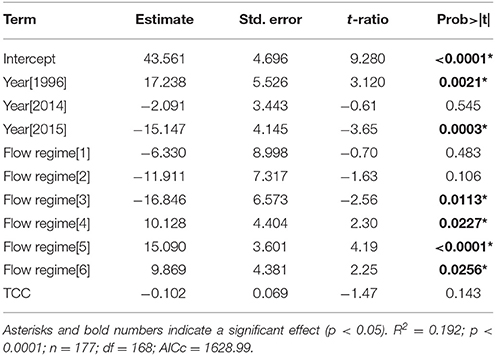
Table 2. Model output (GLMM) of bleaching prevalence (% live coral cover) (October surveys only) by year (i.e., 1996, 2014, 2015), flow regimes (i.e., 1–6), and total coral cover (TCC).
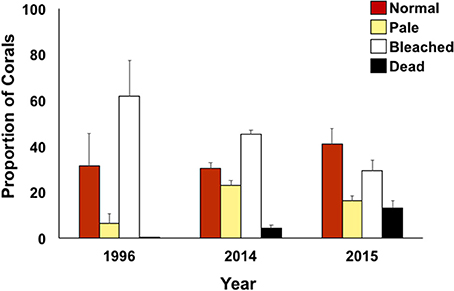
Figure 4. Coral condition (proportion of surveyed area) defined as normal (red), pale (yellow), bleached (white), and dead (black) for bay-wide bleaching assessment surveys (October only) during documented bleaching events.
Coral Mortality
Average coral mortality increased during the documented bleaching events (p < 0.0001) with high mean mortality in 2015 (16.07 ± 1.53%), less in 2014 (5.58 ± 1.42), and lowest in 1996 (<1%) (Supplementary Table 1; Table 3). Coral mortality varied by flow regime within years (year*flow, p = 0.0005). High mortality levels were observed in 2014 in flow regime 4 (28.81%) due to a freshwater flooding event that interacted synergistically with the high temperature event (Bahr et al., 2015a). Mortality during 2015 was similar across all flow regimes with the highest in flow regime 2 (39.16 ± 4.91%) (Table 3; Figure 5). Cumulative mortality (sum of both October and December surveys) was lowest in 1996 (<1%) and highest in 2015 (21.66 5 ± 5.32%).
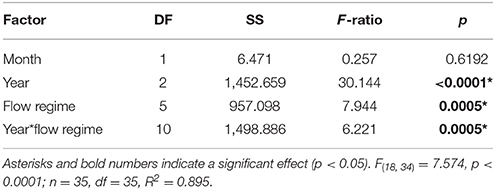
Table 3. Three-way ANOVA output of coral mortality by survey month (December and October surveys), bleaching event year (1996, 2014, and 2015), flow regime (as defined by Lowe et al., 2009), and the interaction of flow and year.
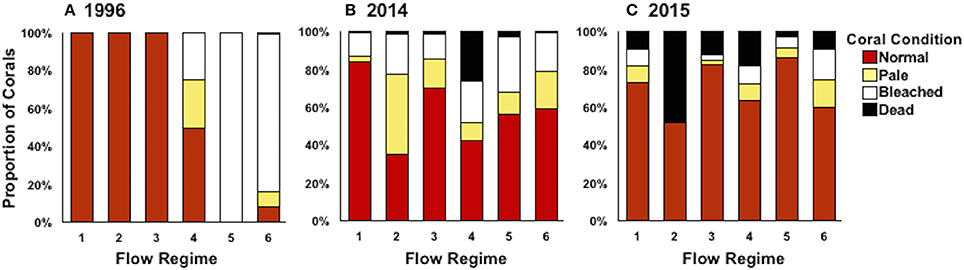
Figure 5. Coral condition (proportion of surveyed area) defined as normal (red), pale (yellow), bleached (white), and dead (black) by flow regime in 1996 (A), 2014 (B), and 2015 (C). Coral condition was averaged across survey months (October and December) for bay-wide bleaching surveys.
Environmental Factors
Further investigation of environmental drivers (i.e., temperature, irradiance, wind, and precipitation) during the height of bleaching (1 Aug-1 Nov) revealed significant differences between bleaching years. Average daily mid-day temperatures recorded at 2 m at the HIMB weather station varied between bleaching events [GLMM; F(2, 184) = 7.62; R2 = 0.31; p = 0.0007]. 1996 had significantly higher temperatures compared to the 2015 event (Figure 6A). Cumulative daily solar (PAR) input was higher in 2014 than in 2015 [Mixed Model; F(2, 184) = 4.28; R2 = 0.20; p = 0.0153]. Similar levels of PAR were observed in 1996 (8,019.59 ± 122.69 μmol photons m2) compared to the 2014 (8,409.38 ± 214.92 μmol photons m2) and 2015 (7,616.33 ± 247.38 μmol photons m2) events (Figure 6B). Average daily wind was similar among the three documented bleaching events [GLMM; F(2, 184) = 1.17; R2 = 0.25; p = 0.3116] (Figure 6C). Total daily rainfall (mm) was higher in 2015 and 2014 compared to 1996 [GLMM; F(2, 184) = 88.53; R2 = 0.61; p < 0.0001] (Figure 6D). Multivariate analyses reveal significant correlations between bleaching and total daily PAR (r = 0.77), average daily wind (r = −0.56), and temperature (r = 0.77). A Principal Component Analysis reveals average mid-day temperature was the most representative variable driving coral bleaching across years (75.6% variance explained).
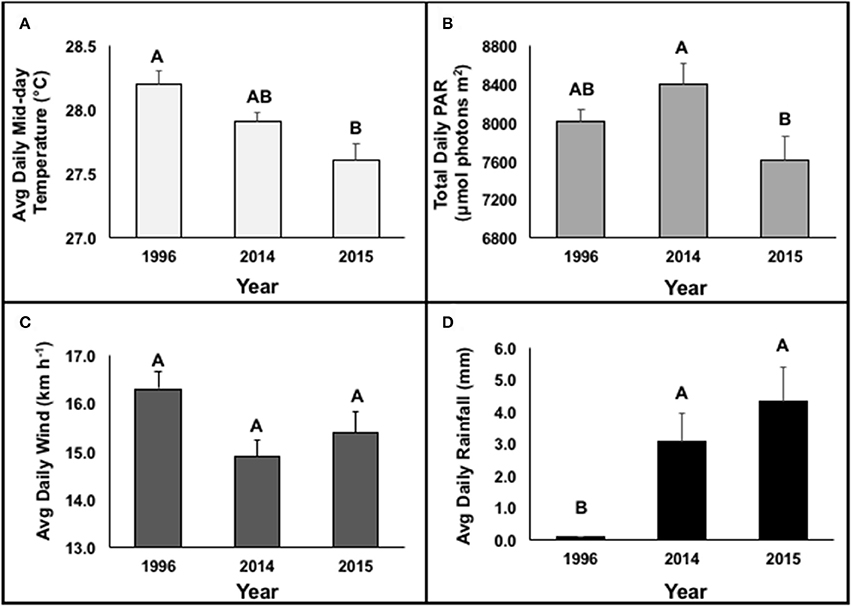
Figure 6. Environmental characteristics of average daily mid-day temperature (°C) (A), total daily PAR (μmol photons m−2) (B), average daily wind (km h−1) (C) and average daily rainfall (mm) (D) between 1 Aug and 1 Nov during documented bleaching events (1996, 2014, and 2015). Levels not connected by the same letter are significantly different at p < 0.05. Data was obtained from Hawai‘i Institute of Marine Biology Weather Station (http://www.pacioos.hawaii.edu/weather/obs-mokuoloe).
Long-Term Coral Reef Assessment and Monitoring (CRAMP) Sites
Long-term CRAMP sites were surveyed before (i.e., 2012) and following (i.e., 2016) consecutive bleaching events. In 2016, the highest coral cover was observed in central bay (He‘eia, 60.66 ± 3.61%) and north bay (Ka‘alaea, 49.13 ± 13.99%). The south bay site, Moku o Lo‘e, has significantly lower coral cover compared to the other shallow CRAMP sites in the bay (28.35 ± 2.53%; Figure 7A). Over the 4-year period (2012–2016), significant decline in coral cover occurred at shallow (2 m) sites in central bay, He‘eia (−19.7%; p = 0.0015), and south bay, Moku o Lo‘e (−42.2%; p < 0.0001; Figure 6). Coral cover did not significantly change over this 4 year period at the shallow north bay site (Ka‘alaea, p = 0.2640) [Two-way ANOVA; F(11, 119) = 55.64; p < 0.0001] (Figure 7). Total coral cover was statistically similar among all CRAMP deep sites (8 m) in 2016 (Ka‘alaea = 6.45 ± 4.15%; He‘eia = 10.53 ± 2.06%; Moku o Lo‘e = 9.67 ± 2.34%) [One-way ANOVA; F(2, 29) = 1.2131; p = 0.3129] (Figure 7B) and did not change in response to the consecutive bleaching events [Two-way ANOVA; F(11, 119) = 55.64; p < 0.0001] (Figure 7).
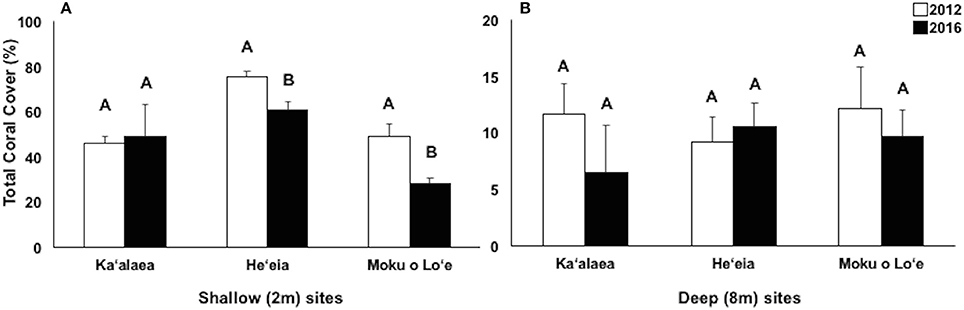
Figure 7. Changes in total coral cover over time at long-term Coral Reef Assessment and Monitoring (CRAMP) sites at shallow (2 m, A) and deep (8 m, B) in North bay, Ka‘alaea; Central bay: He‘eia; and South bay: Moku o Lo‘e. Different letters within site indicate statistically significant differences between years at p < 0.05.
Discussion
The occurrence and severity of mass coral bleaching has increased dramatically over the last two decades with almost every reef region in the world suffering extensive bleaching and mortality (Hughes et al., 2017). The goals of this research were to (1) describe and compare the severity, extent, and spatial variability of bleaching during documented bleaching events and (2) examine recovery at long-term monitoring sites to aid in understanding the resiliency of Kāne‘ohe Bay, HI.
The first coral bleaching event in Kāne‘ohe Bay occurred during 1996 where high levels of bleaching but little mortality occurred. This event was followed by more severe events in 2014 and 2015. Patterns of bleaching and mortality in the 1996 event did not continue during the 2014 event (Figure 3). Likewise, the patterns observed in 2015 diverged from the previous two events, with higher levels of coral mortality. Our data suggests that the unexpected trends of bleaching and mortality within and across documented bleaching events were due to several factors including: (1) Localized patterns of water circulation and heating within bleaching events (Figure 2), (2) Variation in irradiance due to different levels of cloud cover and temporal variation in turbidity (Figure 6B), (3) Differences due to seasonal timing and duration of the warm water events (Figure 8), and (4) Influence of localized fresh water flood events (2014) interacting with temperature induced bleaching (Figure 3B).
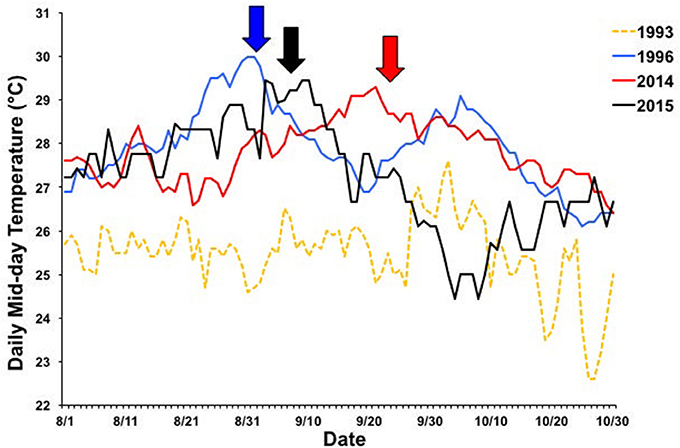
Figure 8. Seasonal timing of 1996 (blue), 2014 (red), and 2015 (black) bleaching events. Daily mid-day (11:00–14:00) temperatures between 1 Aug and 1 Nov are shown for each year. Temperature data from 1993 is included as a non-bleaching reference year (yellow, dashed line). Arrows indicate when bleaching began. Temperature data collected from Hawai‘i Institute of Marine Biology Weather Station (http://www.pacioos.hawaii.edu/weather/obs-mokuoloe).
Temperature (seasonal timing and duration) is the chief environmental factor driving coral bleaching extent and severity. During the 2015 bleaching, reefs across the Hawaiian Islands experienced different Degree Heating Weeks (DHW). Among the highest were on the west side of Hawai‘i Island, where surveyed corals experienced high levels of bleaching (up to 86%) and mortality (50%) after 18 DHW (Kramer et al., 2016). Conversely, after 12 DHW Kāne‘ohe Bay had 22% mortality, while the Hanauma Bay Nature Preserve (HBNP) on O‘ahu experienced high levels of bleaching (47%) and mortality (9.8%) after 10 DHW (Rodgers et al., 2017).
The 2015 Bleaching Event
Results of the 2015 bleaching event showed the influence of water circulation and localized heating on coral bleaching and mortality patterns inside Kāne‘ohe Bay. Historically, circulation patterns in the bay have been described as the primary factor controlling distribution of coral species (Smith et al., 1981; Bahr et al., 2015b). Oceanic waters enter the bay over the barrier reef circulating cool water to adjacent patch reefs in central bay (Jokiel, 1991; Bahr et al., 2015b). The reef areas influenced by the movement of this cool oceanic water and low residency times had the lowest bleaching and mortality and highest recovery during the 2015 event. Net transport of water out of the bay occurs through the NW channel and the central Sampan channel (Figure 1). Although north bay is also characterized by high circulation, movement of warm water through the NW channel exacerbated bleaching (70%) and mortality (18%) on north bay reefs. These reefs have consistently had among the highest bleaching levels during the previous documented events (Figure 3). South bay has flow patterns anomalous to the rest of the bay with high residency times (~8 to > 30 days) and heavy riverine influence (Table 1). The high residency time and restricted circulation patterns facilitated localized heating (+0.65°C) in south bay and delayed recovery with high mortality rates (Figures 2, 3F). Although temperature was determined to be the driving factor of bleaching, reduced light penetration via wind-induced mixing and resuspension of sediments into the water column may explain lower than expected bleaching prevalence in south bay (Smith et al., 1973).
Comparison of Documented Bleaching Events in Kāne‘ohe Bay, Hawai‘i
Different patterns of warming (i.e., timing and duration) greatly influenced severity and extent of bleaching in Kāne‘ohe Bay across documented events (Figures 3, 8). Warm water approached the Hawaiian Islands from the north in 2014, while in 2015 warm water advanced from the south resulting in twice the duration of elevated temperatures as previous events with a maximum 6 DHW in 1996, 5 DHW in 2014, and 12 DHW in 2015 for Kāne‘ohe Bay (Table 4). Seasonal timing also varied across documented events. Elevated seawater temperature began in late August in 1996 and in 2015 and in late September in 2014 (Figure 8). Once average water temperatures exceeded 27°C, initial signs of bleaching occurred after 28 days in 1996 (cumulative heating of 32°C), 62 days in 2014 (cumulative heating of 44°C), and just after 24 days in 2015 with the lowest cumulative heating (14°C) (Figure 9). Therefore, bleaching onset in 2015 occurred earlier (24 days) under lower cumulative heat stress (14°C). During the 1996 event, bleaching was restricted to the fringing and patch reefs. Conversely, bleaching during the 2014 and 2015 events extended throughout the bay onto the barrier reef. The severity of the high temperature event was lowest in 1996, where little to no mortality was recorded (Jokiel and Brown, 2004). In 2014, a freshwater kill event a month prior to the high temperature event, contributed significantly to observed mortality (nearly 60%). Areas not impacted by the freshwater flooding event experienced little to no mortality (<1%) (Bahr et al., 2015a; Figure 3b). The largest cumulative mortality (21%) due to high temperature was recorded in the most recent 2015 bleaching event in which warming began sooner, and corals bleached under less cumulative heating and lower irradiance regimes but experienced prolonged high SSTs at 12 DHW.
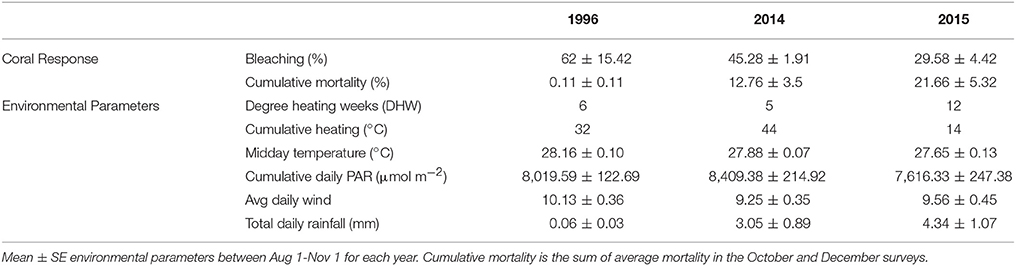
Table 4. Summary comparision of coral response and enviornmnental parameters for all documented bleaching events in Kāne‘ohe, O‘ahu, Hawai‘i.
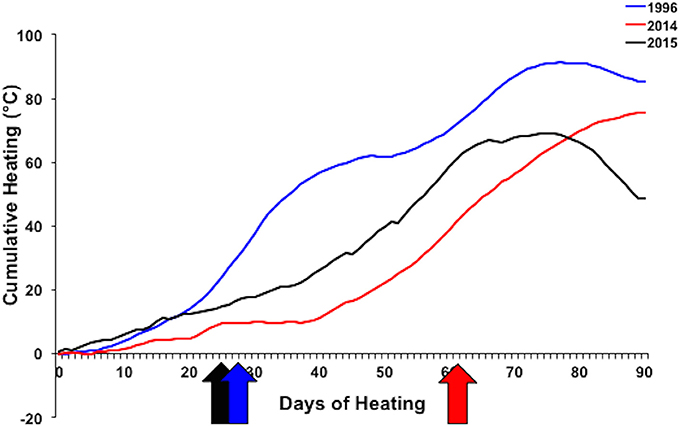
Figure 9. Cumulative heating index for 1996 (blue), 2014 (red), and 2015 (black) bleaching events. Arrows indicate when bleaching began. Temperature data collected from Hawai‘i Institute of Marine Biology Weather Station (http://www.pacioos.hawaii.edu/weather/obs-mokuoloe).
Changes at Long-Term CRAMP Sites
Our long-term CRAMP sites provide a record of change in coral cover across the three bleaching events that provides supporting evidence of the validity of our mortality results within Kāne‘ohe Bay (Rodgers et al., 2015). Significant increases in coral cover were reported at Moku o Lo‘e shallow (south), He‘eia shallow (central), and Ka‘alaea deep (north) between 1999 and 2012. During the period of the more severe bleaching events in 2014 and 2015, significant declines in coral cover were reported at the shallow site in south bay (−42%) and the shallow site in central bay (−20%). Conversely, coral cover at the shallow north bay site (Ka‘alaea) and all three deeper sites (8 m) remained relatively stable. This is in concert with our bay-wide coral bleaching surveys conducted in 2014 and 2015. Additionally, bleaching prevalence was observed to decrease in certain flow regimes (4–6) across bleaching events, which may suggest some acclimation or reef resilience to bleaching in these area, but possible increased susceptibility to mortality. The large mortality coral observed in 2014 and 2015 have contributed to the decline in coral cover at these long-term monitoring sites.
CRAMP surveys conducted in 2012 revealed overall coral cover and diversity in Hawai‘i have remained relatively stable since the initial survey in 1998 (Rodgers et al., 2015). During this period, coral cover on reefs in the Caribbean and other regions declined by as much as 50% due to climate change related bleaching events, increased storm damage and lowered coral growth (Wilkinson, 2004). Moreover, the recent longest, most widespread, and possibly the most damaging coral bleaching event on record had a significant impact on Australia's Great Barrier Reef (Hughes et al., 2017). While some reef areas in Kāne‘ohe Bay remained relatively un-impacted by the consecutive bleaching events.
Offshore sea surface water temperatures in Hawai‘i have increased by approximately 1.15°C over the past six decades (Bahr et al., 2015a). Since the establishment of bleaching thresholds in 1974 (Jokiel and Coles, 1977), there has been a regional increase in temperature of over 0.8°C with three bleaching events documented in Kāne‘ohe Bay (1996, 2014, 2015). Reef recovery following disturbance has been documented at other CRAMP sites in the state (Rodgers et al., 2015); however, with projected increase in severity and frequency of bleaching events, we may see more significant declines in coral cover in the near future.
Recovery and resilience after these major disturbances not only depends on the prevailing environmental conditions but also the coral species affected. While Kāne‘ohe Bay holds some of the highest coral cover (>90%) in the Main Hawaiian Islands, the majority of its reefs are comprised of two reef building species: Porites compressa and Montipora capitata (Bahr et al., 2015b). Previous experimental work has determined the endemic coral, P. compressa, to be the most susceptible to future climate change scenarios with the largest decreases in calcification and high partial mortality (Bahr et al., 2016c). A main factor in M. capitata's resilience is its ability to increase heterotrophic feeding under high temperature conditions meeting all dietary requirements without their symbiotic zooxanthellae (Grottoli et al., 2006; Rodrigues and Grottoli, 2007; Hughes and Grottoli, 2013). Cryptic species (Fungia scutaria and Leptastrea purpurea) were observed to be more resilient to climate change. These species-specific responses correlate with the bleaching susceptibility hierarchy described during the bleaching events (Jokiel and Brown, 2004; Bahr et al., 2015a). Shifts in optimal growth rates have been documented and estimated in the second dominant species, M. capitata. By mid-century, growth rates are expected to decline by half with further reductions in growth at the end of the century with those corals exposed to high irradiance levels (e.g., reef flats) expected to have negative growth (Bahr et al., 2016a). With these reductions, shifts in seasonal growth patterns are expected. Currently, the highest growth rates occur in the late summer (Jokiel and Coles, 1977). As we progress to mid-century, maximum growth rates will shift to spring, and at the end of the century to winter due to changes in water temperature projections (Bahr et al., 2015a). The primary factor controlling coral populations in the future will be coral mortality caused by short-term high temperature excursions (i.e., bleaching events); however, localized environmental factors as well as differences in species composition may reveal resilient coral communities.
Conclusion
Results of this study reveal duration and magnitude of heating are the primary factors controlling the severity and extent of bleaching in Kāne‘ohe Bay. Circulation patterns in the bay facilitate localized heating and influence spatial bleaching and its associated mortality. Sectors within the bay that were influenced by cool oceanic waters had low coral bleaching and mortality and high recovery rates. Conversely, restricted water movement facilitated localized heating and therefore increased bleaching and associated mortality. Other localized environmental factors that can influence water temperature (i.e., irradiance, turbidity, rainfall) may also reduce or amplify bleaching and explain spatial variations in bleaching and mortality. Long-term monitoring sites revealed significant declines in coral cover at some sites while others recovered from the consecutive bleaching events. Having an established network of long-term monitoring sites with associated temperature loggers allows for a reliable baseline to evaluate both natural and anthropogenic factors that contribute to the stability, decline and/or recovery of coral reefs and direct targeted management actions. Further, understanding of the driving factors that influence spatial variability in coral bleaching and mortality can assist managers in identifying areas to focus efforts and resources.
Author Contributions
KB conceived and designed the experiments and surveys, performed the surveys, analyzed the data, wrote the paper, prepared figures and tables. KR performed and helped design the surveys, analyzed the data, reviewed drafts of the paper. PJ conceived and designed the experiments, provide intellectual insights, and reviewed drafts of the paper.
Conflict of Interest Statement
The authors declare that the research was conducted in the absence of any commercial or financial relationships that could be construed as a potential conflict of interest.
Acknowledgments
We would like to thank the Hawaii Division of Aquatic Resources, B. Neilson and D. Lager, for their resources and collaboration during the bleaching events. Coral health assessment surveys and temperature logger placement was accomplished with the assistance of members of the Coral Reef Ecology Lab at the Hawai‘i Institute of Marine Biology. We would like the thank, the late Dr. PJ, for his guidance and extensive knowledge in coral reef ecology and climate change research. Without him, this research would not be possible.
We also thank two reviewers. We appreciate the time that each has invested to provide the review, and these comments have helped us improve the manuscript significantly.
This is the Hawai‘i Institute of Marine Biology (HIMB) contribution #1708 and the School of Ocean and Earth Science and Technology (SOEST) contribution #10278.
Supplementary Material
The Supplementary Material for this article can be found online at: https://www.frontiersin.org/articles/10.3389/fmars.2017.00398/full#supplementary-material
References
Aronson, R., Precht, W., Toscano, M., and Koltes, K. (2002). The 1998 bleaching event and its aftermath on a coral reef in Belize. Mar. Biol. 141, 435–447. doi: 10.1007/s00227-002-0842-5
Bahr, K. D., Jokiel, P. L., and Ku‘ulei, S. R. (2016a). Seasonal and annual calcification rates of the Hawaiian reef coral, Montipora capitata, under present and future climate change scenarios. ICES J. Mar. Sci. 74, 1083–1091. doi: 10.1093/icesjms/fsw078
Bahr, K. D., Jokiel, P. L., and Rodgers, K. S. (2015a). The 2014 coral bleaching and freshwater flood events in Kāne‘ohe Bay, Hawai‘i. PeerJ 3:e1136. doi: 10.7717/peerj.1136
Bahr, K. D., Jokiel, P. L., and Rodgers, K. S. (2016b). Influence of solar irradiance on underwater temperature recorded by temperature loggers on coral reefs. Limnol. Oceanogr. Methods 14, 338–342. doi: 10.1002/lom3.10093
Bahr, K. D., Jokiel, P. L., and Rodgers, K. S. (2016c). Relative sensitivity of five Hawaiian coral species to high temperature under high-pCO2 conditions. Coral Reefs 35, 729–738. doi: 10.1007/s00338-016-1405-4
Bahr, K. D., Jokiel, P. L., and Toonen, R. J. (2015b). The unnatural history of Kāne‘ohe Bay: coral reef resilience in the face of centuries of anthropogenic impacts. PeerJ 3:e950. doi: 10.7717/peerj.950
Baker, A. C., Glynn, P. W., and Riegl, B. (2008). Climate change and coral reef bleaching: an ecological assessment of long-term impacts, recovery trends and future outlook. Estuar. Coast. Shelf Sci. 80, 435–471. doi: 10.1016/j.ecss.2008.09.003
Bird, C. (2001). PhotoGrid: Ecological Analysis of Digital Photographs (Downloadable On-line Software). University of Hawai‘i Mānoa, Honolulu, HI.
Brown, E. K., Cox, E., Jokiel, P. L., Rodgers, S. K., Smith, W. R., Tissot, B. N., et al. (2004). Development of benthic sampling methods for the Coral Reef Assessment and Monitoring Program (CRAMP) in Hawai‘i. Pac. Sci. 58, 145–158. doi: 10.1353/psc.2004.0013
Burge, C. A., Mark Eakin, C., Friedman, C. S., Froelich, B., Hershberger, P. K., Hofmann, E. E., et al. (2014). Climate change influences on marine infectious diseases: implications for management and society. Annu. Rev. Mar. Sci. 6, 249–277. doi: 10.1146/annurev-marine-010213-135029
De'ath, G., Fabricius, K. E., Sweatman, H., and Puotinen, M. (2012). The 27–year decline of coral cover on the Great Barrier Reef and its causes. Proc. Natl. Acad. Sci. U.S.A. 109, 17995–17999. doi: 10.1073/pnas.1208909109
Eakin, C., Liu, G., Gomez, A., De la Cour, J., Heron, S., Skirving, W., et al. (2016). Global coral bleaching 2014–2017: status and an appeal for observations. Reef Encounter 31, 20–26.
Gardner, T. A., Cote, I. M., Gill, J. A., Grant, A., and Watkinson, A. R. (2005). Hurricanes and Caribbean coral reefs: impacts, recovery patterns, and role in long-term decline. Ecology 86, 174–184. doi: 10.1890/04-0141
Grottoli, A. G., Rodrigues, L. J., and Palardy, J. E. (2006). Heterotrophic plasticity and resilience in bleached corals. Nature 440, 1186–1189. doi: 10.1038/nature04565
Heron, S. F., Maynard, J. A., and Ruben van Hooidonk, C. (2016). Warming trends and bleaching stress of the world's coral reefs 1985–2012. Sci. Rep. 6:38402. doi: 10.1038/srep38402
Hoeke, R. K., Jokiel, P. L., Buddemeier, R. W., and Brainard, R. E. (2009). Projected changes to growth and mortality of Hawaiian corals over the next 100 years. PLoS ONE 6:e18038. doi: 10.1371/journal.pone.0018038
Hughes, A. D., and Grottoli, A. G. (2013). Heterotrophic compensation: a possible mechanism for resilience of coral reefs to global warming or a sign of prolonged stress? PLoS ONE 8:e81172. doi: 10.1371/journal.pone.0081172
Hughes, T. P., Kerry, J. T., Álvarez-Noriega, M., Álvarez-Romero, J. G., Anderson, K. D., Baird, A. H., et al. (2017). Global warming and recurrent mass bleaching of corals. Nature 543, 373–377. doi: 10.1038/nature21707
Jokiel, P. L. (1991). Jokiel's Illustrated Scientific Guide to Kaneohe Bay. Hawaii Institute of Marine Biology. doi: 10.13140/2.1.3051.9360
Jokiel, P. L. (2004). “Temperature stress and coral bleaching,” in Coral Health and Disease, eds E. Rosenberg and Y. Loya (Berlin; Heidelberg: Springer), 401–425.
Jokiel, P. L., and Brown, E. K. (2004). Global warming, regional trends and inshore environmental conditions influence coral bleaching in Hawaii. Glob. Change Biol. 10, 1627–1641. doi: 10.1111/j.1365-2486.2004.00836.x
Jokiel, P. L., and Coles, S. L. (1974). Effects of heated effluent on hermatypic corals at Kahe Point, Oahu. Pac. Sci. 28, 1–18.
Jokiel, P. L., and Coles, S. L. (1977). Effects of temperature on the mortality and growth of Hawaiian reef corals. Mar. Biol. 43, 201–208. doi: 10.1007/BF00402312
Jokiel, P. L., and Coles, S. L. (1990). Response of Hawaiian and other Indo-Pacific reef corals to elevated temperature. Coral Reefs 8, 155–162.
Jokiel, P. L., Rodgers, K. S., Brown, E. K., Kenyon, J. C., Aeby, G., Smith, W. R., et al. (2015). Comparison of methods used to estimate coral cover in the Hawaiian Islands. PeerJ 3:e954. doi: 10.7717/peerj.954
Jones, R. J. (2008). Coral bleaching, bleaching-induced mortality, and the adaptive significance of the bleaching response. Mar. Biol. 154, 65–80. doi: 10.1007/s00227-007-0900-0
Kramer, K., Cotton, S., Lamson, M., and Walsh, W. (2016). “Bleaching and catastrophic mortality of reef-building corals along west Hawai‘i island: findings and future directions,” in Proceedings of the 13th International Coral Reef Symposium (Honolulu).
Lowe, R. J., Falter, J. L., Monismith, S. G., and Atkinson, M. J. (2009). Wave-driven circulation of a coastal reef–lagoon system. J. Phys. Oceanogr. 39, 869–889. doi: 10.1175/2008JPO3958.1
Miller, J., Muller, E., Rogers, C., Waara, R., Atkinson, A., Whelan, K., et al. (2009). Coral disease following massive bleaching in 2005 causes 60% decline in coral cover on reefs in the US Virgin Islands. Coral Reefs 28:925. doi: 10.1007/s00338-009-0531-7
Munday, P., Kingsford, M., O'callaghan, M., and Donelson, J. (2008). Elevated temperature restricts growth potential of the coral reef fish Acanthochromis polyacanthus. Coral Reefs 27, 927–931. doi: 10.1007/s00338-008-0393-4
Mydlarz, L. D., Couch, C. S., Weil, E., Smith, G., and Harvell, C. D. (2009). Immune defenses of healthy, bleached and diseased Montastraea faveolata during a natural bleaching event. Dis. Aquat. Org. 87, 67–78. doi: 10.3354/dao02088
Norström, A. V., Nyström, M., Lokrantz, J., and Folke, C. (2009). Alternative states on coral reefs: beyond coral–macroalgal phase shifts. Mar. Ecol. Prog. Ser. 376, 295–306. doi: 10.3354/meps07815
Rodgers, K. S., Bahr, K. D., Jokiel, P. L., and Richards Donà, A. (2017). Patterns of bleaching and mortality following widespread warming events in 2014 and 2015 at the Hanauma Bay Nature Preserve, Hawai‘i. PeerJ 5:e3355. doi: 10.7717/peerj.3355
Rodgers, K., Jokiel, P., Brown, E., Hau, S., and Sparks, R. (2015). Over a decade of change in spatial and temporal dynamics of Hawaiian coral reef communities. Pac. Sci. 69:1. doi: 10.2984/69.1.1
Rodrigues, L. J., and Grottoli, A. G. (2007). Energy reserves and metabolism as indicators of coral recovery from bleaching. Limnol. Oceanogr. 52, 1874–1882. doi: 10.4319/lo.2007.52.5.1874
Sabine, C. L., Feely, R. A., Gruber, N., Key, R. M., Lee, K., Bullister, J. L., et al. (2004). The oceanic sink for anthropogenic CO2. Science 305, 367–371. doi: 10.1126/science.1097403
Smith, S. V., Chave, K. E., and Kam, D. O. (1973). Atlas of Kaneohe Bay: a Reef Ecosystem under Stress. Honolulu, HI: University of Hawaii Sea Grant.
Smith, S. V., Kimmerer, W. J., Laws, E. A., Brock, R. E., and Walsh, T. W. (1981). Kaneohe Bay sewage diversion experiment: perspectives on ecosystem responses to nutritional perturbation. Pac. Sci. 35, 279–395.
Keywords: coral reefs, resiliency, ecology and conservation, environmental monitoring, climate change impacts, coral bleaching
Citation: Bahr KD, Rodgers KS and Jokiel PL (2017) Impact of Three Bleaching Events on the Reef Resiliency of Kāne‘ohe Bay, Hawai‘i. Front. Mar. Sci. 4:398. doi: 10.3389/fmars.2017.00398
Received: 14 April 2017; Accepted: 24 November 2017;
Published: 08 December 2017.
Edited by:
Verena Schoepf, University of Western Australia, AustraliaReviewed by:
Douglas Fenner, NOAA NMFS, United StatesAndrea Genevieve Grottoli, The Ohio State University, United States
Copyright © 2017 Bahr, Rodgers and Jokiel. This is an open-access article distributed under the terms of the Creative Commons Attribution License (CC BY). The use, distribution or reproduction in other forums is permitted, provided the original author(s) or licensor are credited and that the original publication in this journal is cited, in accordance with accepted academic practice. No use, distribution or reproduction is permitted which does not comply with these terms.
*Correspondence: Keisha D. Bahr, a2JhaHJAaGF3YWlpLmVkdQ==