 Carlo Berg1,2*
 Chris L. Dupont3
 Johannes Asplund-Samuelsson1,4
 Narin A. Celepli1
 Alexander Eiler5
 Andrew E. Allen3,6
 Martin Ekman1
 Birgitta Bergman1
 Karolina Ininbergs7
- 1Department of Ecology, Environment and Plant Sciences, Science for Life Laboratory, Stockholm University, Stockholm, Sweden
- 2Bolin Centre for Climate Research, Stockholm University, Stockholm, Sweden
- 3Microbial and Environmental Genomics, J. Craig Venter Institute, San Diego, CA, United States
- 4Science for Life Laboratory, School of Engineering Sciences in Chemistry, Biotechnology and Health, KTH Royal Institute of Technology, Stockholm, Sweden
- 5eDNA Solutions AB, Mölndal, Sweden
- 6Scripps Institution of Oceanography, University of California, La Jolla, CA, United States
- 7Clinical Microbiology, Karolinska University Hospital, Solna, Sweden
Marine and brackish surface waters are highly dynamic habitats that undergo repeated seasonal variations in microbial community composition and function throughout time. While succession of the various microbial groups has been well investigated, little is known about the underlying gene-expression of the microbial community. We investigated microbial interactions via metatranscriptomics over a spring to fall seasonal cycle in the brackish Baltic Sea surface waters, a temperate brackish water ecosystem periodically promoting massive cyanobacterial blooms, which have implications for primary production, nutrient cycling, and expansion of hypoxic zones. Network analysis of the gene expression of all microbes from 0.22 to 200 μm in size and of the major taxonomic groups dissected the seasonal cycle into four components that comprised genes peaking during different periods of the bloom. Photoautotrophic nitrogen-fixing Cyanobacteria displayed the highest connectivity among the microbes, in contrast to chemoautotrophic ammonia-oxidizing Thaumarchaeota, while heterotrophs dominated connectivity among pre- and post-bloom peaking genes. The network was also composed of distinct functional connectivities, with an early season balance between carbon metabolism and ATP synthesis shifting to a dominance of ATP synthesis during the bloom, while carbon degradation, specifically through the glyoxylate shunt, characterized the post-bloom period, driven by Alphaproteobacteria as well as by Gammaproteobacteria of the SAR86 and SAR92 clusters. Our study stresses the exceptionally strong biotic driving force executed by cyanobacterial blooms on associated microbial communities in the Baltic Sea and highlights the impact cyanobacterial blooms have on functional microbial community composition.
Introduction
For almost 8000 years, the time span that the semi-enclosed Baltic Sea has existed, Cyanobacteria have recurrently developed into widespread summer blooms (Bianchi et al., 2000) acting as significant drivers of primary production in these brackish waters. Being photoautotrophic, and some also diazotrophic, they add carbon (C) and nitrogen (N) to this system through specific fixation of inorganic C and N (Moisander et al., 2003; Vahtera et al., 2010). By these means, Cyanobacteria impact biogeochemical cycles through pulses of nutrients and influence the composition and functioning of co-occurring microbial as well as higher trophic level populations (Moisander et al., 2003; Stal et al., 2003; Vahtera et al., 2010). During summer, Cyanobacteria in the sunlit depths of the Baltic Sea are dominated by the filamentous genera Aphanizomenon, Nodularia, and Dolichospermum (formerly Anabaena, Wacklin et al., 2009), which rise and collapse within a period of a few months (Laamanen and Kuosa, 2005) along with other community members such as zooplankton grazers, phages (van Hannen et al., 1999), and a wide range of heterotrophic bacteria (Pinhassi and Hagström, 2000; Berg et al., 2009; Dupont et al., 2014). Besides elevated temperature and sunlight, additional factors may promote the development of blooms. Similar to other nitrogen-fixing cyanobacteria, Nodularia spumigena is limited by phosphorus and its availability substantially promotes growth (Olofsson et al., 2016). Cyanobacterial blooms cause widespread surface scums and this newly generated biomass (Wasmund et al., 2001) may further promote eutrophication, hypoxia and affect ecosystem status. From a dynamics perspective, growth of cyanobacteria can be considered as an event consisting of short impulses (Bar-Joseph et al., 2012) that cause a cascade of changes both in nutrient cycling and community composition. The release and utilization of organic compounds may be a vital driving mechanism for the microbial loop (Seymour et al., 2010; Teeling et al., 2016), while anthropogenic activities and seasonal environmental conditions may additionally perturb these interactions (Gilbert et al., 2012).
The annual summer peak of cyanobacterial blooms is consistently observed in an annual basis in the Baltic Sea. However, how these peaks are accompanied by changes in the functional gene transcription by the microbial community is less understood. As natural microbial communities are complex, comprehensive temporal investigations that take into account the diverse fluctuations of functional and taxonomic groups as well as environmental parameters can yield insights into phylogenetic and functional trait dynamics (Fuhrman, 2009). In particular, interactions occurring between trophic levels and across all domains of life (Konopka et al., 2015) can be identified by analyzing time-series data (Fuhrman and Steele, 2008; Eiler et al., 2012). Extensive high frequency time-series studies represent an important key in obtaining insights into complex ecosystems (Bar-Joseph et al., 2012). They can also be used to identify ecosystem stable steady states or repeatable dynamic transition states (Teeling et al., 2016), which then could be used in a predictive fashion. In comparison, temporal investigations focusing on selected time periods may provide insights into changes associated with specific events like the growth of Cyanobacteria during the summer season. A high-frequency time-series study in the Baltic Sea concluded that the observable dynamics in microbial communities mainly reflect biological transitions, rather than arbitrary changes (Lindh et al., 2015) and that these transitions were specifically linked to the activity of photosynthetic microbes.
To widen the scope beyond basic inventory descriptions of cyanobacterial bloom interactions, our study explored microbial networks of interactions and interdependencies on the gene transcription level. Applying large-scale metatranscriptomic analyses, we examined changes in gene expression during the rise and fall of an extensive cyanobacterial bloom in the Baltic Sea. By constructing networks from taxonomic and functional co-occurrence patterns we elucidate the impact of cyanobacterial blooms on the functional level of microbial communities with regard to the cycling of carbon and nitrogen, and the composition of the microbial assemblages.
Materials and Methods
Sample Preparation and Construction of Metatranscriptomic Libraries
Sampling was conducted approximately every 2 weeks by collecting 2 L of pre-filtered (200 μm) surface water from a Baltic Sea coastal sampling station located off the island of Askö in the Stockholm Archipelago, Sweden (58.82° N, 17.62° E, Figure 1A). All samples were taken in the morning between 9:20 and 10:40 local time from May 23 (day 143 of the year) to September 27 in 2012 (day 270). Briefly, the water was filtered through 0.22 μm Sterivex filters using a peristaltic pump and frozen on dry ice within 8 min after collection from the sea (processing 2 × 1 L in parallel). Processing of the filters and preparation of mRNA libraries is described in more detail in Asplund-Samuelsson et al. (2016). Briefly, RNA was purified from filters using the Trizol reagent (Life Technologies; Carlsbad, CA), treated with DNase (Qiagen, Valencia, CA, USA), and cleaned with the RNeasy MinElute Kit (Qiagen, Valencia, CA, USA). Subsequently, RNA quality was analyzed for quality on a 2100 Bioanalyzer with Agilent RNA 6000 Nano Kits (Agilent Technologies, Santa Clara, CA, USA) and quantified using the Qubit Fluorometric Quantification system (ThermoFisher, Waltham, MA, USA). Total mRNA transcriptome libraries were made with ScriptSeq v2 RNA-Seq kit (Illumina Inc., San Diego, CA, USA) using subtractive hybridization of rRNAs with either antisense rRNA probes (Stewart et al., 2010), recovered via PCR from a mixture DNA obtained from 0.1, 0.8, and 3.0 μm filters from the 13 samples from the Baltic transect (Phase I, 2009; Asplund-Samuelsson et al., 2016), or using Ribo-Zero bacterial and plant rRNA removal kits (Illumina Inc., San Diego, CA, USA) on the 11 samples collected at Askö (Phase III, 2012) comprising this study. Later, paired-end sequencing (2 × 100 bp reads) was performed on an Illumina HiSeq 2000. After quality trimming, rRNA filtering and primer removal, metatranscriptomic reads were assembled into contigs and mapped onto identified open reading frames (ORFs) as described in Asplund-Samuelsson et al. (2016). ORFs were annotated by blastp vs. PhyloDB (Dupont et al., 2015) and HMMER v. 3.1b2 hmmscan (http://hmmer.org) with the Pfam protein families database (Finn et al., 2014) and TIGRFAMs (Selengut et al., 2007).
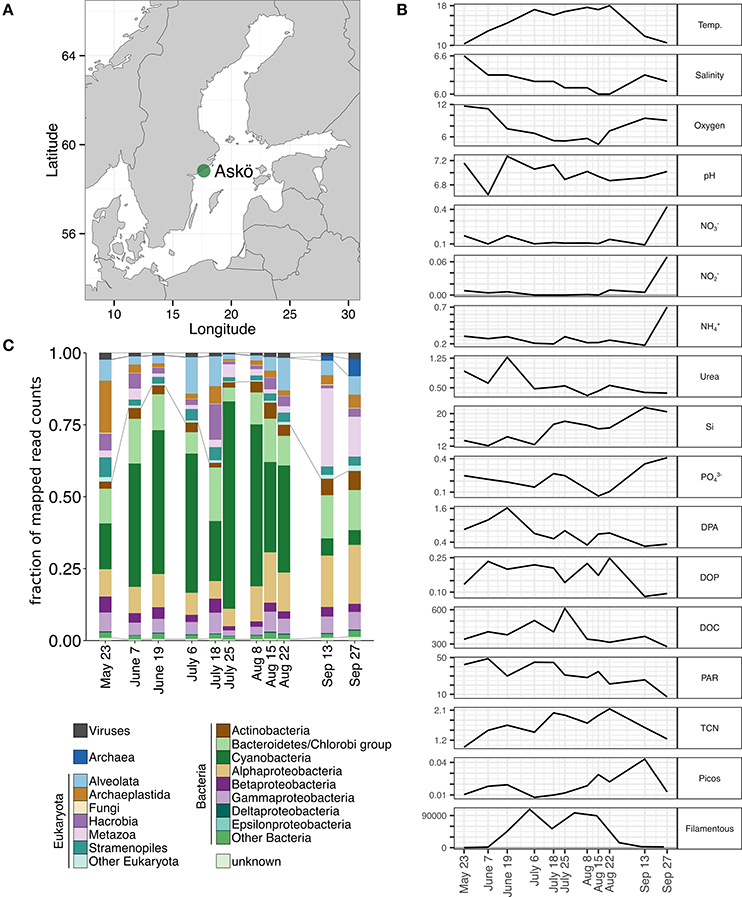
Figure 1. (A) Location of the sampling site off the island of Askö in the Stockholm archipelago in the coastal waters. Samples were taken from the surface in 2012 from May 23 throughout Sep 27. (B) Environmental parameters describing the sampling site. Temp., water temperature (°C); Salinity (PSU); Oxygen (mg/L); pH; , , , urea, Si, (μmol/L); DPA, dissolved primary amines (μmol/L); DOP, dissolved organic phosphorus (μmol/L); DOC, dissolved organic carbon (μmol/L); PAR, photosynthetic active radiation (mol/m2; acquired from http://strang.smhi.se/ and presented as means of the 2 days preceding sampling); TCN, total cell numbers (106 bacteria/mL); Picos, red and green picocyanobacteria (106 cells/mL); Filamentous, filamentous cyanobacteria at station B1 (100-μm-pieces/L; acquired from http://sharkweb.smhi.se/) (C) Taxonomic composition of all annotated mRNA during the 2012 sampling period of viruses, eukaryotes, and prokaryotes.
Abundances of total cell numbers (TCN) were determined by flow cytometry for 16 samples (time points), including the 11 samples of which metatranscriptomic data was generated. Bacterial cell abundance was analyzed by flow cytometry after cells had been fixed with formaldehyde (final concentration 2%) and stained with the fluorescent dye Syto13® (Molecular probes, Invitrogen, Carlsbad, CA, USA) according to del Giorgio et al. (1996). Cell counting was performed with a flow cytometer equipped with a 488 nm blue solid state laser (Cyflow Space, Partec, Görlitz, Germany) and FL1 (FITC = 525 nm). A volume of 50 μL was counted and green fluorescence was used as trigger during the measurement. The flow cytometry counts were analyzed using Flowing Software version 2.5 (Perttu Terho, Centre for Biotechnology, Turku, Finland). Unstained samples were analyzed by flow cytometry to estimate cell numbers of picocyanobacteria and small phototrophic eukaryotes which was based on autofluorescence characteristics using 488 nm blue light excitation and emission detection with FITC (FL1 = 525 nm) for chlorophyll, FL2 (PE = 575 nm) for phycoerythrin, and FL3 (PE Cy5 = 670 nm).
The environmental data for urea, DOC, DOP, DPA, , silica, , , and were collected concurrently with the MiMeBS Phase III sampling (see Asplund-Samuelsson et al., 2016) and later analyzed at the Virginia Institute of Marine Science. Temperature, salinity, and oxygen were measured at the sampling site using a combined hand-held probe, while pH was measured with a pH electrode in the lab within 1 h of sampling (Asplund-Samuelsson et al., 2016). Microscopic cellcounts of filamentous cyanobacteria were retrieved from the Swedish Meteorological and Hydrological Institute (SMHI) via the SHARKweb database (http://sharkweb.smhi.se/).
Construction of Networks
The data of mapped read counts was broken down into meaningful units of grouped genes by application of a weighted correlation network analysis (WGCNA, Langfelder and Horvath, 2008) in R (R Core Team, 2014; http://www.R-project.org/). All identified ORFs with more than 200 mapped read counts across all samples and with maximal three time points of zero read counts were included in the analysis. Read counts were normalized against library size (total mapped read counts per sample) and then z-score transformed [z-score = (value – mean(row))/standard deviation(row)]. Transcription patterns of these genes (n = 97,921) were pre-clustered by projective k-means, resulting in 10 blocks, each comprising maximal 12,000 genes (maxBlockSize). Subsequently, hierarchical clustering was used to assign gene expression patterns to 81 clusters of tightly co-expressed genes of which one representative expression pattern, termed “eigengene,” summarizes the genes in that cluster (Langfelder and Horvath, 2008). Genes with expression patterns that were not assigned any cluster were categorized as “unassigned” (n = 20,909). Genes were allowed to stay in a specific cluster if their correlation was >0.8 to the eigengene.
A dendrogram describing the similarities among the 81 eigengenes was created by hierarchical clustering using the average linkage method (average distance between clusters, R package “stats,” R Core Team, 2014; http://www.R-project.org/). Cutting of the dendrogram at 0.95 resulted in four major components each containing eigengenes that peak during different times of the bloom (see Figure 2A). For each ORF, topological network properties were calculated such as the extra-modular connectivity (kOut), which describes the connectivity between genes from different clusters. For this, the function intramodularConnectivity() was used from the WGCNA R package on all functionally annotated ORFs or on a random subset of 10,000 taxonomically annotated ORFs. The parameter getWholeNetworkConnectivity was enabled in order to report extra-modular connectivity values which were subsequently divided by the maximal connectivity among all ORFs to obtain relative values and facilitate comparability between the four major components described above. Relationships between taxonomic identity, function, and clusters were visualized in Hive plots (Krzywinski et al., 2011) allowing for comparability between the four components by utilization of a fixed and comprehensive layout. The Hive plots were created in a way to visualize the amount of gene expression shared between three annotated categories: taxonomic group, gene function, and cluster. Lines connecting categories on two different axes visualize, the taxonomic and functional annotation that a number of genes have while the width of the line shows the level of expression assigned to these genes.
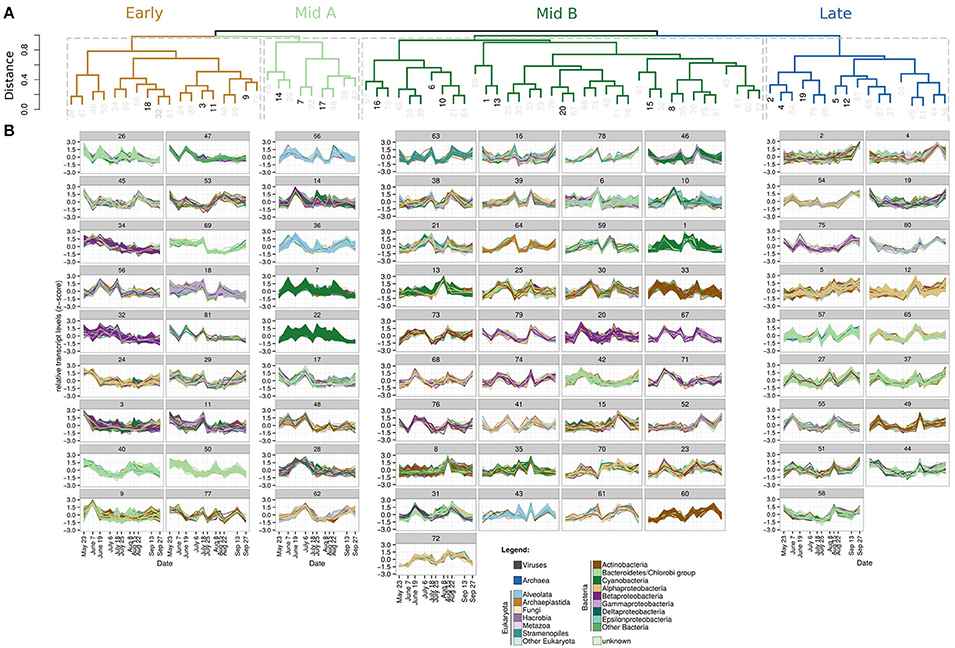
Figure 2. (A) Dendrogram showing the similarities of the 81 eigengenes representing different expression patterns. Dark black numbers indicate the largest clusters from 1 to 20 (as defined by the number of ORFs in each cluster), which are shown in the Hive plots (Figure 3B). Taxonomic composition and expression profiles of all 81 clusters are shown in Supplementary Figures 5, 6, respectively. Cutting the dendrogram at 0.95 results in four major groups assigned the names Early, Mid A, Mid B, and Late being congruent with genes that have their expression peaks early, during, and at the end (“Late” component) of the seasonal blooms, respectively. (B). Z-score transformed expression patterns of all ORFs within the 81 clusters during the 2012 time-series sampled off the island of Askö, Sweden, in the Stockholm archipelago. Each panel shows the expression patterns of all individual ORFs assigned to that cluster (number above).
Correlation of “Eigengenes” with Environmental Parameters
All eigengene expression patterns were tested for correlation with environmental parameters. As multiple linear regression techniques would require more than eleven time points in order to yield reliable results, we opted for a principal component analysis (PCA)-based correlation approach allowing the visualization of interrelationships among environmental descriptors and gene expression patterns. The environmental parameters temperature, salinity, pH, nitrate, nitrite, ammonium, urea, silica, phosphate, dissolved primary amines (DPA), dissolved organic phosphate (DOP), dissolved organic carbon (DOC), photosynthetic active radiation (PAR; the average per-day integrated radiation of the 2 days preceding the sampling date, acquired from the STRÅNG database) and total cell numbers (TCN) were scaled and PCA-transformed using the R functions “scale” and “prcomp.” Eigengene expression patterns and scaled environmental parameters were then correlated to the two principal components of the PCA-transformed environmental data using the R function “cor” at default settings (Pearson correlation). Particularly strong and significant correlations were selected at a Pearson's r-value of 0.8634, as this would satisfy a correlation test with 11 data points and the critical significance threshold 0.05, adjusted using the Bonferroni method. Explicitly, the threshold p-value was divided by 81, i.e., the total number of correlations between the eigengene expression patterns and the plane described by the two principal components (PC1 and PC2), giving 0.0006136 that corresponds to a Pearson's r of 0.8634. The hypotenuse between the r-values obtained vs. PC1 and PC2, respectively, was considered the total magnitude of correlation of an eigengene to the environment.
Identification of nifH Sequences
Sequences of the nifH gene were identified with a Hidden Markov Model (HMM) profile search. The search was performed with HMMER (version 3.1b1, May 2013, Eddy, 2011) and the hmmsearch tool against the translated metatranscriptome database using the HMM profile TIGR01287 and the TIGRFAM specific trusted cutoff score. Recovered sequences were then cross-evaluated in a reciprocal search by querying these against the full TIGRFAM database (release 14.0) and keeping only sequences for which the same profile HMM was confirmed according to the best hit. Reference protein sequences of the nitrogenase nifH gene were obtained from UniProt and together with the sequences identified via HMMER aligned with Muscle (v3.8.31, Edgar, 2004). Alignments were subsequently inspected in ARB (Ludwig et al., 2004) and a maximum likelihood phylogenetic tree was constructed using FastTree (v2.1.8, Price et al., 2010) and visualized with iTOL (Letunic and Bork, 2016).
Results and Discussion
The sampled surface waters off the island of Askö in the coastal Baltic Sea (Figure 1A) were characterized by temperatures between 16.1 and 18.0°C from July to August 2012 (Figure 1B), sufficient to support the development of cyanobacterial blooms (Laamanen and Kuosa, 2005; Stal, 2009). Cellular abundances of heterotrophic bacteria and picoplankton exceeded 1.4 × 10⁶ cells mL−1 during that time with a maximum of 2.4 × 10⁶ cells mL−1 at the beginning of August (Figure 1B). Based on taxonomically annotated mRNA sequences, a diverse pre-bloom community was present in May (Figure 1C, Supplementary Figure 1), which was then increasingly dominated by cyanobacterial transcripts during the summer, representing up to 72% of the mapped read counts on July 25 (Figure 1C). This observation was reinforced by high total and filamentous cell counts (Figure 1B) as well as the detection of N. spumigena cells at a nearby monitoring sampling station at the end of July/beginning of August by the Swedish Meteorological and Hydrological Institute (station B1, SMHI, SHARKweb database; see also Asplund-Samuelsson et al., 2016). In contrast, abundances of picocyanobacteria were low during that period but increased subsequently in late August and early September (Figure 1B).
Network of Gene Expression and Seasonal Components
A total of 97,921 genes were subject to a weighted correlation network analysis (WGCNA, Langfelder and Horvath, 2008) resulting in 81 clusters, which contained genes with similar expression patterns (Figure 2). Each of these clusters is represented by one “eigengene,” which describes best the expression profiles of all genes assigned to the same cluster. The dendrogram obtained by hierarchical clustering of the 81 eigengenes grouped into four major components (Figure 2A). These four components comprised eigengenes which had their expression peaks during different periods of the season (Figure 2B); specifically, one early, two intermediate (hereafter, referred to as “Mid A” and “Mid B”) and one late peaking component, consisting of 18, 9, 37, and 17 eigengenes, respectively (Figures 2A,B, 3A; for full annotation and clustering data, see interactive Supplementary Table 1). Gene expression within the four largest clusters of the “Early” component was sustained by a wide range of taxonomic groups with most expressing genes involved in photosynthesis (Figure 3B) while expression of the “Late” component was governed by Alphaproteobacteria expressing genes among multiple functional categories indicative for growth (Figure 3B). In total, the maxima of combined transcript levels of each component made up more than 50% of all transcripts except for the Mid A component (>30%), suggesting a high level of connectivity among microbial taxa and functions within each component (Figure 4A). The “Early” component exhibited a pronounced representation of Archaeplastida (comprising among others green algae) and Viruses (Figure 4A), such as transcripts of the Synechococcus infecting cyanobacterial phage syn9 (cluster 3, Supplementary Figure 6) linked to photosynthesis. These transcripts may either originate from free particles or infected cells relating to the increase of Synechococcus during the “Early” component. The “Mid A” component was almost exclusively composed of cyanobacterial transcripts whereas the “Mid B” component was additionally accompanied by transcripts of Bacteroidetes, Hacrobia, Stramenopiles, and Alveolata most of which connected to ATP synthesis or photosynthesic activities (Figure 3B). The taxonomic composition of the “Late” component genes was more diverse, and dominated by transcripts of Alphaproteobacteria and, at the later time points, by those of Archaea, Metazoa, Bacteroidetes, and Viruses. Notably, archaea were only assigned to the “Late” component, being not covered by the other three components (Figure 3B).
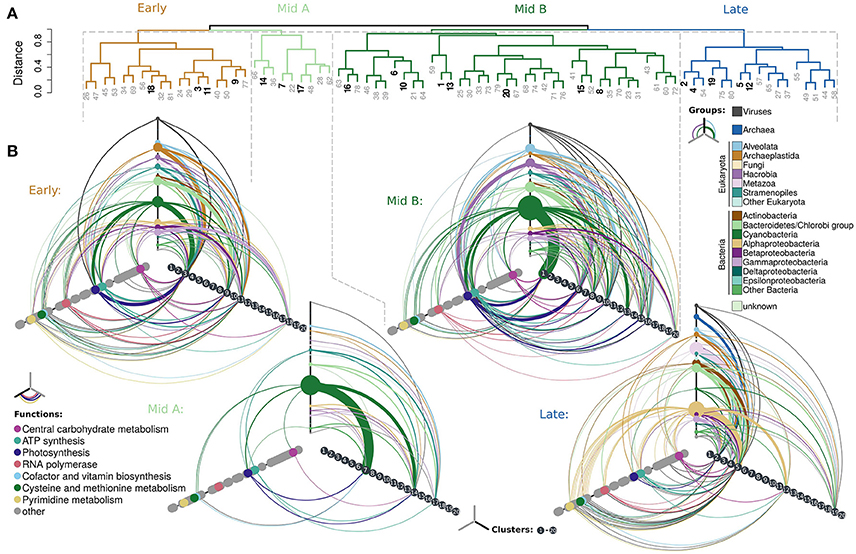
Figure 3. Eigengene networks of the Askö 2012 metatranscriptomic time-series. (A) Dendrogram as shown in (B). Hive plots illustrating relationships between taxonomic groups (top axis) and their contributions to gene expression associated with specific functions (left axis) and among the clusters 1–20 (right axis). Line widths correspond to the fraction of total gene expression that share the annotation categories defined on the Hive axes. A line going from one axis to another resembles the fraction of ORFs that have, for example, a specific functional and taxonomic annotation. Not all points on the Hive axes have connections because each cluster is only part of one of the major groups resembled by the Hives (for example, clusters 3, 9, 11, and 18 are only part of the Early Hive). Each ORF is only contained once and does not re-occur in multiple hive plots or the clusters therein.
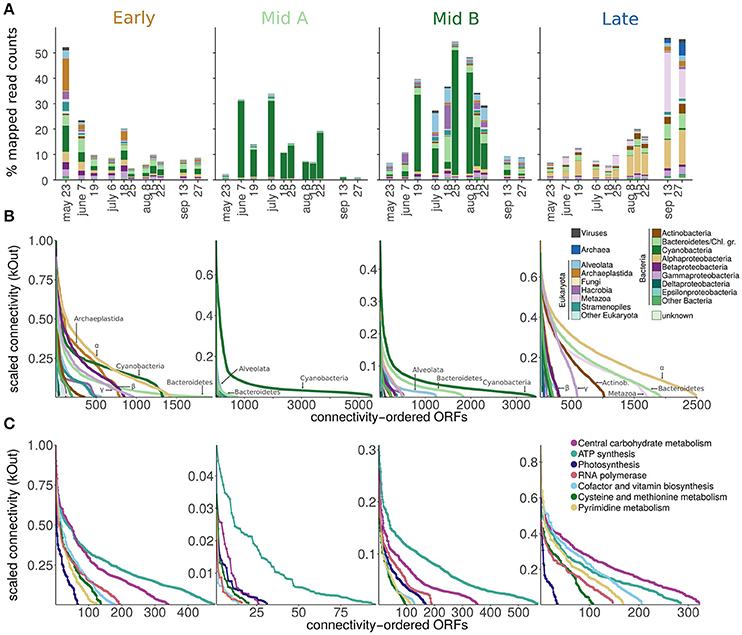
Figure 4. Expression and connectivity within the four components of the time-series, which are characterized by genes having their expression peaks during early, intermediate and late periods of the bloom (termed “Early,” “Mid A,” “Mid B,” and “Late” components). (A) Taxonomic composition of gene expression. (B) Inter-module network connectivity of individual ORFs (ordered by connectivity) divided after taxonomic group and (C) function. For legibility, only the seven most abundant functions are plotted here.
Conceptually, these trends reflect a natural succession of an early season algae bloom followed by a midsummer cyanobacterial bloom, with a final dominance of heterotrophs and emergence of nitrifiers. Therefore, the interactions within and between these components most likely capture the suite of biological and abiotic interactions. Each component contains clusters of genes that are highly correlated in their expression, and which were peaking at distinct time-points relative to the bloom event; the organisms expressing those genes may directly stimulate each other or the genes associated with a given genome may underlie the same regulation. In contrast, negative correlation patterns between different eigengenes may be a response to viral lysis, grazing, competition, inhibition, or undetected physical or chemical fluctuations. The differential clustering into these seasonal components suggests that certain metabolic capacities are attributable to specific times of the growth season, or in this case the cyanobacterial bloom, carried out by selected microorganisms. For example, genes of the tricarboxylic acid cycle (TCA cycle) were expressed throughout the seasons but by different groups (Supplementary Figure 2). In the “Early” component, both Alpha- and Gamma-proteobacteria contributed to TCA cycle gene expression while in the “Late” component, Alphaproteobacteria comprised most of this expression with a shift to genes of the glyoxylate shunt by Gammaproteobacteria (Supplementary Figure 2).
Association of Gene Expression with Environmental Parameters
To identify possible abiotic-biotic interactions, the eigengenes and environmental variables were used for a principal component analysis. Overall, correlation tests of the 81 eigengenes against environmental factors showed a pronounced grouping of eigengenes from the same component behaving similarly, though only few of the eigengenes correlated significantly to the environmental variables (Figure 5). This may reflect the complexity of non-direct interactions between abiotic and biotic components at the functional level of cyanobacterial summer blooms. In contrast, more correlations to environmental parameters are found during Baltic Sea spring blooms and their community composition, which was also hypothesized as a factor structuring bacterioplankton community composition (Bunse et al., 2016). Abundances of TCN and temperature were correlated with the activities of “Mid B” clusters (Figure 5), being in line with previous studies (Pinhassi and Hagström, 2000; Legrand et al., 2015; Bertos-Fortis et al., 2016). The increase of , occurring at the end of the bloom (Figure 5), correlated with cluster 2, which is enriched in archaeal genes affiliated with Thaumarchaeota (Supplementary Figure 4), the primary group responsible for the oxidation of ammonia in deeper water layers of the Baltic Sea (Berg et al., 2015). This increase in nitrate may be a direct response to released ammonium during the demise of the bloom. Laboratory and field studies have detected a leakage of from various Cyanobacteria to the surrounding environment (Berthelot et al., 2015; Adam et al., 2016), and a subsequent transfer to hetero- and autotrophic prokaryotes as well as eukaryotes (Adam et al., 2016). The presence of nitrifiers in cyanobacterial blooms was shown previously (Tuomainen et al., 2003) and in the present study, we detected amoA transcripts (cluster 2, “Late” component) coinciding with elevated concentrations of nitrite and nitrate, the products of nitrification thereby suggesting ongoing nitrification in association with cyanobacterial blooms (Supplementary Figures 3, 4). This is also in line with a microcosm study where cyanobacterial blooms induced subsequent nitrification due to elevated levels of ammonium (Peng et al., 2017).
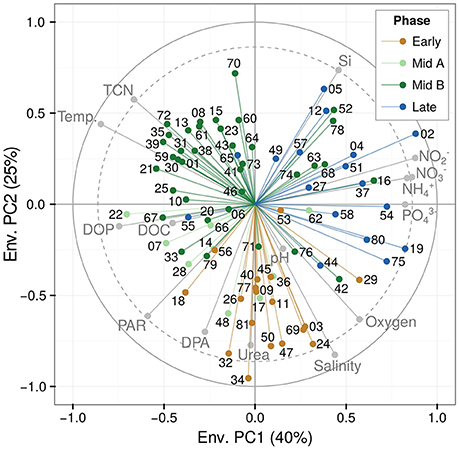
Figure 5. Correlation of the 81 eigengenes (represented as component-specific colored points labeled with two-digit numbers) with environmental parameters (gray points; see Figure 1B). The dashed ring marks particularly strong correlations (Pearson's r = 0.86) with the critical significance threshold 0.05 (Bonferroni adjusted). DOC, dissolved organic carbon; DOP, dissolved organic phosphorus; DPA, dissolved primary amines; PAR, photosynthetic active radiation; TCN, total cell numbers. For the time course of each of the environmental parameters, see Figure 1B.
Alphaproteobacteria and Metazoa represent central components of the heterotrophic community that are also stimulated by the cyanobacterial bloom. Metazoa contributed mainly to cluster 4 (“Late” component, Supplementary Figure 5), a diverse mixture of transcripts by for example Daphnia sp., Lottia sp., or Branchiostoma sp. This suggests that the bloom was followed by a response of eukaryotes that grazed on the Cyanobacteria and heterotrophic bacteria (Sellner et al., 1993; Work and Havens, 2003). Clusters 32 and 34 (“Early” component) correlated significantly with urea (Figure 5) and were largely dominated by Betaproteobacteria (Supplementary Figure 5). The alphaproteobacterial contribution to the “Late” gene expression was mostly associated with clusters 5 and 12 (Supplementary Figure 5), which correlated positively with silica and negatively with dissolved primary amines (an organic nitrogen source) and the amount of photosynthetically active radiation (Figure 5) going along with the decrease in available light as summer nears its end (Figure 5) and leading to the bloom collapse. The correlation with silica is driven primarily by the slightly higher concentrations in the “Early” and “Late” components (Figure 5); potentially, the minor drawdown of silica in the “Mid A” and “Mid B” components is due to cyanobacterial uptake (Baines et al., 2012), suggesting an indirect association, or due to Stramenopiles such as diatoms.
In general, eigengenes of the “Early” and “Late” components correlated stronger with environmental parameters than those of the “Mid A” and “Mid B” components, suggesting primarily biological interactions during the bloom peak and a combination of biotic and abiotic influences before and after the bloom (Figure 5). Nitrogen species and phosphorous were correlated mostly with genes of the “Late” clusters, which may denote those genes as being potentially responsive to the release or utilization of N and P. It suggests furthermore that the recurred availability of N and P (Figure 5) has a substantial impact after the demise of Cyanobacteria and that the responsive microorganisms are present, yet awaiting suitable conditions to become active. Alternatively, the elevated concentrations of nutrients of the very last time point (Figure 5) may be the result of heterotrophic degradation and remineralization of cyanobacterial biomass or resuspension of such material due to mixing.
Connectivity of Genes within the Network
High node connectivity has been previously used as an indicator for strongly coupled and regulated processes (Aylward et al., 2015). Unlike the study by Aylward et al. who investigated single day diel cycles and found photoautotrophs to always exhibit the highest connectivity, in the present study the functional and phylogenetic groups with the highest connectivity varied over a seasonal cycle (Figures 4B,C). In the “Early” component, the connectivity of cyanobacterial transcripts was comparable to those of Alphaproteobacteria, Archaeplastida, and Betaproteobacteria while Cyanobacteria-dominated eigengenes had the highest connectivity in both “Mid A” and “B” components (Figure 4B). Additionally, highly connected genes were affiliated with Alphaproteobacteria, Bacteroidetes, Gammaproteobacteria, Thaumarchaeota, and Actinobacteria in the “Late” component, indicating that genes of those groups are tightly coupled to each other. The connectivity of genes for carbon metabolism was more apparent in clusters of the “Late” component while energy metabolism, in particular, ATP synthesis, was more connected within the other components (Figure 4C). This suggests that carbon metabolism was becoming particularly central to the network driving dynamics in metabolism after the blooming of cyanobacteria when community composition changed. The high connectivity of genes related to carbon metabolism also coincided with a reduced connectivity of cyanobacterial genes during the succession from a cyanobacterial to a heterotrophic bacteria dominated system. Such interactions between Cyanobacteria and heterotrophic bacteria are linked to the cycling of dissolved organic matter degradation and to nitrogen cycling (Louati et al., 2015). Additionally, dissolved organic carbon concentrations were correlated primarily with clusters of the “Mid A” and “B” and cyanobacterial-dominated components (Figure 5). Both the change in community composition and the release of dissolved organic carbon were, therefore, either the effect of, or were driving the shift from photoautotrophic to heterotrophic metabolism.
Gene Expression Related to Biogeochemical Element Transformations
Cycling of carbon unifies all microorganisms and identifying representative carbon pathways that involve utilization of labile compounds can give insights into the complex cycling of dissolved organic matter (Moran et al., 2016). In the present study, genes which are relevant to the TCA cycle were highly expressed among all but the “Mid A” component (Supplementary Figure 2). In contrast, among the “Mid B” and the “Late” clusters, TCA glyoxylate shunt genes were induced or expressed at a much higher level, such as isocitrate lyase (aceA, K01637) and malate synthase (aceB, K01638; Supplementary Figure 2). The glyoxylate shunt facilitates the conversion between isocitrate and malate and may become important upon carbon starvation (Patrauchan et al., 2012), and is also responsive to the metabolic state of a cell (see the comprehensive review by Cronan and Laporte, 2006). The factors that shift the TCA cycle toward the glyoxylate cycle are however less well-known (Beier et al., 2015). Aylward et al. (2015) found that genes for the glyoxylate shunt were among the most expressed in the observed heterotrophs, while Palovaara et al. (2014) reported that in cultures of Dokdonia MED 93 expression peaked during the highest light levels and therefore contributed to efficient carbon assimilation, but in this particular case also were related to proteorhodopsin expression. Thus, the shift toward the expression of glyoxylate shunt genes indicates a stark restructuring of carbon utilization pathways for Alphaproteobacteria and Gammaproteobacteria, which have also been implicated as important carbon degraders following an algal bloom in the North Sea (Teeling et al., 2012). Both isocitrate lyase and malate synthase were here expressed by Gammaproteobacteria of the SAR86 and SAR92 (Gammaproteobacterium HTCC2207) clusters in the “Late” component. These two groups were previously linked to the breakdown of complex carbohydrates (Dupont et al., 2012; Gifford et al., 2013) and both possess proteorhodopsins for light-driven energy conservation (Stingl et al., 2007; Dupont et al., 2012). The pronounced seasonal changes in the expression of the glyoxylate shunt likely reflect community degradation of cyanobacteria-fixed carbon, both exuded organic matter and dying cells. For SAR11, Beier et al. (2015) concluded that the glyoxylate cycle is regulated in response to carbon limitation.
Genes for both N2 fixation and utilization of ammonium were expressed throughout the sampling period. Expression of the marker gene for the fixation of nitrogen, nifH, was assigned to the “Mid A” and “B” components enriched in cyanobacterial transcripts (Supplementary Figure 3) while the genes for the utilization of ammonium through its aerobic oxidation (ammonia monooxygenase (amo) genes) were assigned to the “Late” component, paralleling the increase in ammonium concentrations as well as its oxidation products nitrite and nitrate. Employing the reciprocal hmmsearch approach, five contigs were identified to comprise the nifH gene (Supplementary Figure 3). All of them were affiliated with Cyanobacteria of the Nostocales (Supplementary Figure 3), of which contig_429509_1310_2191_+ had 99% sequence similarity to nifH (nsp40720) in N. spumigena CCY9414, a strain that was previously isolated from the Baltic Sea (Voß et al., 2013). In addition, to these nifH expressing cyanobacteria high expression of urea transporter genes (K11959) affiliated with non-diazotrophic Synechococcus was observed in the “Mid A” and “Mid B” components (Supplementary Figure 7). As such, the dissection of the network detailing expression of uptake-systems for organic nitrogen compounds and N-fixing genes by respective phytoplankton groups point to the importance of N-cycling for the composition of this phytoplankton bloom. For example, certain bloom-associated phytoplankton species may depend on organic N compounds released by N-fixing cyanobacteria.
Based on Pfam annotations, the expression of amoA was limited to one ORF affiliated with Thaumarchaeota of the Nitrosopumilus genus (Supplementary Figure 4). This sequence was most closely related to two clones (98% sequence similarity) from the Baltic Sea pelagic redox gradients (Labrenz et al., 2010). This may suggest that a close but distinct relative of the redox gradient Nitrosopumilus cluster is active in surface waters utilizing the ammonium that is released upon cyanobacterial blooms. However, thaumarchaeotal abundances and activities are understudied in Baltic Sea surface waters at present. The differential expression of nitrogen fixation (nif genes) and ammonia oxidation genes, accompanied by the increase in ammonium as well as nitrification products (nitrite and nitrate) suggests a recycling of N derived from Cyanobacteria through chemoautotrophs and gives insight into the potential fate of nitrogen through microbial activities.
Conclusion
Our study shows that the accumulation of both nitrogen and carbon derived from blooming Cyanobacteria is followed by specific taxonomic and functional changes after the decline of the bloom. By dissecting the complexity of gene expression in Baltic Sea cyanobacterial blooms using a metatranscriptomic time-series, we revealed the transcriptional integration of Cyanobacteria with accompanying Bacteria, Archaea, Eukaryotes, and the presence of viruses. High abundances of filamentous Cyanobacteria were accompanied by increased community gene expression during the summer season. We showed that the bloom was characterized by high connectivity and activities of autotrophic Cyanobacteria, which indicates autotrophy driving community metabolism and the underlying transcription networks. Later on, metabolism shifted to a system where carbon metabolism occupied an increased fraction of connected nodes. The genes that became relevant after the blooming event were characterized by decreased node connectivity, possibly indicating a shift to abiotic driving forces. Despite the fluctuating environment and microbial perturbations from blooming Cyanobacteria throughout the sampling season, the post-bloom microbial community re-established a comparable status in terms of diversity to the pre-bloom, while comprising increased heterotrophic activities and changed taxonomic composition. By targeting not only specific functional groups but networks of key gene transcripts, our metatranscriptomics approach depicts the intimate taxonomic and functional interplay of microorganisms during seasonal succession. Our study exemplifies how microbial molecular data can provide comprehensive insight on complex environmental processes, and if validated with quantitative process rate measurements, metatranscriptomic network analyses may serve in the future a complementary tool for microbial environmental monitoring.
Data Availability
Sequencing data is available under NCBI BioProject PRJNA320636 with the Sequence Read Archive (SRA) accession numbers SRX1901300—SRX1901313. A table containing annotated ORFs with their cluster memberships is provided in Supplementary Table 1.
Author Contributions
CB, ME, BB, and KI: Designed the experiments; JA-S, NC, and KI: Performed the sampling; CB, CD, NC, AE, AA, and KI: Carried out analyses; CB: Performed the network analysis; CB, CD, JA-S, ME, and KI: Interpreted the results; CB, CD, and KI: Drafted the manuscript; CB, CD, JA-S, NC, AE, AA, ME, BB, and KI: Revised the manuscript.
Funding
This work was financially supported by the BalticSea2020 Foundation and the Olle Engkvist Byggmästare Foundation, and Science for Life Laboratory (Stockholm). JCVI was supported by the Beyster Family Fund of the San Diego Foundation and the Life Technologies Foundation, while CD acknowledges further support from the National Science Foundation (NSF OCE-1259994) and AA from the Gordon and Betty Moore Foundation grant GBMF3828 (AA).
Conflict of Interest Statement
AE was employed by eDNA Solutions AB.
The other authors declare that the research was conducted in the absence of any commercial or financial relationships that could be construed as a potential conflict of interest.
Acknowledgments
The authors acknowledge support from the National Genomics at Science for Life Laboratory Infrastructure funded by the Swedish Research Council, and Uppsala Multidisciplinary Center for Advanced Computational Science for assistance with massively parallel sequencing and access to the UPPMAX computational infrastructure. Support by BILS (Bioinformatics Infrastructure for Life Sciences) is also gratefully acknowledged. We are also very grateful for the sampling efforts made by B. Brindefalk, M. Ruuskanen, and J. Eriksson (Stockholm University). Finally, we thank the Stockholm University Baltic Sea center and Askö Laboratory for permission to use field and laboratory facilities.
Supplementary Material
The Supplementary Material for this article can be found online at: https://www.frontiersin.org/articles/10.3389/fmars.2018.00055/full#supplementary-material
References
Adam, B., Klawonn, I., Svedén, J. B., Bergkvist, J., Nahar, N., Walve, J., et al. (2016). N2-fixation, ammonium release and N-transfer to the microbial and classical food web within a plankton community. ISME J. 10:450. doi: 10.1038/ismej.2015.126
Asplund-Samuelsson, J., Sundh, J., Dupont, C. L., Allen, A. E., McCrow, J. P., Celepli, N. A., et al. (2016). Diversity and expression of bacterial metacaspases in an aquatic ecosystem. Front. Microbiol 7:143. doi: 10.3389/fmicb.2016.01043
Aylward, F. O., Eppley, J. M., Smith, J. M., Chavez, F. P., Scholin, C. A., and DeLong, E. F. (2015). Microbial community transcriptional networks are conserved in three domains at ocean basin scales. Proc. Natl. Acad. Sci. U.S.A. 112, 5443–5448. doi: 10.1073/pnas.1502883112
Baines, S. B., Twining, B. S., Brzezinski, M. A., Krause, J. W., Vogt, S., Assael, D., et al. (2012). Significant silicon accumulation by marine picocyanobacteria. Nat. Geosci. 5, 886–891. doi: 10.1038/ngeo1641
Bar-Joseph, Z., Gitter, A., and Simon, I. (2012). Studying and modelling dynamic biological processes using time-series gene expression data. Nat. Rev. Genet. 13, 552–564. doi: 10.1038/nrg3244
Beier, S., Rivers, A. R., Moran, M. A., and Obernosterer, I. (2015). The transcriptional response of prokaryotes to phytoplankton-derived dissolved organic matter in seawater. Environ. Microbiol. 17, 3466–3480. doi: 10.1111/1462-2920.12434
Berg, C., Vandieken, V., Thamdrup, B., and Jürgens, K. (2015). Significance of archaeal nitrification in hypoxic waters of the Baltic Sea. ISME J. 9, 1319–1332. doi: 10.1038/ismej.2014.218
Berg, K. A., Lyra, C., Sivonen, K., Paulin, L., Suomalainen, S., Tuomi, P., et al. (2009). High diversity of cultivable heterotrophic bacteria in association with cyanobacterial water blooms. ISME J. 3, 314–325. doi: 10.1038/ismej.2008.110
Bertos-Fortis, M., Farnelid, H. M., Lindh, M. V., Casini, M., Andersson, A., Pinhassi, J., et al. (2016). Unscrambling cyanobacteria community dynamics related to environmental factors. Front. Microbiol. 7:625. doi: 10.3389/fmicb.2016.00625
Berthelot, H., Bonnet, S., Camps, M., Grosso, O., and Moutin, T. (2015). Assessment of the dinitrogen released as ammonium and dissolved organic nitrogen by unicellular and filamentous marine diazotrophic cyanobacteria grown in culture. Front. Mar. Sci. 2:80. doi: 10.3389/fmars.2015.00080
Bianchi, T. S., Engelhaupt, E., Westman, P., Andren, T., Rolff, C., and Elmgren, R. (2000). Cyanobacterial blooms in the Baltic Sea: natural or human-induced? Limnol. Oceanogr. 45, 716–726. doi: 10.4319/lo.2000.45.3.0716
Bunse, C., Bertos-Fortis, M., Sassenhagen, I., Sildever, S., Sjöqvist, C., Godhe, A., et al. (2016). Spatio-temporal interdependence of bacteria and phytoplankton during a Baltic Sea spring bloom. Front. Microbiol. 7:517. doi: 10.3389/fmicb.2016.00517
Cronan, J. E. Jr., and Laporte, D. (2006). Tricarboxylic acid cycle and glyoxylate bypass. EcoSal Plus. doi: 10.1128/ecosalplus.3.5.2
del Giorgio, P. A. D., Bird, D. F., Prairie, Y. T., and Planas, D. (1996). Flow cytometric determination of bacterial abundance in lake plankton with the green nucleic acid stain SYTO 13. Limnol. Oceanogr. 41, 783–789. doi: 10.4319/lo.1996.41.4.0783
Dupont, C. L., Larsson, J., Yooseph, S., Ininbergs, K., Goll, J., Asplund-Samuelsson, J., et al. (2014). Functional tradeoffs underpin salinity-driven divergence in microbial community composition. PLoS ONE 9:e89549. doi: 10.1371/journal.pone.0089549
Dupont, C. L., McCrow, J. P., Valas, R., Moustafa, A., Walworth, N., Goodenough, U., et al. (2015). Genomes and gene expression across light and productivity gradients in eastern subtropical Pacific microbial communities. ISME J. 9, 1076–1092. doi: 10.1038/ismej.2014.198
Dupont, C. L., Rusch, D. B., Yooseph, S., Lombardo, M. J., Richter, R. A., Valas, R., et al. (2012). Genomic insights to SAR86, an abundant and uncultivated marine bacterial lineage. ISME J. 6, 1186–1199. doi: 10.1038/ismej.2011.189
Eddy, S. R. (2011). Accelerated profile HMM searches. PLoS Comput. Biol. 7:e1002195. doi: 10.1371/journal.pcbi.1002195
Edgar, R. C. (2004). MUSCLE: multiple sequence alignment with high accuracy and high throughput. Nucleic Acids Res. 32, 1792–1797. doi: 10.1093/nar/gkh340
Eiler, A., Heinrich, F., and Bertilsson, S. (2012). Coherent dynamics and association networks among lake bacterioplankton taxa. ISME J. 6, 330–342. doi: 10.1038/ismej.2011.113
Finn, R. D., Bateman, A., Clements, J., Coggill, P., Eberhardt, R. Y., Eddy, S. R., et al. (2014). Pfam: the protein families database. Nucleic Acids Res. 42, D222–D230. doi: 10.1093/nar/gkt1223
Fuhrman, J. A. (2009). Microbial community structure and its functional implications. Nature 459, 193–199. doi: 10.1038/nature08058
Fuhrman, J. A., and Steele, J. A. (2008). Community structure of marine bacterioplankton: patterns, networks, and relationships to function. Aquat. Microb. Ecol. 53, 69–81. doi: 10.3354/ame01222
Gifford, S. M., Sharma, S., Booth, M., and Moran, M. A. (2013). Expression patterns reveal niche diversification in a marine microbial assemblage. ISME J. 7, 281–298. doi: 10.1038/ismej.2012.96
Gilbert, J. A., Steele, J. A., Caporaso, J. G., Steinbrück, L., Reeder, J., Temperton, B., et al. (2012). Defining seasonal marine microbial community dynamics. ISME J. 6, 298–308. doi: 10.1038/ismej.2011.107
Konopka, A., Lindemann, S., and Fredrickson, J. (2015). Dynamics in microbial communities: unraveling mechanisms to identify principles. ISME J. 9, 1488–1495. doi: 10.1038/ismej.2014.251
Krzywinski, M., Birol, I., Jones, S. J., and Marra, M. A. (2011). Hive plots—rational approach to visualizing networks. Brief. Bioinform. 13, 627–644. doi: 10.1093/bib/bbr069
Laamanen, M., and Kuosa, H. (2005). Annual variability of biomass and heterocysts of the N2-fixing cyanobacterium Aphanizomenon flos-aquae in the Baltic Sea with reference to Anabaena spp. and Nodularia spumigena. Boreal Environ. Res. 10, 19–30.
Labrenz, M., Sintes, E., Toetzke, F., Zumsteg, A., Herndl, G. J., Seidler, M., et al. (2010). Relevance of a crenarchaeotal subcluster related to Candidatus Nitrosopumilus maritimus to ammonia oxidation in the suboxic zone of the central Baltic Sea. ISME J. 4, 1496–1508. doi: 10.1038/ismej.2010.78
Langfelder, P., and Horvath, S. (2008). WGCNA: an R package for weighted correlation network analysis. BMC Bioinformatics 9:559. doi: 10.1186/1471-2105-9-559
Legrand, C., Fridolfsson, E., Bertos-Fortis, M., Lindehoff, E., Larsson, P., Pinhassi, J., et al. (2015). Interannual variability of phyto-bacterioplankton biomass and production in coastal and offshore waters of the Baltic Sea. Ambio 44, 427–438. doi: 10.1007/s13280-015-0662-8
Letunic, I., and Bork, P. (2016). Interactive tree of life (iTOL) v3: an online tool for the display and annotation of phylogenetic and other trees. Nucleic Acids Res. 44, W242–W245. doi: 10.1093/nar/gkw290
Lindh, M. V., Sjöstedt, J., Andersson, A. F., Baltar, F., Hugerth, L. W., Lundin, D., et al. (2015). Disentangling seasonal bacterioplankton population dynamics by high-frequency sampling. Environ. Microbiol. 17, 2459–2476. doi: 10.1111/1462-2920.12720
Louati, I., Pascault, N., Debroas, D., Bernard, C., Humbert, J. F., and Leloup, J. (2015). Structural diversity of bacterial communities associated with bloom-forming freshwater cyanobacteria differs according to the cyanobacterial genus. PLoS ONE 10:e0140614. doi: 10.1371/journal.pone.0140614
Ludwig, W., Strunk, O., Westram, R., Richter, L., Meier, H., Yadhukumar, et al. (2004). ARB: a software environment for sequence data. Nucleic Acids Res. 32, 1363–1371. doi: 10.1093/nar/gkh293
Moisander, P. H., Steppe, T. F., Hall, N. S., Kuparinen, J., and Paerl, H. W. (2003). Variability in nitrogen and phosphorus limitation for Baltic Sea phytoplankton during nitrogen-fixing cyanobacterial blooms. Mar. Ecol. Prog. Ser. 262, 81–95. doi: 10.3354/meps262081
Moran, M. A., Kujawinski, E. B., Stubbins, A., Fatland, R., Aluwihare, L. I., Buchan, A., et al. (2016). Deciphering ocean carbon in a changing world. Proc. Natl. Acad. Sci. U.S.A. 113, 3143–3151. doi: 10.1073/pnas.1514645113
Olofsson, M., Egardt, J., Singh, A., and Ploug, H. (2016). Inorganic phosphorus enrichments in Baltic Sea water have large effects on growth, carbon fixation, and N2 fixation by Nodularia spumigena. Aquat. Microb. Ecol. 77, 111–123. doi: 10.3354/ame01795
Palovaara, J., Akram, N., Baltar, F., Bunse, C., Forsberg, J., Pedrós-Alió, C., et al. (2014). Stimulation of growth by proteorhodopsin phototrophy involves regulation of central metabolic pathways in marine planktonic bacteria. Proc. Natl. Acad. Sci. U.S.A. 111, E3650–E3658. doi: 10.1073/pnas.1402617111
Patrauchan, M. A., Miyazawa, D., LeBlanc, J. C., Aiga, C., Florizone, C., Dosanjh, M., et al. (2012). Proteomic analysis of survival of Rhodococcus jostii RHA1 during carbon starvation. Appl. Environ. Microbiol. 78, 6714–6725. doi: 10.1128/AEM.01293-12
Peng, Y., Liu, L., Jiang, L., and Xiao, L. (2017). The roles of cyanobacterial bloom in nitrogen removal. Sci. Total Environ. 609, 297–303. doi: 10.1016/j.scitotenv.2017.03.149
Pinhassi, J., and Hagström, Å. (2000). Seasonal succession in marine bacterioplankton. Aquat. Microb. Ecol. 21, 245–256. doi: 10.3354/ame.021245
Price, M. N., Dehal, P. S., and Arkin, A. P. (2010). FastTree 2 – approximately maximum-likelihood trees for large alignments. PLoS ONE 5:e9490. doi: 10.1371/journal.pone.0009490
R Core Team (2014). R: A Language and Environment for Statistical Computing. Vienna: R Foundation for Statistical Computing. Available online at: http://www.R-project.org/
Selengut, J. D., Haft, D. H., Davidsen, T., Ganapathy, A., Gwinn-Giglio, M., Nelson, W. C., et al. (2007). TIGRFAMs and Genome Properties: tools for the assignment of molecular function and biological process in prokaryotic genomes. Nucleic Acids Res. 35, D260–D264. doi: 10.1093/nar/gkl1043
Sellner, K. G., Brownlee, D. C., Bundy, M. H., Brownlee, S. G., and Braun, K. (1993). Zooplankton grazing in a potomac river cyanobacteria bloom. Estuaries 16, 859–872. doi: 10.2307/1352445
Seymour, J. R., Ahmed, T., Durham, W. M., and Stocker, R. (2010). Chemotactic response of marine bacteria to the extracellular products of Synechococcus and Prochlorococcus. Aquat. Microb. Ecol. 59:161. doi: 10.3354/ame01400
Stal, L. J. (2009). Is the distribution of nitrogen-fixing cyanobacteria in the oceans related to temperature? Environ. Microbiol. 11, 1632–1645. doi: 10.1111/j.1758-2229.2009.00016.x
Stal, L. J., Albertano, P., Bergman, B., von Bröckel, K., Gallon, J. R., Hayes, P. K., et al. (2003). BASIC: Baltic Sea cyanobacteria. An investigation of the structure and dynamics of water blooms of cyanobacteria in the Baltic Sea—responses to a changing environment. Cont. Shelf Res. 23, 1695–1714. doi: 10.1016/j.csr.2003.06.001
Stewart, F. J., Ottesen, E. A., and DeLong, E. F. (2010). Development and quantitative analyses of a universal rRNA-subtraction protocol for microbial metatranscriptomics. ISME J. 4, 896–907. doi: 10.1038/ismej.2010.18
Stingl, U., Desiderio, R. A., Cho, J. C., Vergin, K. L., and Giovannoni, S. J. (2007). The SAR92 clade: an abundant coastal clade of culturable marine bacteria possessing proteorhodopsin. Appl. Environ. Microbiol. 73, 2290–2296. doi: 10.1128/AEM.02559-06
Teeling, H., Fuchs, B. M., Becher, D., Klockow, C., Gardebrecht, A., Bennke, C. M., et al. (2012). Substrate-controlled succession of marine bacterioplankton populations induced by a phytoplankton bloom. Science 336, 608–611. doi: 10.1126/science.1218344
Teeling, H., Fuchs, B. M., Bennke, C. M., Krüger, K., Chafee, M., Kappelmann, L., et al. (2016). Recurring patterns in bacterioplankton dynamics during coastal spring algae blooms. Elife 5:e11888. doi: 10.7554/eLife.11888
Tuomainen, J. M., Hietanen, S., Kuparinen, J., Martikainen, P. J., and Servomaa, K. (2003). Baltic Sea cyanobacterial bloom contains denitrification and nitrification genes, but has negligible denitrification activity. FEMS Microbiol. Ecol. 45, 83–96. doi: 10.1016/S0168-6496(03)00131-4
Vahtera, E., Autio, R., Kaartokallio, H., and Laamanen, M. (2010). Phosphate addition to phosphorus-deficient Baltic Sea plankton communities benefits nitrogen-fixing Cyanobacteria. Aquat. Microb. Ecol. 60:43. doi: 10.3354/ame01408
van Hannen, E. J., Zwart, G., van Agterveld, M. P., Gons, H. J., Ebert, J., and Laanbroek, H. J. (1999). Changes in bacterial and eukaryotic community structure after mass lysis of filamentous cyanobacteria associated with viruses. App. Environ. Microbiol. 65, 795–801.
Voß, B., Bolhuis, H., Fewer, D. P., Kopf, M., Möke, F., Haas, F., et al. (2013). Insights into the physiology and ecology of the brackish-water-adapted cyanobacterium Nodularia spumigena CCY9414 based on a genome-transcriptome analysis. PLoS ONE 8:e60224. doi: 10.1371/journal.pone.0060224
Wacklin, P., Hoffmann, L., and Komárek, J. (2009). Nomenclatural validation of the genetically revised cyanobacterial genus Dolichospermum (Ralfs ex Bornet et Flahault) comb. nova. Fottea 9, 59–64. doi: 10.5507/fot.2009.005
Wasmund, N., Voss, M., and Lochte, K. (2001). Evidence of nitrogen fixation by non-heterocystous cyanobacteria in the Baltic Sea and re-calculation of a budget of nitrogen fixation. Mar. Ecol. Progr. Ser. 214, 1–14. doi: 10.3354/meps214001
Keywords: cyanobacteria, Baltic Sea, metatranscriptomics, WGCNA, glyoxylate shunt, autotrophy, nifH, amoA
Citation: Berg C, Dupont CL, Asplund-Samuelsson J, Celepli NA, Eiler A, Allen AE, Ekman M, Bergman B and Ininbergs K (2018) Dissection of Microbial Community Functions during a Cyanobacterial Bloom in the Baltic Sea via Metatranscriptomics. Front. Mar. Sci. 5:55. doi: 10.3389/fmars.2018.00055
Received: 23 October 2017; Accepted: 06 February 2018;
Published: 21 February 2018.
Edited by:
Marcelino T. Suzuki, Université Pierre et Marie Curie, FranceReviewed by:
Vera Tai, University of Western Ontario, CanadaKalle Olli, University of Tartu, Estonia
Copyright © 2018 Berg, Dupont, Asplund-Samuelsson, Celepli, Eiler, Allen, Ekman, Bergman and Ininbergs. This is an open-access article distributed under the terms of the Creative Commons Attribution License (CC BY). The use, distribution or reproduction in other forums is permitted, provided the original author(s) and the copyright owner are credited and that the original publication in this journal is cited, in accordance with accepted academic practice. No use, distribution or reproduction is permitted which does not comply with these terms.
*Correspondence: Carlo Berg, Y2FybG8uYmVyZ0BzY2lsaWZlbGFiLnNl; Y2JAZWR1LmNiZXJnLmRl