 Yoshimi M. Rii
 Robert R. Bidigare2,3
 Matthew J. Church
- 1Department of Oceanography, University of Hawaii at Mānoa, Honolulu, HI, United States
- 2Daniel K. Inouye Center for Microbial Oceanography: Research and Education, University of Hawaii at Mānoa, Honolulu, HI, United States
- 3Hawaii Institute of Marine Biology, University of Hawaii at Mānoa, Kāne‘ohe, HI, United States
Fixed inorganic nitrogen (N) is persistently scarce in the well-lit regions of the subtropical ocean gyres and its supply plays an important role in controlling phytoplankton productivity. In a series of experiments conducted in the North Pacific Subtropical Gyre (NPSG), we examined changes in primary productivity and eukaryotic phytoplankton community structure in response to additions of nitrate (NO3-), ammonium (NH4+), or urea in conjunction with phosphate and silicic acid. Overall, we observed large increases in rates of 14C-primary productivity (~2- to 27-fold) and concentrations of chlorophyll a (~2- to 7-fold) following N addition. Much of the physiological response was due to larger (>3 μm) phytoplankton, whose contributions to primary productivity increased ~2-fold while picophytoplankton (0.2–3 μm) contributions decreased by a similar proportion. Five experiments, conducted in the spring, summer and winter, revealed apparent seasonally-dependent responses in phytoplankton community structure to N availability. During the summer, pennate diatoms increased significantly following N addition as evidenced by both photosynthetic pigment analyses and high-throughput sequencing of 18S rDNA. For example, following the addition of N substrates, concentrations of fucoxanthin (a diatom pigment biomarker) increased between 23- and 49-fold, and relative abundances of rRNA genes belonging to Pseudo-nitzschia increased from negligible (~0.3%) to 30–60% of the >3 μm phytoplankton assemblage. However, unlike the diatom-driven responses observed in the summer, experiments conducted in the spring and winter demonstrated large increases in concentrations of 19′-butanoyloxyfucoxanthin (a pelagophyte pigment biomarker) together with increases in the relative abundance of rRNA genes clustering among Pelagomonas. Overall, our findings revealed differences in the responses of major taxa during experiments conducted in different times of the year, with concomitant impacts on patterns of phytoplankton diversity. In addition, the overall responses in chlorophyll a, 14C-primary production, and eukaryotic phytoplankton community composition appeared largely independent of the type of N substrate added. Our results highlight seasonal-scale differences on the role of N availability in shaping eukaryotic phytoplankton diversity in the surface waters of the oligotrophic NPSG.
Introduction
In oligotrophic marine ecosystems such as the North Pacific Subtropical Gyre (NPSG), less than 10% of organic matter produced is exported out of the euphotic zone as sinking particles, implying rapid organic matter turnover and nutrient remineralization (Karl et al., 1996). Such low organic matter export in these regions has been attributed to the restricted supply of inorganic nutrients such as nitrogen (N) and phosphorus (P) to the euphotic zone (Karl, 2002; Arrigo, 2005). Concentrations of nitrate + nitrite (N+N) and ammonium () in the near-surface waters of the NPSG are typically <5 and <50 nM, respectively (Wada and Hattori, 1990; Karl et al., 2001). Hence, competition for limiting N could be central to structuring the productivity and diversity of planktonic communities in this ecosystem.
N availability in the euphotic zone of the NPSG varies on seasonal, event-, to interannual scales, exerting important control on plankton community succession, primary productivity, and particulate matter export in this oligotrophic habitat. Seasonal variability of nutrients in the euphotic zone is partly controlled by variations in the penetration of light. For example, the flux of light penetrating to the dimly lit regions of the euphotic zone varies seasonally, and as a result, nitrate () concentrations accumulate during the winter (Letelier et al., 2004). The accumulated nutrients are subsequently consumed when the flux of light to the lower euphotic zone increases during the spring (Letelier et al., 2004). Additionally, episodic to seasonal-scale supply of to the lower euphotic zone can occur through convective mixing and displacement of isopycnal surfaces due to mesoscale processes such as eddies and planetary waves (Dandonneau et al., 2003; Sakamoto et al., 2004; Johnson et al., 2010). In addition, activities of N2-fixing microorganisms increase during the warm, stratified summer months (Church et al., 2009), increasing concentrations of dissolved organic N and in the surface waters (Karl et al., 1992, 1997).
Although picoplanktonic cyanobacteria are dominant contributors to biomass and rates of gross primary production in oligotrophic ocean ecosystems (Campbell et al., 1994; Karl, 1999; Karl and Church, 2017), eukaryotic phytoplankton play central roles in controlling material export, net community production, and nutrient cycling in these ecosystems (Benitez-Nelson et al., 2007; Juranek et al., 2012; Alexander et al., 2015). In the NPSG, analyses of photosynthetic pigment concentrations and quantification of cell abundances (by both microscopy and flow cytometry) has revealed that major taxa of eukaryotic phytoplankton distributed throughout the upper ocean include diatoms, haptophytes, pelagophytes, and dinoflagellates (Bienfang and Szyper, 1981; Campbell and Vaulot, 1993; Venrick, 1997; Cortés et al., 2001). Moreover, distributions and abundances of these eukaryotic phytoplankton are temporally and spatially variable, fluctuating in response to physical and chemical changes to the upper ocean habitat. For example, sampling of two cyclonic eddies with varying rates of nutrient input (as a result of spin-up duration) in the oligotrophic waters southwest of the Hawaiian islands revealed disparities in major eukaryotic phytoplankton response within each eddy, with subsequent consequences in food web structure and carbon export (Benitez-Nelson et al., 2007; Rii et al., 2008). Additionally, observations at Station ALOHA to the north of the Hawaiian islands have highlighted the important role of diatoms in regulating carbon export (Karl et al., 2012). Notably, peaks in diatom-driven export coincides with summertime periods when rates of N2 fixation and biomass of N2-fixing cyanobacteria are elevated (Dore et al., 2008; Villareal et al., 2011; Karl et al., 2012).
Past studies have demonstrated preferential uptake of relative to by phytoplankton, a finding hypothesized to reflect the energetic savings in assimilating reduced forms of N (e.g., Eppley et al., 1977; Dortch, 1990). However, various field-based studies have concluded that cyanobacteria and eukaryotic phytoplankton in the oligotrophic oceans may rely on different forms of N to support their growth (Fawcett et al., 2011; Shilova et al., 2017). Such results highlight the potential role for different forms of N in controlling time-varying phytoplankton community structure. To date, however, there is limited information available on how different taxa of phytoplankton respond to changes in the availability and form of N substrates.
In the current study, we experimentally examined responses in upper ocean primary productivity and eukaryotic phytoplankton community structure to N enrichments at Station ALOHA. In five separate experiments, natural seawater plankton communities were treated with additions of or (or urea in one experiment) and sampled daily over a 120- to 144-hour period. We sought to determine which eukaryotic phytoplankton assemblages responded to the additions of nitrogenous substrates and over what time-scales, providing insight into how variations in the availability of nitrogenous nutrients contribute to variability in phytoplankton community structure and growth in the euphotic zone of oligotrophic subtropical gyres.
Materials and Methods
Experimental Design
Experiments were conducted between July 2011 and April 2013 during five research cruises to Station ALOHA (22.75°N, 158°W), the well-characterized study site of the Hawaii Ocean Time-series (HOT) program (Karl and Lukas, 1996). Sampling occurred during HOT 233 (July 2011; “NvN1”), HOT 240 (March 2012; “NvN2”), HOE-DYLAN V (July 2012; “NvN3”), HOT 248 (December 2012; “N248”), and HOT 251 (April 2013; “NvN4”) aboard the R/V Kilo Moana (Table 1). Seawater was collected in 12-L polyvinylchloride bottles affixed to a 24-bottle rosette sampler equipped with a Sea-Bird 911+ conductivity, temperature, and pressure sensors. Nine 20-L polycarbonate carboys were filled with seawater from 25 m that was pre-filtered from the rosette sampler through a Nitex screen (mesh size ~202 μm) to exclude larger zooplankton. Three carboys received additions of (target 2.8 μM N final concentration as NaNO3) and three carboys received additions of (target 2.8 μM N final concentration as NH4Cl). All carboys, including three “Control” carboys, received additions of phosphate (; target ~0.2 μM P final concentration as KH2PO4) and silicic acid (Si(OH)4; target 2.8 μM Si final concentration as Na2SiO3) to achieve a final N:P:Si stoichiometric ratio of 14:1:14 in the treatment carboys, similar to the stoichiometry of these nutrients in the sub-euphotic zone (~300 m) waters at Station ALOHA (Table 2). For the experiment conducted in December 2012 (N248), the setup was identical to that described above except 10-L carboys were used and three additional carboys were enriched with urea [target 2.8 μM N final concentration as CO(NH2)2]. All carboys were incubated for 120–144 h and subsampled at approximately daily timescales throughout the experiment (Table 1). All sampling was conducted before sunrise in order to allow primary productivity measurements to span the full photoperiod. Incubators used for the experiments were covered with blue Plexiglas filters shaded to 50% of the surface photosynthetic active radiation (PAR). Temperature and solar irradiance levels were monitored continuously throughout the experiment using a waterproof temperature/light logger (HOBO Pendant® UA-002-08). Accompanying physical and biogeochemical properties at the time of sampling for these experiments were obtained from the HOT program database (http://hahana.soest.hawaii.edu/hot/hot-dogs/).
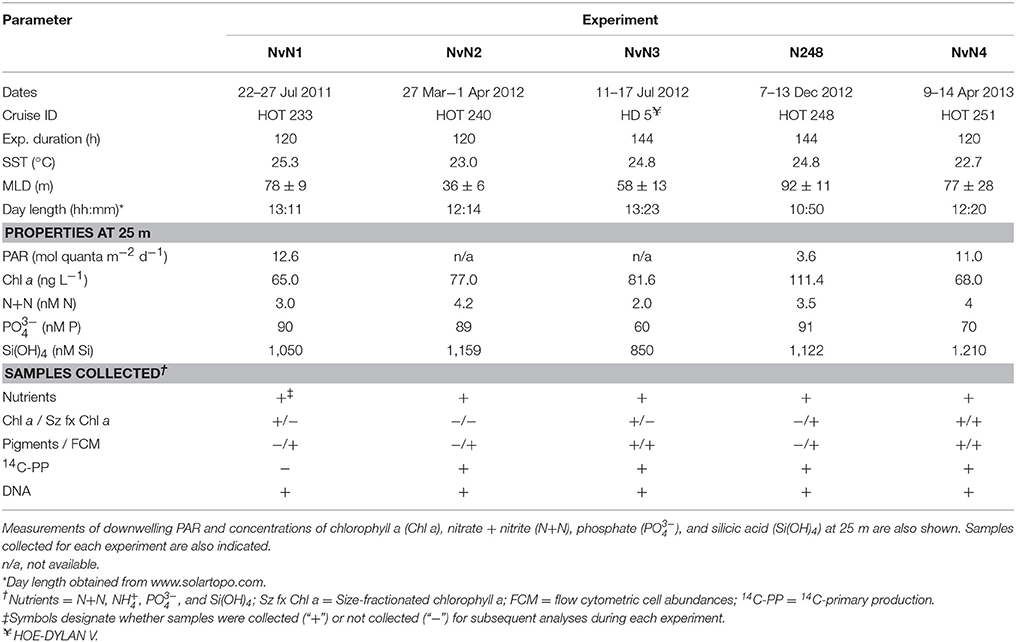
Table 1. Dates, cruise ID, duration, sea surface temperature (SST), mixed layer depth (MLD), and day length when each experiment was conducted.
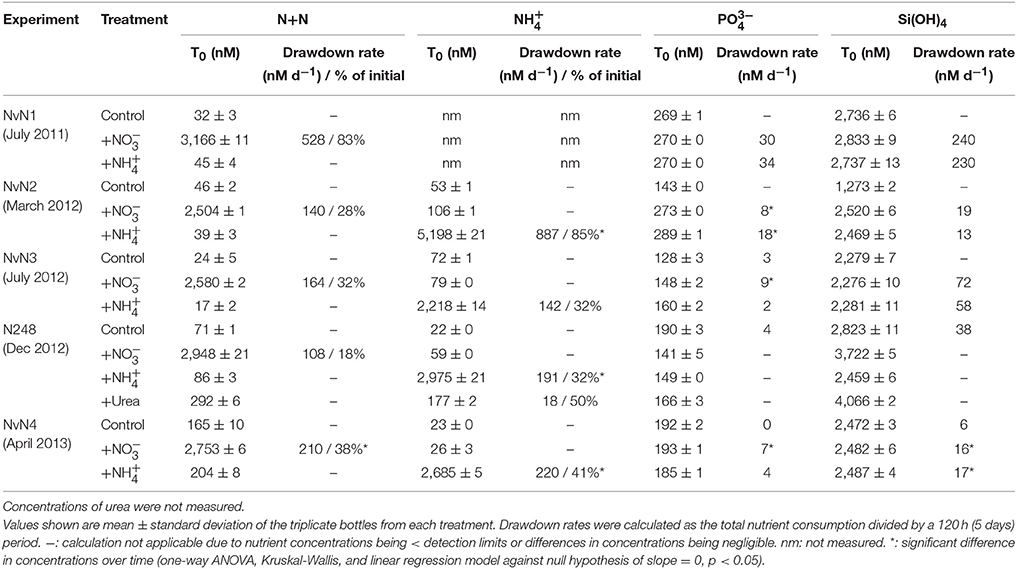
Table 2. Concentrations and rates of consumption of N+N, , , and Si(OH)4 at initial time point (T0) of experiments.
Nutrient Analyses
Nutrient samples were collected at each time point in 125- or 500-mL acid-washed high density polyethylene (HDPE) bottles and frozen upright at −20°C until analyzed. Concentrations of N+N, , and Si(OH)4 were determined using a 3-channel, Bran+Luebbe AA III™ continuous segmented flow autoanalyzer (Armstrong et al., 1967; Bernhardt and Wilhelms, 1967; Atlas et al., 1971). Detection limits for the instrumental settings used, defined as the lowest resolvable concentrations for each analysis, were 58 nM N+N, 14 nM , and 13 nM Si(OH)4. concentrations were determined on a hybrid SEAL AA III coupled with a 2 m liquid waveguide capillary detection cell with modified chemistry and an indo-phenol blue reaction (Li et al., 2005). The limit of detection for this method was 4 nM .
14C-Based Rates of Primary Production
Rates of size-fractionated (0.2–3 μm and >3 μm) primary production were assessed based on the assimilation of 14C-bicarbonate into particulate organic matter (Steeman Nielsen, 1952). Seawater was collected into 30-mL polycarbonate centrifuge tubes (Nalgene™ Oak Ridge) before sunrise and spiked under subdued light with 70 μL of NaH14 (MP Biomedicals 1,7441H, stock concentration 2 mCi mL−1) to a final activity of ~0.14 MBq mL−1. The tubes were placed in white mesh bags in the same incubator as the experiment carboys over the full photoperiod (~12–14 h). After sundown, 25 μL aliquots from each sample were collected and stored in 20-mL glass scintillation vials containing 500 μL of β-phenylethylamine to determine the total activity of 14C added to each sample. The remaining sample volume (~25 mL) was serially vacuum-filtered, first onto 25 mm diameter, 3 μm pore size polycarbonate membranes (Millipore Isopore™), then onto 25 mm diameter, 0.2 μm pore size membranes (GE Osmonics polycarbonate track-etched). After filtration, each filter was placed in 20-mL glass scintillation vials, to which 1 mL of 2 M hydrochloric acid was added and vented for at least 24 h to remove adsorbed 14C-bicarbonate. Ten mL of Ultima Gold liquid scintillation cocktail was then added to each vial and placed in a liquid scintillation counter (Packard TRI-Carb 4640) for the determination of 14C activities. 14C-assimilation rates were calculated based on the resulting radioactivity of the filters, total added activity, and dissolved inorganic carbon concentrations derived from respective water depths at Station ALOHA (Letelier et al., 1996).
Photosynthetic Eukaryote Cell Abundance
Seawater samples (2 mL) for photosynthetic eukaryote cell abundance measurements were collected for each experiment into cryotubes (Corning) containing 30 μL of 16% paraformaldehyde (PFA, in water, Alfa Aesar 43,368) for a final concentration of 0.24% (w/v), kept for 15 m in the dark, flash-frozen in liquid nitrogen, and stored at −80°C until analyzed. Photosynthetic eukaryote cells were distinguished using a BD InfluxTM flow cytometer (80 μm nozzle tip) with the data acquisition software Spigot. Microspherical beads (1 μm Fluoresbrite, Polysciences) were included per sample for size reference during enumeration. Phytoplankton cells were triggered on forward scatter (FSC) and enumerated based on FSC, side scatter, chlorophyll-based red fluorescence (692 ± 20 nm), and phycoerythrin-based orange fluorescence (585 ± 20 nm) on two lasers, 488 and 457 nm through separate pinholes. To determine photosynthetic eukaryote cell counts, cyanobacteria Prochlorococcus and Synechococcus cells were first identified based on red fluorescence signals against FSC, then further gated by side scatter and orange fluorescence (the two lasers were used to improve identification of Prochlorococcus). Photosynthetic eukaryote cells were then distinguished as those excluding the cyanobacteria and based on high red fluorescence and low orange fluorescence in reference to FSC. Cell counts were calculated using the data analysis software FlowJo 10.0.7.
Photosynthetic Pigments
For measurements of size-fractionated chlorophyll a (Chl a), 250 mL of seawater was collected in amber HDPE bottles and serially filtered using a peristaltic pump, first onto 25 mm diameter, 3 μm pore size polycarbonate membranes (Millipore Isopore™), then onto 25 mm diameter, GF/F (Whatman®) filters (nominal pore size ~0.7 μm). Though different filters were used for Chl a concentrations and 14C-primary production measurements, previous analyses at Station ALOHA indicate Chl a concentrations estimated using 0.2 μm polycarbonate and GF/F glass fiber filters are comparable (Viviani et al., 2015). After filtration, filters were immediately submerged in 5 mL of 100% acetone in glass culture tubes which were wrapped in aluminum foil, and stored at −20°C for pigment extraction. After 7 days, tubes containing the filters were warmed to room temperature, and Chl a concentrations in the extracts were quantified using a Turner Designs 10-AU fluorometer (Strickland and Parsons, 1972).
For photosynthetic pigment analyses using high-performance liquid chromatography (HPLC), seawater (2 L) was collected into brown, narrow-mouthed HDPE bottles and subsequently filtered using a peristaltic pump onto 25 mm diameter, GF/F (Whatman®) filters. Filters were immediately flash-frozen in liquid nitrogen and stored at −80°C until analyzed. Photosynthetic pigments were extracted from the filters in 3 mL 100% acetone (HPLC grade) in culture tubes along with 50 μL canthaxanthin, an internal standard, and placed at 4°C for 24 h. Chlorophyll and carotenoid pigments were separated on a Varian 9012 HPLC system (Waters Spherisorb® 5 μm ODS-2 C18 column with a corresponding guard cartridge and a Timberline column heater) and analyzed using SpectraSYSTEM Thermo Separation Products dual wavelength UV/VIS UV2000 and fluorescence FL2000 detectors (Wright et al., 1991; Bidigare et al., 2005). Pigment identifications were based on absorbance spectra, co-chromatography with standards, and relative retention time with a monovinyl Chl a standard and representative culture extracts, and Spectra-Physics WOW® software was used to calculate peak area.
DNA Extraction, PCR, and Sequence Analyses
Seawater samples (2 L) for subsequent extraction of planktonic DNA were collected into acid-washed low density polyethylene (LDPE) bottles and serially filtered using a peristaltic pump through 25 mm diameter, 3 μm pore size polycarbonate membranes (Millipore Isopore™), then onto 25 mm diameter, 0.2 μm pore size polyethersulfone membranes (Pall Supor®). After filtration, filters were placed in 1.5-mL microcentrifuge tubes, immediately flash-frozen in liquid nitrogen, and stored at −80°C until analyzed. DNA was extracted and purified using the QIAGEN DNeasy Plant Mini Kit including a bead-beating step (with 0.1 and 0.5 mm beads) and Proteinase K (360 mAU mL−1 final activity, QIAGEN) for additional cell disruption and lysing (Paerl et al., 2008). Extracts were eluted in 200 μL of nuclease-free PCR grade water.
The V9 regions of eukaryote 18S rRNA genes were amplified using the PCR primer pairs 1391F (5′-GTACACACCGCCCGTC-3′; S. cerevisiae NCBI GenBank Accession #U53879 position 1629–1644; Lane, 1991) and Euk Br (5′-TGATCCTTCTGCAGGTTCACCTAC-3′; S. cerevisiae NCBI GenBank Accession #U53879 position 1774-1797; Medlin et al., 1988; Amaral-Zettler et al., 2009) containing unique barcode indices. Each PCR reaction contained both primers (0.2 μM final concentration), 1X 5 PRIME HotMasterMix (Cat# 2200410), and ~5 ng of template DNA in a 25 μL reaction (Amaral-Zettler et al., 2009). The thermal cycling conditions consisted of an initial activation step at 94°C for 3 min, followed by 35 cycles of 45 s at 94°C, 60 s at 57°C, and 90 s at 72°C, ending with a final extension of 10 min at 72°C. The resulting PCR products (344 in total) were run on an agarose gel to verify product amplification, quantified, pooled (~8 ng of each sample into a single tube), and purified using the MoBio UltraClean PCR Clean-Up Kit (Cat# 12500). The quality of the pooled PCR product was evaluated on a BioAnalyzer 2100 (Agilent). Sequencing was conducted (paired end, 300 cycles) on an Illumina MiSeq (University of Hawaii Core Functional Genomics Facility at the Hawaii Institute of Marine Biology), from which individual samples were demultiplexed using QIIME (Caporaso et al., 2012) and 12,193,511 total sequence reads were recovered. Paired-end sequencing reads were merged using PEAR (Zhang et al., 2014), quality filtered (reads trimmed to 100–150 bp in size, maximum expected error of 1%, no ambiguous bases allowed, and an average Phred quality threshold >34), and poor quality reads were removed from further analyses. De novo and reference-based chimeras were detected and removed using USEARCH v7.0.1090 (Edgar et al., 2011). Sequences were first clustered using UCLUST v1.2.22q (max accepts = 20, max rejects = 500) into operational taxonomic units (OTUs) based on the SILVA 119 (pre-clustered at 97% similarity threshold) database (Quast et al., 2012), clustered de novo at the 97% similarity threshold, and the centroid sequence within each OTU was selected as the representative sequence. Sequences that failed to align using PyNAST (minimum percent identification 0.75; Caporaso et al., 2010), singletons, and OTUs present in only one sample were removed. Taxonomy was assigned to representative sequences at 90% similarity with BLAST (max E-value at 1 × e−30) based on the SILVA 119 database (pre-clustered at 97%). Bacteria, Archaea, and Metazoa sequences were removed, resulting in 5,820,084 sequence reads and 11,811 total OTUs. Of these, taxonomy was not assigned to 2,800 OTUs consistent with the stringent E-value used. OTUs with assigned taxonomy presumed to be photosynthetic, including Archaeplastida, Dinophyceae, Cryptophyceae, Haptophyta, Chlorarachniophyta, and Ochrophyta (Bacillariophyceae, Bolidophyceae, Chrysophyceae, Dictyochophyceae, Eustigmatophyceae, Pelagophyceae, and Raphidophyceae), were separated into a “phytoplankton-only” OTU table which was used for subsequent analyses. Final quality-filtered sequences were deposited in the Sequence Read Archive in NCBI under BioProject ID PRJNA357861 and Accession #SRP095616.
Statistical Analyses
Nutrient concentrations measured in each treatment and experiment were tested for normality using the Shapiro-Wilk Test (Royston, 1982) and quantile-quantile plots, and analysis of variance (ANOVA) tests were performed. Data not normally distributed were log-transformed and ANOVA or non-parametric Kruskal-Wallis tests (Hollander and Wolfe, 1973) were used to test for significant differences between distributions. One-way ANOVA and linear regression analyses were also used to test for significant differences in nutrient concentrations over the duration of the experiment (Faraway, 2002). Community analyses were performed in R 3.1.1. (R Core Development Team, 2014) with the R package Vegan (Oksanen et al., 2007) and graphical outputs were constructed with the package ggplot2 (Wickham, 2009). Subsampling for calculations of alpha diversity was conducted with 150 reads. Differences in eukaryotic phytoplankton community composition and alpha diversity between experiments were statistically tested using Mantel tests on Bray-Curtis derived dissimilarity matrices and paired t-tests on distribution of Shannon indices.
Results
Station ALOHA Conditions at Initial Time Points
Two experiments were conducted during the summer (NvN1 in July 2011 and NvN3 in July 2012), two were performed during the spring months (NvN2 in March 2012 and NvN4 in April 2013), and one was conducted during the winter (N248 in December 2012; Table 1). At the time these experiments were conducted, sea surface temperatures (SST), mixed layer depths (MLD), and the flux of PAR and concentrations of N+N at 25 m were characteristic of the monthly HOT program climatology for Station ALOHA (Figure 1). During the summer sampling periods the near-surface waters were characterized by relatively warm temperatures (24.8–25.3°C), the MLD ranged between 58 and 78 m, and the flux of PAR at 25 m was 12.6 mol quanta m−2 d−1 (Table 1, Figure 1). In comparison, during the spring experiments the upper ocean waters exhibited slightly lower temperatures (22.7–23.0°C), the MLD ranged between 36 and 77 m, and incident PAR at 25 m was 11 mol quanta m−2 d−1. For the experiment conducted in December, the near-surface waters were 24.8°C, the MLD was relatively deep (averaging 92 m), and incident PAR at 25 m was ~3-fold lower than in spring or summer (3.6 mol quanta m−2 d−1). Concentrations of Chl a at 25 m ranged 65–111 ng L−1 during the study, with no discernible seasonal pattern among the various experiments (Table 1). Similarly, concentrations of N+N at 25 m were consistently low (<5 nM N) throughout the year with no apparent seasonal-scale differences (Figure 1D, Table 1). Concentrations of and Si(OH)4 at 25 m also depicted no apparent seasonality, ranging 60–90 nM P and 0.8–1.2 μM Si, respectively (Table 1).
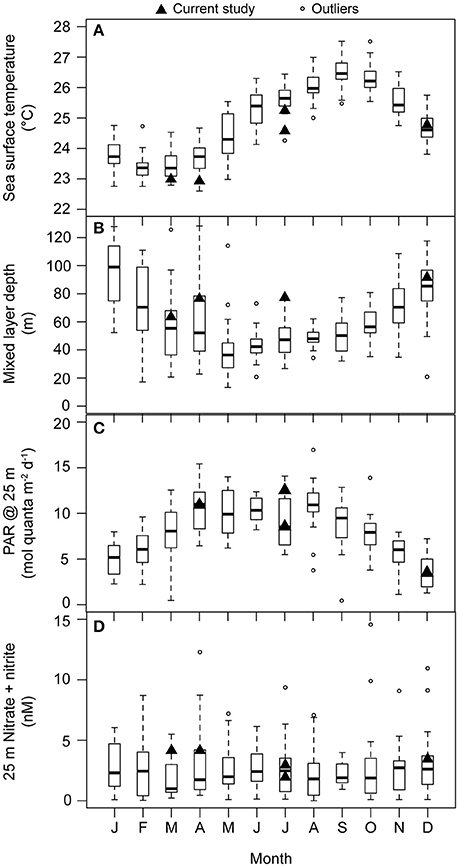
Figure 1. Monthly-scale variability in (A) sea surface temperature (°C; 1988–2014), (B) mixed layer depth (m; 1988–2014), (C) daily integrated PAR at 25 m (mol quanta m−2 d−1; 1998–2013), and (D) concentrations of N+N at 25 m (nM N; 1989–2013) at Station ALOHA. Measurements from the research cruises during which experiments for the current study were conducted are denoted with black triangles. For each boxplot: dark horizontal line indicates the median, the box boundaries represent the 25th and the 75th percentile, and the whiskers extend to the maximum and minimum (boundary ± 1.5*interquartile range) of the selected observations. Outlier observations, considered to be beyond the maximum and minimum limits of the observations, are depicted as open circles.
Nutrients, Primary Production, Chlorophyll a, and Cell Abundances Following N Additions
Concentrations of N+N, , , and Si(OH)4 in the control incubations did not vary significantly over time in any of the experiments (one-way ANOVA and linear regression, p > 0.05; Table 2). The addition of either or (final concentrations ranging ~2504–3166 nM N+N and 2218–5198 nM ) with and Si(OH)4 resulted in significant consumption of added N substrates over time. Over the course of 120 h, 18–83% of the added was consumed in all experiments, resulting in rates of drawdown ranging between 108 and 528 nM N d−1 (Table 2). For the treatments, 32–85% of the added was consumed over the duration of the experiments, with rates of consumption ranging 142–887 nM N d−1 (one-way ANOVA and linear regression p < 0.05). For the experiment conducted in March 2012 (NvN2), the initial concentration (5198 nM) was ~2x greater than the target concentration as well as the initial concentration. The resulting rate of consumption for March 2012 was greater for this treatment than in other treatments (Table 2). For both and treatments, there was no significant change in Si(OH)4 concentrations over the course of the experiments except during April 2013 (Table 2). was consumed in the treatments at rates ranging 7–30 nM P d−1 (with the N:P of consumption being ~14–30), and at the rate of 2–34 nM P d−1 for the treatments (with the stoichiometry of N:P consumption being ~49–71). Urea (target concentration of ~2800 nM N) was also included as one of the treatments in an experiment conducted in December 2012; however, urea concentrations were not measured during the experiment so rates of consumption or production could not be evaluated.
Rates of 14C-primary production and Chl a concentrations in the control incubations remained largely unchanged for the control carboys during the experiments conducted. Contributions of picophytoplankton (0.2–3 μm) to >0.2 μm 14C-primary production at initial time points ranged 68–77% and rates of production in the >3 μm size fraction contributed 23–32% in all experiments except July 2012 (NvN3), when picophytoplankton were 43–60% of the initial 14C-productivity and phytoplankton >3 μm comprised 40–57% of the production (Supplementary Table 1). Concentrations of Chl a remained stable in the control carboys of the experiments, with the majority (75–78%) of the total Chl a attributed to the picophytoplankton fraction (Supplementary Table 1). Photosynthetic eukaryote cell abundances were also relatively stable over time in the control incubations for all experiments except during July 2011 (NvN1), when cell abundances increased ~3-fold (Supplementary Table 1).
Rates of 14C-primary production (sum of >3 μm and 0.2–3 μm filter size classes) in the and treatments differed seasonally. During the experiment conducted in March 2012, 14C-primary production increased ~17-fold in response to addition and 27-fold in response to addition over 120 h, with contributions by the >3 μm fraction in the treatment comprising 75 ± 5% (mean of triplicate treatments) of the sum of two fractions, and rates of production by the >3 μm size class comprising 48 ± 14% (mean of triplicate treatments) of the sum of fractions in the treatment (Supplementary Table 1). The ~1.6-fold greater response in the rate of 14C-primary production in the compared to addition may have resulted from the higher initial concentration in this experiment (Table 2). During July 2012, rates of >0.2 μm 14C-primary production increased ~21 and 15-fold in the and treatments, respectively, with contributions by the >3 μm fraction increasing 2- and 1.5-fold for both treatments, respectively. Chl a concentrations during July 2012 also increased ~5-fold in treatments and ~3-fold in treatments over 120 h. Approximately 2- to 4-fold increases in rates of >0.2 μm 14C-primary production were observed for all N additions during December 2012 and April 2013, with a ~2-fold shift toward >3 μm organisms (Figure 2, Supplementary Table 1). Concentrations of Chl a increased modestly (~1.9 to 2.3-fold) during December 2012 in all N addition treatments, while ~3 to 4-fold increases in Chl a concentrations over 120 h were observed in both and treatments during April 2013 (Figures 3A,B, Supplementary Table 1). For both the winter 2012 and spring 2013 experiments, moderate (~2 to 3-fold) increases in the contributions by the >3 μm size fraction to Chl a concentrations were observed. Cell abundances of photosynthetic eukaryotes increased ~3 to 5-fold in all N additions during all experiments, except for a ~12-fold increase in the treatment during July 2011 (Supplementary Table 1).
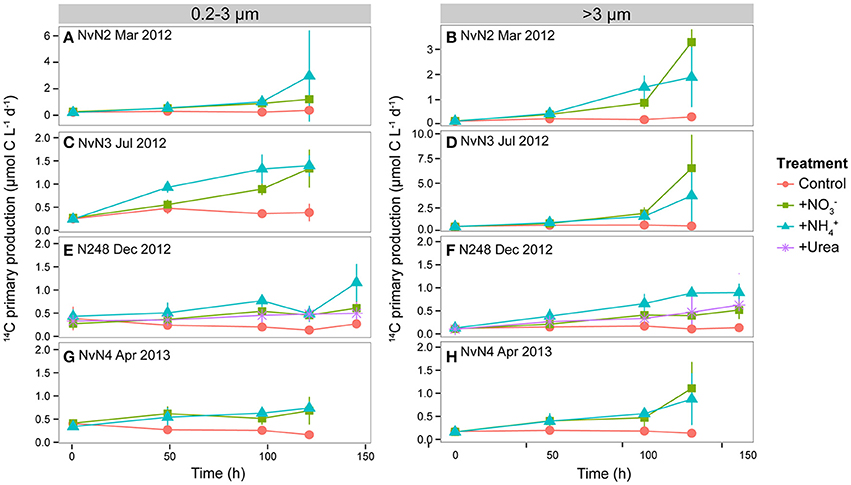
Figure 2. Time dependence in rates of 14C-primary production (μmol C m−3 d−1) by pico- (0.2–3 μm) and larger (>3 μm) phytoplankton during experiments conducted in (A,B) March 2012, (C,D) July 2012, (E,F) December 2012, and (G,H) April 2013. Colors of lines indicate different treatments: Control, +, +, and +Urea. Data points and whiskers indicate means and standard deviations of triplicate carboys. Note differences in y-axis scales for (A,B,D).
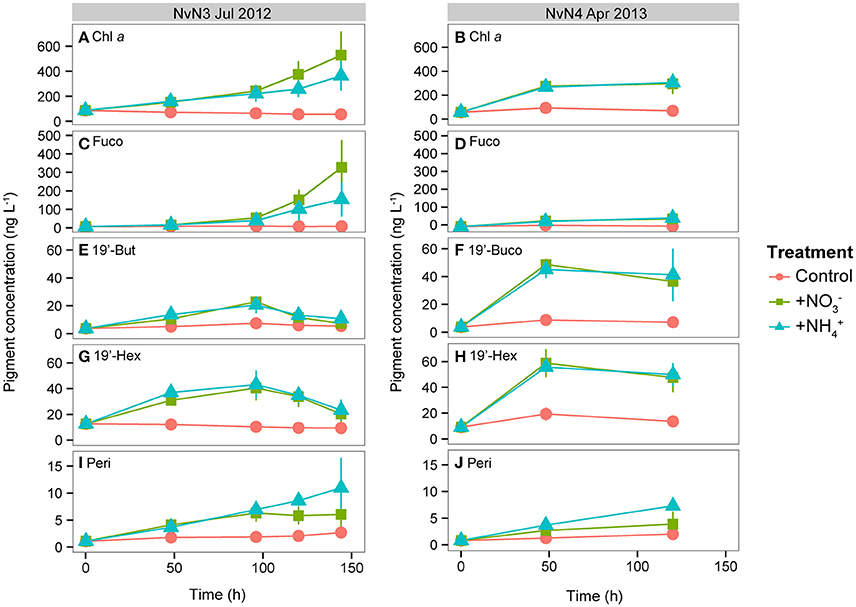
Figure 3. Photosynthetic pigment concentrations (ng L−1) measured during July 2012 and April 2013 from time 0 to end of experiment (120 or 144 h): (A,B) Chl a, (C,D) fucoxanthin (Fuco), (E,F) 19′-butanoyloxyfucoxanthin (19′-But), (G,H) 19′-hexanoyloxyfucoxanthin (19′-Hex), (I,J) peridinin (Peri). Note differences in y-axis scales. Line colors indicate different treatments: Control, +, and +. Data points and whiskers indicate means and standard deviations of triplicate carboys.
Changes in Eukaryotic Phytoplankton Community Composition
Photosynthetic Pigments
Photosynthetic pigments measured during the experiments conducted in July 2012 and April 2013 revealed variations in the timing and magnitude of the responses by different phytoplankton taxa to the various N additions (Figure 3). Initial concentrations of fucoxanthin, a pigment biomarker diagnostic of diatoms, were similar in both July (6.7 ng L−1) and April (5.6 ng L−1); however, large increases (49- and 23-fold increases in the and treatments, respectively) were observed in July (Figure 3C) while modest increases (~9-fold increases in both and treatments) were measured during April (Figure 3D). Pigments diagnostic of pelagophytes (19′-butanoyloxyfucoxanthin, or 19′-But) and prymnesiophytes (19′-hexanoyloxyfucoxanthin, or 19′-Hex) behaved differently than fucoxanthin. During July 2012, 19′-But and 19′-Hex increased 5- and 3-fold, respectively, by 96 h in both and treatments, and decreased subsequently (Figures 3E,G). During the April experiment, both 19′-But and 19′-Hex reached maximum concentrations (11-fold and 6-fold increases, respectively) in the and treatments after 48 h and remained elevated through the remainder of the experiment (Figures 3F,H). Concentrations of peridinin, a pigment biomarker for dinoflagellates, increased steadily throughout both July and April experiments (Figures 3I,J), with larger responses in the treatments (increasing 7- to 9-fold in July and April, respectively, compared to 4- to 5-fold increases observed in the treatments) for both experiments.
18S rDNA Sequences
The V9 region of 18S rRNA genes was amplified and sequenced from size-fractionated samples collected during our experiments to assess possible time-varying changes in phytoplankton community structure following additions of nitrogenous substrates (Figure 4). Relative abundances of phytoplankton OTUs revealed differences in the initial composition of the eukaryotic picophytoplankton (0.2–3 μm) among the different experiments; in contrast, the initial community composition of larger (>3 μm) phytoplankton appeared very similar between experiments. Members of the Dinophyceae comprised 50–62% of the picophytoplankton 18S rRNA gene sequences during experiments conducted in the summer (July 2011 and 2012), with haptophytes and chrysophytes also relatively abundant (ranging ~11–16% and ~5–14%, respectively) in the picophytoplankton size fraction. In addition, phytoplankton belonging to the dictyochophytes, bolidophytes, and eustigmatophytes were present at low relative abundances in the picophytoplankton size fraction (Figure 4A). During the experiments conducted in the winter and spring months (March 2012, December 2012, and April 2013) relative abundances of dinoflagellates at the onset of experiments were lower (ranging 28–39% of picophytoplankton sequences) than observed during the summer experiments, with greater contributions by OTUs clustering among pelagophytes (7–21%), haptophytes (5–27%), chrysophytes (6–21%) and dictyochophytes (5–9%). During December 2012, members of the Rhodophyta and marine ochrophytes (MOCH) were also present (~10% of picophytoplankton 18S rRNA gene sequences). For the larger phytoplankton (>3 μm), a majority of the >3 μm sequences in all experiments was comprised of dinoflagellates (~76–88% on average) and diatoms (~5–12% on average), with no discernible seasonal variability (Figure 4B). The taxonomic composition of the control carboys remained relatively constant for experiments in December 2012 and April 2013; however, taxa belonging to the Eustigmatophyceae and Bolidophyceae increased in the picophytoplankton fraction in July 2011 and 2012, respectively (Figure 4A), and members of the Bacillariophyceae increased in the >3 μm size fraction in March 2011 and July 2012 (Figure 4B).
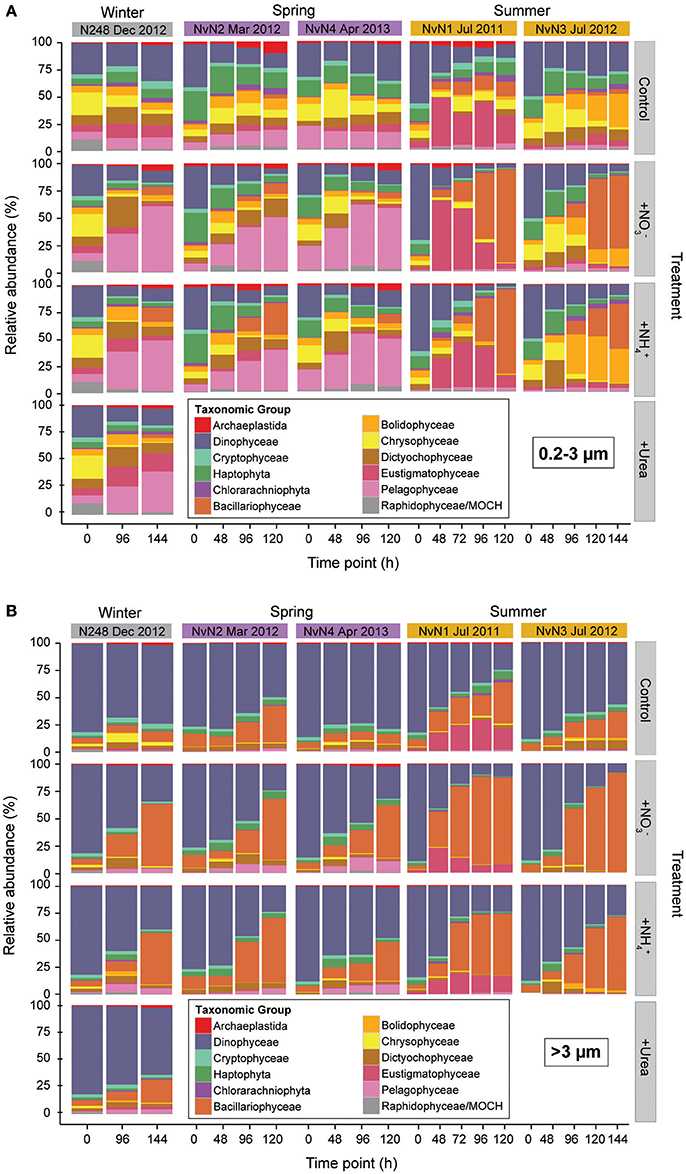
Figure 4. Relative abundances (%) of (A) picophytoplankton and (B) >3 μm phytoplankton taxa, binned by time point sampled per experiment conducted in different seasons. Columns indicate treatment mean (of triplicate carboys) relative abundances for different experiments and rows specify the different treatments: Control, +, +, and +Urea. Colors indicate various phytoplankton taxa.
While changes in phytoplankton community composition were very similar in the various N treatments (, , or urea), there were differences in the resulting phytoplankton responses to the additions of nitrogenous substrates depending on the time of year that the experiments were conducted. For the picophytoplankton, members of the Bacillariophyceae demonstrated the largest increases in relative abundances in the summer experiments (July 2011 and 2012), increasing from 0.8–1.4% at the onset of the experiments to ~38–59% of the picophytoplankton sequences by the end of the experiments. In contrast, for those experiments conducted in the winter and spring months (December, March, and April), members of the Pelagophyceae comprised ~7–21% of the picophytoplankton sequences at the onset of the experiments and increased to 34–39% following the additions of N by the end of the experiments, while diatom composition remained fairly low (~0–1% at onset to ~5–14% at end; Figures 4A, 5). In the >3 μm size fraction, various taxa of diatoms were the dominant responders to N additions during all experiments (30–60% of >3 μm sequences), though the magnitude of response by diatoms was greatest during those experiments conducted in the summer (4–6% at onset of experiment to 57–60% of >3 μm sequences at final time point) compared to the response observed during those experiments conducted in the spring and winter months (6–12% to 30–49% of >3 μm sequences at final time point; Figures 4B, 5). In addition, the increase in the relative abundances of diatoms in the larger fraction during the summer was more rapid (occurring in the initial 48–96 h) compared to the responses observed in those experiments conducted in the spring and winter (Figure 4B).
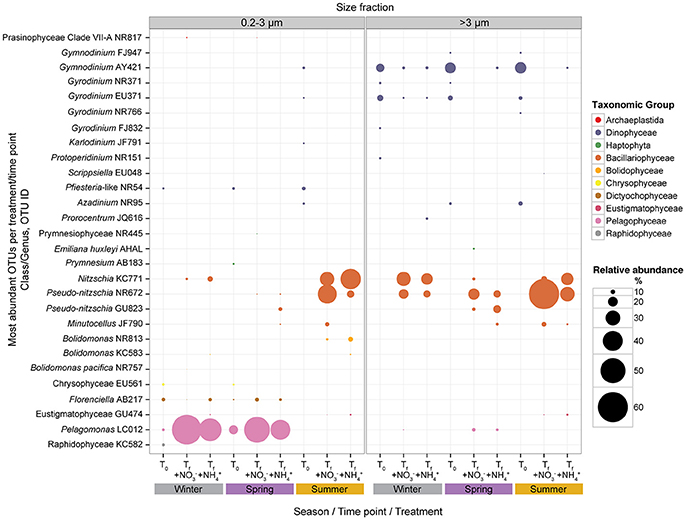
Figure 5. Mean relative abundances (%) of the most abundant pico- and >3 μm phytoplankton at initial (T0) time points and final (Tf) time points for + and + treatments; experiments binned by season (winter, spring, and summer). Mean relative abundances of phytoplankton taxa depicted using different colors and bubble sizes (size reflects relative abundance). Detailed information on the OTUs listed is listed in Supplementary Table 2.
Changes in the relative abundances of the five most abundant OTUs for both size fractions were examined for the and treatments by comparing relative abundances at the beginning of each experiment to the results at the end of the experiments (Figure 5). Seasonal binning (winter, spring, and summer) of the experiments emphasized that the resulting trajectory of picophytoplankton community response appeared to depend on when the experiment was conducted. The dominant picophytoplankton at initial time points during the winter and spring included the pelagophyte Pelagomonas (averaging ~7% of picophytoplankton sequences in winter and ~19% in spring), dictyochophyte Florenciella (averaging ~8% of picophytoplankton sequences in winter and ~4% in spring), chrysophytes (averaging ~4–6% of picophytoplankton sequences in both winter and spring), and Pfiesteria-like dinoflagellates (averaging ~5–6% of picophytoplankton sequences in both winter and spring). During the spring months, the haptophyte Prymnesium comprised ~5% of the picophytoplankton sequences, while members of the Raphidophyceae comprised ~7% of the picophytoplankton community during the winter experiment (Supplementary Table 2). In contrast, during those experiments conducted in the summer, all of the most abundant picophytoplankton OTUs at the beginning of the experiments clustered among the Dinophyceae, including OTUs classified as Gymnodinium, Gyrodinium, Karldonium, Pfiesteria-like, and Azadinium.
By the end of the experiments initiated in the winter and spring, Pelagomonas demonstrated the largest increases in relative abundances of picophytoplankton sequences, with smaller contributions by diatoms Pseudo-nitzschia and Nitzschia, dictyochophyte Florenciella, and Prasinophyceae Clade VII-A. In experiments conducted during the summer, diatoms Pseudo-nitzschia, Nitzschia, and Minutocellus demonstrated the largest increases in relative abundances of picophytoplankton (Supplementary Table 2, Figure 5). In the >3 μm fraction, the most dominant OTUs at the beginning of the experiments were members of the Dinophyceae irrespective of when the experiments were conducted (Supplementary Table 2, Figure 5). Following the addition of N substrates, the relative contributions by these dinoflagellates decreased, with correspondingly large increases in relative abundances of OTUs closely related to the diatoms Pseudo-nitzschia and Nitzschia (Supplementary Table 2, Figure 5). Despite often being undetectable at the onset of the experiments, relative abundances of OTUs belonging to these diatom genera comprised ~20 to 60% of the >3 μm phytoplankton sequences during all seasons in the N addition treatments (Supplementary Table 2, Figure 5).
Alpha diversity (assessed by the Shannon Index) of the picoeukaryote phytoplankton communities decreased significantly following N additions compared to the control carboys for all experiments (paired t-test, p < 0.05; Figure 6). For the larger phytoplankton, the diversity of communities at the end of the experiments also decreased following N additions; however, the difference was significantly lower from that of the initial communities only during the summer (paired t-test, p < 0.05). Alpha diversity for both pico- and larger phytoplankton did not differ between the , , and urea treatments amongst various seasons (paired t-test, p > 0.1; Figure 6). Significant differences (paired t-test, p < 0.05) were observed between the alpha diversity of both pico- and larger phytoplankton communities in the treatments, between spring and summer. Higher Shannon index values were generally observed for both size fractions during the winter and spring compared to the summer experiments, regardless of treatment, likely reflecting the dominance of diatoms in the N amended treatments during the summer (Figure 6).
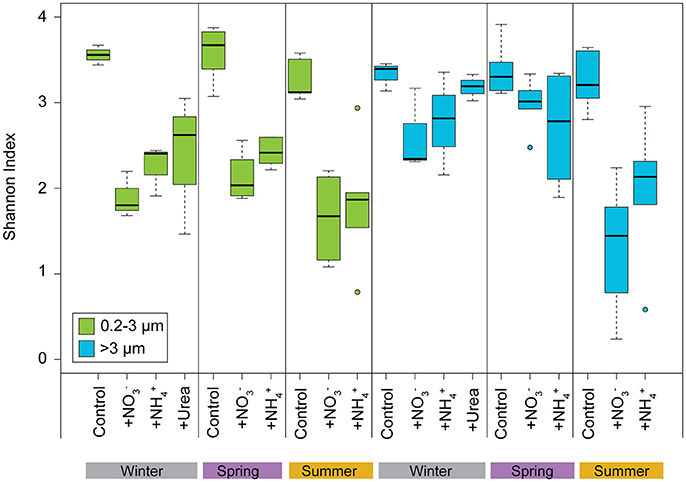
Figure 6. Alpha diversity (Shannon index) of the pico- and >3 μm phytoplankton V9 18S rDNA OTUs at final time points for Control, +, and + treatments binned by winter, spring, and summer. Boxplot parameters are the same as described for Figure 1.
Discussion
We conducted five experiments during the winter, spring, and summer months between July 2011 to April 2013 to examine the responses of the eukaryotic phytoplankton to additions of , , or urea (along with and Si(OH)4). We assessed how the addition of varying nitrogenous substrates influenced size-dependent responses in rates of primary production and concentrations of Chl a, and altered eukaryotic phytoplankton community structure based on changes in concentrations of photosynthetic pigments and analyses of 18S rDNA sequences. In three of the five experiments (July and December 2012, and April 2013), rates of and drawdown were roughly equivalent between the N addition treatments. In addition, contributions of pico- and larger phytoplankton to 14C-primary production and Chl a concentrations did not differ significantly based on the type of N substrates added, except for the experiment conducted in March 2012. In March 2012, we observed a ~27-fold increase in 14C-primary production from the initial timepoint to 120 h for the treatment, concomitant with a greater response by diatoms in the pico-size fraction. This disparity in response from other experiments is likely due to the initial concentration being ~2x the target concentration as well as the initial concentration; despite the greater enrichment, ~85% of the added was drawn down during this experiment. The different responses observed in this experiment may reflect a concentration-dependent response by the phytoplankton assemblage rather than reflecting a difference in the types of substrates added. Overall, results from these five experiments suggest that the oxidation state of the nitrogenous substrates that we selected (oxidized or reduced and urea) did not play a major role in shaping rates of N drawdown or the resulting size class responses of phytoplankton biomass and productivity. In a series of experiments in the oligotrophic NPSG, Shilova et al. (2017) observed increases in rates of primary production and phytoplankton biomass, specifically by cyanobacteria Prochlorococcus, following the addition of urea. However, consistent with the findings from the present study, species composition and growth rates did not appear to be influenced by the type of N source added (Eppley et al., 1971) although previous studies comparing and (Strickland et al., 1969; Eppley et al., 1971) and urea (Newell et al., 1967) demonstrated that elemental composition (C:N) and C:Chl ratio of phytoplankton changed depending on the form of N used for growth.
Although our experiments were not designed to examine competition amongst phytoplankton for differing N substrates (e.g., through simultaneous additions of both and to the same treatment), our results do provide insight into taxa best poised to respond to relatively large changes in N availability in this ecosystem. Two of our observations, (1) that the timing and response of phytoplankton to both and were similar, and (2) that no significant changes were observed in our “control” carboys amended with only and Si(OH)4 (except for ~3-fold increase in photosynthetic eukaryote cell abundances during the July 2011 experiment), likely reflect the chronic N limitation of the oligotrophic upper ocean waters of the NPSG. In these well-lit upper ocean waters, phytoplankton production is consistently light-saturated (Li et al., 2011; White et al., 2015), while concentrations of inorganic N are proportionately much lower than required for growth (: ratios of the upper ocean <1). Our results suggest that energetic limitations likely do not restrict eukaryotic phytoplankton consumption of available N substrates in this habitat.
We observed moderate to large changes in the phytoplankton community response to N additions, shifting from a picophytoplankton-dominated community (43–77% picophytoplankton contribution to 14C-primary production and 86–91% contribution of picophytoplankton to Chl a by the end of experiments) to one with a greater contribution by the larger (>3 μm) phytoplankton (46–79% contribution to 14C-primary production and 19–45% contribution to Chl a by the end of experiments). Sequencing of 18S rDNA provided insight into the types of eukaryotic phytoplankton in these size classes. The larger (>3 μm) phytoplankton community was comprised mainly of dinoflagellates at the onset of the experiment; however, following the addition of N substrates, diatom composition rapidly (within 5–6 days) expanded, contributing 30–60% of the >3 μm sequences. Intriguingly, we observed that relative abundances of various taxa of pennate diatoms were elevated in the 0.2–3 μm filter fraction following the addition of and during experiments conducted in the summer. Such cells might be expected to be larger than 3 μm; hence, it's unclear whether such results reflect time-varying differences in the sizes of these cells, poor trapping efficiency of these cells by the 3 μm filters, or potential breakage of cells during filtration with subsequent retention of fragmented cells by the 0.2 μm filter.
The diatom response was most significant during the experiments conducted in the summer, particularly in the treatment, where diatoms comprised ~90% of the >3 μm sequences at the end of the experiments. Such observations are consistent with those of Mahaffey et al. (2012), who observed greater responses (>~2-fold) in phytoplankton biomass following nutrient enrichment with deep-sea water during the summer months than in other times of the year. Consistent with microscopic observations at Station ALOHA (Venrick, 1993, 1999; Scharek et al., 1999), diatoms were present in low concentrations (<~1% of total sequences) at the onset of our experiments. The large response by diatoms following the addition of N likely partly reflects their physiological capacity to outcompete other phytoplankton for available N when concentrations of and are elevated (Eppley et al., 1969), and highlights potential N limitation of diatoms during summer periods. In addition, these results presumably reflect decoupling between diatom growth and removal processes such as predation, parasitism, or viral lysis during the summer, permitting accumulation of pennate diatoms during this period. Thus, the diatom response to nitrogenous substrates observed during the experiments conducted in the summer suggests there are season-specific conditions at Station ALOHA, such as elevated incident light flux and warm upper ocean temperatures, that may favor diatom growth and allow them to outgrow or escape removal in order to accumulate biomass.
While diatoms were the dominant phytoplankton to respond to N additions in the >3 μm fraction in all of the experiments, differential response between seasons was observed among the picophytoplankton. Diatoms were still the major responders to N additions in the picophytoplankton fraction during the summer; however, the pelagophyte Pelagomonas responded to additions of N substrates in the winter and spring. While such results may reflect that smaller, pennate diatoms are limited by some other nutrient (e.g., iron, vitamins) during the spring and winter months, our results highlight that other groups of picophytoplankton, in particular the pelagophytes, respond rapidly to N availability during these periods. Although pelagophytes comprised 0.8–1.4% of the picophytoplankton sequences at the onset of the summer experiments, they comprised a much larger fraction (6–21%) of the sequences at the onset of the winter and spring experiments. As pelagophytes are typically found in greatest abundances in the low-lit regions of the euphotic zone (i.e., Letelier et al., 1993; Bidigare and Ondrusek, 1996; Timmermans et al., 2005), the higher relative abundances of these organisms during the winter and spring months in the surface waters at Station ALOHA was somewhat surprising. We suspect that Pelagomonas may respond to periods when the mixed layer extends into the lower region of the euphotic zone (90–110 m), entraining organisms and nutrients typically found in the dimly lit regions of the euphotic zone into the well-lit upper ocean. As such, the survival of pelagophytes in the upper euphotic zone during this period of deeper mixing may reflect their flexible photophysiology (Dimier et al., 2009; Bidigare et al., 2014) compared to other phytoplankton, such as some diatoms, whose growth rates often decrease under fluctuating light conditions (van de Poll et al., 2007). Their success may also be due to their ability to acquire N through the increased supply of to the euphotic zone during periods of deeper mixing, as consistent with studies indicating elevated expression of transporter genes by Pelagomonas (DuPont et al., 2014). Moreover, there may be differences in selective removal processes in the upper vs. lower euphotic zone that specifically impact Pelagomonas or other competing organisms, resulting in the accumulation of Pelagomonas during this particular time of year. Hence, we suspect that the rapid response by pelagophytes (specifically Pelagomonas) during spring and winter resulted from the relatively elevated abundances of these organisms at the onset of the experiments, which may or may not reflect selective removal processes, as well as their ability to grow rapidly following the input of bioavailable N.
Examination of alpha diversity during our experiments revealed a differential response in the size structure of eukaryotic phytoplankton diversity with the addition of N substrates, indicating varying degrees of resource competition amongst the different size classes. While the addition of N substrates induced “bloom”-like conditions in picophytoplankton (thereby significantly decreasing alpha diversity), addition of nitrogenous substrates induced growth in different taxa in the larger (>3 μm) phytoplankton throughout the year (e.g., alpha diversity of the N treatments remained similar to the controls), except in summer when diatoms dominated. This suggests that picophytoplankton diversity is more strongly influenced by competition for nutrients compared to the larger phytoplankton.
The proliferation of different taxa in our experiments during different times of the year presumably also reflects temporal variability in the strength of various top-down controls (predation, viruses, parasites). Our experiments excluded large grazers (>202 μm), presumably eliminating the influences of larger mesozooplankton as potential controls on phytoplankton diversity and community structure. However, microzooplankton and heterotrophic and mixotrophic protists can be significant grazers of phytoplankton biomass (>40% of Chl a per day) in the open ocean (Calbet and Landry, 2004). Though larger diatoms may be too big to be consumed efficiently by nano- and micro-predators (Frost, 1991; Cullen, 1995), smaller pennate diatoms (typically 2–15 μm in length) can be readily consumed by microzooplankton (Latasa et al., 1997). However, Latasa et al. (1997) observed that growth and grazing of diatoms and pelagophytes were uncoupled in the upper ocean, allowing net phytoplankton growth in the central equatorial Pacific. Thus, the rapid turnover of fast-growing species through active removal processes may maintain greater diversity (such as among the larger phytoplankton during the spring), despite the availability of nutrients (Longhurst, 1967; Timonin, 1969).
The apparent seasonally-dependent responses by the phytoplankton assemblage to N availability may provide insight into previously observed patterns in carbon export in the NPSG. In particular, Karl et al. (2012) describe diatom-driven summertime export of several bioelements to the deep sea (4000 m) at Station ALOHA. Based on 12-years of sediment-trap derived measurements of particulate matter flux, these authors highlight the role of diatom aggregation and sinking in regulating a large fraction of the annual export in this ecosystem; moreover, this seasonal event appears fueled by N supply via N2 fixation (Karl et al., 2012). Other studies conducted in the NPSG further highlight diatom responses to nutrient availability. For example, analyses of particulate matter export from the upper ocean into the mesopelagic waters have revealed that nutrient supply via mesoscale eddies stimulates diatom growth and subsequent preferential settling of silica-enriched biomass (Benitez-Nelson et al., 2007). In our experiments, larger diatoms (>3 μm) consistently responded to the addition of N substrates, suggesting these organisms are poised for rapid growth following N input via N2 fixation or vertical supply via mixing or mesoscale isopycnal uplift.
Interestingly, the initial eukaryotic phytoplankton communities (in the larger size class but also during the summer in the picophytoplankton size class) were dominated by members of the Dinophyceae. Autotrophic dinoflagellates such as Gymnodinium are reported to lack peridinin, while containing fucoxanthin-related carotenoids (Millie et al., 1993). Such findings may explain why we observed high relative abundances of dinoflagellate OTUs in our study, while observations at Station ALOHA indicate low concentrations of peridinin (Letelier et al., 1993; Bidigare and Ondrusek, 1996). Alternatively, the dominance of dinoflagellates in 18S rDNA sequences may be due to high rRNA gene copy numbers previously described among the dinoflagellates (Zhu et al., 2005; Not et al., 2009; Medinger et al., 2010). Moreover, the primers targeting the region (V9) of the 18S rRNA gene amplified in the current study may preferentially amplify dinoflagellates (Stoeck et al., 2010), biasing the sequence results toward these organisms. A recent PCR-independent metatranscriptome approach found that dinoflagellates dominated (36–40%) the mapped eukaryote transcripts at Station ALOHA (Alexander et al., 2015), suggesting that dinoflagellates are indeed important contributors to phytoplankton biomass in this ecosystem. In the current study, despite their initial dominance, dinoflagellates did not respond significantly to additions of , , or urea. Concentrations of peridinin increased gradually in the experiments where HPLC pigments were measured (in July 2012 and April 2013), but to a lesser extent than other measured pigments. Consistent with these results, additions of nutrient-enriched deep sea water to upper ocean plankton assemblages resulted in a minimal transcriptional response by dinoflagellates (Alexander et al., 2015). Such results, and those observed in the current study, may suggest that the dominant dinoflagellates at Station ALOHA are heterotrophic or mixotrophic, potentially decreasing their dependence on inorganic N substrates. Consistent with this hypothesis, several of the taxa that predominated at the beginning of our experiments are closely related to mixotrophic organisms, including dinoflagellates, haptophytes, chrysophytes, and dictyochophytes (Rothhaupt, 1996; Frias-Lopez et al., 2009; Liu et al., 2009). However, following N additions, many of these taxa decreased in relative abundance, with organisms not previously known to demonstrate mixotrophic growth (namely diatoms and pelagophytes) becoming increasing dominant. Such results provide support to the hypothesis that limiting nutrients are crucial to shaping plankton physiology, including promoting mixotrophic modes of nutrient acquisition (Zubkov and Tarran, 2008; Hartmann et al., 2012).
In summary, after addition of inorganic N substrates, we observed a general shift in the size structure of the phytoplankton community from a picophytoplankton-dominated one to a community dominated by larger (>3 μm) phytoplankton. In our experiments, responses in 14C-primary production and photosynthetic pigment biomass appeared independent of the type of N substrate added. However, resulting changes in the picophytoplankton community composition appeared seasonally dependent, with diatoms dominating the response during the summer while pelagophytes responded most significantly in the winter and spring. Diatoms in the >3 μm size fraction appear to be poised for rapid net growth throughout the year, while smaller, pennate diatoms appeared best able to capitalize on added N during the summer months. The variability in the responses by phytoplankton may stem from differences in initial picophytoplankton populations or time-varying top-down controls, which likely vary with seasonal changes in mixed layer depth and light. Our findings provide insight into how abrupt changes in the availability of fixed N influence successional patterns in eukaryotic phytoplankton assemblages, and highlight those organisms poised for rapid net growth when fixed N is available.
Author Contributions
YR and MC came up with the concept and design of experiments described in this paper. Experiments implementation and sample analyses were performed by YR, with input from MC and RB. Data analyses and manuscript write-up was conducted by YR and MC with input from RB.
Conflict of Interest Statement
The authors declare that the research was conducted in the absence of any commercial or financial relationships that could be construed as a potential conflict of interest.
Acknowledgments
We thank the HOT program science team for the collection and analyses of some of the data used in this study. We would also like to acknowledge Donn Viviani and Brenner Wai for help with sample collection during the experiments. In addition, Brianne Maillot provided laboratory assistance, Susan Curless and Alexa Nelson contributed nutrient analyses, Markus Lindh assisted with R, and Edward DeLong enabled use of a computer server for the Illumina sequence analyses. We also appreciate the support of the captain and crew of R/V Kilo Moana. Support for this work derived from U.S. National Science Foundation (NSF) grants OCE-1241263 and OCE-1260164 (MC), the Center for Microbial Oceanography: Research and Education (C-MORE; EF-0424599), the Simons Collaboration on Ocean Processes and Ecology (SCOPE ID 329108, MC), and the University of Hawaii Denise B. Evans Research Fellowship in Oceanography (YR).
Supplementary Material
The Supplementary Material for this article can be found online at: https://www.frontiersin.org/articles/10.3389/fmars.2018.00092/full#supplementary-material
References
Alexander, H., Rouco, M., Haley, S. T., Wilson, S. T., Karl, D. M., and Dyhrman, S. T. (2015). Functional group-specific traits drive phytoplankton dynamics in the oligotrophic ocean. Proc. Natl. Acad. Sci. U.S.A. 112, E5972–E5979. doi: 10.1073/pnas.1518165112
Amaral-Zettler, L. A., McCliment, E. A., Ducklow, H. W., and Huse, S. M. (2009). A method for studying protistan diversity using massively parallel sequencing of V9 hypervariable regions of small-subunit ribosomal RNA genes. PLoS ONE 4:e6372. doi: 10.1371/journal.pone.0006372
Armstrong, F. A. J., Stearns, C. R., and Strickland, J. D. H. (1967). The measurement of upwelling and subsequent biological processes by means of the Technicon AutoAnalyzerTM and associated equipment. Deep Sea Res. 14, 381–389.
Arrigo, K. R. (2005). Marine microorganisms and global nutrient cycles. Nature 437, 349–355. doi: 10.1038/nature04159
Atlas, E. L., Hager, S. W., Gordon, L. I., and Park, P. K. (1971). A Practical Manual for Use of the Technicon AutoanalyzerTM in Seawater Nutrient Analyses; Revised. Technical Report 215, Ref. No. 71-22, Department of Oceanography, Oregon State University, 1–48.
Benitez-Nelson, C. R., Bidigare, R. R., Dickey, T. D., Landry, M. R., Leonard, C. L., Brown, S. L., et al. (2007). Mesoscale eddies drive increased silica export in the subtropical Pacific Ocean. Science 316, 1017–1021. doi: 10.1126/science.1136221
Bernhardt, H., and Wilhelms, A. (1967). “The continuous determination of low level iron, soluble phosphate and total phosphate with the AutoAnalyzer,” in Technicon Symposium Vol. 1, 386.
Bidigare, R. R., Buttler, F. R., Christensen, S. J., Barone, B., Karl, D. M., and Wilson, S. T. (2014). Evaluation of the utility of xanthophyll cycle pigment dynamics for assessing upper ocean mixing processes at Station ALOHA. J. Plankton Res. 36, 1423–1433. doi: 10.1093/plankt/fbu069
Bidigare, R. R., and Ondrusek, M. E. (1996). Spatial and temporal variability of phytoplankton pigment distributions in the central equatorial Pacific ocean. Deep Sea Res. II 43, 809–833. doi: 10.1016/0967-0645(96)00019-7
Bidigare, R. R., van Heukelem, L., and Trees, C. C. (2005). “Analysis of algal pigments by high-performance liquid chromatography,” in Algal Culturing Techniques, ed R. A. Andersen (New York, NY: Academic Press), 327–345.
Bienfang, P. K., and Szyper, J. P. (1981). Phytoplankton dynamics in the subtropical Pacific Ocean off Hawaii. Deep Sea Res. 28A, 981–1000. doi: 10.1016/0198-0149(81)90013-3
Calbet, A., and Landry, M. R. (2004). Phytoplankton growth, microzooplankton grazing, and carbon cycling in marine systems. Limnol. Oceanogr. 49, 51–57. doi: 10.4319/lo.2004.49.1.0051
Campbell, L., Nolla, H. A., and Vaulot, D. (1994). The importance of Prochlorococcus to community structure in the central North Pacific Ocean. Limnol. Oceanogr. 39, 954–961. doi: 10.4319/lo.1994.39.4.0954
Campbell, L., and Vaulot, D. (1993). Photosynthetic picoplankton community structure in the subtropical North Pacific Ocean near Hawaii (station ALOHA). Deep Sea Res. I 40, 2043–2060. doi: 10.1016/0967-0637(93)90044-4
Caporaso, J. G., Bittinger, K., Bushman, F. D., DeSantis, T. Z., Andersen, G. L., and Knight, R. (2010). PyNAST: a flexible tool for aligning sequences to a template alignment. Bioinformatics 26, 266–267. doi: 10.1093/bioinformatics/btp636
Caporaso, J. G., Lauber, C. L., Walters, W. A., Berg-Lyons, D., Huntley, J., Fierer, N., et al. (2012). Ultra-high-throughput microbial community analysis on the Illumina HiSeq and MiSeq platforms. ISME J. 6, 1621–1624. doi: 10.1038/ismej.2012.8
Church, M. J., Mahaffey, C., Letelier, R. M., Lukas, R., Zehr, J. P., and Karl, D. M. (2009). Physical forcing of nitrogen fixation and diazotroph community structure in the North Pacific subtropical gyre. Glob. Biogeochem. Cycle 23:GB2020. doi: 10.1029/2008GB003418
Cortés, M. Y., Bollman, J., and Thierstein, H. R. (2001). Coccolithophore ecology at the HOT station ALOHA, Hawaii. Deep Sea Res. II 48, 1925–1956. doi: 10.1016/S0967-0645(00)00165-X
Cullen, J. J. (1995). Status of the iron hypothesis after the open-ocean enrichment experiment. Limnol. Oceanogr. 47, 1336–1343. doi: 10.4319/lo.1995.40.7.1336
Dandonneau, Y., Vega, A., Loisel, H., du Penhoat, Y., and Menkes, C. (2003). Oceanic Rossby waves acting as a “hay rake” for ecosystem floating by-products. Science 302, 1548–1551. doi: 10.1126/science.1090729
Dimier, C., Giovanni, S., Ferdinando, T., and Brunet, C. (2009). Comparative ecophysiology of the xanthophyll cycle in six marine phytoplanktonic species. Protist 160, 397–411. doi: 10.1016/j.protis.2009.03.001
Dore, J. E., Letelier, R. M., Church, M. J., Lukas, R., and Karl, D. M. (2008). Summer phytoplankton blooms in the oligotrophic North Pacific subtropical gyre: historical perspective and recent observations. Prog. Oceanogr. 76, 2–38. doi: 10.1016/j.pocean.2007.10.002
Dortch, Q. (1990). The interaction between ammonium and nitrate uptake in phytoplankton. Mar. Ecol. Prog. Ser. 61, 183–201. doi: 10.3354/meps061183
Dupont, C. L., McCrow, J. P., Valas, R., Moustafa, A., Walworth, N., Goodenough, U., et al. (2014). Genomes and gene expression across light and productivity gradients in eastern subtropical Pacific microbial communities. ISME J. 9, 1076–1092. doi: 10.1038/ismej.2014.198
Edgar, R. C., Haas, B. J., Clemente, J. C., Quince, C., and Knight, R. (2011). UCHIME improves sensitivity and speed of chimera detection. Bioinformatics 27, 2194–2200. doi: 10.1093/bioinformatics/btr381
Eppley, R. W., Carlucci, A. F., Holm-Hansen, O., Kiefer, D., McCarthy, J. J., Venrick, E., et al. (1971). Phytoplankton growth and composition in shipboard cultures supplied with nitrate, ammonium, or urea as the nitrogen source. Limnol. Oceanogr. 16, 741–751. doi: 10.4319/lo.1971.16.5.0741
Eppley, R. W., Rogers, J. N., and McCarthy, J. J. (1969). Half-saturation constants for uptake of nitrate and ammonium by marine phytoplankton. Limnol. Oceanogr. 14, 912–920. doi: 10.4319/lo.1969.14.6.0912
Eppley, R. W., Sharp, J. H., Renger, E. H., Perry, M. J., and Harrison, W. G. (1977). Nitrogen assimilation by phytoplankton and other microorganisms in the surface waters of the central North Pacific Ocean. Mar. Biol. 39, 111–120. doi: 10.1007/BF00386996
Faraway, J. J. (2002). Practical Regression and ANOVA Using R. 128-129. Available online at: http://cran.r-project.org/doc/contrib/Faraway-PRA.pdf
Fawcett, S. E., Lomas, M. W., Casey, J. R., Ward, B. B., and Sigman, D. M. (2011). Assimilation of upwelled nitrate by small eukaryotes in the Sargasso Sea. Nat. Geosci. 4, 717–722. doi: 10.1038/ngeo1265
Frias-Lopez, J., Thompson, A., Waldbauer, J., and Chisholm, S. W. (2009). Use of stable isotope-labelled cells to identify active grazers of picocyanobacteria in ocean surface waters. Environ. Microbiol. 11, 512–525. doi: 10.1111/j.1462-2920.2008.01793.x
Frost, B. W. (1991). The role of grazing in nutrient-rich areas of the open sea. Limnol. Oceanogr. 36, 1616–1630. doi: 10.4319/lo.1991.36.8.1616
Hartmann, M., Grob, C., Tarran, G. A., Martin, A. P., Burkill, P. H., Scanlan, D. J., et al. (2012). Mixotrophic basis of Atlantic oligotrophic ecosystems. Proc. Natl. Acad. Sci. U.S.A. 109, 5756–5760. doi: 10.1073/pnas.1118179109
Johnson, K. S., Riser, S. C., and Karl, D. M. (2010). Nitrate supply from deep to near-surface waters of the North Pacific subtropical gyre. Nature 465, 1062–1065. doi: 10.1038/nature09170
Juranek, L. W., Quay, P. D., Feely, R. A., Lockwood, D., Karl, D. M., and Church, M. J. (2012). Biological production in the NE Pacific and its influence on air-sea CO2 flux: evidence from dissolved oxygen isotopes and O2/Ar. J. Geophys. Res. 117:C05022. doi: 10.1029/2011JC007450
Karl, D. M. (1999). A sea of change: biogeochemical variability in the North Pacific subtropical gyre. Ecosystems 2, 181–214. doi: 10.1007/s100219900068
Karl, D. M. (2002). Nutrient dynamics in the deep blue sea. Trends Microbiol. 10, 410–418. doi: 10.1016/S0966-842X(02)02430-7
Karl, D. M., Björkman, K. M., Dore, J. E., and Fujieki, L. (2001). Ecological nitrogen-to-phosphorus stoichiometry at station ALOHA. Deep Sea Res. II 48, 1529–1566. doi: 10.1016/S0967-0645(00)00152-1
Karl, D. M., Christian, J., Dore, J. E., Hebel, D. V., Letelier, R. M., Tupas, L. M., et al. (1996). Seasonal and interannual variability in primary production and particle flux at Station ALOHA. Deep Sea Res. II 43, 539–568. doi: 10.1016/0967-0645(96)00002-1
Karl, D. M., and Church, M. J. (2017). Ecosystem structure and dynamics in the North pacific subtropical gyre: new views of an old ocean. Ecosystems 3, 433–457. doi: 10.1007/s10021-017-0117-0
Karl, D. M., Church, M. J., Dore, J. E., Letelier, R. M., and Mahaffey, C. (2012). Predictable and efficient carbon sequestration in the North Pacific ocean supported by symbiotic nitrogen fixation. Proc. Natl. Acad. Sci. U.S.A. 109, 1842–1849. doi: 10.1073/pnas.1120312109
Karl, D. M., Letelier, R., Hebel, D., Bird, D. F., and Winn, C. (1992). “Trichodesmium blooms and new nitrogen in the North Pacific gyre,” in Marine Pelagic Cyanobacteria: Trichodesmium and Other Diazotrophs, eds E. J. Carpenter and D. G. Capone (Dordrecht: Springer), 219–237.
Karl, D. M., Letelier, R., Tupas, L., Dore, J. E., Christian, J., and Hebel, D. (1997). The role of nitrogen fixation in biogeochemical cycling in the subtropical North Pacific Ocean. Nature 388, 533–538. doi: 10.1038/41474
Karl, D. M., and Lukas, R. (1996). The Hawaii Ocean Time-series (HOT) program: background, rationale and field implementation. Deep Sea Res. II 43, 129–156. doi: 10.1016/0967-0645(96)00005-7
Lane, D. J. (1991). “16S / 23S sequencing,” in Nucleic Acid Technologies in Bacterial Systematic, eds E. Stackebrandt and M. Goodfellow (New York, NY: Wiley), 115–175.
Latasa, M., Landry, M. R., Schluter, L., and Bidigare, R. R. (1997). Pigment-specific growth and grazing rates of phytoplankton in the central equatorial Pacific. Limnol. Oceanogr. 42, 289–298. doi: 10.4319/lo.1997.42.2.0289
Letelier, R. M., Bidigare, R. R., Hebel, D. V., Ondrusek, M. E., Winn, C. D., and Karl, D. M. (1993). Temporal variability of phytoplankton community structure based on pigment analysis. Limnol. Oceanogr. 38, 1420–1437. doi: 10.4319/lo.1993.38.7.1420
Letelier, R. M., Dore, J. E., Winn, C. D., and Karl, D. M. (1996). Seasonal and interannual variations in photosynthetic carbon assimilation at Station. Deep Sea Res. II 43, 467–490. doi: 10.1016/0967-0645(96)00006-9
Letelier, R. M., Karl, D. M., Abbott, M. R., and Bidigare, R. R. (2004). Light driven seasonal patterns of chlorophyll and nitrate in the lower euphotic zone of the North Pacific subtropical gyre. Limnol. Oceanogr. 49, 508–519. doi: 10.4319/lo.2004.49.2.0508
Li, B., Karl, D. M., Letelier, R. M., and Church, M. J. (2011). Size-dependent photosynthetic variability in the North Pacific subtropical gyre. Mar. Ecol. Prog. Ser. 440, 27–40. doi: 10.3354/meps09345
Li, Q. P., Zhang, J.-Z., Millero, F. J., and Hansell, D. A. (2005). Continuous colorimetric determination of trace ammonium in seawater with a long-path liquid waveguide capillary cell. Mar. Chem. 96, 73–85. doi: 10.1016/j.marchem.2004.12.001
Liu, H., Probert, I., Uitz, J., Claustre, H., Aris-Brosou, S., Frada, M., et al. (2009). Extreme diversity in noncalcifying haptophytes explains a major pigment paradox in open oceans. Proc. Natl. Acad. Sci. U.S.A. 106, 12803–12808. doi: 10.1073/pnas.0905841106
Longhurst, A. R. (1967). Diversity and trophic structure of zooplankton communities in the California current. Deep Sea Res. 14, 393–408. doi: 10.1016/0011-7471(67)90047-2
Mahaffey, C., Björkman, K. M., and Karl, D. M. (2012). Phytoplankton response to deep seawater nutrient addition in the North Pacific subtropical gyre. Mar. Ecol. Prog. Ser. 460, 13–34. doi: 10.3354/meps09699
Medinger, R., Nolte, V., Pandey, R. V., Jost, S., Ottenwälder, B., Schlötterer, C., et al. (2010). Diversity in a hidden world: potential and limitation of next-generation sequencing for surveys of molecular diversity of eukaryotic microorganisms. Mol. Ecol. 19, 32–40. doi: 10.1111/j.1365-294X.2009.04478.x
Medlin, L., Elwood, H. J., Stickel, S., and Sogin, M. L. (1988). The characterization of enzymatically amplified eukaryotic 16S-like rRNA-coding regions. Gene 71, 491–499. doi: 10.1016/0378-1119(88)90066-2
Millie, D. F., Paerl, H. W., Hurley, J. P., and Kirkpatrick, G. J. (1993). Algal pigment determinations in aquatic ecosystems: analytical evaluations, applications and recommendations. Curr. Top. Bot. Res. 1, 1–13.
Newell, B. S., Morgan, B., and Cundy, J. (1967). The determination of urea in seawater. J. Mar. Res. 25, 201–202.
Not, F., del Campo, J., Balagué, V., de Vargas, C., and Massana, R. (2009). New insights into the diversity of marine picoeukaryotes. PLoS ONE 4:e7143. doi: 10.1371/journal.pone.0007143
Oksanen, J., Blanchet, F. G., Kindt, R., Legendre, P., Minchin, P. R., O'Hara, R. B., et al. (2007). Package “vegan”: Community Ecology Package. R package version 2.0-10. Avaialbe online at: http://cran.r-project.org/web/packages/vegan/
Paerl, R. W., Foster, R. A., Jenkins, B. D., Montoya, J. P., and Zehr, J. P. (2008). Phylogenetic diversity of cyanobacterial narB genes from various marine habitats. Environ. Microbiol. 10, 3377–3387. doi: 10.1111/j.1462-2920.2008.01741.x
Quast, C., Pruesse, E., Yilmaz, P., Gerken, J., Schweer, T., Yarza, P., et al. (2012). The SILVA ribosomal RNA gene database project: improved data processing and web-based tools. Nucl. Acids Res. 41, D590–D596. doi: 10.1093/nar/gks1219
R Core Development Team. (2014). R: A Language and Environment for Statistical Computing. Vienna: R Foundation for Statistical Computing. Avaialbe online at: https://cran.r-project.org
Rii, Y. M., Brown, S. L., Nencioli, F., Kuwahara, V., Dickey, T. D., Karl, D. M., et al. (2008). The transient oasis: nutrient-phytoplankton dynamics and particle export in Hawaiian lee cyclones. Deep-Sea Res. II 55, 1275–1290. doi: 10.1016/j.dsr2.2008.01.013
Rothhaupt, K. O. (1996). Laboratorary experiments with a mixotrophic chrysophyte and obligately phagotrophic and photographic competitors. Ecology 77, 716–724. doi: 10.2307/2265496
Royston, J. P. (1982). An extension of Shapiro and Wilk's W test for normality to large samples. Appl. Stat. 31, 115–124. doi: 10.2307/2347973
Sakamoto, C. M., Karl, D. M., Jannasch, H. W., Bidigare, R. R., Letelier, R. M., Walz, P. M., et al. (2004). Influence of Rossby waves on nutrient dynamics and the plankton community structure in the North Pacific subtropical gyre. J. Geophys. Res. 109:C05032. doi: 10.1029/2003JC001976
Scharek, R., Latasa, M., Karl, D. M., and Bidigare, R. R. (1999). Temporal variations in diatom abundance and downward vertical flux in the oligotrophic North pacific gyre. Deep Sea Res. I 46, 1051–1075. doi: 10.1016/S0967-0637(98)00102-2
Shilova, I. N., Mills, M. M., Robidart, J. C., Turk-Kubo, K. A., Björkman, K. A., Kolber, Z., et al. (2017). Differential effects of nitrate, ammonium, and urea as N sources for microbial communities in the North Pacific Ocean. Limnol. Oceanogr. 62, 2550–2574. doi: 10.1002/lno.10590
Steeman Nielsen, E. (1952). The use of radioactive carbon (14C) for measuring organic production in the sea. J. Cons. Cons. Int. Explor. Mer 18, 117–140. doi: 10.1093/icesjms/18.2.117
Stoeck, T., Bass, D., Nebel, M., Christen, R., Jones, M. D., Breiner, H.-W., et al. (2010). Multiple marker parallel tag environmental DNA sequencing reveals a highly complex eukaryotic community in marine anoxic water. Mol. Ecol. 19, 21–31. doi: 10.1111/j.1365-294X.2009.04480.x
Strickland, J. D. H., Holm-Hansen, O., Eppley, R. W., and Linn, R. J. (1969). The use of a deep tank in plankton ecology. Limnol. Oceanogr. 14, 23–34. doi: 10.4319/lo.1969.14.1.0023
Strickland, J. D. H., and Parsons, T. R. (1972). A Practical Handbook of Seawater Analysis. Ottawa, ON: Fisheries Research Board of Canada Bulletin 167.
Timmermans, K. R., Van der Wagt, B., Veldhuis, M. J. W., Maatman, A., and De Baar, H. J. W. (2005). Physiological responses of three species of marine pico-phytoplankton to ammonium, phosphate, iron and light limitation. J. Sea. Res. 53, 109–120. doi: 10.1016/j.seares.2004.05.003
Timonin, A. G. (1969). Structure of pelagic associations – quantitative relationship between different trophic groups of plankton in frontal zones of tropical ocean. Oceanology 9, 686–694.
van de Poll, W. H., Vissier, R. J. W., and Buma, A. G. J. (2007). Acclimation to a dynamic irradiance regime changes excessive irradiance sensitivity of Emiliana huxleyi and Thalassiosira weissflogii. Limnol. Oceanogr. 52, 1430–1438. doi: 10.4319/lo.2007.52.4.1430
Venrick, E. L. (1993). Phytoplankton seasonality in the central North Pacific: the endless summer reconsidered. Limnol. Oceanogr. 38, 1135–1149. doi: 10.4319/lo.1993.38.6.1135
Venrick, E. L. (1997). Comparison of the phytoplankton species composition and structure in the Climax area (1973–1985) with that of Station ALOHA (1994). Limnol. Oceanogr. 42, 1643–1648. doi: 10.4319/lo.1997.42.7.1643
Venrick, E. L. (1999). Phytoplankton species structure in the central North Pacific 1973–1996: variability and persistence. J. Plankton Res. 21, 1029–1042. doi: 10.1093/plankt/21.6.1029
Villareal, T. A., Adornato, L., Wilson, C., and Schoenbaechler, C. A. (2011). Summer blooms of diatom-diazotroph assemblages and surface chlorophyll in the North Pacific gyre: a disconnect. J. Geophys. Res. 116:C03001. doi: 10.1029/2010JC006268
Viviani, D. A., Karl, D. M., and Church, M. J. (2015). Variability in photosynthetic production of dissolved and particulate organic carbon in the North Pacific subtropical gyre. Front. Mar. Sci. 2:763. doi: 10.3389/fmars.2015.00073
Wada, E., and Hattori, A. (1990). Nitrogen in the Sea: Forms, Abundance, and Rate Processes. Boca Raton, FL: CRC Press.
White, A. E., Letelier, R. M., Whitmire, A. L., Barone, B., Bidigare, R. R., Church, M. J., et al. (2015). Phenology of particle size distributions and primary productivity in the North Pacific subtropical gyre (Station ALOHA). J. Geophys. Res. Oceans 120, 7381–7399. doi: 10.1002/2015JC010897
Wickham, H. (2009). ggplot2: Elegant Graphics for Data Analysis. New York, NY: Springer Science and Business Media.
Wright, S. W., Jeffrey, S. W., Mantoura, R. F. C., Llewellyn, C. A., Bjornland, T., Repeta, D., et al. (1991). Improved HPLC method for the analysis of chlorophylls and carotenoids from marine phytoplankton. Mar. Ecol. Prog. Ser. 77, 183–196. doi: 10.3354/meps077183
Zhang, J., Kobert, K., Flouri, T., and Stamatakis, A. (2014). PEAR: a fast and accurate Illumina Paired-End reAd mergeR. Bioinformatics 30, 614–620. doi: 10.1093/bioinformatics/btt593
Zhu, F., Massana, R., Not, F., Marie, D., and Vaulot, D. (2005). Mapping of picoeucaryotes in marine ecosystems with quantitative PCR of the 18S rRNA gene. FEMS Microbiol. Ecol. 52, 79–92. doi: 10.1016/j.femsec.2004.10.006
Keywords: nitrogen, nitrate, ammonium, phytoplankton, eukaryotes, picoeukaryotes
Citation: Rii YM, Bidigare RR and Church MJ (2018) Differential Responses of Eukaryotic Phytoplankton to Nitrogenous Nutrients in the North Pacific Subtropical Gyre. Front. Mar. Sci. 5:92. doi: 10.3389/fmars.2018.00092
Received: 31 October 2017; Accepted: 06 March 2018;
Published: 21 March 2018.
Edited by:
Alison Buchan, University of Tennessee, Knoxville, United StatesReviewed by:
Jun Sun, Tianjin University of Science and Technology, ChinaAnne W. Thompson, Portland State University, United States
Copyright © 2018 Rii, Bidigare and Church. This is an open-access article distributed under the terms of the Creative Commons Attribution License (CC BY). The use, distribution or reproduction in other forums is permitted, provided the original author(s) and the copyright owner are credited and that the original publication in this journal is cited, in accordance with accepted academic practice. No use, distribution or reproduction is permitted which does not comply with these terms.
*Correspondence: Matthew J. Church, bWF0dC5jaHVyY2hAdW1vbnRhbmEuZWR1
†Present Address: Yoshimi M. Rii, Hawaii Institute of Marine Biology, University of Hawaii at Mānoa, Kāne‘ohe, HI, United States
Matthew J. Church, Flathead Lake Biological Station, University of Montana, Polson, MT, United States