 Mark J. Hopwood
 Ulf Riebesell
 Javier Arístegui
 Andrea Ludwig
 Eric P. Achterberg
 Nauzet Hernández
- 1GEOMAR Helmholtz Centre for Ocean Research Kiel, Kiel, Germany
- 2Instituto de Oceanografía y Cambio Global (IOCAG), Universidad de Las Palmas de Gran Canaria (ULPGC), Las Palmas, Spain
In the surface ocean, microorganisms are both a source of extracellular H2O2 and, via the production of H2O2 destroying enzymes, also one of the main H2O2 sinks. Within microbial communities, H2O2 sources and sinks may be unevenly distributed and thus microbial community structure could influence ambient extracellular H2O2 concentrations. Yet the biogeochemical cycling of H2O2 and other reactive oxygen species (ROS) is rarely investigated at the community level. Here, we present a time series of H2O2 concentrations during a 28-day mesocosm experiment where a pCO2 gradient (400–1,450 μatm) was applied to subtropical North Atlantic waters. Pronounced changes in H2O2 concentration were observed over the duration of the experiment. Initially H2O2 concentrations in all mesocosms were strongly correlated with surface H2O2 concentrations in ambient seawaters outside the mesocosms which ranged from 20 to 92 nM over the experiment duration (Spearman Rank Coefficients 0.79–0.93, p-values < 0.001–0.015). After approximately 9 days of incubation however, H2O2 concentrations had increased across all mesocosms, later reaching >300 nM in some mesocosms (2–6 fold higher than ambient seawaters). The correlation with ambient H2O2 was then no longer significant (p > 0.05) in all treatments. Furthermore, changes in H2O2 could not be correlated with inter-day changes in integrated irradiance. Yet H2O2 concentrations in most mesocosms were inversely correlated with bacterial abundance (negative Spearman Rank Coefficients ranging 0.59–0.94, p-values < 0.001–0.03). Our results therefore suggest that ambient H2O2 concentration can be influenced by microbial community structure with shifts toward high bacterial abundance correlated with low extracellular H2O2 concentrations. We also infer that the nature of mesocosm experiment design, i.e., the enclosure of water within open containers at the ocean surface, can strongly influence extracellular H2O2 concentrations. This has potential chemical and biological implications during incubation experiments due to the role of H2O2 as both a stressor to microbial functioning and a reactive component involved in the cycling of numerous chemical species including, for example, trace metals and haloalkanes.
Introduction
Reactive oxygen species (ROS) are ubiquitous in sunlit natural surface waters (Van Baalen and Marler, 1966; Moore et al., 1993; Miller and Kester, 1994). The most extensively measured ROS in the marine environment, H2O2, is present in the surface mixed layer at concentrations on the order of 10–100 nM (Price et al., 1998; Yuan and Shiller, 2001; Gerringa et al., 2004). In the surface ocean, H2O2 is known to be mainly produced by photochemistry (Fujiwara et al., 1993; Micinski et al., 1993) with a poorly quantified fraction produced via biochemical processes (Palenik et al., 1987; Croot et al., 2005; Milne et al., 2009). Biochemical processes are also used to explain H2O2 production in the dark (Palenik and Morel, 1988; Moffett and Zafiriou, 1990; Vermilyea et al., 2010).
H2O2 can cross cell membranes and cause a wide range of cellular damage, a process generically referred to as oxidative stress (Seaver and Imlay, 2001; Lesser, 2006; Imlay, 2008). Extracellular H2O2 is however not generally considered to be a major constraint on cellular growth under natural conditions in the marine environment because most microorganisms are thought to produce catalase and peroxidase enzymes which control H2O2 decomposition rates in the surface ocean (Moffett and Zafiriou, 1990; Petasne and Zika, 1997). However, recent work has challenged the assumption that extracellular H2O2 at nanomolar concentrations does not negatively influence cellular metabolism in surface seawater. The susceptibility of a range of marine microorganisms to H2O2 (Bogosian et al., 2000; Morris et al., 2011) and measurable effects on primary metabolism at extracellular H2O2 concentrations within the range of surface marine concentrations (Morris et al., 2011; Baltar et al., 2013) have been demonstrated. Furthermore, it has been suggested that microbes sensitive to H2O2 may not be cultivable under normal laboratory conditions (Morris et al., 2008, 2011), which may have severely biased our historical understanding of ROS interactions with marine microorganisms.
H2O2 production rates, decomposition rates, and effects on cellular functioning may vary widely at the species level (Palenik et al., 1987; Baltar et al., 2013). Furthermore, cross-group interactions may be important in regulating ambient extracellular H2O2 concentrations (Morris et al., 2011). Investigations at the community level are therefore required in order to comprehensively understand the interaction between biological processes and ROS in seawater. Mesocosm studies are one approach by which this could be achieved, yet rapid decay rates mean that investigating ROS during an offshore mesocosm experiment, with a setup for example as per Taucher (2017, this Research Topic), would be logistically challenging. A mesocosm experiment on a smaller and more accessible scale, with a similar pCO2 gradient and timespan, was therefore conducted in the subtropical waters of Gran Canaria in March 2016. Our objective was to compare changes in ROS and other short-lived reactive species over the timescale of an induced phytoplankton bloom across a broad pCO2 gradient. The pCO2 gradient was designed to encompass pCO2 under all plausible future climate scenarios until 2100 (IPCC Working Group 1, 2014) with the addition of some higher end-members to investigate potential thresholds with respect to CO2-sensitive ecological and biogeochemical processes.
Materials and Methods
Mesocosm Design
The mesocosm study, conducted in Taliarte Harbor, Gran Canaria in March 2016, used eight thermoplastic polyurethane bags with a 2 m diameter, a depth of ~3 m, a starting volume of ~8,000 L, and no lid or screen on top. The bags were mounted on a buoyant frame which was allowed to drift ~2–3 m away from a sampling jetty. After filling with ambient seawater (on 1 March, experiment day −4), pumped from outside Taliarte Harbor (depth 15 m), the mesocosms were allowed to function without nutrient addition for 21 days (Supplementary Figure 1). A pCO2 gradient across the eight mesocosms was induced on day 0 by the addition of varying volumes of filtered, CO2 saturated seawater using a custom made “spider” distribution device described by Riebesell et al. (2013). The pCO2 gradient (400–1,450 μatm) was designed to be similar to that used during the offshore KOSMOS mesocosm experiment conducted in Gando Bay, Gran Canaria in September/October 2014 (Taucher, 2017, this Research Topic). A further top-up of pCO2 saturated seawater was then made to the mesocosms as necessary to maintain the pCO2 gradient (Supplementary Figure 1) following CO2 outgassing. The precise volume of each mesocosm was determined (on day 18) by measuring salinity before, and after, the addition of 40 L freshwater to each mesocosm, similar to Czerny et al. (2013). A single macronutrient addition (3.1 μM nitrate, 1.5 μM silicate, and 0.2 μM phosphate) was then made (after day 18 sampling).
Analysis
H2O2 samples were collected in opaque 125 mL high density polyethylene (HDPE) bottles (Nalgene) which were pre-cleaned (1 day soak in detergent, 1 week soak in 1 M HCl, three rinses with de-ionized water; 18.2 MΩ·cm, Milli-Q, Millipore) and dried in a laminar flow hood prior to use. Sample bottles were rinsed once with seawater and filled with no headspace by gently submerging the bottles within the mesocosms. Chlorophyll a, bacterial abundance, chromophoric dissolved organic matter (CDOM) and macronutrient concentrations were determined from depth integrated water samples collected using 2.5 m long custom-made samplers with an internal volume of ~10 L. These samplers were constructed from polypropylene tubing with valves at both ends. After filling, by submerging into the mesocosms and closing the valves, the samplers were removed and gently inverted to facilitate mixing. Samplers were then slowly drained through 1 cm diameter silicone tubing into pre-rinsed (de-ionized water and then mesocosm water) 25 L transparent HDPE containers, which were then transferred to shaded boxes and moved to a dark, refrigerated room for sub-sampling. Analysis of chlorophyll a and macronutrients then began immediately.
Chlorophyll a was measured by fluorometry as per Welschmeyer (1994) and macronutrient concentrations (nitrate + nitrite, phosphate, silicate) were determined by colorimetry as per Hansen and Koroleff (1999). CDOM absorption spectra were measured with a 100 cm, 250 μL capillary (LPC100CM) connected via an optical fiber to a light source (DH2000BAC) and a USB2000+UV-VIS ES detector (Ocean Optics). The system was controlled using Spectra-suite software (Ocean Optics). Samples were injected into the capillary with a peristaltic pump at a flow rate of 1 mL min−1. Relative molecular weight was estimated from CDOM absorption by deriving the slope ratio (SR) as the ratio of the slope of the shorter wavelength region (275–295 nm) to that of the longer wavelength region (350–400 nm; Helms et al., 2008). The spectral slopes were calculated from the linear regression of the log-transformed absorption spectra.
H2O2 was always analyzed within 1 h of collection via flow injection analysis (FIA) using the Co(II) catalyzed oxidation of luminol (Yuan and Shiller, 1999). A FIA system was assembled and operated exactly as per Hopwood et al. (2017) resulting in a detection limit of <1 nM. Calibrations were run daily, and with every new reagent batch, by at least six standard additions of diluted H2O2 (TraceSelect, Fluka) to aged (stored at room temperature for >48 h) seawater (unfiltered). The stability of H2O2 stock solution was checked by measuring absorbance at 240 nm using a quartz 10 cm cell and a USB4000 spectrometer (Ocean Optics). H2O2 (TraceSelect, Fluka) was sequentially diluted weekly to create stock solutions of 100 mM and 100 μM using de-ionized water. With respect to the measurement of chemical species other than H2O2, the H2O2 luminol based FIA method is expected to be robust for measurements in oxygenated surface seawater (Yuan and Shiller, 1999, 2004).
Bacterial counts were obtained on depth integrated water samples. Two mL water samples were fixed with 1% paraformaldehyde (final concentration) and stored at −80°C until analysis. Samples were analyzed by flow cytometry (FACSCalibur, Becton Dickinson), with a 15 mW laser set to excite at 488 nm (Gasol and del Giorgio, 2000). Subsamples (400 μL) for the determination of heterotrophic bacteria were stained with the fluorochrome SybrGreen-I (4 μL) at room temperature for 20 min and run at a flow rate of 16 μL min−1. Cells were enumerated in a bivariate plot of 90° light scatter and green fluorescence. Molecular Probes latex beads (1 μm) were used as internal standards.
Ancillary Measurements
A CTD cast (using a CTD60M, Sea and Sun Technology) was conducted every sample collection day in all mesocosms. Additionally, a CTD cast was conducted on the sampling jetty adjacent to the mesocosms where a H2O2 sample in ambient seawater was also collected alongside every mesocosm sampling event. Photosynthetically active radiation (PAR) data was obtained from an ELDONET (Häder and Lebert, 2006) monitoring site located <200 m from the mesocosm jetty. Complete diurnal light profiles were available for experiment day 7 onwards, excluding days 12 and 13.
The diurnal change in H2O2 concentration in ambient seawater, and inside two mesocosms, was monitored by setting up FIA equipment on the mesocosm sampling jetty with a PTFE sampling line weighted to float ~10 cm below the water surface. Seawater was pumped continuously using a peristaltic pump (MiniPuls 3, Gilson) with a time delay between water inflow and analysis of ~60–120 s. The sample line was used without a filter and visually inspected regularly for blockage. Calibration was undertaken three times in every 24 h period by 6–8 standard additions of H2O2 into aged (>48 h in the dark) seawater. A coiled 3 m PTFE sample line, which could be extended to the bottom of the mesocosms, was used to determine whether H2O2 was vertically homogenous within the mesocosm bags. During the diurnal experiment monitoring ambient seawater, salinity was measured regularly (<3 h intervals) using a LF 325 conductivity meter (WTW) which was calibrated before use with a KCl solution.
During rain events, rainwater was collected by deploying open low density polyethylene (LDPE) bags adjacent to the mesocosms. Rainwater was diluted prior to analysis by spiking 200 μL unfiltered rainwater into 50 mL aged seawater with the H2O2 concentration in seawater measured before, and after, the rainwater spike.
Results
Mesocosm Time Series
Time series for the core parameters discussed herein are included in Supplementary Datasheet 1. Initial measurements in the mesocosms (2 March 2016, experiment day −3, after filling the mesocosms—but before any treatments were applied) verified that the enclosed waters were close to identical with respect to H2O2 concentration. Differences between the eight enclosures (range 38.3–40.9 nM, mean 39.3 ± 0.8 nM) were small compared to the detection limit of the analytical method (<1 nM; Croot et al., 2004; Hopwood et al., 2017) and the standard deviation of quadruple measurements of H2O2 in seawater collected on the sample jetty (mean 3.3 nM over the experiment duration). Depth profiles within a mesocosm bag (~3 m depth) were conducted on day 25 mid-afternoon, when any stratification was expected to be maximal, and verified that H2O2 concentration was relatively well-mixed with only a slight vertical gradient (increasing from 43 to 51 nM bottom-top, mean 47 ± 3.5 nM). On day 12, surface seawater collected using a small inflatable boat showed a range of H2O2 concentrations at different locations around Taliarte Harbor (39 ± 9.9 nM, n = 4), outside the harbor within 150 m of the coastline (63 ± 1.8 nM, n = 3) and outside the harbor >400 m offshore (38 ± 5.6 nM, n = 4). Ambient seawater concentrations within the harbor (used to determine a background concentration for comparison with the mesocosms) were therefore similar to those found in near-shore waters.
The imposition of a large pCO2 gradient across the mesocosm bags after sampling on day 0 had no clear prolonged effect on observed H2O2 concentrations (Figure 1A). Temporal trends in H2O2 concentration were relatively similar in all mesocosms until day 9 of the experiment with the standard deviation ranging from 0.7 to 13 nM. Data for mesocosm 1 are shown only until day 3, after which exchange with surrounding seawater occurred following leakage, and monitoring was thus discontinued. After day 9 the enclosed waters diverged and some mesocosms experienced swings to very high (>300 nM) H2O2 concentrations compared to ambient water (Figure 1A). Over the duration of the mesocosm experiment, ambient surface seawater H2O2 concentrations ranged from only 20–92 nM.
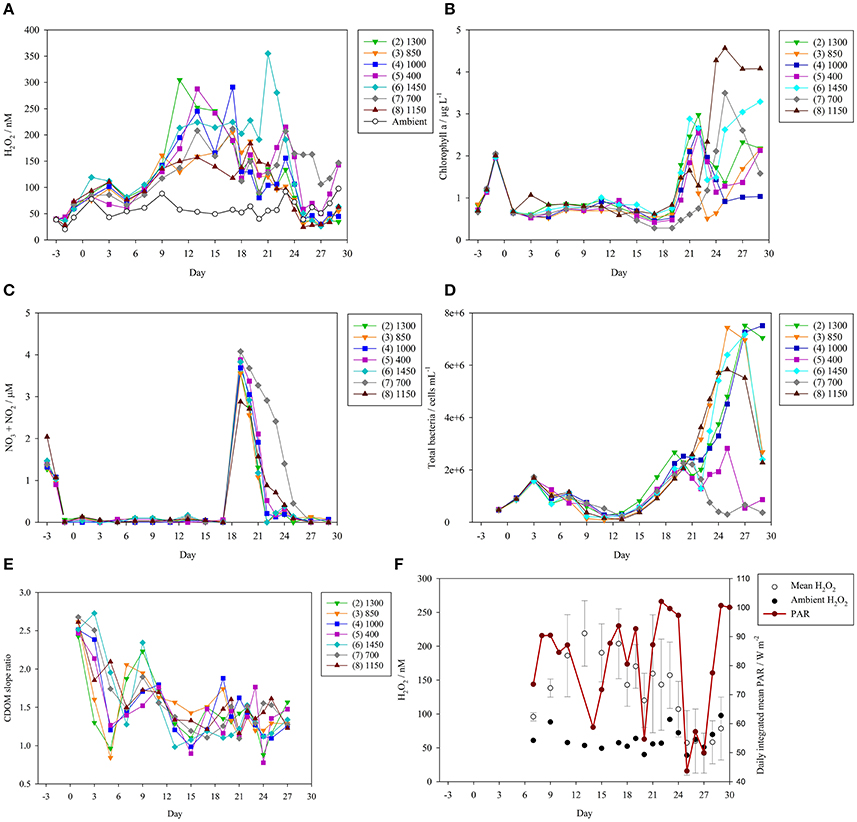
Figure 1. Time series of core parameters over the experiment duration. The eight mesocosms (numbered 1–8) were subject to a pCO2 gradient (400–1,450 μatm) imposed by the addition of CO2 saturated, filtered seawater on day 0 (5 March 2016). Labels refer to target pCO2 levels (μatm) which were obtained on pCO2 addition days (see Supplementary Figure 1). The 550 μatm pCO2 mesocosm (1) was discontinued after day 3 due to leakage and exchange with outside seawater and so no data is shown. (A) H2O2 concentrations (nM) during the mesocosm experiment. H2O2 concentration was also measured in ambient surface seawater outside the mesocosms (open circles). (B) Chlorophyll a concentrations (μg L−1, depth integrated samples) throughout the experiment. (C) Nitrate + nitrite concentrations (μM, depth integrated samples) throughout the experiment. One macronutrient addition (3.1 μM nitrate, 1.5 μM silicate, and 0.2 μM phosphate) was made on day 18 to stimulate a phytoplankton bloom. (D) Total bacteria (cells mL−1) during the mesocosm experiment. (E) Chromophoric dissolved organic matter (CDOM) slope ratio (SR), a dimensionless parameter that is inversely proportional to molecular weight. (F) Photosynthetically active radiation (PAR, mean irradiance integrated over each experiment day, W m−2), available only for experiment day 7 onwards, compared to ambient seawater and mean (±standard deviation) mesocosm H2O2 concentration.
The initial nitrate concentration present in ambient seawater was depleted rapidly after filling of the mesocosms (Figure 1C). Nitrate + nitrite fell to <0.1 μM in all mesocosms by day −1. Nitrate concentration then remained depleted until the macronutrient addition on day 18 (macronutrient addition occurred after sampling on day 18). Correspondingly, a small peak in chlorophyll a was observed in all mesocosms on day −1 (Figure 1B). Chlorophyll a then declined to low concentrations until a larger peak following the macronutrient addition on day 18. Maximum chlorophyll a was then observed in most mesocosms on days 21–22.
A notable exception to the general trend in mesocosm H2O2 under post-bloom conditions was mesocosm 7 (700 μatm pCO2). On days 25–27, H2O2 concentrations in the majority of mesocosms dropped below those measured in ambient seawater, but H2O2 in mesocosm 7 always remained >100 nM (Figure 1A). Mesocosm 7 was also anomalous with respect to the bloom development. In mesocosm 7 only it appeared that grazing may have impeded bloom development after nutrient addition (this was consistent with higher meso-zooplankton abundances in mesocosm 7, data not shown), as evidenced by a noticeably slower decline in nitrate concentration (Figure 1C) and a late peak in chlorophyll a (Figure 1B).
Bacterial abundance was similar in all mesocosms until after nutrient addition (Figure 1D). Unlike chlorophyll a however, an increase in bacterial abundance was evident in all treatments prior to the nutrient addition on day 18. A small dip in bacterial abundance was then evident in most mesocosms between days 19 and 22. Under post-bloom conditions bacterial abundance was lowest in the anomalous treatment (700 μatm) and the 400 μatm pCO2 mesocosm with notably elevated abundances in all pCO2 enriched treatments. The observed trend in bacterial abundance can be interpreted as resulting from grazing pressure, and enhanced growth rates post-nutrient addition. Bacterial abundance pre-nutrient addition was inversely related to nanoeukaryotes' abundance due to grazing pressure. The increase in bacterial abundance from day 13 reflected a decline in the abundance of nanoeukaryotes. After nutrient addition (day 18), grazing on bacteria was probably considerable, but bacterial growth was enhanced sufficiently to overcome grazing pressure (except in the anomalous treatment). An in depth discussion of phytoplankton community structure over the experiment duration will be presented in a companion text.
The trend in CDOM over the experiment duration was similar across all pCO2 treatments. The generally higher SR at the start of the experiment (Figure 1E) corresponds to lower mean molecular weight and suggests an overall increase in CDOM molecular weight over the experiment duration. Photochemical bleaching would be expected to have had the opposite effect; to have produced low molecular weight CDOM from high molecular weight CDOM (i.e., to have increased SR). Thus, the overall trend suggests that bacterial production of high molecular weight CDOM exceeded the rate of photochemical bleaching. Only between experiment days 7 and 13 was a sustained increase in SR evident across most mesocosms and this corresponded to a temporary decline in bacterial abundance (Figure 1D).
Photosynthetically active radiation (PAR) data was available from day 7 until the end of the mesocosm experiment (Figure 1F) from a recording site close to the mesocosm jetty (<200 m displacement). Integrated daily PAR was subject to notable variations over the duration of the experiment ranging from a mean irradiance of 44 (day 25) to 102 (day 22) W m−2.
Diurnal Cycling of H2O2
The diurnal cycling of H2O2 was followed both in ambient seawater (Figure 2) and inside mesocosm numbers 6 (1,450 μatm pCO2, Figure 3A) and 5 (400 μatm pCO2, Figure 3B) on days 22 and 23, respectively. Gaps in the data series corresponded to periods when standard additions were analyzed, the FIA instrument was cleaned, or malfunctions occurred such as air bubbles which occasionally resulted in missed data collection points. Generally, a clear increase in H2O2 associated with daylight was evident in all three diurnal datasets (Figures 2, 3). Yet H2O2 concentrations were much higher throughout the diurnal cycle within the mesocosms compared to ambient waters. In all three diurnal cycles, peak H2O2 concentration occurred mid-late afternoon (times refer to UTC). In the two mesocosms where diurnal H2O2 concentration was followed, the range between peak and minimum H2O2 was similar (180–300 nM, mesocosm 5, day 23; 160–300 nM, mesocosm 6, day 22), despite the pronounced difference in pCO2 (400 μatm [5] compared 1,450 μatm [6]) and the 2 h offset between the timing of peak daytime H2O2 concentration (Figure 3). In ambient seawater, the amplitude of diurnal variation in H2O2 (~20–30 nM, Figure 2) was very similar to that reported previously in the central Atlantic Ocean (25 nM, Yuan and Shiller, 2001).
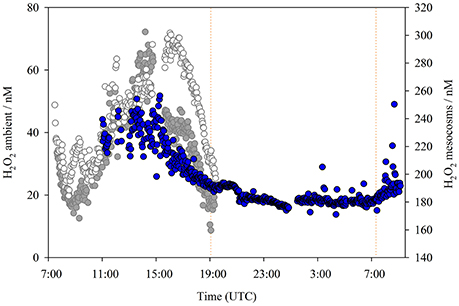
Figure 2. H2O2 concentrations (nM) in ambient waters adjacent to the mesocosm sampling jetty over a complete diurnal cycle at ~2 min resolution (blue circles), superimposed on H2O2 concentrations for different days (as per Figure 3) from within the 1,450 μatm pCO2 (dark gray) and 400 μatm pCO2 (light gray) mesocosms Ambient H2O2 concentration data collected 5–6 March 2016. All times are UTC, sunrise/sunset (illustrated) refers to Las Palmas: sunrise (5 March) 7:21, sunset (5 March) 19:04, sunrise (6 March) 07:20. The sample line was positioned at ~10 cm depth. There was no large change in surface salinity over the experiment duration (range 0.2 practical salinity units).
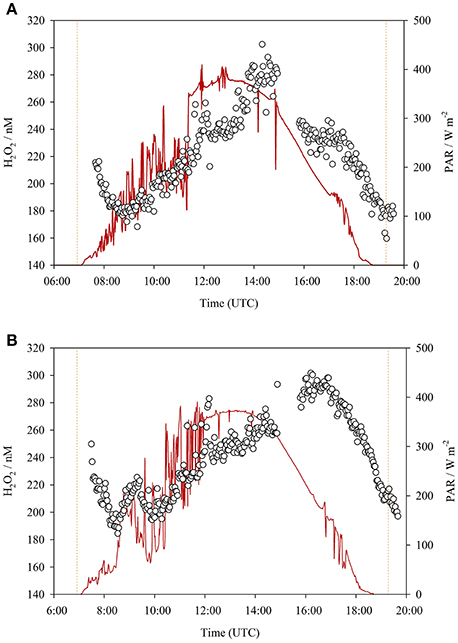
Figure 3. (A) H2O2 measured in mesocosm 6 (1450 μatm pCO2) surface water over a diurnal cycle (experiment day 22, 27 March 2016, sunrise 06:56, and sunset 19:17). (B) H2O2 measured in mesocosm 5 (400 μatm pCO2) surface water over a diurnal cycle (experiment day 23, 28 March 2016, sunrise 06:55, and sunset 19:17). In both cases the sample line was positioned at ~10 cm depth. Times are UTC, sunrise/sunset refers to Las Palmas, Gran Canaria. PAR (red lines) recorded at an ELDONET site <200 m from the mesocosm jetty.
Two curious features were notable in both mesocosm diurnal cycles (Figure 3). These features could only be observed by virtue of the very high data resolution and, to some extent, also the relatively high H2O2 concentrations within the mesocosms compared to ambient waters. First, peak H2O2 concentrations occurred >1 h after peak irradiance. PAR data from ELDONET was not available for the seawater diurnal study date (Figure 2), but noting the timing of peak H2O2, there was likely approximately a 1 h offset between peak irradiance and peak H2O2 here also. Second, the net decline in H2O2 concentration which occurred in the dark continued until sometime after sunrise in both mesocosm studies (Figure 3). An increase in H2O2 was not apparent until after PAR increased above ~100 W m−2. This was not apparent in the ambient seawater study (Figure 2) where a relatively stable concentration of 18.1 ± 1.3 nM was maintained from 21:11 to 07:20 (sunrise) with a sustained rise in H2O2 thereafter. This time offset could simply therefore have related to the incident solar angle as the mesocosm walls may have reduced the rate of light induced H2O2 formation at low incident solar angles.
Minor H2O2 Additions From Rainwater
The open design of the mesocosms created the potential for significant atmospheric deposition of H2O2. Rain water H2O2 concentrations were quantified for the two rainfall events during the mesocosm experiment with sufficient amounts of deposition (>1 mm) to facilitate sampling (Table 1) and were similar to values reported elsewhere over the Atlantic (Zika et al., 1982; Kieber et al., 2001). H2O2 concentrations in rainwater are thought to be sufficiently high to offset the expected beneficial effect of rainwater derived nutrient and micro-nutrient addition on primary production when rainwater is mixed with seawater (Willey et al., 2004) unless the dilution factor is high. The calculated H2O2 addition to mesocosms resulting from rainfall in Gran Canaria was however modest relative to the mesocosm H2O2 concentrations due to the low ratio of rain:mesocosm volume (Table 1).
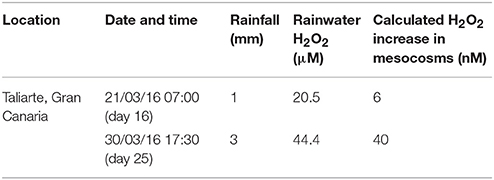
Table 1. Contribution of rainwater events to H2O2 concentrations in the mesocosms.
Discussion
Diurnal Cycling of H2O2
Photochemical processes are thought to be the dominant influence on ambient H2O2 concentrations in the surface ocean (O'Sullivan et al., 2005; Steigenberger and Croot, 2008), with large scale spatial variations typically explained in terms of latitudinal changes in light and ocean temperature (Yocis et al., 2000; Yuan and Shiller, 2001). In the high-resolution temporal experiments a clear diurnal cycle in H2O2 concentration was evident, both inside and outside the mesocosm bags (Figures 2, 3). The amplitude of H2O2 concentration over a diurnal cycle was however much greater inside the mesocosms (100 nM compared to 20–30 nM in ambient seawater). H2O2 concentrations over the 28 day duration of the mesocosm experiment (Figure 1A) were always measured at 14:00–15:00 (UTC) daily to ensure that the month long data series was not affected unduly by diurnal variation.
During overnight monitoring of ambient H2O2 it appeared that an equilibrium concentration of 18 nM was maintained in the dark (Figure 2). This was indicative of a dark production mechanism, such as that highlighted in prior work (Palenik and Morel, 1988; Moffett and Zafiriou, 1990), sufficient to offset H2O2 decay. Whilst photochemical processes are no doubt a major source of H2O2, inter-day changes in integrated PAR were only significantly correlated with the H2O2 trend in ambient seawater (Spearman rank correlation 0.73, p value 0.002, n = 14) and in the 400 μatm mesocosm (Table 2). In all other mesocosms there was no apparent correlation between integrated daily PAR and H2O2 concentration from days 7–29.
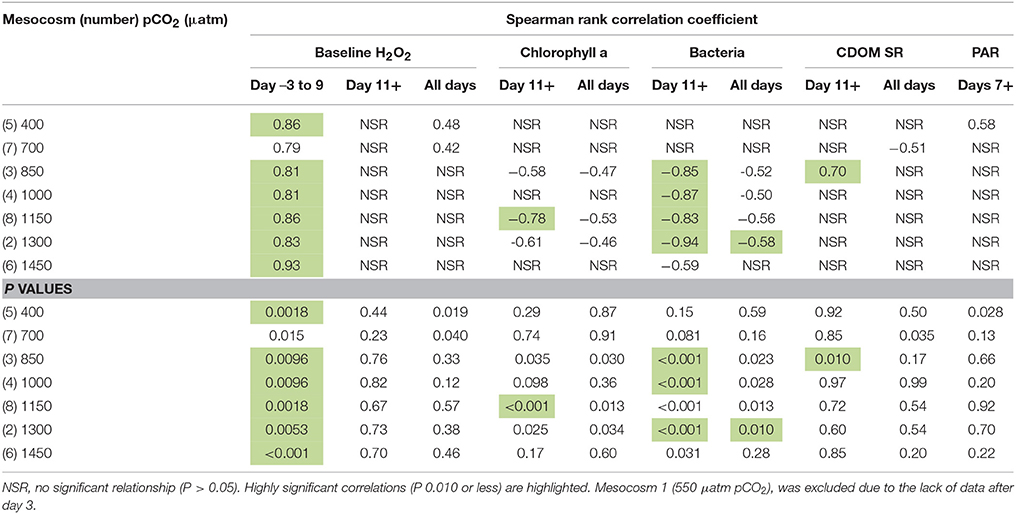
Table 2. Spearman rank correlation coefficients and p values for H2O2 concentration time series in each mesocosm compared to: baseline H2O2 concentration in ambient seawater (nM), chlorophyll a (μg L−1), total bacteria (cells mL−1), colored dissolved organic matter slope ratio (SR), and daily integrated mean photosynthetically active radiation (PAR, W m−2).
The two high-resolution diurnal cycles within mesocosms (Figure 3) revealed some interesting features that would not be apparent at lower H2O2 concentrations (due to the increased signal:noise ratio) or reduced sampling resolution. An offset between irradiance and H2O2 concentration was reflected in the later delayed peak in H2O2 compared to maximum irradiance. Partial shading of the mesocosms in the early morning and late afternoon could create a local PAR exposure that was reduced compared to that reported by a mounted sensor. However, as the displacement of the sensor was <200 m from the mesocosms, this could not explain the offset between peak H2O2 and peak irradiance in the mid-afternoon. Instead, we suggest that net biological production of H2O2 is slightly offset from irradiance. A critical factor, not measured herein, which likely affects the net rate of change in H2O2 concentration during daylight hours is the production rate of peroxidase or catalase enzymes. This process is known to be diurnally variable, with oxidative defenses more active during daylight hours (Morris et al., 2016). Whilst it is not clear if this response under natural conditions is triggered by increasing H2O2 induced stress or by a circadian rhythm, the rate and efficiency (which may also change with incident light) of enzymatic H2O2 removal are likely to be key influences on the shape of the diurnal H2O2 trend.
Correlation of H2O2 in Mesocosms With Core Parameters
Between days −3 and 9 the range of H2O2 within the different mesocosms was small (<45 nM) and the behavior of chlorophyll a and nitrate very similar across all mesocosms (Figures 1A–C). During this early phase, H2O2 inside and outside the mesocosms was relatively well correlated across all pCO2 conditions (positive Spearman Rank Coefficients of 0.79–0.93). Combined with the comparability of the diurnal H2O2 cycle in 400 and 1,450 μatm pCO2 mesocosms (Figure 3), despite the extreme pCO2 difference, this suggests that the direct effect of the pCO2 gradient (applied after day 0) on H2O2 concentrations was minimal.
In contrast to the early stage of the experiment, H2O2 concentrations in the mesocosms diverged after day 9 and there was then no longer a statistically significant relationship between the paired H2O2 concentrations in and outside the mesocosm (Spearman Rank Correlation P > 0.05, Table 2) for any pCO2 treatment. If irradiance was the dominant factor controlling extracellular H2O2 concentrations throughout the experiment, we would expect H2O2 concentrations to have remained similar across all mesocosms and to remain correlated with H2O2 in ambient water outside the mesocosms. Yet this was not the case. Variations in daily integrated PAR, available from day 7 onwards, could explain some of the variation in background seawater H2O2, but inter-day changes in PAR were only significantly correlated with H2O2 in the 400 μatm mesocosm (Table 2).
Formation of ROS generally increases with dissolved organic carbon concentration in estuarine waters and this is specifically linked to the presence of terrestrially derived humic material (Timko et al., 2014) which has a relatively large component of CDOM. However, CDOM properties are not clearly linked to increasing H2O2 concentrations in offshore seawater (O'Sullivan et al., 2005). The general decline in SR throughout the mesocosms (from day 1 to day 27, Figure 1E) suggested that in situ production of higher molecular weight CDOM was sufficient to offset photo bleaching. However, this was not clearly related to any change in H2O2 concentration as no clear correlation was found between SR and H2O2 either over the whole experiment or specifically for days 11+ (Table 2).
Similarly, the overall trend in H2O2 concentration could not be related directly to macronutrient depletion. The observed nitrate concentrations were similar across all mesocosms until after the addition of macronutrients on day 18 (Figure 3) and there was no consistent trend in H2O2 concentration in the days immediately following this addition. Most mesocosms obtained the highest measured H2O2 concentration between days 9–18. Yet mesocosm 6 was notable for obtaining a peak H2O2 concentration 3 days after the nutrient addition. A sustained drop in H2O2 concentration across all mesocosms (apart from the anomalous mesocosm 7) was only observed between days 23–25.The lowest H2O2 concentrations, both within the mesocosm experiment and relative to ambient seawater, were observed in this post-bloom phase when bacterial abundance peaked (Figure 1D) and when daily integrated PAR was persistently low for 3 days (Figure 1F).
A Contribution to H2O2 From Mesocosm Design?
H2O2 concentrations might be expected to be generally higher inside the mesocosms due to the nature of their design. Sunlight is attenuated with depth, so in a natural surface mixed layer H2O2 is formed predominantly at the surface and then physically mixed throughout the surface mixed layer (Johnson et al., 1989; Miller and Kester, 1994), although sub-surface H2O2 peaks can occasionally be observed at the chlorophyll a maxima (Yuan and Shiller, 2001; Croot et al., 2005; Steigenberger and Croot, 2008). The confinement of the surface 3 m within the mesocosm bags used here thereby encloses the water with the highest light exposure and, throughout most of this experiment, a high level of biological activity relative to ambient seawater, whilst removing the physical processes that would constantly act to mix H2O2 into deeper waters. The enclosure of seawater was thereby a likely factor contributing to the high H2O2 concentrations occurring during the middle (days 9–18) of the mesocosm experiment. Yet this alone does not explain the divergence in H2O2 levels between the various mesocosms after day 9 (Figure 1A). The timings of the initial mini-bloom after the mesocosms were filled, of the macronutrient addition and the subsequent bloom were (with the exception of mesocosm 7) relatively uniform (Figures 1B,C).
A Link Between Community Structure and Extracellular H2O2?
Two possible explanations for why H2O2 concentrations were so variable between mesocosms, which are not mutually exclusive, are that either the biological H2O2 source(s) or the biological H2O2 sink(s) varied because of different microbial communities across the pCO2 gradient. An anti-correlation between bacterial abundance and extracellular H2O2 concentrations is therefore intriguing. Microorganisms are simultaneously both a H2O2 source and a H2O2 sink. ROS are generated as waste products from aerobic cellular metabolism (Kruk, 1998; Apel and Hirt, 2004), with H2O2 produced both directly and from the decay of other ROS (for example, the enzyme superoxide dismutase produces H2O2 from ; McCord and Fridovich, 1969). Conversely, biological H2O2 sinks arise from both synthesis of H2O2 destroying enzymes (catalase and peroxidase) and also, under some circumstances, serendipitously with increasing biomass. The quenching of extracellular H2O2 with increasing biomass is referred to as “self-shading” and has been described both in monocultures of Prochlorococcus, which lacks catalase-peroxidase genes (Morris et al., 2011) and at the community level (Barros and Colepicolo, 2003). It presumably arises from physical shading and/or non-enzymatic ROS sinks.
The anti-correlation between H2O2 concentrations in each mesocosm both with chlorophyll a and with total bacterial abundance over the duration of the experiment (Table 2) was statistically significant in most mesocosms. Overall there was a significant (P < 0.05) anti-correlation between chlorophyll a and H2O2 concentrations with negative correlation coefficients (Table 2) in mesocosms 3, 4, 8, and 2 (850–1,300 μatm pCO2). The anti-correlation was slightly stronger when the initial phase of the experiment (Days −3 to 9, when the range of H2O2 concentrations across all mesocosms was relatively narrow) was excluded. A negative relationship between chlorophyll a and H2O2 concentrations could arise from an increasing biological H2O2 sink simply due to self-shading associated with increasing biomass, yet no correlation with chlorophyll a was found either at low (400, 700 μatm) or at the highest (1,450 μatm) pCO2 treatments. For bacteria, the correlation followed the same pattern as chlorophyll a with respect to pCO2, yet the effect was stronger and more significant. From day 11 onwards, the intermediate pCO2 mesocosms (850–1,300 μatm) all exhibited a strong negative correlation (Spearman Rank Coefficients of −0.83 to −0.94) between bacteria cell counts and H2O2 concentration (P values < 0.001). This suggests that under post-bloom conditions, bacteria were an important net-sink for extracellular H2O2.
As both cellular H2O2 production and defense mechanism activity vary over diurnal cycles and at the species level, it is difficult to separate the source and sink terms within separate mesocosms and over the pCO2 gradient. Yet in any case, the effects of a pCO2 gradient on H2O2 concentration were apparently indirect, resulting from changes to bacterial abundance and community composition rather than directly arising as a consequence of perturbing the carbonate system alone.
Effects of Elevated H2O2 Under Experimental Conditions?
Reported H2O2 concentrations in seawater incubated under laboratory conditions are typically 100–300 nM (e.g., Coe et al., 2016), but can be much higher depending on the buffer composition and irradiance exposure (Morris and Zinser, 2013). In a spot-check of baseline H2O2 concentrations in incubated seawater (with added nutrients) in our own laboratory, we found 42 ± 50 nM H2O2 in freshly made mixtures (made from seawater which was previously stored in the dark for >1 year) and 180 ± 130 nM in the same water after 72 h of incubation subject to a diel light cycle. In all these cases, the H2O2 concentrations in seawater incubated under laboratory conditions are thereby at the mid-high end of the range observed in the surface ocean (Price et al., 1998; Yuan and Shiller, 2001; Hopwood et al., 2017).
The unmodified concentrations of H2O2 in growth media are sufficiently high to prevent the cultivation of some microorganisms, including strains of Prochlorococcus, under laboratory conditions (Morris et al., 2011). However, uncertainties remain about what the effects of elevated H2O2 are at the community level. Whilst H2O2 is not widely investigated during mesocosm studies, field evidence suggests that increases in H2O2 to concentrations less than the peaks observed here (Figure 1A) can affect a broad range of biogeochemical processes. Additions of 10–100 nM H2O2 to water from 100 m in the North Atlantic were found to reduce the extracellular activity of β-glucosidase, alkaline phosphatase, and leucine aminopeptidase by 20–80% with the inhibition effect consistently strongest on β-glucosidase (Baltar et al., 2013). A similar small absolute increase of only 30 nM is reported to suppress rates of ammonia oxidation to below detection in surface (10 m depth) Antarctic seawater (Tolar et al., 2016) where the initial natural concentration of H2O2 was low (14 nM). Additional specific effects of increasing extracellular H2O2 concentrations in seawater can also be deduced from laboratory experiments. For example, an increase on the order of 100 nM H2O2 is sufficient to measurably decrease the half-life of Fe(II), thereby theoretically decreasing dissolved Fe bioavailability (González-Davila et al., 2005), and to double brominating activity in some diatoms (Hughes and Sun, 2016).
A particularly curious phenomenon observed here was the extremely high H2O2 concentrations observed during the pre-bloom phase of the experiment (Figure 1A). It is questionable to what extent this phenomenon would occur in a natural environment because small-scale mesocosms inevitably fail to mimic the mixing processes that occur within the natural water column. Nevertheless, the potential for oxidative stress from extracellular ROS to be increased under natural, or incubated, oligotrophic conditions should be investigated concurrently with other stressors to understand the interactive effect(s) on microbial functioning. As outlined above, the sensitivity of some enzymatic processes to increasing extracellular H2O2 concentrations and the involvement of H2O2 in the biogeochemical cycling of various chemicals including the micronutrient Fe, means that large perturbations to H2O2 during mesocosm experiments are undesirable.
Conclusions
During the progression of a 28 day mesocosm experiment in North Atlantic waters an applied pCO2 gradient (400–1,450 μatm) had no discernable direct effect upon extracellular H2O2 concentrations. Whilst a clear diurnal trend in H2O2 was observed, both within high/low pCO2 mesocosms and in ambient waters, inter-day variation in PAR was not correlated with mesocosm H2O2 concentrations.
The general elevation of H2O2 above ambient North Atlantic concentrations was attributed to the effect of enclosing seawater in an open mesocosm at the ocean surface. Yet during the pre-bloom phase of the experiment, unexpected swings occurred to H2O2 concentrations >300 nM. Across the majority of mesocosms, bacteria appeared to be a net-sink for H2O2, particularly under post-bloom conditions. Thus, microbial community structure does appear to strongly influence extracellular H2O2 concentrations.
Given the multitude of possible direct and indirect, chemical and biological effects of large changes to H2O2 concentrations, it is important to consider to what extent ROS are a source of oxidative stress in the natural surface ocean and how well experiments manipulate the natural environment with respect to this stressor.
Author Contributions
All authors contributed to the design of the study. Fieldwork and analytical work was conducted by MH, UR, AL, JA, and NH. MH wrote the initial draft of the manuscript and then all authors contributed to its revision.
Funding
Funding for this mesocosm study was provided by the Kiel Excellence Cluster The Future Ocean and by the German Research Foundation (DFG) through the Leibniz Award 2012 to UR. MH and EA gratefully acknowledge financial aid from the European Commission (OCEAN-CERTAIN, FP7-ENV-2013-6.1-1; no: 603773) and the Collaborative Research Centre 754 (SFB 754) Climate-Biogeochemistry Interactions in the Tropical Ocean funded by the German Research Foundation (DFG). JA was supported by a Helmholtz International Fellow Award, 2015 (Helmholtz Association, Germany). NH was partially supported by the FLUXES project (CTM2015-69392-C3-1-R) funded by the Spanish government (Plan Nacional I+D).
Conflict of Interest Statement
The authors declare that the research was conducted in the absence of any commercial or financial relationships that could be construed as a potential conflict of interest.
Acknowledgments
The KOSMOS/PLOCAN teams assisting with all aspects of mesocosm organization are thanked for logistical support. Leila Kittu and Syrmalenia Kotronaki are thanked for chlorophyll a and macronutrient data. Labview software for operating the H2O2 FIA system was designed by P. Croot, M. Heller, C. Neill, and W. King. Statistics were performed in SigmaPlot.
Supplementary Material
The Supplementary Material for this article can be found online at: https://www.frontiersin.org/articles/10.3389/fmars.2018.00105/full#supplementary-material
Supplementary Figure 1. Mesocosm timeline labeled with experiment days (used throughout the text). Day −4, when the mesocosms were filled, was 1 March 2016. A pH gradient was imposed on day 0 by the addition of CO2 saturated, filtered seawater. Further pCO2 additions were then made as necessary to compensate for out-gassing. The volume of each mesocosm was determined on day 18 by measuring the change in salinity resulting from a freshwater addition. A single macronutrient spike was then added after sampling on day 18.
Supplementary Datasheet 1. Mesocosm time series data for core parameters used: chlorophyll a, nitrate + nitrite, hydrogen peroxide, bacterial abundance and CDOM SR.
References
Apel, K., and Hirt, H. (2004). Reactive oxygen species: metabolism, oxidative stress, and signal transduction. Annu. Rev. Plant Biol. 55, 373–399. doi: 10.1146/annurev.arplant.55.031903.141701
Baltar, F., Reinthaler, T., Herndl, G. J., and Pinhassi, J. (2013). Major effect of hydrogen peroxide on bacterioplankton metabolism in the Northeast Atlantic. PLoS ONE 8:e61051. doi: 10.1371/journal.pone.0061051
Barros, M. P., and Colepicolo, P. (2003). Self-shading protects phytoplankton communities against H2O2-induced oxidative damage. Aquat. Microb. Ecol. 30, 275–282. doi: 10.3354/ame030275
Bogosian, G., Aardema, N. D., Bourneuf, E. V., Morris, P. J. L., and O'Neil, J. P. (2000). Recovery of hydrogen peroxide-sensitive culturable cells of Vibrio vulnificus gives the appearance of resuscitation from a viable but nonculturable state. J. Bacteriol. 182, 5070–5075. doi: 10.1128/JB.182.18.5070-5075.2000
Coe, A., Ghizzoni, J., LeGault, K., Biller, S., Roggensack, S. E., and Chisholm, S. W. (2016). Survival of Prochlorococcus in extended darkness. Limnol. Oceanogr. 61, 1375–1388. doi: 10.1002/lno.10302
Croot, P. L., Laan, P., Nishioka, J., Strass, V., Cisewski, B., Boye, M., et al. (2005). Spatial and temporal distribution of Fe(II) and H2O2 during EisenEx, an open ocean mescoscale iron enrichment. Mar. Chem. 95, 65–88. doi: 10.1016/j.marchem.2004.06.041
Croot, P. L., Streu, P., Peeken, I., Lochte, K., and Baker, A. R. (2004). Influence of the ITCZ on H2O2 in near surface waters in the equatorial Atlantic Ocean. Geophys. Res. Lett. 31:L23S04. doi: 10.1029/2004GL020154
Czerny, J., Schulz, K. G., Krug, S. A., Ludwig, A., and Riebesell, U. (2013). Technical note: the determination of enclosed water volume in large flexible-wall mesocosms KOSMOS. Biogeosciences 10, 1937–1941. doi: 10.5194/bg-10-1937-2013
Fujiwara, K., Ushiroda, T., Takeda, K., Kumamoto, Y., and Tsubota, H. (1993). Diurnal and seasonal distribution of hydrogen-peroxide in seawater of the seto inland sea. Geochem. J. 27, 103–115. doi: 10.2343/geochemj.27.103
Gasol, J. M., and del Giorgio, P. A. (2000). Using flow cytomery for counting natural planktonic bacteria and understanding the structure of planktonic bacterial communities. Sci. Mar. 64, 197–224. doi: 10.3989/scimar.2000.64n2197
Gerringa, L. J. A., Rijkenberg, M. J. A., Timmermans, R., and Buma, A. G. J. (2004). The influence of solar ultraviolet radiation on the photochemical production of H2O2 in the equatorial Atlantic Ocean. J. Sea Res. 51, 3–10. doi: 10.1016/j.seares.2003.03.002
González-Davila, M., Santana-Casiano, J. M., and Millero, F. J. (2005). Oxidation of iron (II) nanomolar with H2O2 in seawater. Geochim. Cosmochim. Acta 69, 83–93. doi: 10.1016/j.gca.2004.05.043
Häder, D.-P., and Lebert, M. (2006). “Eldonet—European light dosimeter network BT - environmental UV radiation: impact on ecosystems and human health and predictive models,” in Proceedings of the NATO Advanced Study Institute on Environmental UV Radiation: Impact on Ecosystems and Human Health, eds F. Ghetti, G. Checcucci, and J. F. Bornman (Dordrecht: Springer Netherlands), 95–108.
Hansen, H. P., and Koroleff, F. (1999). “Determination of nutrients,” in Methods of Seawater Analysis, eds K. Grasshoff, K. Kremling, and M. Ehrhardt (New York, NY: Wiley-VCH Verlag GmbH), 159–228.
Helms, J. R., Stubbins, A., Ritchie, J. D., Minor, E. C., Kieber, D. J., and Mopper, K. (2008). Absorption spectral slopes and slope ratios as indicators of molecular weight, source, and photobleaching of chromophoric dissolved organic matter. Limonol. Oceanogr. 53, 955–969. doi: 10.4319/lo.2008.53.3.0955
Hopwood, M. J., Rapp, I., Schlosser, C., and Achterberg, E. P. (2017). Hydrogen peroxide in deep waters from the Mediterranean Sea, South Atlantic and South Pacific Oceans. Sci. Rep. 7:43436. doi: 10.1038/srep43436
Hughes, C., and Sun, S. (2016). Light and brominating activity in two species of marine diatom. Mar. Chem. 181, 1–9. doi: 10.1016/j.marchem.2016.02.003
Imlay, J. A. (2008). Cellular defenses against superoxide and hydrogen peroxide. Annu. Rev. Biochem. 77, 755–776. doi: 10.1146/annurev.biochem.77.061606.161055
IPCC Working Group 1 (2014). IPCC Fifth Assessment Report (AR5) - The Physical Science Basis. IPCC Working Group.
Johnson, K. S., Willason, S. W., Wiesenburg, D. A., Lohrenz, S. E., and Arnone, R. A. (1989). Hydrogen peroxide in the western Mediterranean Sea: a tracer for vertical advection. Deep Sea Res. Oceanogr. Res. Pap. 36, 241–254. doi: 10.1016/0198-0149(89)90136-2
Kieber, R. J., Peake, B., Willey, J. D., and Jacobs, B. (2001). Iron speciation and hydrogen peroxide concentrations in New Zealand rainwater. Atmos. Environ. 35, 6041–6048. doi: 10.1016/S1352-2310(01)00199-6
Kruk, I. (1998). Environmental Toxicology and Chemistry of Oxygen Species, 1st Edn. Berlin; Heidelberg: Springer-Verlag.
Lesser, M. P. (2006). Oxidative stress in marine environments: biochemistry and physiological ecology. Annu. Rev. Physiol. 68, 253–278. doi: 10.1146/annurev.physiol.68.040104.110001
McCord, J. M., and Fridovich, I. (1969). Superoxide dismutase. An enzymic function for erythrocuprein (hemocuprein). J. Biol. Chem. 244, 6049–6055.
Micinski, E., Ball, L. A., and Zafiriou, O. C. (1993). Photochemical oxygen activation: superoxide radical detection and production rates in the eastern Caribbean. J. Geophys. Res. Ocean. 98, 2299–2306. doi: 10.1029/92JC02766
Miller, W. L., and Kester, D. R. (1994). Peroxide variations in the Sargasso Sea. Mar. Chem. 48, 17–29. doi: 10.1016/0304-4203(94)90059-0
Milne, A., Davey, M. S., Worsfold, P. J., Achterberg, E. P., and Taylor, A. R. (2009). Real-time detection of reactive oxygen species generation by marine phytoplankton using flow injection-chemiluminescence. Limnol. Oceanogr. 7, 706–715. doi: 10.4319/lom.2009.7.706
Moffett, J. W., and Zafiriou, O. C. (1990). An investigation of hydrogen peroxide chemistry in surface waters of Vineyard Sound with O2 and 18O2. Limnol. Oceanogr. 35, 1221–1229. doi: 10.4319/lo.1990.35.6.1221
Moore, C. A., Farmer, C. T., and Zika, R. G. (1993). Influence of the Orinoco River on hydrogen peroxide distribution and production in the eastern Caribbean. J. Geophys. Res. 98:2289. doi: 10.1029/92JC02767
Morris, J. J., Johnson, Z. I., Szul, M. J., Keller, M., and Zinser, E. R. (2011). Dependence of the cyanobacterium Prochlorococcus on hydrogen peroxide scavenging microbes for growth at the ocean's surface. PLoS ONE 6:e16805. doi: 10.1371/journal.pone.0016805
Morris, J. J., Johnson, Z. I., Wilhelm, S. W., and Zinser, E. R. (2016). Diel regulation of hydrogen peroxide defenses by open ocean microbial communities. J. Plankton Res. 38, 1103–1114. doi: 10.1093/plankt/fbw016
Morris, J. J., Kirkegaard, R., Szul, M. J., Johnson, Z. I., and Zinser, E. R. (2008). Facilitation of robust growth of Prochlorococcus colonies and dilute liquid cultures by “helper” heterotrophic bacteria. Appl. Environ. Microbiol. 74, 4530–4534. doi: 10.1128/AEM.02479-07
Morris, J., and Zinser, E. R. (2013). Continuous hydrogen peroxide production by organic buffers in phytoplankton culture media. J. Phycol. 49, 1223–1228. doi: 10.1111/jpy.12123
O'Sullivan, D. W., Neale, P. J., Coffin, R. B., Boyd, T. J., and Osburn, C. L. (2005). Photochemical production of hydrogen peroxide and methylhydroperoxide in coastal waters. Mar. Chem. 97, 14–33. doi: 10.1016/j.marchem.2005.04.003
Palenik, B., and Morel, F. M. M. (1988). Dark production of H2O2 in the Sargasso Sea. Limnol. Oceanogr. 33, 1606–1611. doi: 10.4319/lo.1988.33.6_part_2.1606
Palenik, B., Zafiriou, O. C., and Morel, F. M. M. (1987). Hydrogen peroxide production by a marine phytoplankter. Limnol. Oceanogr. 32, 1365–1369. doi: 10.4319/lo.1987.32.6.1365
Petasne, R. G., and Zika, R. G. (1997). Hydrogen peroxide lifetimes in South Florida coastal and offshore waters. Mar. Chem. 56, 215–225. doi: 10.1016/S0304-4203(96)00072-2
Price, D., Mantoura, R. F. C., and Worsfold, P. J. (1998). Shipboard determination of hydrogen peroxide in the western Mediterranean sea using flow injection with chemiluminescence detection. Anal. Chim. Acta 377, 145–155. doi: 10.1016/S0003-2670(98)00621-7
Riebesell, U., Czerny, J., Von Bröckel, K., Boxhammer, T., Büdenbender, J., Deckelnick, M., et al. (2013). Technical note: a mobile sea-going mesocosm system - new opportunities for ocean change research. Biogeosciences 10, 1835–1847. doi: 10.5194/bg-10-1835-2013
Seaver, L. C., and Imlay, J. A. (2001). Hydrogen peroxide fluxes and compartmentalization inside growing Escherichia coli. J. Bacteriol. 183, 7182–7189. doi: 10.1128/JB.183.24.7182-7189.2001
Steigenberger, S., and Croot, P. L. (2008). Identifying the processes controlling the distribution of H2O2 in surface waters along a meridional transect in the eastern Atlantic. Geophys. Res. Lett. 35:L03616. doi: 10.1029/2007GL032555
Taucher, J. (2017). Influence of ocean acidification and deep water upwelling on oligotrophic plankton communities in the subtropical North Atlantic: insights from an in situ Mesocosm study. Front. Mar. Sci. 4:85. doi: 10.3389/fmars.2017.00085
Timko, S. A., Romera-Castillo, C., Jaffé, R., and Cooper, W. J. (2014). Photo-reactivity of natural dissolved organic matter from fresh to marine waters in the Florida Everglades, USA. Environ. Sci. Process. Impacts 16, 866–878. doi: 10.1039/C3EM00591G
Tolar, B., Powers, L., Miller, W., Wallsgrove, N., Popp, B., and Hollibaugh, J. (2016). Ammonia oxidation in the ocean can be inhibited by nanomolar concentrations of hydrogen peroxide. Front. Mar. Sci. 3:237. doi: 10.3389/fmars.2016.00237
Van Baalen, C., and Marler, J. E. (1966). Occurrence of hydrogen peroxide in sea water. Nature 211:951. doi: 10.1038/211951a0
Vermilyea, A. W., Hansard, S. P., and Voelker, B. M. (2010). Dark production of hydrogen peroxide in the Gulf of Alaska. Limnol. Oceanogr. 55, 580–588. doi: 10.4319/lo.2009.55.2.0580
Welschmeyer, N. A. (1994). Fluorometric analysis of chlorophyll a in the presence of chlorophyll b and pheopigments. Limnol. Oceanogr. 39, 1985–1992. doi: 10.4319/lo.1994.39.8.1985
Willey, J. D., Kieber, R. J., and Avery, G. B. (2004). Effects of rainwater iron and hydrogen peroxide on iron speciation and phytoplankton growth in seawater near Bermuda. J. Atmos. Chem. 47, 209–222. doi: 10.1023/B:JOCH.0000021087.19846.e1
Yocis, B. H., Kieber, D. J., and Mopper, K. (2000). Photochemical production of hydrogen peroxide in Antarctic Waters. Deep. Res. I 47, 1077–1099. doi: 10.1016/S0967-0637(99)00095-3
Yuan, J. C., and Shiller, A. M. (1999). Determination of subnanomolar levels of hydrogen peroxide in seawater by reagent-injection chemiluminescence detection. Anal. Chem. 71, 1975–1980. doi: 10.1021/ac981357c
Yuan, J., and Shiller, A. (2001). The distribution of hydrogen peroxide in the southern and central Atlantic ocean. Deep Sea Res. II Top. Stud. Oceanogr. 48, 2947–2970. doi: 10.1016/S0967-0645(01)00026-1
Yuan, J., and Shiller, A. M. (2004). Hydrogen peroxide in deep waters of the North Pacific Ocean. Geophys. Res. Lett. 31:L01310. doi: 10.1029/2003GL018439
Keywords: hydrogen peroxide, H2O2, mesocosm, Atlantic, pCO2
Citation: Hopwood MJ, Riebesell U, Arístegui J, Ludwig A, Achterberg EP and Hernández N (2018) Photochemical vs. Bacterial Control of H2O2 Concentration Across a pCO2 Gradient Mesocosm Experiment in the Subtropical North Atlantic. Front. Mar. Sci. 5:105. doi: 10.3389/fmars.2018.00105
Received: 25 July 2017; Accepted: 14 March 2018;
Published: 27 March 2018.
Edited by:
Jörg Wiedenmann, University of Southampton, United KingdomReviewed by:
Marta Plavsic, Rudjer Boskovic Institute, CroatiaBernhard Riegl, Nova Southeastern University, United States
Copyright © 2018 Hopwood, Riebesell, Arístegui, Ludwig, Achterberg and Hernández. This is an open-access article distributed under the terms of the Creative Commons Attribution License (CC BY). The use, distribution or reproduction in other forums is permitted, provided the original author(s) and the copyright owner are credited and that the original publication in this journal is cited, in accordance with accepted academic practice. No use, distribution or reproduction is permitted which does not comply with these terms.
*Correspondence: Mark J. Hopwood, bWhvcHdvb2RAZ2VvbWFyLmRl