 Marc J. Silberberger
 Paul E. Renaud
 Ingrid Kröncke
 Henning Reiss1
- 1Faculty of Biosciences and Aquaculture, Nord University, Bodø, Norway
- 2Akvaplan-niva, Fram Centre for Climate and the Environment, Tromsø, Norway
- 3Department of Arctic Biology, University Centre in Svalbard, Longyearbyen, Norway
- 4Department for Marine Research, Senckenberg am Meer, Wilhelmshaven, Germany
Studies of trophic interactions give valuable insights into the functioning of ecosystems and can be used to identify qualitative differences among ecosystems. Here, we use natural stable isotope concentrations (δ13C and δ15N) to study the food-web structure in four contrasting locations on the northern European continental shelf: two sub-Arctic locations in the Lofoten-Vesterålen region (fjord vs. open shelf) and two temperate locations (northern vs. southern North Sea). Phytoplankton was identified as the major primary producer in all studied ecosystems, even in the sub-Arctic fjord, where macroalgae only played a minor role in the food web. We used mixing models to determine the relative reliance on prey of benthic affinity and found that reliance on benthic prey was higher in the North Sea than in the Lofoten-Vesterålen region. Atlantic cod (Gadus morhua) was identified as the single top-predator in the North Sea, utilizing food from both benthic and pelagic trophic channels. More separate benthic and pelagic trophic channels characterize the Lofoten-Vesterålen region, where G. morhua acts as part of the pelagic food chain. Furthermore, our data indicate that the recent mesopredator outburst in the southern North Sea might have been enhanced by reduced predation pressure due to the collapse of the local cod stocks. We conclude that the resilience toward a high fishing pressure is higher in the Lofoten-Vesterålen region than in the North Sea.
Introduction
Food-web structure is a fundamental feature of marine ecosystems as it gives insight into how energy and contaminants are transferred from low trophic positions to upper trophic-level consumers (Hobson et al., 2002; Jardine et al., 2006; Schückel et al., 2015). It further provides insight in the relationships between biodiversity and ecosystem functioning (Worm et al., 2002; Duffy et al., 2005; Cochrane et al., 2016), and how trophic cascades may alter ecosystems (Frank et al., 2005). Knowledge of food web characteristics, such as key species, food chain length, or primary food sources, can be used to understand differences in ecosystem resilience in response to natural and anthropogenic disturbances (Kortsch et al., 2015), and is therefore essential to sustainably manage ecosystems and their harvestable resources in a changing environment.
Continental shelves sustain some of the most productive marine ecosystems in the world (Pauly and Christensen, 1995). They are estimated to contribute over 20% to the total oceanic primary production, while contributing less than 8% to the total surface of the oceans (Longhurst et al., 1995). They act as net carbon sink for atmospheric CO2 (Thomas et al., 2004) and support the majority of all fisheries (Watson and Pauly, 2001). The northern European continental shelf, one such productive region, contains contrasting ecosystems, ranging from the temperate regions of the southern North Sea to the Arctic regions of northern Norway. Despite these differences, the marine ecosystems of the northern European continental shelf are characterized by some key overarching features: (1) Pronounced seasonality in the ecosystems with a strong influence of the North Atlantic Current (Neumann and Kröncke, 2011; Silberberger et al., 2016), (2) Calanus as the key zooplankton taxon and an important link between primary production and higher trophic levels (Williams et al., 1994; Espinasse et al., 2016), and (3) large stocks of commercially important fish species are sustained by these ecosystems (Føyn et al., 2002; Ehrich et al., 2007). In recent years, however, ongoing climate change has impacted all compartments of the marine ecosystem, leading to regime shifts of phytoplankton and zooplankton communities (Beaugrand and Ibanez, 2004; Richardson and Schoeman, 2004; McQuatters-Gollop et al., 2007), distributional shifts of benthos (Kröncke et al., 2011; Birchenough et al., 2015), and deepening of fish assemblages (Dulvy et al., 2008). Cod has disappeared almost completely from the southern North Sea due to overfishing and climate change (Daan et al., 2005; Beaugrand and Kirby, 2010), and the region has changed into flatfish dominated communities, including abundant commercial species (e.g., Pleuronectes platessa) and particularly high abundances of small, non-commercial, mesopredatory species (e.g., Buglossidium luteum) (Ehrich et al., 2007; van Hal et al., 2010; Schückel et al., 2012). Furthermore, mackerel is extending its range northwards into the sub-Arctic (Stenevik and Sundby, 2007; Utne et al., 2012). In connection to the ongoing climate change, further changes are predicted, like the continuing shifts in benthic species distributions (Renaud et al., 2015b; Weinert et al., 2016). It remains unclear, however, whether the observed fisheries and climate induced changes in the ecosystem has resulted in altered food-web structures and, furthermore, whether the food webs of contrasting ecosystems across climate regions are expected to respond in a similar way to future environmental changes. Thus, comparing food web structures and their key trophic groups across climate zones might reveal potential consequences of natural and anthropogenic pressures on these ecosystems.
Ratios of naturally occurring carbon (13C/12C) and nitrogen (15N/14N) isotopes, expressed as δ13C and δ15N, have become one of the most common tools to study the trophic structure of marine ecosystems (Post, 2002b; Vander Zanden and Fetzer, 2007; Renaud et al., 2011; Kürten et al., 2013). The method makes use of the principle that the stable isotope composition of an animal depends on the isotopic composition of its food, with some characteristic enrichment of the heavier isotope during each trophic transfer (typically 3–4‰ for δ15N and 1‰ for δ13C) (DeNiro and Epstein, 1978, 1981; Minagawa and Wada, 1984; Post, 2002b). In stable isotope analysis, the large trophic enrichment of 15N makes it a reliable indicator of the trophic position of an organism. The rather small trophic enrichment of 13C makes it a suitable tracer to identify carbon sources (Fry and Sherr, 1984; Hobson et al., 1995). Benthic invertebrates are generally enriched in 13C compared to pelagic species and may therefore be used to identify if carbon has been cycled through the benthos prior to consumption (Hobson et al., 2002; Nadon and Himmelman, 2006).
In this study, we utilize stable-isotope analysis to investigate the food-web structure of four contrasting ecosystems on the northern European continental shelf. The main objectives were (i) to compare sub-Arctic and temperate food webs of shelf seas and identify trophic differences among the study systems and (ii) evaluate whether the food-web structure in the different systems could favor community shifts similar to shifts already observed in another location.
Materials and Methods
Study Locations
Our study compares the food-web structure of four contrasting ecosystems on the northern European continental shelf (Figure 1). Two locations in the sub-Arctic Lofoten-Vesterålen region represent one open shelf location (Hola; 68°57.0′N, 14°10.8′E; depth: 195–220 m) and one fjord (Malnesfjord; 68°48.2′N, 14°36.5′E; maximum depth: 160 m). The other two locations are part of the German Small-scale Bottom Trawl Survey (GSBTS) as “Box L” and “Box A” (Ehrich et al., 2007), and are situated in the temperate northern North Sea (58°45.0′N, 02°33.3′E; depth: 105–119 m) and in the warm-temperate German Bight (54°22.2′N, 07°06.0′E; depth: 36–45 m). Besides representing different climatic regimes, the study locations also represent different exploitation regimes with fisheries targeting different components of the food web. Fisheries in these ecosystems range from beam trawling targeting flatfish (German Bight), over line- and trawl fisheries on gadoid fish (northern North Sea and Hola), to aquaculture and small-scale recreational fisheries (Malnesfjord) (Ehrich et al., 2007; ICES, 2013).
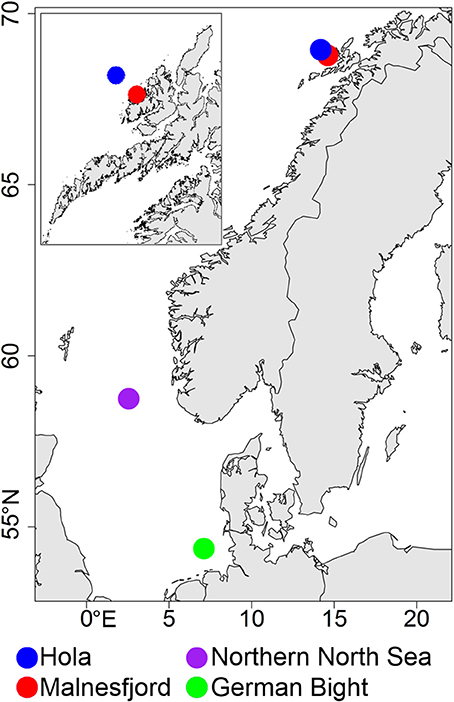
Figure 1. Map of north-west Europe with sampling locations indicated. Top left: Detail of the Lofoten-Vesterålen region.
Sampling
Samples from the Lofoten-Vesterålen region were collected with M/S Skårungen (Skå) in Malnesfjord on April 28–29, 2014, and in Hola with R/V Helmer Hanssen (HH) on April 19–26, 2015. Samples from the locations in the North Sea were collected with R/V Walther Herwig III (WHIII) as part of the GSBTS between July 28 and August 23, 2014.
Pelagic particulate organic matter (POM) was collected from the chlorophyll maximum using a rosette water sampler (WHIII, HH) or a single Niskin bottle (Skå) and filtered on pre-combusted GF/F filters (pore size: 0.7 μm, 2,000–3,000 mL filtered per sample). Filters were visually inspected under a dissecting microscope and mesozooplankton was removed. Particulate organic matter from the sediment (sediment) was collected from the upper 2 cm of van Veen grab samples. Sediment was visually inspected under a dissecting microscope and macro-invertebrates were removed. Macroalgae were collected using a beam trawl (opening 2 m, mesh size 4 mm) in Malnesfjord. Macroalgal detritus was collected from bottom trawls in the North Sea. Macroalgae and macroalgal detritus were cleaned with tweezers of epiphytes and other attached material. Some of the removed epiphytic algae (e.g., Ptilota gunneri) were collected separately. A WP2 net (ø 0.57 m, mesh size 180 μm; Skå, HH) or a hand-towed plankton net (mesh size 100 μm; WHIII) were used to collect mesozooplankton samples. Calanus spp. was handpicked (adults and copepodite 5) from these samples under a dissecting microscope. Beam trawls (opening 2 m, mesh size 4 mm) and van Veen grabs (sample area 0.1 m2) were used to collect epi- and infauna, respectively. Fish were collected by bottom trawling. No bottom trawling was possible in Malnesfjord and fish were collected from beam trawls. Small invertebrates were collected and kept alive for 18–24 h to allow for gut evacuation prior to freezing. All other samples were frozen immediately at −20°C until further processing.
To avoid unnecessary destructive sampling, all fish and benthos from the North Sea were collected from samples taken as part of the German Small-scale Bottom Trawl Survey, an annual survey conducted by the German Federal Research Institute for Rural Areas, Forestry and Fisheries. All research was in accordance with German national guidelines regulating use of animals in research. In the Lofoten-Vesterålen region, destructive sampling was kept to the absolute minimum. Marine protected areas and regions with habitat forming fauna (e.g., Lophelia pertusa reefs) were avoided in this study. All research conducted in Norway was in accordance with institutional and national guidelines regulating use of animals in research. The lead author has taken relevant courses in research ethics at Nord University that cover these issues. An additional approval by an ethics committee was not required.
Stable Isotope Analysis
Sample preparation for stable isotope analysis followed the recommendations of Jardine et al. (2003). For fish and larger crustaceans, muscle tissue was used for sample preparation. For asteroids and ophiuroids we used one or several arms, for echinoids we used gonads and internal viscera, and for molluscs we used only soft tissue. Small fragments were used for bryozoans, cnidarians and macroalgae. For small invertebrates, the entire animal was processed. One or several individuals were used for each isotope sample and replicate samples were prepared for all taxa where enough individuals were collected (compare Table 1). All samples were dried at 60°C for 24–72 h. Sediment, macroalgae, and animal samples were ground to a fine powder with mortar and pestle. Calanus spp. was not ground due to their small size. Carbonates were removed from samples through treatment with hydrochloric acid, since non-dietary carbonates may affect δ13C concentrations (DeNiro and Epstein, 1978). However, acidification adversely affects δ15N concentration (Bunn et al., 1995). Therefore, samples expected to contain carbonates were split in half (see Table 1) and analyzed separately for δ13C (acidified) and δ15N (non-acidified) concentrations. Samples were weighed in tin capsules and analyzed for δ13C and δ15N by a Carlo Erba NC2500 elemental analyzer interfaced to a Thermo Finnigan Delta Plus/Conflo II mass spectrometer or a Costech 4010 elemental analyzer interfaced to a Thermo Finnigan Delta XP/Conflo III mass spectrometer in the Stable Isotopes in Nature Laboratory, Department of Biology, University of New Brunswick, Canada. Stable isotope measurements are reported in delta (δ) notation in parts per thousand (‰) relative to the international standard: Vienna Pee Dee Belemnite for carbon (analytical accuracy: ±0.09‰), and atmospheric air for nitrogen (analytical accuracy: ±0.25‰). Isotope values were normalized using secondary standards: Nicotinamide (−34.54 ± 0.06‰ for δ13C; 0.03 ± 0.09‰ for δ15N), bovine liver standard (−18.76 ± 0.10‰ for δ13C; 7.10± 0.16‰ for δ15N), and muskellunge muscle standard (−22.29 ± 0.11‰ for δ13C; 14.00 ± 0.11‰ for δ15N) for animal tissues; and corn meal standard (−13.24 ± 0.12‰ for δ13C; 4.45 ± 0.10‰ for δ15N), aquatic moss standard (−35.08 ± 0.21‰ for δ13C; 15.95 ± 0.32‰ for δ15N), spirulina standard (−24.92 ± 0.10‰ for δ13C; 12.95 ± 0.18‰ for δ15N) and ephedra plant standard (−31.02 ± 0.13‰ for δ13C; 0.33 ± 0.13‰ for δ15N) for sediments and plant material.
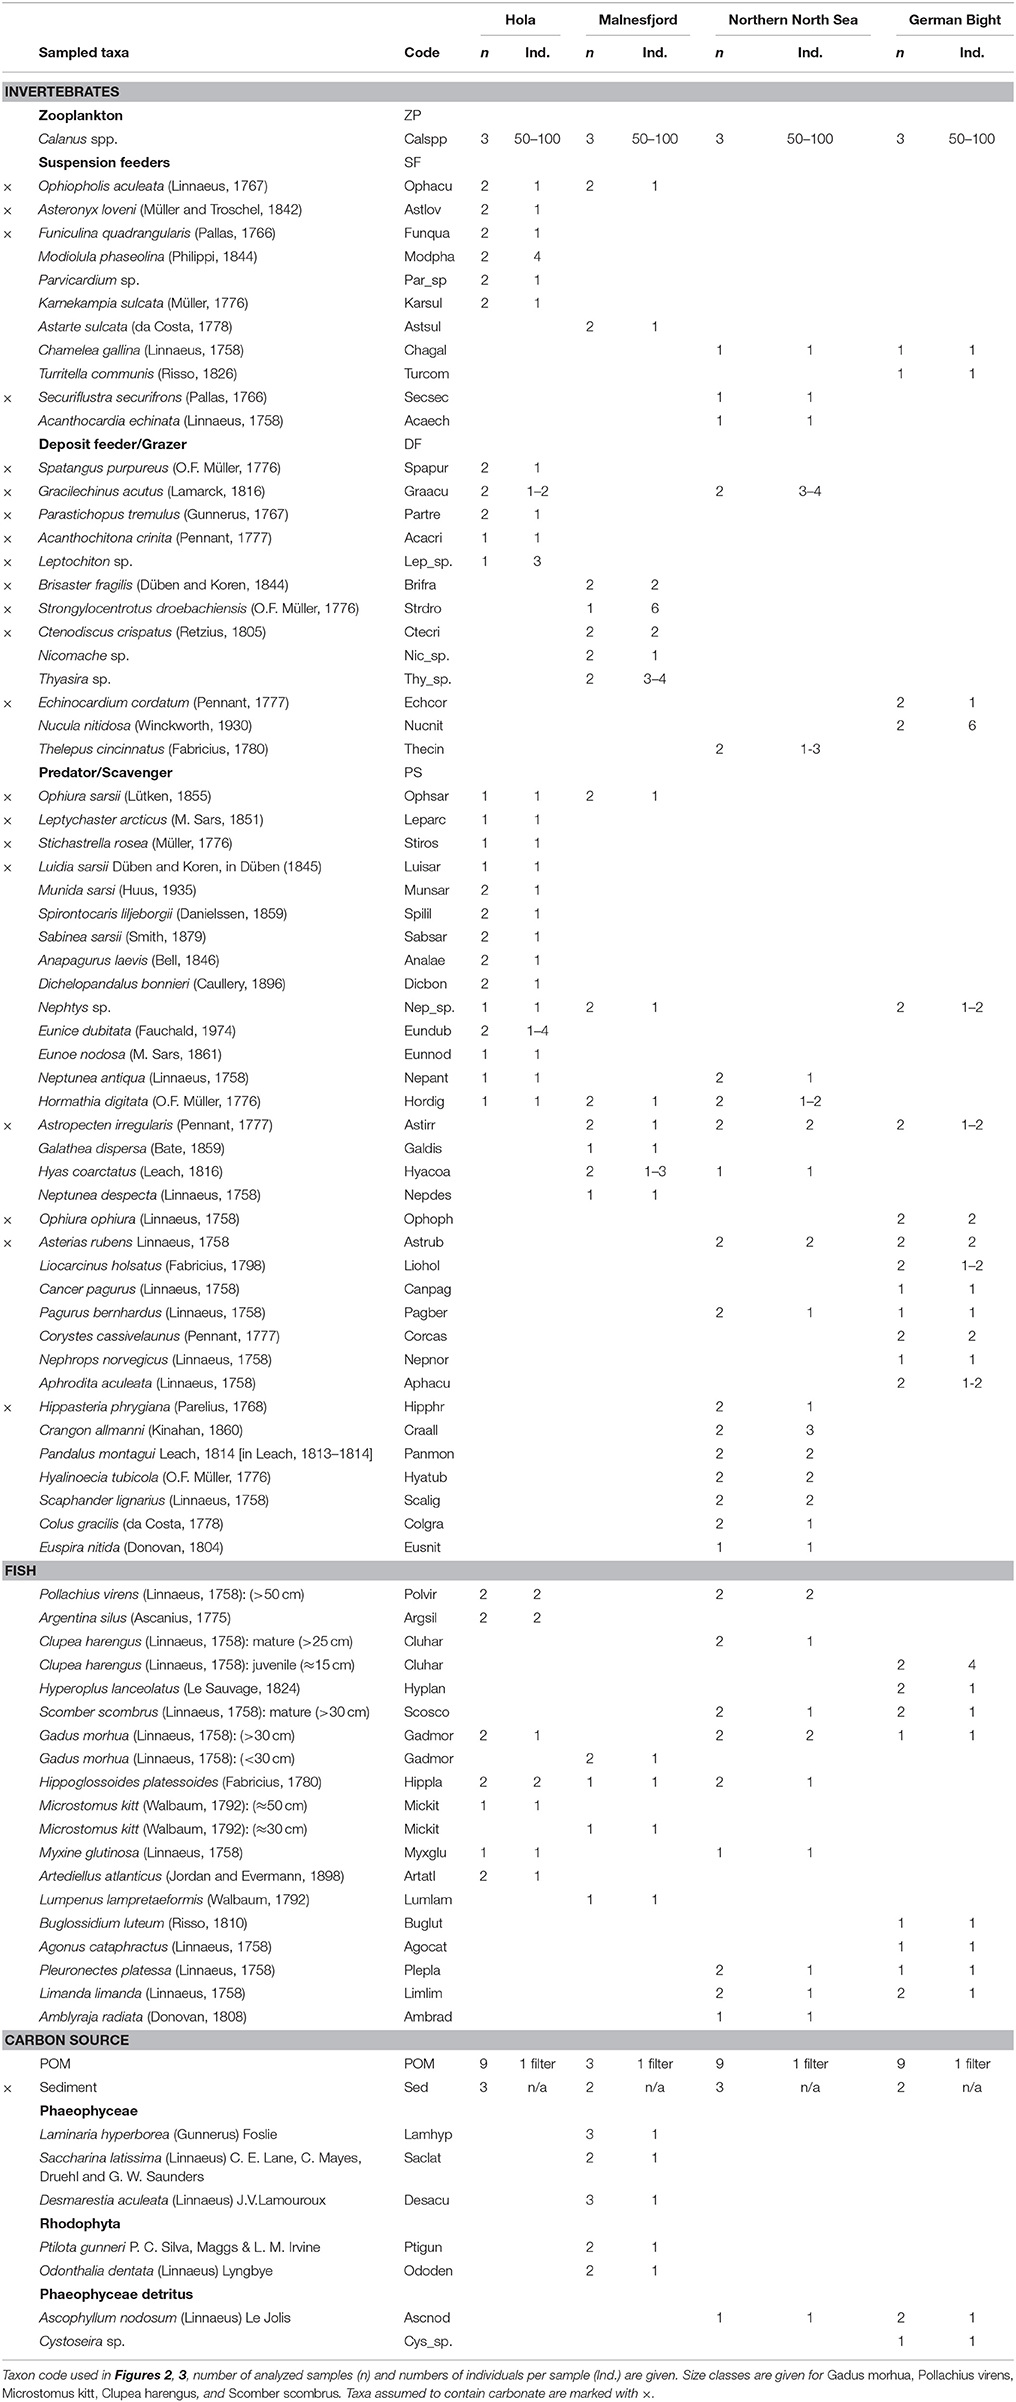
Table 1. Sampled taxa and sample preparation information.
The Stable Isotopes in Nature Laboratory performed a random replicate of the stable isotope analysis for 7% of the submitted samples. These replicates were used to control the quality (homogeneity) of the prepared samples. Isotopic values of these replicates were averaged prior to the analysis.
Data Analysis
High lipid content can affect δ13C values and, therefore, lipid normalization was performed for samples with C:N > 4 (McConnaughey and McRoy, 1979; Jardine et al., 2003):
We used δ15N-values to estimate the individual trophic position of each species. A robust δ15N baseline is indispensable for a reliable estimation of individual trophic position (TP). Due to various practical reasons, the establishment of a primary producer based δ15N baseline may be very difficult and primary consumers have become the common choice (Post, 2002b). We used a two-source mixing model to calculate TP based on a benthic and pelagic primary consumer baseline at each study location (Post, 2002b):
Where λ is the estimated TP of the established baseline (here λ = 2). As the benthic baseline, we defined the benthic invertebrate with the lowest mean δ15N-value (compare Figure 2) at each sampling location (Hola: Modiolula phaseolina; Malnesfjord: Strongylocentrotus droebachiensis; northern North Sea: Acanthocardia echinata; German Bight: Echinocardium cordatum). Calanus spp. was used as pelagic baseline for all stations. For the calculation of individual trophic position we assumed equal reliance on the benthic and pelagic baseline (α = 0.5). This provides a realistic estimate for the majority of taxa which we expect to rely on a mixture of benthic and pelagic prey (McMeans et al., 2013, 2015; Renaud et al., 2015a). However, this might misplace taxa relying completely on one of the sources for locations with large differences between benthic and pelagic baseline. We used the widely applied trophic fractionation (Δ15N) of 3.4‰ (Post, 2002b).
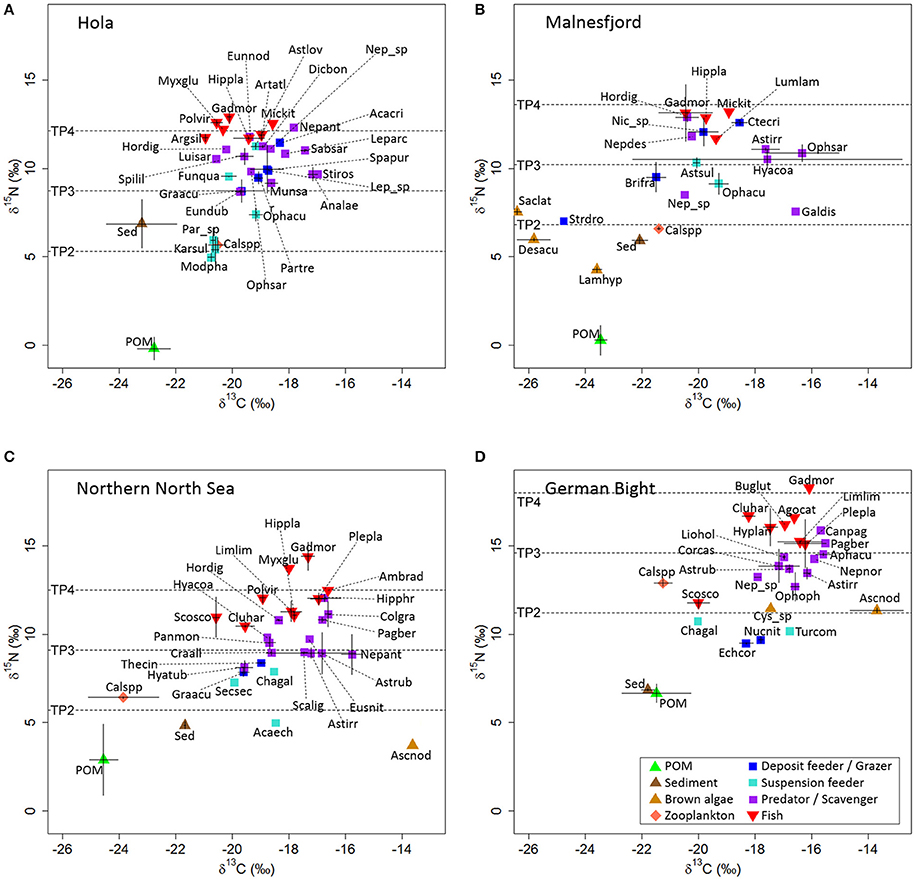
Figure 2. Mean δ13C ± 1 SD and mean δ15N ± 1 SD at all study locations: Hola (A), Malnesfjord (B), northern North Sea (C), and the German Bight (D). Labeling according to taxon code shown in Table 1. Red algae (Ptilota gunneri [δ13C: −35.7 ± 0.0, δ15N: 6.3 ± 0.0]; Odonthalia dentata [δ13C: −32.7 ± 0.5, δ15N: 5.4 ± 0.5]) and identified outliers (Thyasira sp. [δ13C: −35.2 ± 0.6, δ15N: −5.3 ± 0.5]; Nephtys sp. [δ13C: −29.4, δ15N: 2.1]) are not shown for Malnesfjord.
We estimated the reliance on benthic affinity prey (RBAP) for all faunal taxa. We corrected for trophic fractionation of δ′13C, by applying a trophic fractionation (Δ13C) of 1‰ per trophic step (= 3.4‰ δ15N) (DeNiro and Epstein, 1978; Post, 2002b). The correction is necessary for each taxon individually to standardize all taxa on the same trophic level, and thereby account for differences in trophic positions between the consumers and the used δ13C-baselines. The corrected values (δ″13C) were then used to estimate RBAP in a two-source mixing model (Vander Zanden and Vadeboncoeur, 2002):
Calanus spp. was used as pelagic baseline for all study locations. The most δ″13C-enriched taxon was defined as benthic baseline, assuming 100% RBAP for this taxon (Hola: Stichastrella rosea; Malnesfjord: Galathea dispersa; northern North Sea: Neptunea antiqua; German Bight: Turritella communis). We did not calculate RBAP for S. droebachiensis in Malsnesfjord, since the isotopic signature suggested reliance on macroalgae. Also, this species is known to graze on macroalgae, in particular kelp (Hagen, 1983). Our analysis showed that primary consumers (incl. Calanus spp.) in Lofoten-Vesterålen had already picked up the isotopic signature of the ongoing spring bloom, while this signal was not yet reflected in higher trophic positions (see section Results). Therefore, we used available pre-bloom Calanus spp. isotopic data from 16 January 2015 from Hola to calculate RBAP a second time, based on a winter planktonic baseline. This time lag of integration of the spring bloom isotopic signal into higher trophic levels is related to the known difference in turnover times and has to be expected during the onset of the spring bloom (Kürten et al., 2013).
All faunal taxa were assigned to one of five functional groups: Fish (F), zooplankton (Z), suspension feeding benthos (SF), deposit feeding benthos and grazer (DF) and predator and scavenging benthos (PS) (Table 1). This assignment was done with the World Register of Marine Species (Worms Editorial Board, 2016), supplemented with information from Hayward and Ryland (1995) and MarLIN (Marine Life Information Network) (2016).
We assumed a trophic fractionation of 4‰ for δ13C for the trophic transfer from primary producers to primary consumers and of 1‰ per trophic step thereafter (Hobson et al., 1995; Renaud et al., 2015a). Analysis of variance (ANOVA) was used to identify differences in δ13C and δ15N signature between carbon sources (POM, sediment, Phaeophyceae, Rhodophyta, Phaeophyceae detritus) at all locations. Welch's ANOVA was performed for δ13C in Malnesfjord, since the ANOVA assumption of homogeneity of variances was violated. Post-hoc tests (Tukey's HSD, Games-Howell for δ13C in Malnesfjord) were performed for locations with more than two carbon sources (Malnesfjord, German Bight). The single sample of Phaophyceae detritus from the northern North Sea had to be excluded from statistical tests. ANOVA was used to test for significant differences in isotopic signature between previously identified groups of fish. Significance level were set to α = 0.05 for all tests. P-values are only reported for significant results.
Three samples from Malnesfjorden were identified as outliers (2 × Thyasira spp., 1 × Nephtys sp.) and therefore excluded from all analyses but qualitative comparisons.
Results
Hola
Stable carbon and nitrogen isotope ratios of 33 faunal species (7 fish, 25 benthic species, 1 zooplankton species) and 2 potential carbon sources (POM, Sediment) were analyzed from Hola (Figure 2A, Data Sheet 1). Sediment was significantly enriched in δ15N compared to POM (p < 0.001 [ANOVA]), while no difference in δ13C was observed between the two carbon sources. The δ15N baseline (TP = 2) was established at 5.3‰ (Benthic baseline: δ15NM. phaseolina = 5.0‰; pelagic baseline: δ15NCalanus spp. = 5.7‰). Calanus spp. and three suspension-feeding bivalves (M. phaseolina, Karnekampia sulcata, Parvicardium sp.) formed a cluster around TP 2 (Figure 2A). The isotopic values of these taxa were almost identical, suggesting they all fed directly on POM from the ongoing spring bloom, although the observed trophic fractionation (Δ15N ≈ 5; Δ13C ≈ 2.5) did not exactly match the assumed trophic fractionation for the trophic transfer from primary producers to primary consumers. The remaining benthic invertebrate taxa occupied TP between 2.6 and 4.1, with no clear separation of the different feeding types. Atlantic cod (Gadus morhua) was the most δ15N-enriched species, with a calculated TP of 4.2. However, this did not differ strongly from the TP of the other fish species (range: 3.9–4.1).
Calculated RBAP was generally low, with a trend of decreasing RBAP with increasing TP. Some taxa with TP > 3.5 had an extremely negative RBAP, making it obvious that the δ13C signal from the spring bloom was not yet transferred to these high trophic levels at the time of sampling (Figure 3A). Therefore, we used available pre-bloom isotopic values of Calanus spp. (δ13C: −22.0‰; δ15N: 8.8‰), sampled a few km away but within Hola, to calculate more realistic RBAP values for higher trophic positions (see methods). The fish were separated in two groups according to δ13C (p < 0.001 [ANOVA]): one group (G. morhua, Pollachius virens, Myxine glutinosa, Argentina silus) almost exclusively relying on pelagic prey, and the other group (Microstomus kitt, Artediellus atlanticus, Hippoglossoides platessoides) with 40–50% reliance on benthic prey.
Figure 3. Reliance on benthic affinity prey and trophic position for all faunal taxa at the study locations Hola (A), Malnesfjord (B), northern North Sea (C), and the German Bight (D). Labeling according to taxon code shown in Table 1. A second x-axis (Top) for Hola shows the calculated reliance on benthic affinity prey using a winter pelagic baseline.
Malnesfjord
Isotopes of 19 faunal species (4 fish, 14 benthic species, 1 zooplankton species) and 7 potential carbon sources (3 Phaeophyceae, 2 Rhodophyta, POM, sediment) were analyzed from Malnesfjord (Figure 2B, Data Sheet 1). Thyasira sp. and one of the Nephtys sp. samples in Malnesfjord were extremely depleted in δ13C and δ15N and therefore identified as outliers. POM in Malnesfjord was significantly depleted in δ15N in comparison to Rhodophyta, Phaeophyceae, and sediment (p < 0.001 [Tukey's HSD] for all), which did not differ significantly from each other. In terms of δ13C, however, Rhodophyta were substantially and significantly depleted compared to Phaeophyceae (p = 0.001 [Games-Howell]), POM (p = 0.003 [Games-Howell]), and sediment (p = 0.002 [Games-Howell]). Phaeophyceae were also depleted in δ13C compared to POM (p = 0.038 [Games-Howell]) and sediment (p = 0.002 [Games-Howell]), which did not differ significantly from each other. The δ15N-baseline (TP = 2) was established at 6.8‰ (Benthic baseline: δ15NS. droebachiensis = 7.0‰; pelagic baseline: δ15NCalanus spp. = 6.6‰). Because of their extreme depletion in δ13C, the collected Rhodophyta were clearly not important as carbon source for any of the collected fauna. Phaeophyceae, however, were identified as a possible carbon source for S. droebachiensis; although the assumed Δ13C and Δ15N were not met. Of all other benthic taxa, only Brisaster fragilis was identified as a candidate to rely on Phaeophyceae as carbon source. Surprisingly, all other taxa showed strong similarities in isotopic signature with the pattern described for Hola, although the variability in δ13C was larger (overall and individual taxa). Furthermore, the collected taxa did not include any suspension feeders with similar isotopic signature to Calanus spp.
The fish collected in Malnesfjord did not include any typical pelagic species and all individuals were small compared to the same species collected in Hola. This was probably related to the collection method and not the absence of these fish from Malnesfjord. All the fish occupied a TP < 4, similar to a group of the most δ15N-enriched benthic taxa (Hormathia digitata, Neptunea despecta, Nicomache spp., Ctenodiscus crispatus) with TP 3.5–3.8. However, the two individual cod samples in Malnesfjord differed strongly from each other (TP 4.2 vs. TP 3.5).
Similar to Hola, calculated RBAP was low for TP > 3.5, but values were not as negative as in Hola. Only four benthic taxa (G. dispersa, Hyas coarctatus, Astropecten irregularis, Ophiura sarsii) showed a high reliance on benthic affinity prey (RBAP > 40%). These results indicate a similar situation as in Hola. However, no pre-bloom isotopic data for Calanus spp. were available, and therefore no second RBAP calculation was conducted.
Northern North Sea
Isotopes of 28 faunal species (9 fish, 18 benthic species, 1 zooplankton species) and 3 potential carbon sources (1 Phaeophyceae (detritus), POM, sediment) were analyzed from the northern North Sea (Figure 2C, Data Sheet 1). The single sample of Phaeophyceae detritus (Ascophylum nodosum) was particularly enriched in δ13C compared to all other samples collected at this location, indicating that it has little or no importance as food item for any collected fauna. POM was significantly depleted in δ13C (p < 0.001 [ANOVA]) compared to sediment, but not in δ15N concentration. The δ15N baseline (TP = 2) was established at 5.7‰ (Benthic baseline: δ15NA. echinata = 5.0‰; pelagic baseline: δ15NCalanus spp. = 6.4‰). The δ15N-enrichment of Calanus spp. in comparison to POM was in accordance with the expected Δ15N, while differences in δ13C were virtually absent. Besides the suspension feeding bivalve A. echinata (TP 1.8), all other potential benthic primary consumers (DF and SF) were assigned a TP 2.4–2.8 and thereby at a generally lower TP than the bulk of benthic secondary consumers (PS: TP 2.7–3.9). All benthic taxa were considerably δ13C-enriched compared to Calanus spp.
Fishes generally occupied higher TP than benthos (TP 3.4–4.6) with G. morhua occupying the position as top predator in this system. Only Myxine glutinosa reached a similar TP (4.4), while all other species were assigned to a TP < 4. According to δ13C, these fish were divided into two significant groups (p < 0.001 [ANOVA]): (1) predominantly pelagic feeding (RBAP 26–45%; Scomber scombrus, Clupea harengus, Pollachius virens) and (2) predominantly benthic feeding (RBAP 61–72%; Limanda limanda, Hippoglossoides platessoides, P. platessa, Amblyraja radiata). G. morhua and M. glutinosa had an intermediate RBAP of 57 and 50% respectively. Furthermore, RBAP indicated an overall high reliance of benthos on benthic prey (49–100%).
German Bight
Isotopes of 23 faunal species (8 fish, 14 benthic species, 1 zooplankton species) and 7 potential carbon sources (2 Phaeophyceae (detritus), POM, sediment) were analyzed from the German Bight (Figure 2D, Data Sheet 1). Isotopic signature of POM and sediment in the German Bight were virtually identical, representing potential food sources for all potential benthic primary consumers (E. chordatum, Nucula nitida, Turitella communis, Chamelea gallina). In comparison to POM and sediment, macroalgal detritus was enriched in δ13C (p ≤ 0.001 [Tukey's HSD] for both) and δ15N (p < 0.001 [Tukey's HSD] for both). Especially A. nodosum detritus had a δ13C value that clearly indicated no considerable role as food for any of the collected fauna. The other collected detritus in the German Bight (Cystoseira sp.) cannot be ruled out as potential food source based on its δ13C. However, its δ15N value was considerably higher than all the collected potential primary consumers. The δ15N baseline (TP = 2) was established at 11.2‰ (Benthic baseline: δ15NE. cordatum = 9.5‰; pelagic baseline: δ15NCalanus spp. = 12.9‰). Calanus spp. was particularly δ15N enriched, placing it one TP above the benthic deposit feeder and even slightly higher than mackerel (S. scombrus), which was particularly depleted in δ15N. The isotopic signature of Calanus spp. indicated no reliance on the collected POM. All assumed benthic secondary consumers (PS) occupied a much higher TP (2.4–3.4) than the potential primary consumers (TP 1.5–1.9). Among the fishes, G. morhua occupied the highest TP (4.1), which is considerably higher than for all the other fish species (TP 2.2–3.6).
The RBAP in the German Bight was high overall. All benthic species with the exception of C. gallina (RBAP: 35%) had a calculated RBAP of over 60%. For fish, the planktonic feeding C. harengus and S. scombrus had a low RBAP (< 35%). Conversely, the medium sized flat fish L. limanda and P. platessa were almost exclusively feeding on benthic prey (RBAP 78–83%). The two collected mesopredatory species [B. luteum (RBAP 63%), Agonus cataphractus (RBAP 67%)] showed a similar reliance on benthic prey as G. morhua (RBAP 68%).
Discussion
Carbon Sources and the δ15N-Baselines
The isotopic signature of Calanus spp. suggests that the pelagic food web in Hola, Malnesfjord, and the northern North Sea were directly linked to POM. In the German Bight, however, Calanus spp. was 15N-enriched and relied on a carbon source not represented in our data. We propose three possible explanations for this: (i) Calanus spp. might not have acted as primary consumer in the German Bight, and feeding in late summer was primarily on microzooplankton (Corner et al., 1976), or (ii) Calanus spp. could have selectively fed on 15N-enriched components in the collected POM samples. Isotopic signatures of POM and sediment in the German Bight were virtually identical, indicating that resuspended organic material may have dominated these POM samples. Large parts of such resuspended material are probably unsuitable as food for Calanus (DeMott, 1988), and could explain the differences in isotopic signatures of Calanus spp. and POM. (iii) It is possible that different Calanus species are able to utilize different food sources. Recent molecular work on the genus Calanus, however, has proven that the different Calanus species on the northern European continental shelf are morphologically indistinguishable and accordingly we do not know which species were collected at the different study locations (Choquet, 2017). We expect that three Calanus species could have been included in this study: C. helgolandicus, C. finmarchicus, and C. glacialis.
In contrast to the pelagic δ15N-baselines, the benthic δ15N-baselines showed strong differences between the Lofoten-Vesterålen region and the North Sea. Isotopic signatures suggest a high importance of fresh primary production in Lofoten-Vesterålen, while the sediment had a high importance in the North Sea, although POM and sediment were indistinguishable in the German Bight. This difference could well be an artifact of the different sampling seasons and not a functional difference between the ecosystems. The majority of benthic primary consumers are considered temporal couplers (McMeans et al., 2015), utilizing primary production, but changing to a detritus based diet when no fresh primary production is available. At all study locations, we identified species that are likely feeding on sediment or pelagic POM. We did this, although the assumed trophic fractionation was hardly ever exactly met for 15N and 13C at the same time. The stable isotope ratios of POM vary considerably in time and space, since it represents a mixture of autotrophic and heterotrophic microorganisms and detritus. Accordingly, the observed trophic fractionation for this first trophic transfer varies dramatically (Iken et al., 2010).
We included various macroalgae as potential carbon sources in Malnesfjord, due to the close proximity between this location and the coast. Only the echinoids S. droebachiensis and B. fragilis were identified to utilize carbon from Phaeophyceae, while red algae do not seem to play a role as food for any collected taxa. S. droebachiensis is known to graze on macroalgae. The lack of other taxa relying on canopy-forming macroalgae or epiphytic macroalgae was surprising, since it seems in contrast to other studies from Norwegian fjords and coast (Fredriksen, 2003; Nilsen et al., 2008; Renaud et al., 2015a). It is well known that epiphytic macroalgae are an important food source for mesograzers within the algal community (Fredriksen, 2003; Du et al., 2016; Nordström et al., 2016). The total absence of macroalgal grazers in our study, however, was at least partly related to the sampling methods (grabs and trawls). We did not collect many of the typical epiphyte grazers (gastropods, amphipods, isopods), so it is doubtful their contribution would have been recognized in the data. For other fjord communities, not directly associated with the algal community, detritus originating from canopy-forming brown algae has been identified as an important food source (Renaud et al., 2015a). Studies that have identified macroalgal derived detritus as an important carbon source were able to do so since macroalgae had a distinct (enriched) δ13C signal compared to POM. Among the macroalgae in Malnesfjord, none was more δ13C-enriched than POM. Benthic organisms from all locations in our study, however, were enriched in δ13C compared to zooplankton. Nadon and Himmelman (2006) pointed out that other carbon sources (terrestrial carbon or microphythobenthos) or 13C enrichment through microbial processes in water column and sediment can result in the heavy carbon signal seen in the benthos throughout our study. We cannot rule out that other more 13C-enriched macroalgae were used as a carbon source by benthos in Malnesfjord, but the general 13C enrichment of the benthos at all study locations indicates that some processes described by Nadon and Himmelman (2006) are more likely explanations for the observed pattern.
The established δ15N-baseline in the German Bight (11.2‰) was very high in comparison to all other locations (5.3–6.8‰). Accordingly, the δ15N values in the complete German Bight were high, which is known from other human impacted coastal regions (Sherwood and Rose, 2005) and reflects the known high δ15N values in surface sediments in the German Bight. This has been attributed to the large riverine input of reactive nitrogen in the German Bight (Pätsch et al., 2010).
Food-chain length and TP estimates are strongly dependent on the choice of δ15N-baseline in stable isotope studies (Post, 2002b). We used a two-source δ15N-baseline estimate, since this approach leads to more realistic TP for most taxa, which we expected to rely on a mixture of benthic and pelagic prey (McMeans et al., 2013, 2015; Renaud et al., 2015a). The difference between the benthic and pelagic δ15N-baseline was small for Hola, Malnesfjord, and the northern North Sea. Therefore, we are confident that the calculated TPs are realistic estimates of the TP regardless of exact proportions supplied by each potential carbon source. The δ15N-baseline in the German Bight, however, was based on very different benthic and pelagic baselines (difference: 1 TP). Therefore, the individual TPs need to be interpreted with care, taking into account the calculated RBAP of the different taxa. Due to the difference of 1 TP between the two baselines, an increase of RBAP by 10% equals an increase of the TP by 0.1, compared to the calculated TP, which was based on RBAP of 50%. A large number of taxa in the German Bight relied predominantly on benthic affinity prey (RBAP > 70%). For these taxa, the presented TP should be considered underestimates of approximately 0.2–0.3 TP.
In addition to the choice of δ15N-baseline, assumptions have to be made about the trophic fractionation to estimate trophic position in a food web. The trophic fractionation factor of 3.4‰, used in this study, is widely used, due to its generally good performance (Post, 2002b; Vander Zanden and Fetzer, 2007). This being said, it needs to be noted that a scaled fractionation factor approach describes the actual trophic position more accurately, since the trophic fractionation declines with increasing trophic position (Hussey et al., 2014). However, applying such an approach would require the assumption of 100% reliance on a single carbon source, which we did not assume, hence the two source δ15N-baseline. The benefit of a scaled approach would be a more accurate individual TP estimate, which was not the primary focus of this study, but it would not affect the relative trophic position within the food web and the observed food-web structures. Furthermore, due to the common application of 3.4‰, a scaled approach would hinder a direct comparison with the majority of the existing literature (Vander Zanden and Fetzer, 2007).
Benthic Invertebrates
Our study has shown that the a priori assigned feeding groups for the benthos were well supported by the isotopic data from both North Sea locations. Potential primary consumers were assigned to the lowest TPs, while secondary consumers occupied clearly higher TPs (Figure 2). Kürten et al. (2013) came to a similar conclusion for their studies in the North Sea. In the Lofoten-Vesterålen region, however, the potential primary consumers occupied a wide range of TPs. This was observed for suspension feeders (Hola: 1.89–3.74; Malnesfjord: 2.68–3.03) and deposit feeders and grazers (Hola: 3.00–3.81; Malnesfjord: 2.06–3.70) (Figure 2). This observation is probably related to a combination of various factors including: (i) Feeding relationships are better studied for temperate species, and (ii) feeding relationships are more variable at high latitudes and at greater depth, since food pulses are more variable. For example, the assumed suspension feeding ophiuroid Asteronyx loveni is known to switch from microphagous to macrophagous filter feeding and has also been suggested to feed on the sea pen Funiculina quadrangularis (von Salvini-Plawen, 1972), to which it is normally attached. Such a feeding relation would be in accordance with the particularly high TP of A. loveni and the relative isotopic signatures of both species in our study. A third factor leading to these feeding differences may be due to our sampling in Lofoten-Vesterålen during the spring bloom. This fresh organic matter may not be reflected in all taxa equally, since turnover times of tissue vary among taxa (Jardine et al., 2006). The isotopic signal from the spring bloom was reflected in taxa at low TPs in Lofoten-Vestrålen, but not at intermediate and high TPs. This can be expected, since the typical seasonal variation at the base of the food web (Kürten et al., 2013) is dampened by the longer turnover times and the integration of various food sources at higher TP (Jardine et al., 2006; McMeans et al., 2015). Nonetheless, structural differences at high TP in the benthic compartment of the food webs were observed between Lofoten-Vesterålen and the North Sea: (i) RBAP was lower in Lofoten-Vesterålen than in the North Sea. (ii) Many benthic taxa occupied high TPs, similar to fish, in Lofoten-Vesterålen, while TPs of benthos were clearly lower than fish in the North Sea. This indicates that top-down control by fish might play an important role for benthic communities in the North Sea, while bottom-up processes might be dominating the ecosystem in Lofoten-Vesterålen.
Within our samples from Malnesfjord, we identified three samples (2 × Thyasira sp., 1 × Nephtys sp.) as outliers since they were extremely depleted in both, δ13C and δ15N. Thyasira sp. have previously been identified as particularly δ13C- and δ15N-depleted (Rigolet et al., 2014), due to symbiotic chemo-autotrophic bacteria in their gill tissue (Dando and Spiro, 1993). The strong depletion of one Nephtys sp. sample is more difficult to explain. It is however possible that the collected individual partly fed on Thyasira sp.
Fish
Estimated food-chain lengths (i.e., the TP of the top predator) in Hola (4.2), Malnesfjord (3.9), and the German Bight (4.1) correspond well with the reported global average (3.97 ± 0.47) for marine ecosystems (Vander Zanden and Fetzer, 2007). Food chain length in the northern North Sea (4.6), however, was longer than this average. Such a longer food chain might be linked to a number of ecosystem characteristics, including the history of community organization, resource availability, predator–prey interactions, disturbance, and ecosystem size (Post, 2002a). However, Post (2002a) showed that no single characteristic can satisfactory explain a longer food chain and it is likely that the longer food chain in the northern North Sea is attributed to a combination of several of these ecosystem characteristics. The slightly longer food chain in Hola compared to Malnesfjord was probably caused by the size differences of the collected top predators in Malnesfjord (M. kitt ≈ 30 cm; G. morhua < 25 cm) and Hola (M. kitt ≈ 50 cm; G. morhua > 70 cm). Prey size generally increases with fish predator size (Scharf et al., 2000), possibly indicating feeding on higher TP (Barnes et al., 2010). For cod, a major diet change from predominantly benthic invertebrates to predominantly fish occurs commonly at a size of 25–30 cm (Hislop et al., 1997). We do not believe that bigger fish were absent from Malnesfjord, but we were not able to collect them, and therefore, the difference in food chain length between the two locations in Lofoten-Vesterålen should be considered an artifact.
Furthermore, it has to be considered that sampling during the spring bloom in Lofoten-Vesterålen could have affected our estimation of the food-chain length in comparison to the North Sea. A depletion in δ15N during the spring bloom only at the base of the food web (Kürten et al., 2013) could result in an overestimation of food-chain length. This would mean food chain length in Lofoten-Vesterålen is generally shorter than in the North Sea. Renaud et al. (2011), however, found only little change in food-web structure across seasons and it remains questionable whether the estimated food chain lengths were affected by the sampling season in our study.
Atlantic cod (G. morhua) occupied the highest TP at all locations. In both North Sea locations, G. morhua was identified as the single top predator, while its TP was similar to other fish species in the Lofoten-Vesterålen region. Not only did the TP of G. morhua in relation to the other fish species differ between Lofoten-Vesterålen and the North Sea, but also its reliance on benthic affinity prey was much lower in the Lofoten-Vesterålen region than in the North Sea. This is in accordance with previous studies of gut contents (Michalsen et al., 2008) that showed that planktivorous fish, particularly herring (C. harengus) and Norway pout (Trisopterus esmarkii), constitute the main prey for adult cod in the Lofoten-Vesterålen region (same size range as cod from Hola in this study). This high reliance on pelagic feeding prey indicates that cod stocks in the Lofoten-Vesterålen region might be affected by the northward extension of typical pelagic species (Stenevik and Sundby, 2007). With the ongoing climate change, feeding migrations of mackerel to the North are expected earlier in the season (Utne et al., 2012). This will lead to a large temporal overlap of mackerel and larvae of Norwegian spring spawning herring, and the resulting predation could have regulatory effects on the herring stock (Skaret et al., 2015), and consequently on the available food for cod. In contrast, North Sea cod relied approximately equally on pelagic and benthic affinity prey, which is in accordance with previous studies of stable isotopes from Newfoundland and Labrador (Sherwood and Rose, 2005), and stomach contents from the North Sea (Hislop et al., 1997).
Today, cod is only present in very low numbers in the southern North Sea and the ecosystem has shifted toward a flatfish dominated community, along with particularly high abundances of small, demersal, mesopredatory fish (B. luteum, Arnoglossus laterna, A. cataphractus, Pomatoschistus spp.) (Daan et al., 2005; Ehrich et al., 2007; van Hal et al., 2010). Surprisingly, our results suggest a higher TP for B. luteum (3.47) and A. cataphractus (3.59) than for medium sized flatfishes (L. limanda: 3.19; P. platessa: 3.15) in the German Bight, although this was not identified as significant at the chosen significance level. Furthermore, the medium sized flatfish species showed a higher RBAP than the small mesopredators. Therefore, our data support the results of Schückel et al. (2012), who found little dietary overlap between small and medium sized flatfishes. Cod is known to be the most frequent predator of B. luteum and A. cataphractus in the southern North Sea (Pinnegar, 2014). Our data showed that cod was the only species at a higher TP than these species in the German Bight. Furthermore, cod showed a similar RBAP to B. luteum and A. cataphractus, indicating cod as the only predator of these species in the German Bight. It is, however, possible that other species in the German Bight, not collected as part of this study, prey on small mesopredatory fish. Nonetheless, we suggest that the recent cod decline and the associated reduced top-down control might have resulted in the release of mesopredators in the southern North Sea.
In contrast to benthos, fish can move among habitats, and isotopic signatures might not always be related to the sampling site (Hansson et al., 1997). We found the isotopic signature of S. scombrus in the German Bight to be unrelated to other samples from this location, but instead was virtually identical to mackerel from the northern North Sea, and could reflect the migratory nature of mackerel (Iversen, 2002). It is possible that the collected mackerel from the German Bight had just migrated into this region prior to sampling, and therefore they would still reflect the isotopic signature of their previous feeding grounds. We cannot rule out that other fish species moved into our study locations shortly before the sample collection, even though the observed isotopic signatures did not indicate this.
We used a winter and a spring pelagic baseline to calculate RBAP on the Lofoten-Vesterålen shelf (Hola), since high TP were not enriched in 13C compared to primary consumers. We considered three possible explanations (migration, carbon sources, turnover rates) for this 13C signature, before making this calculation that precludes any other explanations than differences in turnover rates between different trophic levels. As mentioned above, fish can move among habitats and accordingly the 13C signature could reflect the isotopic baseline in another region for some migratory species. However, we found a general lack of 13C enrichment in all taxa at high TP (fish and benthos) and accordingly, migration can be excluded as a possible explanation. Also, potential use of other carbon sources cannot explain this general pattern, which was only observed at higher trophic positions. Microphytobenthos needs to be considered negligible in Hola, since the euphotic zone depth (0.1% surface irradiance) has to be expected much shallower than the bottom depth (195–220 m) at such high latitudes (Varela et al., 2013). Hola is in relative close proximity to the coast, and accordingly terrestrial carbon could be another explanation for the 13C composition of high TP. However, it is highly unlikely that organisms around TP4 rely directly on terrestrial carbon (or any other carbon source) without any prior assimilation of this carbon by organisms with a lower TP. Accordingly, we would expect taxa at intermediate TP being less enriched in 13C than the taxa at the highest TP. This was, however, not the case and leaves differences in turnover rates as the most likely explanation. In seasonal marine ecosystems, the isotopic baselines differ considerably between winter and spring (Kürten et al., 2013; McMeans et al., 2015). Turnover rates are known to be slower at higher trophic positions (Kürten et al., 2013) and accordingly it has to be expected that the winter isotopic baselines are still represented at high TP during the early spring bloom, even though the spring isotopic baselines are already represented at low TP.
Overall RBAP was high in the German Bight, intermediate in the northern North Sea, and low in the Lofoten-Vesterålen region. Similarly, the depth differed between the locations in this study (36–220 m) and a comparison between depth and overall RBAP of the communities suggests that the importance of benthic derived carbon decreases with increasing depths. Such a stronger reliance of benthic derived carbon is not surprising and has to be expected in shallow locations, since pelagic POM is reaching the sediment very rapidly (Suess, 1980) and feeding migrations from the water column to the benthos require very little effort. The different integration of benthic and pelagic trophic pathways by G. morhua at the top of the food chain, however, is unlikely to be related to the difference in depth between the Lofoten-Vesterålen region and the North Sea. Sherwood and Rose (2005) found in their study of the Newfoundland and Labrador continental shelf a RBAP for cod similar to the observed RBAP in the North Sea. Our study suggests functional similarity between the Newfoundland and Labrador continental shelf and the North Sea with regard to cod, although their study locations had depth ranges of 200–450 m, which clearly exceeded the depth of all locations in our study.
Conclusion
Our study has shown that the coupling of the benthic and pelagic compartments of food webs differs between the Lofoten-Vesterålen region and the North Sea, and therefore food webs might be affected differently by environmental changes (Krause et al., 2003). Top predators feed either from pelagic or benthic trophic channels in Lofoten-Vesterålen, while the only top predator (G. morhua) in the North Sea feeds from both channels. Our data suggest that the collapse of the cod stock in the southern North Sea might have enhanced the mesopredator outburst in the region. High structural similarity in both North Sea food webs indicate that the northern North Sea might undergo a similar mesopredator release (fish or invertebrate) if the cod stock decreases due to overfishing or climate change. In the Lofoten-Vesterålen region, however, the collapse of a single species would not be expected to have such an extreme effect on the system. Both, the pelagic and benthic channel sustain a larger number of species that could fill an opening niche, indicating a higher resilience of the Lofoten-Vesterålen region toward high fishing pressure. Furthermore, differences between fjord and shelf were limited to individual species in the Lofoten-Vesterålen region and no overall structural difference was identified.
Author Contributions
MS, PR, and HR designed the study. MS sample collection and laboratory work. MS drafted the manuscript. PR, IK, and HR gave original input to drafting of the manuscript. MS, PR, IK, and HR revised manuscript and proof-read final manuscript.
Conflict of Interest Statement
The authors declare that the research was conducted in the absence of any commercial or financial relationships that could be construed as a potential conflict of interest.
Acknowledgments
We thank the captains and crews of all vessels involved in the sampling campaign. The sampling in the North Sea was part of the German Small-scale Bottom Trawl Survey (GSBTS). Thanks to Anne Sell from the Thünen Institute for taking us onboard, offering individual ship time and logistics, and for accommodating additional sampling. Collecting and processing of winter Calanus data in Hola has been carried out by B. Espinasse. This study is a contribution of the ARCTOS LoVe MarinEco project, made possible through the support of Statoil (contract number: 450261853). The original research in this publication first appeared in the first author's PhD thesis (Silberberger, 2017).
Supplementary Material
The Supplementary Material for this article can be found online at: https://www.frontiersin.org/articles/10.3389/fmars.2018.00119/full#supplementary-material
References
Barnes, C., Maxwell, D., Reuman, D. C., and Jennings, S. (2010). Global patterns in predator–prey size relationships reveal size dependency of trophic transfer efficiency. Ecology 91, 222–232. doi: 10.1890/08-2061.1
Beaugrand, G., and Ibanez, F. (2004). Monitoring marine plankton ecosystems. II: long-term changes in North Sea calanoid copepods in relation to hydro-climatic variability. Mar. Ecol. Prog. Ser. 284, 35–47. doi: 10.3354/meps284035
Beaugrand, G., and Kirby, R. R. (2010). Climate, plankton and cod. Glob. Change Biol. 16, 1268–1280. doi: 10.1111/j.1365-2486.2009.02063.x
Birchenough, S. N. R., Reiss, H., Degraer, S., Mieszkowska, N., Borja, Á., Buhl-Mortensen, L., et al. (2015). Climate change and marine benthos: a review of existing research and future directions in the North Atlantic. Wiley Interdiscip. Rev. Clim. Change 6, 203–223. doi: 10.1002/wcc.330
Bunn, S., Loneragan, N., and Kempster, M. (1995). Effects of acid washing on stable isotope ratios of C and N in penaeid shrimp and seagrass: implications for food-web studies using multiple stable isotopes. Limnol. Oceanogr. 40, 622–625. doi: 10.4319/lo.1995.40.3.0622
Choquet, M. (2017). Combining Ecological and Molecular Approaches to Redefine the Baseline Knowledge of the Genus Calanus in the North Atlantic and the Arctic Oceans. Thesis PhD., Nord University.
Cochrane, S., Andersen, J., Berg, T., Blanchet, H., Borja, A., Carstensen, J., et al. (2016). What is marine biodiversity? Towards common concepts and their implications for assessing biodiversity status. Front. Mar. Sci. 3:248. doi: 10.3389/fmars.2016.00248
Corner, E., Head, R., and Lindapennycuick, C. K. (1976). On the nutrition and metabolism of zooplankton X. Quantitative aspects of Calanus helgolandicus feeding as a carnivore. J. Mar. Biol. Assoc. U.K. 56, 345–358. doi: 10.1017/S0025315400018968
Daan, N., Gislason, H., Pope, J. G., and Rice, J. C. (2005). Changes in the North Sea fish community: evidence of indirect effects of fishing? ICES J. Mar. Sci. 62, 177–188. doi: 10.1016/j.icesjms.2004.08.020
Dando, P., and Spiro, B. (1993). Varying nutritional dependence of the thyasirid bivalves Thyasira sarsi and T. equalis on chemoautotrophic symbiotic bacteria, demonstrated by isotope ratios of tissue carbon and shell carbonate. Mar. Ecol. Prog. Ser. 92, 151–151.
DeMott, W. R. (1988). Discrimination between algae and detritus by freshwater and marine zooplankton. Bull. Mar. Sci. 43, 486–499.
DeNiro, M. J., and Epstein, S. (1978). Influence of diet on the distribution of carbon isotopes in animals. Geochim. Cosmochim. Acta 42, 495–506. doi: 10.1016/0016-7037(78)90199-0
DeNiro, M. J., and Epstein, S. (1981). Influence of diet on the distribution of nitrogen isotopes in animals. Geochim. Cosmochim. Acta 45, 341–351. doi: 10.1016/0016-7037(81)90244-1
Du, J., Zheng, X., Peristiwady, T., Liao, J., Ch. Makatipu, P., Yin, X., et al. (2016). Food sources and trophic structure of fishes and benthic macroinvertebrates in a tropical seagrass meadow revealed by stable isotope analysis. Mar. Biol. Res. 12, 748–757. doi: 10.1080/17451000.2016.1183791
Duffy, J. E., Richardson, J. P., and France, K. E. (2005). Ecosystem consequences of diversity depend on food chain length in estuarine vegetation. Ecol. Lett. 8, 301–309. doi: 10.1111/j.1461-0248.2005.00725.x
Dulvy, N. K., Rogers, S. I., Jennings, S., Stelzenmüller, V., Dye, S. R., and Skjoldal, H. R. (2008). Climate change and deepening of the North Sea fish assemblage: a biotic indicator of warming seas. J. Appl. Ecol. 45, 1029–1039. doi: 10.1111/j.1365-2664.2008.01488.x
Ehrich, S., Adlerstein, S., Brockmann, U., Floeter, J., Garthe, S., Hinz, H., et al. (2007). 20 years of the German small-scale bottom trawl survey (GSBTS): a review. Senckenb. Marit. 37, 13–82. doi: 10.1007/BF03043206
Espinasse, B., Basedow, S. L., Tverberg, V., Hattermann, T., and Eiane, K. (2016). A major Calanus finmarchicus overwintering population inside a deep fjord in northern Norway: implications for cod larvae recruitment success. J. Plankton Res. 38, 604–609. doi: 10.1093/plankt/fbw024
Føyn, L., von Quillfeldt, C. H., and Olsen, E. (2002). Miljø- og Ressursbeskrivelse av Området Lofoten - Barentshavet. Bergen: Havforskningsinstituttet.
Frank, K. T., Petrie, B., Choi, J. S., and Leggett, W. C. (2005). Trophic cascades in a formerly cod-dominated ecosystem. Science 308, 1621–1623. doi: 10.1126/science.1113075
Fredriksen, S. (2003). Food web studies in a Norwegian kelp forest based on stable isotope (δ13C and δ15N) analysis. Mar. Ecol. Prog. Ser. 260, 71–81. doi: 10.3354/meps260071
Fry, B., and Sherr, E. (1984). δ13C measurements as indicators of carbon flow in marine and freshwater systems. Contrib. Marine Sci. 27, 13–47. doi: 10.1007/978-1-4612-3498-2_12
Hagen, N. T. (1983). Destructive grazing of kelp beds by sea urchins in Vestfjorden, northern Norway. Sarsia 68, 177–190. doi: 10.1080/00364827.1983.10420570
Hansson, S., Hobbie, J. E., Elmgren, R., Larsson, U., Fry, B., and Johansson, S. (1997). The stable nitrogen isotope ratio as a marker of food-web interactions and fish migration. Ecology 78, 2249–2257. doi: 10.1890/0012-9658(1997)078[2249:TSNIRA]2.0.CO;2
Hayward, P. J., and Ryland, J. S. (1995). Handbook of the Marine Fauna of North-West Europe. Oxford: Oxford University Press.
Hislop, J., Bromley, P., Daan, N., Gislason, H., Heessen, H., Robb, A., et al. (1997). Database report of the stomach sampling project 1991. ICES Coop Res. Rep. 219, 1–422.
Hobson, K. A., Fisk, A., Karnovsky, N., Holst, M., Gagnon, J.-M., and Fortier, M. (2002). A stable isotope (δ13C, δ15N) model for the North Water food web: implications for evaluating trophodynamics and the flow of energy and contaminants. Deep Sea Res II Top. Stud. Oceanogr. 49, 5131–5150. doi: 10.1016/S0967-0645(02)00182-0
Hobson, K., Ambrose, W., and Renaud, P. (1995). Sources of primary production, benthic-pelagic coupling, and trophic relationships within the Northeast Water Polynya: insights from δ13C and δ15N analysis. Mar. Ecol. Prog. Ser. 128, 1–10. doi: 10.3354/meps128001
Hussey, N. E., MacNeil, M. A., McMeans, B. C., Olin, J. A., Dudley, S. F., Cliff, G., et al. (2014). Rescaling the trophic structure of marine food webs. Ecol. Lett. 17, 239–250. doi: 10.1111/ele.12226
ICES (2013). Report of the Arctic Fisheries Working Group (AFWG), 18 - 24 April 2013. Copenhagen: ICES Headquarters.
Iken, K., Bluhm, B., and Dunton, K. (2010). Benthic food-web structure under differing water mass properties in the southern Chukchi Sea. Deep Sea Res II Top Stud Oceanogr. 57, 71–85.
Iversen, S. A. (2002). “Changes in the perception of the migration pattern of Northeast Atlantic mackerel during the last 100 years,” in ICES Marine Science Symposia (Helsinki), 382–390.
Jardine, T. D., Kidd, K. A., and Fisk, A. T. (2006). Applications, considerations, and sources of uncertainty when using stable isotope analysis in ecotoxicology. Environ. Sci. Technol. 40, 7501–7511. doi: 10.1021/es061263h
Jardine, T. D., McGeachy, S. A., Paton, C. M., Savoie, M., and Cunjak, R. A. (2003). Stable isotopes in aquatic systems: Sample preparation, analysis, and interpretation. Can. Manuscr. Rep. Fish. Aquat. Sci. 2656, 1–39.
Kortsch, S., Primicerio, R., Fossheim, M., Dolgov, A. V., and Aschan, M. (2015). Climate change alters the structure of arctic marine food webs due to poleward shifts of boreal generalists. Proc. R Soc. Biol. Sci. B 282:20151546. doi: 10.1098/rspb.2015.1546
Krause, A. E., Frank, K. A., Mason, D. M., Ulanowicz, R. E., and Taylor, W. W. (2003). Compartments revealed in food-web structure. Nature 426, 282–285. doi: 10.1038/nature02115
Kröncke, I., Reiss, H., Eggleton, J. D., Aldridge, J., Bergman, M. J., Cochrane, S., et al. (2011). Changes in North Sea macrofauna communities and species distribution between 1986 and 2000. Estuarine Coastal Shelf Sci. 94, 1–15. doi: 10.1016/j.ecss.2011.04.008
Kürten, B., Frutos, I., Struck, U., Painting, S. J., Polunin, N. V., and Middelburg, J. J. (2013). Trophodynamics and functional feeding groups of North Sea fauna: a combined stable isotope and fatty acid approach. Biogeochemistry 113, 189–212. doi: 10.1007/s10533-012-9701-8
Longhurst, A., Sathyendranath, S., Platt, T., and Caverhill, C. (1995). An estimate of global primary production in the ocean from satellite radiometer data. J. Plankton Res. 17, 1245–1271. doi: 10.1093/plankt/17.6.1245
MarLIN (Marine Life Information Network) (2016). Marine Life Information Network [Online]. Plymouth: Marine Biological Association of the United Kingdom. Available online at: www.marlin.ac.uk (Accessed 2016)
McConnaughey, T., and McRoy, C. (1979). Food-web structure and the fractionation of carbon isotopes in the Bering Sea. Mar Biol 53, 257–262. doi: 10.1007/BF00952434
McMeans, B. C., McCann, K. S., Humphries, M., Rooney, N., and Fisk, A. T. (2015). Food web structure in temporally-forced ecosystems. Trends Ecol. Evol. 30, 662–672. doi: 10.1016/j.tree.2015.09.001
McMeans, B. C., Rooney, N., Arts, M. T., and Fisk, A. T. (2013). Food web structure of a coastal Arctic marine ecosystem and implications for stability. Mar. Ecol. Prog. Ser. 482, 17–28. doi: 10.3354/meps10278
McQuatters-Gollop, A., Raitsos, D. E., Edwards, M., Pradhan, Y., Mee, L. D., Lavender, S. J., et al. (2007). A long-term chlorophyll dataset reveals regime shift in North Sea phytoplankton biomass unconnected to nutrient levels. Limnol. Oceanogr. 52, 635–648. doi: 10.4319/lo.2007.52.2.0635
Michalsen, K., Johannesen, E., and Bogstad, B. (2008). Feeding of mature cod (Gadus morhua) on the spawning grounds in Lofoten. ICES J. Mar. Sci. 65, 571–580. doi: 10.1093/icesjms/fsn019
Minagawa, M., and Wada, E. (1984). Stepwise enrichment of 15N along food chains: further evidence and the relation between δ15N and animal age. Geochim. Cosmochim. Acta 48, 1135–1140. doi: 10.1016/0016-7037(84)90204-7
Nadon, M.-O., and Himmelman, J. H. (2006). Stable isotopes in subtidal food webs: have enriched carbon ratios in benthic consumers been misinterpreted? Limnol. Oceanogr. 51, 2828–2836. doi: 10.4319/lo.2006.51.6.2828
Neumann, H., and Kröncke, I. (2011). The effect of temperature variability on ecological functioning of epifauna in the German Bight. Mar. Ecol. 32, 49–57. doi: 10.1111/j.1439-0485.2010.00420.x
Nilsen, M., Pedersen, T., Nilssen, E. M., and Fredriksen, S. (2008). Trophic studies in a high-latitude fjord ecosystem-a comparison of stable isotope analyses (δ13C and δ15N) and trophic-level estimates from a mass-balance model. Can. J. Fish. Aquat. Sci. 65, 2791–2806. doi: 10.1139/F08-180
Nordström, M. C., Aarnio, K., and Bonsdorff, E. (2016). Mesograzer identity, not host algae, determines consumer stable isotope ratios. Mar. Biol. Res. 12, 186–192. doi: 10.1080/17451000.2015.1112017
Pätsch, J., Serna, A., Dähnke, K., Schlarbaum, T., Johannsen, A., and Emeis, K.-C. (2010). Nitrogen cycling in the German Bight (SE North Sea) — Clues from modelling stable nitrogen isotopes. Cont. Shelf Res. 30, 203–213. doi: 10.1016/j.csr.2009.11.003
Pauly, D., and Christensen, V. (1995). Primary production required to sustain global fisheries. Nature 374, 255–257. doi: 10.1038/374255a0
Pinnegar, J. K. (2014). DAPSTOM-An Integrated Database & Portal for Fish Stomach Records. Version 4.7. Lowestoft: Centre for Environment, Fisheries & Aquaculture Science.
Post, D. M. (2002a). The long and short of food-chain length. Trends Ecol. Evol. 17, 269–277. doi: 10.1016/S0169-5347(02)02455-2
Post, D. M. (2002b). Using stable isotopes to estimate trophic position: models methods, and assumptions. Ecology 83, 703–718. doi: 10.1890/0012-9658(2002)083[0703:USITET]2.0.CO;2
Renaud, P. E., Løkken, T. S., Jørgensen, L. L., Berge, J., and Johnson, B. J. (2015a). Macroalgal detritus and food-web subsidies along an Arctic fjord depth-gradient. Front Mar Sci 2:31. doi: 10.3389/fmars.2015.00031
Renaud, P. E., Sejr, M. K., Bluhm, B. A., Sirenko, B., and Ellingsen, I. H. (2015b). The future of Arctic benthos: expansion, invasion, and biodiversity. Prog. Oceanogr. 139, 244–257. doi: 10.1016/j.pocean.2015.07.007
Renaud, P. E., Tessmann, M., Evenset, A., and Christensen, G. N. (2011). Benthic food-web structure of an Arctic fjord (Kongsfjorden, Svalbard). Mar. Biol. Res. 7, 13–26.
Richardson, A. J., and Schoeman, D. S. (2004). Climate impact on plankton ecosystems in the Northeast Atlantic. Science 305, 1609–1612. doi: 10.1126/science.1100958
Rigolet, C., Thiébaut, É., and Dubois, S. F. (2014). Food web structures of subtidal benthic muddy habitats: evidence of microphytobenthos contribution supported by an engineer species. Mar. Ecol. Prog. Ser. 500, 25–41. doi: 10.3354/meps10685
Scharf, F. S., Juanes, F., and Rountree, R. A. (2000). Predator size-prey size relationships of marine fish predators: interspecific variation and effects of ontogeny and body size on trophic-niche breadth. Mar. Ecol. Prog. Ser. 208, 229–248. doi: 10.3354/meps208229
Schückel, S., Sell, A. F., Kröncke, I., and Reiss, H. (2012). Diet overlap among flatfish species in the southern North Sea. J. Fish Biol. 80, 2571–2594. doi: 10.1111/j.1095-8649.2012.03309.x
Schückel, U., Kröncke, I., and Baird, D. (2015). Linking long-term changes in trophic structure and function of an intertidal macrobenthic system to eutrophication and climate change using ecological network analysis. Mar. Ecol. Prog. Ser. 536, 25–38. doi: 10.3354/meps11391
Sherwood, G. D., and Rose, G. A. (2005). Stable isotope analysis of some representative fish and invertebrates of the Newfoundland and Labrador continental shelf food web. Estuar. Coast. Shelf Sci. 63, 537–549. doi: 10.1016/j.ecss.2004.12.010
Silberberger, M. (2017). Spatial Scales of Benthic Ecosystems in the Sub-Arctic Lofoten-Vesterålen Region. Thesis Ph.D., Nord University.
Silberberger, M., Renaud, P., Espinasse, B., and Reiss, H. (2016). Spatial and temporal structure of the meroplankton community in a sub-Arctic shelf system. Mar. Ecol. Prog. Ser. 555, 79–93. doi: 10.3354/meps11818
Skaret, G., Bachiller, E., Langøy, H., and Stenevik, E. K. (2015). Mackerel predation on herring larvae during summer feeding in the Norwegian Sea. ICES J. Mar. Sci. 72, 2313–2321. doi: 10.1093/icesjms/fsv087
Stenevik, E. K., and Sundby, S. (2007). Impacts of climate change on commercial fish stocks in Norwegian waters. Mar. Policy 31, 19–31. doi: 10.1016/j.marpol.2006.05.001
Suess, E. (1980). Particulate organic carbon flux in the oceans—surface productivity and oxygen utilization. Nature 288:260. doi: 10.1038/288260a0
Thomas, H., Bozec, Y., Elkalay, K., and de Baar, H. J. W. (2004). Enhanced open ocean storage of CO2 from shelf sea pumping. Science 304, 1005–1008. doi: 10.1126/science.1095491
Utne, K. R., Huse, G., Ottersen, G., Holst, J. C., Zabavnikov, V., Jacobsen, J. A., et al. (2012). Horizontal distribution and overlap of planktivorous fish stocks in the Norwegian Sea during summers 1995–2006. Mar. Biol. Res. 8, 420–441. doi: 10.1080/17451000.2011.640937
van Hal, R., Smits, K., and Rijnsdorp, A. D. (2010). How climate warming impacts the distribution and abundance of two small flatfish species in the North Sea. J. Sea Res. 64, 76–84. doi: 10.1016/j.seares.2009.10.008
Vander Zanden, J. M., and Fetzer, W. W. (2007). Global patterns of aquatic food chain length. Oikos 116, 1378–1388. doi: 10.1111/j.0030-1299.2007.16036.x
Vander Zanden, M. J., and Vadeboncoeur, Y. (2002). Fishes as integrators of benthic and pelagic food webs in lakes. Ecology 83, 2152–2161. doi: 10.1890/0012-9658(2002)083[2152:FAIOBA]2.0.CO;2
Varela, D. E., Crawford, D. W., Wrohan, I. A., Wyatt, S. N., and Carmack, E. C. (2013). Pelagic primary productivity and upper ocean nutrient dynamics across Subarctic and Arctic Seas. J. Geophys. Res. Oceans 118, 7132–7152. doi: 10.1002/2013JC009211
von Salvini-Plawen, L. (1972). Cnidaria as food-sources for marine invertebrates. Cah. Biol. Mar. 13, 385–400.
Watson, R., and Pauly, D. (2001). Systematic distortions in world fisheries catch trends. Nature 414, 534–536. doi: 10.1038/35107050
Weinert, M., Mathis, M., Kröncke, I., Neumann, H., Pohlmann, T., and Reiss, H. (2016). Modelling climate change effects on benthos: distributional shifts in the North Sea from 2001 to 2099. Estuarine Coast. Shelf Sci. 175, 157–168. doi: 10.1016/j.ecss.2016.03.024
Williams, R., Conway, D., and Hunt, H. (1994). The role of copepods in the planktonic ecosystems of mixed and stratified waters of the European shelf seas. Hydrobiologia 292, 521–530. doi: 10.1007/BF00229980
Worm, B., Lotze, H. K., Hillebrand, H., and Sommer, U. (2002). Consumer versus resource control of species diversity and ecosystem functioning. Nature 417, 848–851. doi: 10.1038/nature00830
Worms Editorial Board (2016). World Register of Marine Species (WoRMS). Available online at: http://www.marinespecies.org
Keywords: stable isotope analysis, pelagic-benthic coupling, benthic invertebrates, fish, North Sea, sub-Arctic, Lofoten-Vesterålen region, mesopredator release
Citation: Silberberger MJ, Renaud PE, Kröncke I and Reiss H (2018) Food-Web Structure in Four Locations Along the European Shelf Indicates Spatial Differences in Ecosystem Functioning. Front. Mar. Sci. 5:119. doi: 10.3389/fmars.2018.00119
Received: 04 August 2017; Accepted: 21 March 2018;
Published: 11 April 2018.
Edited by:
Michael Arthur St. John, National Institute of Aquatic Resources, Technical University of Denmark, DenmarkReviewed by:
Amy C. Hirons, Nova Southeastern University, United StatesJan Marcin Weslawski, Institute of Oceanology (PAN), Poland
Copyright © 2018 Silberberger, Renaud, Kröncke and Reiss. This is an open-access article distributed under the terms of the Creative Commons Attribution License (CC BY). The use, distribution or reproduction in other forums is permitted, provided the original author(s) and the copyright owner are credited and that the original publication in this journal is cited, in accordance with accepted academic practice. No use, distribution or reproduction is permitted which does not comply with these terms.
*Correspondence: Marc J. Silberberger, bWFyYy5zaWxiZXJiZXJnZXJAZ21haWwuY29t