 Heidi Dewar1*
 Steven G. Wilson2
 John R. Hyde1
 Owyn E. Snodgrass3
 Andrew Leising4Chi H. Lam5
 Réka Domokos6
 James A. Wraith1Steven J. Bograd4
 Sean R. Van Sommeran7Suzanne Kohin1
- 1Life History Program, NOAA Southwest Fisheries Science Center, La Jolla, CA, United States
- 2Hopkins Marine Station, Stanford University, Pacific Grove, CA, United States
- 3Ocean Associates, Inc., Life History Program, NOAA Southwest Fisheries Science Center, La Jolla, CA, United States
- 4Environmental Research Division, NOAA Southwest Fisheries Science Center, Monterey, CA, United States
- 5Large Pelagics Research Center, School for the Environment, University of Massachusetts Boston, Boston, MA, United States
- 6Ecosystems and Oceanography Division, NOAA Pacific Islands Fisheries Science Center, Honolulu, HI, United States
- 7Pelagic Shark Research Foundation, Capitola, CA, United States
To fill data gaps on movements, behaviors and habitat use, both near- and offshore, two programs were initiated to deploy satellite tags on basking sharks off the coast of California. Basking sharks are large filter-feeding sharks that are second in size only to whale sharks. Similar to many megafauna populations, available data suggest that populations are below historic levels. In the eastern North Pacific (ENP) Ocean, the limited information on basking sharks comes from nearshore habitats where they forage. From 2010 to 2011, four sharks were tagged with pop-off satellite archival tags with deployments ranging from 9 to 240 days. The tags provided both transmitted and archived data on habitat use and geographic movement patterns. Nearshore, sharks tended to move north in the summer and prefer shelf and slope habitat around San Diego, Point Conception and Monterey Bay. The two sharks with 180 and 240 days deployments left the coast in the summer and fall. Offshore their paths diverged and by January one shark had moved to near the tip of the Baja Peninsula, Mexico and the other to the waters near Hawaii, USA. Vertical habitat use was variable both within and among individuals and changed as sharks moved offshore. Nearshore, most time was spent in the mixed layer but sharks did spend hours in cold waters below the mixed layer. Offshore vertical movements depended on location. The shark that went to Hawaii had a distinct diel pattern, with days spent at ~450–470 m and nights at ~250–300 m and almost no time in surface waters, corresponding with the diel migration of a specific portion of the deep scattering layer. The shark that moved south along the Baja Peninsula spent progressively more time in deep water but came to the surface daily. Movement patterns and shifts in vertical habitat and use are likely linked to shifts in prey availability and oceanography. Data collected indicate the potential for large-scale movements and the need for international dialogue in any recovery efforts.
Introduction
A long history of human interaction has resulted in the decline of many species of marine megafauna including turtles, tunas, cetaceans, rays and sharks (Springer et al., 2003; Lewison et al., 2004; Marshall et al., 2006; Bradshaw et al., 2008; Dulvy et al., 2008; Croll et al., 2016; ISC, 2016). This list includes the second largest shark, the basking shark (Cetorhinus maximus, Gunnerus, 1765), that can reach 12 m in length and is named for its habit of swimming slowly at the surface (Compagno, 1984; Priede, 1984; Sims, 2008; McFarlane et al., 2009). Similar to many marine mammals, targeted fisheries for basking sharks in the Pacific Ocean ended decades ago (McFarlane et al., 2009). However, while a number of marine mammal populations have rebounded (IWC, 1998; Summarized in Carretta et al., 2009), there is no obvious increase in basking shark populations in the Pacific Ocean (McFarlane et al., 2009). Although there is an increasing body of research on basking sharks in the Atlantic Ocean, very little is known about this species in the Pacific Ocean, hampering efforts to develop a recovery plan and identify potential sources of mortality.
While basking sharks are circum-global in distribution, they are most commonly reported in the temperate, coastal waters of the northern hemisphere in the Atlantic and Pacific Oceans (Compagno, 1984; Ebert, 2003; Sims, 2008; McFarlane et al., 2009; Curtis et al., 2014). In the eastern North Pacific (ENP), aerial surveys, sightings and catch data indicate their range is from Southeast Alaska to Baja California, Mexico. Historically, there are two regions where basking sharks were most commonly observed: the southern coast of British Columbia, Canada, and near Monterey Bay, CA, U.S.A. (Squire, 1967, 1990; reviewed in McFarlane et al., 2009). Sharks from these areas are thought to belong to the same stock based on their proximity and seasonal shifts in abundance (Squire, 1990; Darling and Keogh, 1994; Ebert, 2003; McFarlane et al., 2009). Historical data show that basking sharks were more prevalent in Canada from March through October (Darling and Keogh, 1994; McFarlane et al., 2009), while off CA, peak abundance was from October through March. It should be noted, however, that basking sharks were reported off California (CA) throughout the year (Squire, 1990; Baduini, 1995). While these two regions are considered linked, the full geographic range of this stock is unknown. In the Atlantic Ocean both electronic tagging data (Gore et al., 2008; Skomal et al., 2009; Braun et al., 2018) and genetic analysis (Hoelzel et al., 2006) suggest the potential for large-scale migrations. No electronic tagging or genetic studies have been conducted in the ENP and additional information on migrations and population structure is needed.
While there are currently no targeted fisheries, there is a long history of fishery interactions with basking sharks in the ENP. Off central CA, fisheries took an estimated 700–800 sharks in two periods from 1924 to 1938 and 1946 to 1952 (Phillips, 1948; summarized in McFarlane et al., 2009). They were taken for their liver oil, human consumption, fertilizer, and use in animal feed. In the 1940's the Canadian government initiated an eradication program to prevent sharks from interfering with salmon fisheries. Between entanglement in salmon nets, sport kills, and the eradication program it is estimated that 1,000–2,600 sharks were killed by 1970 when the program ended (McFarlane et al., 2009). Basking sharks have also been taken incidentally in a range of gear types in U.S., Mexican and Canadian waters as well as in high-seas driftnet fisheries (Bonfil, 1994; Darling and Keogh, 1994; McKinnell and Seki, 1998; Larese and Coan, 2008; Sandoval-Castillo and Ramirez-Gonzalez, 2008; McFarlane et al., 2009). In the ENP, basking sharks are now rare in areas where hundreds to thousands of individuals were previously reported and aerial surveys, sightings, and catch data indicate a decline in the population (Squire, 1967, 1990; Darling and Keogh, 1994; Baduini, 1995; COSEWIC, 2007; McFarlane et al., 2009). While a decline in abundance is apparent for both Californian and Canadian waters, there is a high degree of variability in observations across years (McFarlane et al., 2009). This holds true even historically, Jordan (1887) reported that basking sharks would not be seen for 20 years at a time. The cause of this variability has not been determined in part due to the lack of basic information on migratory patterns, geographic distributions, essential habitat, and species rarity. A better understanding of the mechanisms underlying this variability is needed to help determine the cause of short and long-term trends in abundance. It is also critical to determine where sharks go when they are not observed in coastal waters and to more completely identify potential sources of mortality.
Due to concerns about the populations of basking sharks in the ENP and the lack of basic biological data, the National Oceanic and Atmospheric Administration (NOAA) listed basking shark as a Species of Concern in 2010 (NOAA, 2004, 2010). Basking sharks are listed as endangered in the Pacific, Canadian waters (COSEWIC, 2007), and also have a Convention on International Trade in Endangered Species of Wild Fauna and Flora (CITES) Appendix II listing (CITES, 2002) which requires that trade be documented. They are also listed by a number of other international organizations (Fowler, 2005; IUCN, 2007). To obtain additional data on basking shark movements and habitat use, two satellite tagging programs funded by NOAA were initiated off CA. These studies provide the first data on the large-scale movements and behaviors of basking sharks in the ENP.
Materials and Methods
Tagging and Data Processing
Given the rare occurrence of basking sharks off the coast of CA, we relied on public sightings or reports to local fishing forums (e.g., bdoutdoors.com) to locate sharks for tagging. When basking sharks were reported, we launched a small vessel or a pair of inflatable skiffs and searched the area where the shark was last seen. On all occasions when sharks were observed, tags were successfully deployed. For tagging, free-swimming basking sharks were approached and the tag anchor was inserted just below the dorsal fin with a long tagging pole (2.7–4 m). All basking shark tagging was done in accordance with protocols approved by the Southwest Fisheries Science Center, Institutional Animal Care and Use Committee.
Tags used were MK10-AF transmitting fast-GPS tags (MK10 version 10.1) and MK-10 pop-up satellite archival tags (PSATs version MK10.2) from Wildlife Computers (Redmond, WA, U.S.A.). Both tag types release after a preprogrammed period and transmit light data for estimating geolocation along with temperature and pressure (depth) data summarized as profiles (PDTs) and histograms. If tags are recovered, the entire archival dataset can be downloaded. Tags were programmed to summarize data over 6- or 24-h sampling intervals. The GPS tags also log time-series data (temperature and pressure) set at user-specified intervals. In addition, when the GPS tag is at the surface, it captures data from the GPS satellite system that can be post-processed to obtain more accurate locations. If there is sufficient surface time, the data are transmitted prior to the tag's release. The release dates were set for 180 (n = 1) and 240 (n = 3) days following deployment. A final location is estimated by the Argos satellite system after the tag releases from the shark.
The tags were leadered and anchored using different methods (Table 1). The three dart types used included (1) a nylon head augmented with spear gun flopper-blades (PM dart; Prince and Goodyear, 2006), (2) a titanium sled dart (Block et al., 1998) and (3) an eight cm JBL slip-tip, spear-point. Tags were leadered with 300 lb. test monofilament that was covered with heat-shrink tubing. Leader lengths ranged from 30 to 45 cm.

Table 1. Deployment information.
The archival and transmitted data were analyzed to characterize habitat preferences. Data from the first 24 h were not analyzed to reduce the possible effects of tagging on behavior (Hoolihan et al., 2011). Sea surface temperatures (SST) were calculated from temperatures recorded in the top 2 m of the water column. For analyses of diel patterns, we used data from sharks A, B, and C for which bin intervals were 6 h. The two bins that encompassed sunrise and sunset were not included. Shark C transited two time zones and the estimated location of the shark was used to shift the time of sunrise and sunset to local time for diel analyses.
For analyses of onshore and offshore habitat use, the data for sharks C and D were clustered and analyzed according to location (see below). For both sharks, location data were missing around the times the sharks moved offshore, data for those days were not included in the analyses. A Kolmogorov-Smirnov (KS) test was used to test for significant differences between temperature and depth histograms. Mean values are reported ± standard deviation unless otherwise indicated.
Geolocation Estimates
Deployment and pop-up locations, transmitted light data, and intermittent GPS locations were used to estimate latitude and longitude using the state-space Kalman filter model TrackIt (Nielsen and Sibert, 2007). Correction with SST was not possible due to the limited time the sharks spent at the surface and their proximity to the coast during periods of prevalent cloud cover in the summers of 2010 and 2011. For Shark C, PDT records provided enough temperature data at 200 m to enable correction of position estimates using a variant of TrackIt (Lam et al., 2010). Matching was performed at 200 m between tag measurements and World Ocean Atlas 2009 monthly 1°-grid climatology (Locarnini et al., 2010). Lastly, bathymetric correction was applied (Galuardi et al., 2010). Sharks C and D were considered to have moved offshore when they made a directed movement to the west and continued on an offshore trajectory (Figure 1). Given the geolocation errors it was not possible to use a specific location or distance from the coast as the transition point from near- to offshore. Regional SST and chlorophyll a (chl a) around this transition were obtained through CoastWatch (http://coastwatch.pfeg.noaa.gov/) and plotted using ArcGIS software (Environmental Systems Research Institute, Redlands, CA). SST data from CoastWatch were also used to characterize SST in the waters northeast of Hawaii.
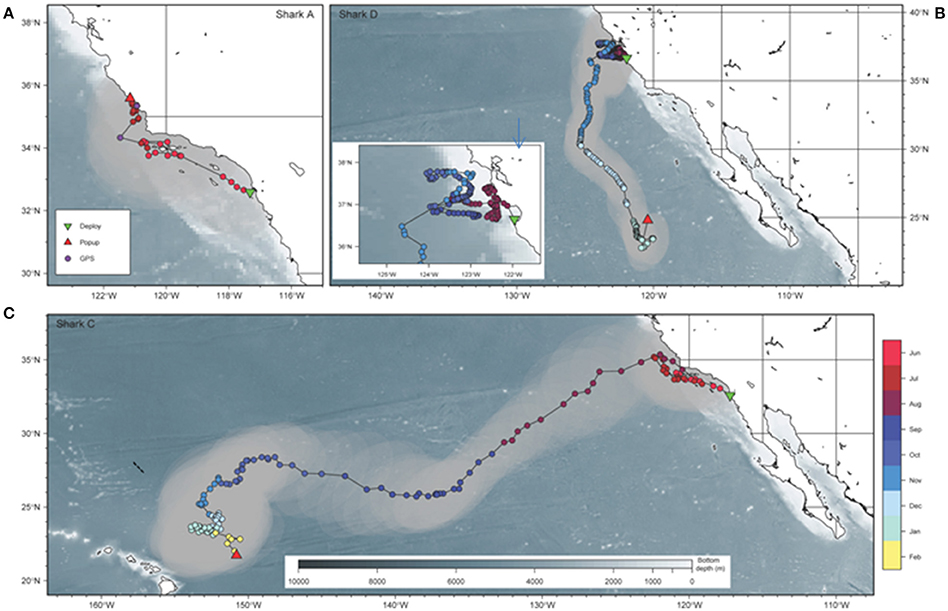
Figure 1. Geographic movements of three basking sharks tagged off California. Movements of (A) shark A over 51 days, (B) shark D over 180 days, and (C) shark C over 240 days including tagging (green triangle) and tag pop-up (red triangle) location, GPS locations and light-based geolocation estimates. Gray shows error estimates around the light-based geolocation estimates. Inset shows an expansion of the movements of shark D off Central CA. The dashed line indicated to path of the acoustic survey.
Acoustic Backscatter
To infer foraging behavior in the Central Pacific for shark C, we compared vertical movements to data from an acoustic survey conducted near the track of the shark from ~23°N, 157°W to 26°N, 158°W on March 27, 2009. Like shark C, the survey was conducted in the subtropical gyre in an area influenced by the westward flowing North Pacific current. Both these factors result in longitudinal homogeneity. The acoustic surveys were conducted on board the NOAA R/V Oscar Elton Sette, using a hull mounted Kongsberg Maritime AS Simrad (Horten, Norway) EK60 split-beam system with 7° beam width operating at the 38, 70, and 120 kHz frequencies from the surface to 1,200 m depth. The system was calibrated prior to each survey using a 38.1-mm-diameter tungsten carbide sphere according to standard methods (Demer et al., 2015). Acoustics signals were processed using Echoview software (Hobart, Tasmania) to remove cavitation noise and bubble dropout, ensuring high signal-to-noise ratios. Data, in the form of volume backscattering coefficients (Sv in dB re 1 m−1), were used to examine the vertical characteristics of the scattering layers. Differences in Sv between frequencies were used to assess the relative composition of the shallow scattering layer and deep scattering layer (Mac Lennan et al., 2002).
Results
Tag Deployments
Satellite tags were deployed on three sharks off San Diego and one shark in Monterey Bay, CA (Table 1). In all cases fork length was estimated at between 5 and 6.1 m but the sharks swam away quickly and it was not possible to determine sex. Data were obtained from all tags. The first two tags released early: shark A off Morro Bay, CA after 51 days (Figure 1) and shark B after 9 days when it was recovered from a beach near the tagging location (San Diego, CA). The final two tags released on their programmed dates: shark C after 240 days ~400 km northeast of Hawaii, U.S.A. and shark D after 180 days ~1,130 km west of the tip of Baja Peninsula, Mexico. For the three GPS tags (sharks A, B, and C), no transmissions were received prior to release and only four valid GPS-based location estimates were obtained, one for shark A and three for shark C and all from nearshore locations.
Tracks
Tracks were estimated for sharks A, C, and D. The average estimated errors for the light-based latitude and longitude were <0.4 degrees. No locations were estimated for shark B due to its short deployment and the close proximity of the deployment and tag recovery locations.
The estimated track for shark A indicates that after tagging on June 6, the shark moved northwest of San Diego toward the Channel Islands (Figure 1). On July 5, the GPS positioned the shark near the continental slope off Point Conception, CA. Between July 5 and 29, when the tag released off Morro Bay, the shark was in the region around Point Conception. Similarly, shark C moved northwest from San Diego after tagging and remained in the area around Point Conception from mid-June until early August (Figure 1). Both sharks appear to have stayed over the continental shelf, in the region around Point Conception, including the Channel Islands and Santa Barbara Channel. In early August (between August 3 and 11), shark C left the coast and made relatively directed movements southwest (2,760 km in 59 days, 47 km/day) until early October when it reached ~150°W, northeast of Hawaii. Movements then slowed and the shark remained northeast of Hawaii until early February when the tag released.
Shark D, tagged off Monterey in August, remained around Monterey Bay until early November when it moved offshore (between November 7 and 11) and toward the south, remaining well offshore of Point Conception and the Southern California Bight (Figure 1). Movements south were relatively directed (1,560 km in 82 days, 19 km/day) until the shark reached the area west of the tip of Baja Peninsula, Mexico where SST was >20°C. There the shark stopped around January 18 and returned north prior to the tag releasing on January 29.
Regional SST and chl a around the time that the two sharks left the coastal area were examined (Figure 2). Shark C left in early August when chl a concentration was high around Point Conception and it remained high after the shark left. SST in the days around the time of departure dropped from ~17 to ~15°C. Shark D left central CA in early November just as a decline in both chl a concentration and SST (from ~15 to ~13°C) became apparent. Neither shark followed obvious surface fronts in SST or chl a in their offshore migrations (Figure 2).
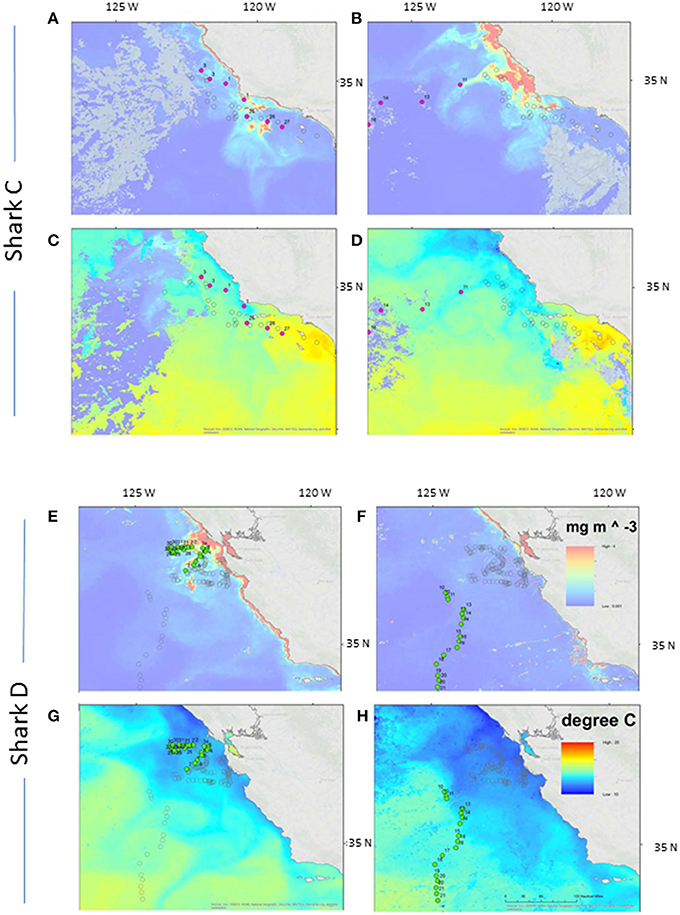
Figure 2. Departure related to sea surface temperature and chlorophyll a. Two week composite images of SST (A,B,E,F) and chlorophyll a (C,D,G,H) bracketing the time that basking shark C (A–D) and D (E–H) left the coastal region. The filled points show the location of the shark over the period of the composite image. The empty circles show the remainder of the track.
Temperature and Depth
Temperature and depth data were obtained from all four sharks including an 8-day archival record from shark B. A summary of temperature and depth experienced across all sharks is provided in Table 2. Overall, temperatures ranged from 5 to 24.6°C and depths were from the surface to 784 m (Figure 3). Except for shark C, all sharks came to the surface daily. SST spanned more than 14°C ranging from 10.4 to 24.6°C although the average across fish was much narrower (13.6–16.4°C; Table 2). Given the variability in vertical habitat use, portions of the tracks were separated into periods when shifts were apparent (Figure 3). For shark A, which remained nearshore, periods of shallow vs. deep vertical habitat use were separated. For sharks C and D, nearshore and offshore periods were separated as described above.
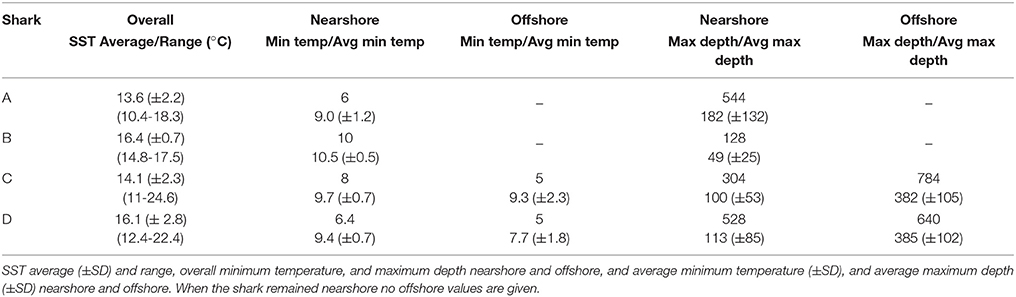
Table 2. Summary of temperature (°C) and depth (m) for all sharks.
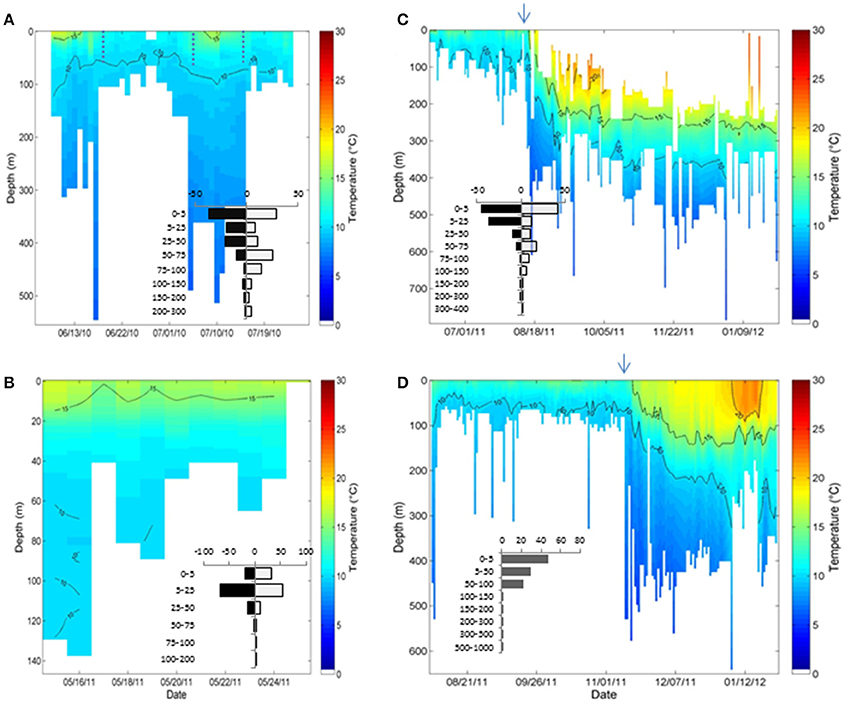
Figure 3. Temperature and depth profiles obtained from the PDT data for each of the 4 sharks. (A) Shark A, (B) shark B, (C) shark C, and (D) shark D. Inset is a histogram of the percent time (X axis) spent in different depth bins (y axis, in m) over the nearshore record separated into day (gray) and night (black) periods for all but shark D. For shark A the dotted lines indicate the approximate points in time at which the behavior is considered to have shifted between deeper and shallower modes. The arrows indicate the approximate time the shark moved offshore.
Nearshore
In nearshore regions, all but shark A showed similar preference for shallower depths, with 75% of the time or more spent in the top 50 m and 95% in the top 100 m with only periodic dives into deeper waters (Figure 3). For sharks B, C, and D the average daily maximum depth was between 49 and 113 m. For shark A, the overall depth distribution was deeper (55% spent in the top 50 m and 85% above 100 m) as was the maximum average daily depth (182 m ±132). The increased depth for shark A was also reflected in lower temperatures with >88% of the time between 8 and 14°C whereas the remaining sharks spent 83–99% of the time between 10 and 18°C. The overall deeper depths and cooler temperatures for shark A resulted from two periods where the average SST was warmer (SSTs 15.3 ± 1.7°C vs. 12 ± 1.2°C) and the water column more thermally stratified (Figure 3, Supplemental Figure 1).
Differences in nearshore vertical movements within and between individuals were also apparent in the time-series data. The greatest detail is in the two-min archival data (Figure 4). Shark B showed a range of dive patterns, making frequent vertical excursions at various depths in relation to the thermocline or spending protracted periods near the surface or at depth with one dive lasting 6.5 h in waters of 11.5°C. The 10-min, time-series data also show behaviors similar to those seen for shark B (not shown) with additional patterns including more extensive vertical excursions (Figure 4).
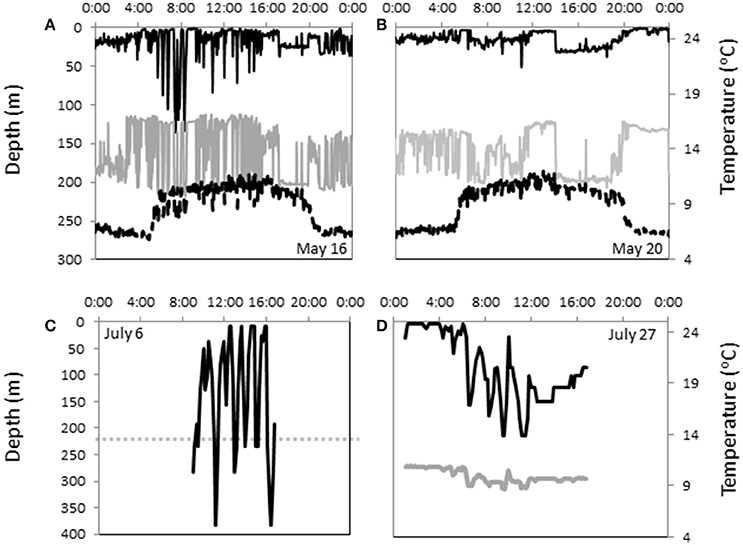
Figure 4. Temperature, depth and light data showing different fine-scale vertical movement patterns. (A,B) Two-min archival data from shark B for two different days. 10-min time series data for (C) shark B on July 6 and (D) shark C on July 27. Solid black line = depth, gray line = temperature, dotted gray line = SST based on PDT for that day, dotted black line = relative light levels as indicator of day and night in A and B.
Offshore
When sharks C and D moved offshore, their temperature and depth ranges expanded, maximum depths increased, minimum temperature decreased and SST increased (Table 2, Figure 3). Time at temperature was more broadly distributed with ~95% of the time spent over a 14°C range (6–20°C) in comparison to an 8°C range (10–18°C) in nearshore habitat (Figure 5).
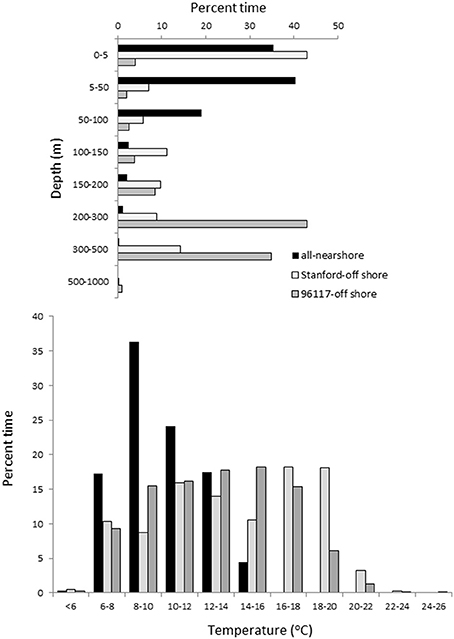
Figure 5. Depth and temperature histograms. Depth and temperature histograms including data from all tags combined in near-shore (black) and shark C (dark gray) and D (light gray) when offshore.
While the temperature and depth ranges expanded for both sharks offshore, habitat use differed. As shark D moved south after leaving Central CA, time spent at depths deeper than 100 m increased and correspondingly, the time spent in the top 5 m decreased to a minimum of 20% (Supplemental Figure 2). However, this shark came to the surface each day. Near the end of the record when SST was >20°C (maximum 22.4°C), the maximum dive depth decreased, increasing again when SST declined (Figure 3) as the shark moved back north.
While the depths for shark C also increased offshore (Table 2, Figure 3), shark C rarely came to the surface (4% time spent 0–5 m). As shark C moved west the time spent in deeper waters increased and over the last 2 months almost 100% of the time was spent in waters deeper than 200 m (Supplemental Figure 2). An exception was 10 recorded excursions into shallow waters (<50 m) which lasted 3–16 min (average 7 ± 4). Eight of ten shallow events happened during the bins including sunrise or sunset. There was no apparent link to lunar phase.
Diel Patterns
For sharks A, B, and C it was possible to examine diel patterns. Although this was not possible for shark D, given the 24-h bins, the bimodal depth distribution is consistent with a diel pattern (Figure 5, Supplemental Figure 2). The nearshore records for A and C show a significant increase in day vs. nighttime depths (K-S test, p < 0.05). The sharks spent from 77 to 92% of their time in the top 50 m at night in comparison to 47–65% during the day (Figure 3). Also, in the time-series data the average daytime hourly depth increased significantly from 37 m at night (SE ± 2) to 62 m during the day (SE ± 5) for shark A and from 12 m (SE ± 1) to 51 m (SE ± 4) for shark C. For shark B no diel pattern was apparent (Figure 3).
The most striking and consistent diel difference was observed for shark C while offshore. While this shark did not come to the surface, the nighttime depths (20:00–6:00 = 250 ± 29 m) were significantly shallower (t-test, p < 0.05) than those during the day (8:00–14:00 = 447 ± 28 m) (Figure 6). Given the thermal stratification, even at depth, the shark experienced as much as a 10°C change in temperature over the course of a day (night 11.4–17.7°C, day 7.3–13.2°C). Interestingly, while the morning descent occurred around sunrise, the evening ascent occurred 2–3 h before sunset. The SST in this region was between ~23 and ~25°C over this period.
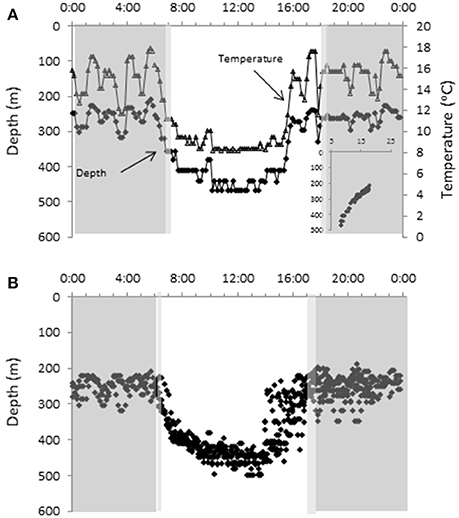
Figure 6. Time series data showing diel patterns in vertical movements. Time series data showing (A) the temperature and depth data for a representative day for shark C when offshore with the inset showing the temperature profile, and (B) all depth data for shark C over the final 2 months. The darker gray indicates local nighttime and the light gray the range of time for sunrise and sunset over the period the data were obtained.
SST, Temperature Change, and Depth
While there was a high degree of variability in the vertical movements, one pattern that held across locations was the relationship between the SST and the temperature range (dT) experienced on a given day (dT = SST-min temperature). For all sharks, regression analyses showed a significant increase in dT with SST (Figure 7) including when near- and offshore regions were separated. An exception to this occurred at the end of the record for shark D when SST was >20°C and the minimum temperature increased. In comparison, regression analyses of maximum depth and SST showed mixed results and R2 were lower than for SST and dT (0.04–0.34 vs. 0.64–0.87). Nearshore there was only a significant increase in the maximum depth with SST for shark A (Figure 3). Offshore max depth increased with SST for shark C and decreased with SST for shark D.
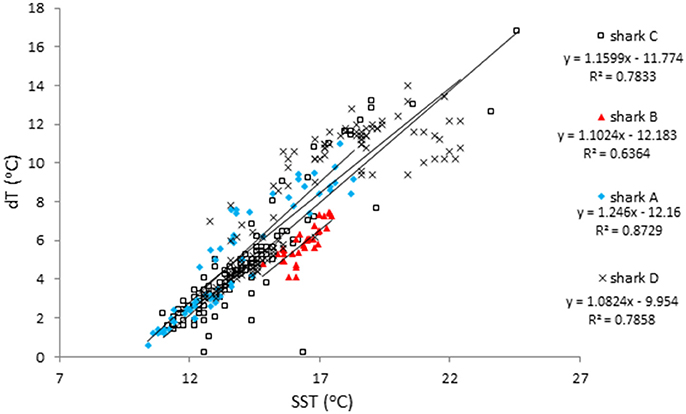
Figure 7. Temperature difference as a function of Sea Surface Temperature (SST). The temperature difference between SST and the minimum daily temperature (dT) plotted as a function of SST for all data (near and offshore) for the 4 sharks. The small number of values for shark C above SST = 20°C reflects the limited data on SST while offshore. The equation describing all points is dT = 1.1197*SST – 10.942.
Movements Relative to Sound-Scattering Layers
During the final 2 months of its deployment, shark C traveled into an area where research surveys had mapped the sound-scattering layer associated with vertically migrating mesopelagic organisms (Figure 8). The shark's nighttime depths correspond with a thin layer of organisms at the bottom of the shallow scattering layer at ~250–300 m. During the day the depths correspond again to this same thin layer which migrated to its daytime depth at the top of the deep scattering layer at ~450–470 m depth. However, the shark ascended to nighttime depths in advance of the upward migration of the sound-scattering layer. The acoustic signature of this area is consistent with those of smaller crustaceans and gelatinous zooplankton, as well as small fish.
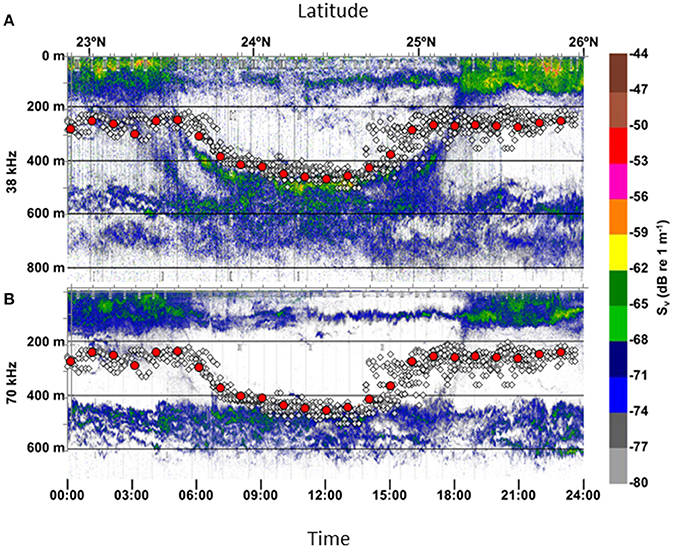
Figure 8. Vertical movements laid over acoustic back scatter data. All depth (white circles) and average hourly depth (red circles) over the last 2 months of the track for shark C. Depth data are plotted over acoustic back scatter results at (A) 38 kHz and (B) 70 kHz.
Discussion
This study reports on the first electronic tags deployed on basking sharks in the ENP. Results complement existing sightings and fisheries databases with the advantage of providing information on offshore movements where data are sparse. Overall, results reveal that sharks occupy convergence zones in nearshore habitat in the summer and fall and then disperse offshore. Offshore, vertical habitat expands into deeper waters and movements are linked to a specific portion of the sound-scattering layer. Both near and offshore, vertical habitat was highly variably and likely linked to both vertical and geographic patterns in prey availability as well as regional oceanography.
Geographic Movements and Essential Habitat
Movements and residency patterns over short and medium time frames (days to months) provide insight into essential habitat, which has become a cornerstone of fisheries management (Rosenberg et al., 2000). Of particular interest is where animals choose to spend protracted periods of time as these are presumed to be associated with key ecological needs, typically foraging. A considerable amount of effort has been put into characterizing these areas of residency from animal tracks using a range of approaches including state-space models (Jonsen et al., 2007), first passage time (McKenzie et al., 2009), and fractal analyses (Tremblay et al., 2007). While no modeling was conducted in the present study given the small sample size, examination of the tracks revealed that basking sharks spent up to 12 weeks in specific areas over the continental shelf and slope including San Diego, Point Conception, and the Monterey Bay region. Previous studies in the ENP showed similar residency periods. Baduini (1995) and Darling and Keogh (1994) reported that individual basking sharks spent up to 30 or 42 days in Monterey Bay, CA, or Clayoquot Sound, Vancouver Island, Canada, respectively. Similar short-term residence times have been reported for basking sharks in coastal regions in the Atlantic Ocean (Sims et al., 2003; Gore et al., 2008; Sims, 2008; Skomal et al., 2009; Curtis et al., 2014; Doherty et al., 2017; Braun et al., 2018). Across locations, the continental shelf and slope are important habitat for basking sharks, especially during the summer months.
As mentioned, residency patterns along the coast are likely linked to the availability of forage. While filter feeding cannot be documented using satellite tags, some foraging data for basking sharks are available for the ENP. Both off CA and Canada basking shark occurrence was linked to higher zooplankton densities (Darling and Keogh, 1994; Baduini, 1995). Similar to in other areas, the preferred prey of basking sharks off CA is thought to be calanoid copepods, specifically Calanus pacificus, (Baduini, 1995). C. pacificus developmental stages (C) IV and V contain a large lipid droplet and are energetically dense. The CIV and CV stage of C. finmarchicus are targeted by basking sharks in the western North Atlantic (Baduini, 1995; Siders et al., 2013; Curtis et al., 2014). Off CA the CIV and CV stages occur year around but are most abundant in surface waters from April through October (Johnson and Checkley, 2004), although high concentrations of CV can also be found at depth during periods of diapause (see below).
As with other filter feeders, ideal foraging habitat in coastal waters require mechanisms that concentrate prey (Sims and Quayle, 1998; Sims et al., 2003; Croll et al., 2005; Dewar et al., 2008; Hazen et al., 2013; Scales et al., 2014; Miller et al., 2015). As a result, foraging habitat will depend on physical factors that may include tidal cycles, internal waves, variability in ocean currents, mesoscale features such as fronts and eddies, and bathymetry. Overall, the California Current is a critical habitat for a range of predators across trophic levels (Block et al., 2011). For basking sharks in particular, there are a number of regions in the California Current that have specific forcing mechanisms to concentrate prey. Mesoscale eddies just south of Point Conception have been associated with hot spots for a number of seabird species (Yen et al., 2006). In the Santa Barbara Channel the deep bathymetry and associated hydrography leads to an incredibly dense aggregation of diapaus copepods (13,000 g wet weight (ww) m−3) from 450 to 500 meters in the spring and summer (Alldredge et al., 1984; Osgood and Checkley, 1997; Ohman et al., 1998). These levels are orders of magnitude higher than the estimated threshold density for foraging ~0.6 g ww m−3 in basking sharks (Sims, 1999; Sims et al., 2006). While it is not known if basking sharks take advantage of these dense concentrations, which occur at very low oxygen concentrations (~0.2 ml L−1), it is clear that they are drawn to this region. Finally, the combination of regional upwelling and the topography of the Monterey Canyon leads to dense concentrations of forage in Monterey Bay (Croll et al., 2005). This area is a hotspot for animals that count on forcing mechanisms to aggregate prey including leatherback sea turtles and filter feeding whales (Croll et al., 2005; Block et al., 2011). Interestingly, the region where shark D spent 12 weeks overlapped with satellite-tagged leatherback sea turtles (Benson, pers. comm.) that left the area around the same time as the basking shark. Any effort to define the essential habitat of basking sharks along the West Coast of North America will need to be dynamic in nature and factor in physical forcing.
When away from shore, essential habitat is more difficult to identify, especially based on surface features. Sharks spent considerable periods below the surface and vertical habitat use was variable. If the offshore migrations of females are associated with pupping as speculated for Atlantic basking sharks (Skomal et al., 2009; Braun et al., 2018), the habitat may be related to the needs of the pups rather than the adult which is a further complication for identifying essential habitat.
In addition to foraging, another key element commonly used to characterize essential habitat across species is SST. For a complete understanding of the preferred SST range, measurements are needed across seasons. Similar to the findings in this study, basking sharks are reported over a broad range of SST. Lien and Fawcett (1986) report the highest catch rates when SST was 8–12°C, whereas Owen (1984) reported their occurrence at SSTs up to 24°C. Basking sharks clearly spend time in areas with even higher SST, but primarily occupy deep cooler water in these regions (Skomal et al., 2009; Braun et al., 2018; this study). While their deep-water occurrence and the broad thermal range make identifying preferred SSTs challenging, SST has been shown to be an important predictor of basking shark abundance (Schwartz, 2002; Skomal et al., 2004; Cotton et al., 2005). Cotton et al. (2005) found that basking sharks occurred between SST ~12 and 15°C and the number of basking sharks was strongly correlated with SST but only weakly correlated with copepod density. While it may not be possible to extrapolate globally, SST may provide a useful regional guide to patterns in basking shark abundance and distribution.
Movements over periods from weeks to months also provide insight into seasonal migrations. Considering all locations, sharks were off southern CA in the spring and early summer (May–June) and moved north as temperatures warmed. In the summer (July–September) they were either around Point Conception or Central CA. Both sharks with longer tracks left their summer foraging grounds in either the middle of summer or fall. In the fall and winter they were offshore but were 3,260 km apart in late January. North-South seasonal movements are also reported for sharks in both the East and West Atlantic (Sims et al., 2003; Cotton et al., 2005; Skomal et al., 2009; Doherty et al., 2017; Braun et al., 2018). Movements in the West Atlantic Ocean, however, are more extensive than in the East and sharks crossed the equator, moving as far south as Brazil. Shifting between coastal habitat in the summer and fall to offshore waters in the winter and spring is observed across a range of species (Block et al., 2011; Campana et al., 2011; Dewar et al., 2011). More long-term tracks are needed to determine the links between near- and offshore winter grounds, potential sex linked differences in migration, and if and when individuals return to the CA coast. Some fidelity to summer foraging grounds has been documented in other studies (Sims et al., 2000; Hoogenboom et al., 2015; Braun et al., 2018).
A comparison of recent and historic records for the ENP indicates similarities and differences in seasonal and spatial patterns. Similar to previous reports, the regions around Point Conception, Morro Bay, and Monterey Bay appear to still be important habitat (Squire, 1990; Baduini, 1995). Differences are apparent in seasonal patterns. While basking sharks were documented off CA throughout the year, from 1962 to 1985 the peak in abundance was from October through March (Squire, 1990). In the current study all public sightings and tagging events were in the spring and summer (NMFS unpublished data). This is consistent with the more recent data provided by Baduini (1995) who, in the early 1990s, saw some sharks throughout the year but reported peaks in May and August. Based on available data, it appears that in recent decades the coastal waters off CA provide important summer and fall foraging grounds with no reports in winter months.
Another apparent change in the ENP is the drop in observations on the historically important summer foraging grounds off Canada. Since the work of Darling and Keogh (1994) from 1973 to 1992 when 27 individuals were identified, very few animals have been observed off Canada or off the Pacific Northwest (McFarlane et al., 2009; DFO, unpublished data). While a detailed examination of all potential variables is beyond the scope of this paper, there is some evidence of a shift in productivity off Pacific Canada around 1989 (Hare and Mantua, 2000; McFarlane et al., 2000). McFarlane et al. (2000), using a composite index, identified a shift in climate ocean conditions that resulted in a decrease in productivity in a range of fish species. Inter-annual regional shifts in the abundance of basking sharks off the U.K. have been linked to zooplankton abundance (Sims and Quayle, 1998; Sims and Reid, 2002; Doherty et al., 2017). The reduced sightings could also be a function of the natural variability or a decline in the population in the ENP (Squire, 1990; Darling and Keogh, 1994; McFarlane et al., 2009).
Vertical Movements
Similar to other areas and consistent with their name, basking sharks spent the majority of their time in the upper portions of the water column in nearshore waters. Coastal surface waters, especially in eastern boundary currents, are highly productive and mesoscale features that concentrate prey are common (Barber and Smith, 1981; Pauly and Christensen, 1995; Hazen et al., 2013; Scales et al., 2014). While surface waters were clearly important, there was a high degree variability in vertical habitat. Off the U.K., in regions with little thermal stratification, considerable surface feeding was apparent whereas when waters were thermally stratified, sharks dove deeper and spent less time at the surface (Sims et al., 2003, 2005). Vertical movements for shark A reflect a similar pattern, with higher thermal stratification associated with deeper dives. Filter feeding whale sharks also show a high diversity in vertical activity and habitat use (Gleiss et al., 2013). This likely reflects differences in prey availability with depth although more information on prey distribution is needed.
Vertical habitat use offshore also varied. One explanation for the difference between sharks C and D may be the shoaling of the oxygen minimum zone along the Baja Peninsula, Mexico. Low oxygen has been shown to constrain the vertical movements of a number of pelagic fish species (Carey and Robison, 1981; Brill, 1994; Prince and Goodyear, 2006; Nasby-Lucas et al., 2009). Differences may also be linked to behavioral thermoregulation with shark C staying deep to avoid warm surface waters, which has also been observed in other pelagic fish (Musyl et al., 2004; Weng et al., 2005; Teo et al., 2007). The SST in the area northeast of Hawaii was near the maximum SST of 24°C reported by Owen (Owen, 1984; see below). As in the nearshore, offshore habitat use is likely influenced by both oceanography and prey availability.
Similar to other diel migrators, shark C is likely targeting organisms associated with the sound-scattering layer (Carey and Robison, 1981; Musyl et al., 2004; Dewar et al., 2011). Based on the acoustic backscatter data, the basking shark appeared to be following the same portion of the sound-scattering layer as it vertically migrated (Figure 8). Unfortunately, which taxa they were targeting is not known. While copepods are thought to be the preferred prey (Baduini, 1995; Sims and Reid, 2002; Siders et al., 2013; Curtis et al., 2014), stomach contents from basking sharks foraging in deep waters in the Northwest Pacific Oceans included small crustaceans of up to 5.4 cm (Mutoh and Omori, 1978). One factor that suggests the basking shark was targeting copepods is the early ascent prior to dusk, which is unusual for pelagic fish that target the sound-scattering layer (Carey and Robison, 1981; Carey and Scharold, 1990; Musyl et al., 2004; Dewar et al., 2011). The copepod, C. pacificus, has been observed to begin their ascent one to two h before sunset (Enright and Honegger, 1977) depending on environmental conditions. Another potential reason for the shark's early ascent includes behavioral thermoregulation. Given the up to 10°C increase in temperature (Figure 6), digestion could be increased by two-fold using a standard Q10 temperature coefficient of two. It is not likely linked to hypoxia as oxygen levels off Hawaii are not depleted at these depths. Additional studies including stable isotopes should help resolve offshore foraging habits. Regardless, results suggest a direct link between basking shark vertical movements and a specific portion of the sound-scattering layer.
A pattern apparent both near- and offshore was the consistent relationship between SST and dT. The overall implication is that as SST increases the sharks' vertical niche expands depending on water column characteristics, and opportunities to forage at depth increase. To determine the driving mechanism behind this pattern, a broader comparison examining behaviors, prey availability, bathymetry and water column characteristics across regions is needed (Dewar et al., 2011). While the underlying mechanism is not clear, the ability to predict dT from SST is useful for predicting vertical habitat use and could be used to inform regional vulnerability to fishing gear.
Insight Into Tagging Methods
Results also inform electronic tag selection and deployment for basking sharks. While our sample size is too small to be definitive, the spear-point and metal dart provided long-term deployments whereas the PM dart did not. The lack of uplinks and low number of GPS locations indicate that a less expensive PSAT would provide a similar dataset possibly over longer durations (Skomal et al., 2009; Braun et al., 2018).
Conservation and Management Implications
As mentioned above, the basking shark population in the ENP is considered to be at a historic low even though targeted removals in the U.S. and Canada ended more than 40 years ago (Phillips, 1948; Darling and Keogh, 1994; COSEWIC, 2007; McFarlane et al., 2009). The decline in the population is likely linked to basking sharks' low intrinsic population growth rates (Compagno, 1984; Squire, 1990; Smith et al., 1998, 2008; McFarlane et al., 2009) that may be compounded by allee effects that act to reduce population growth rates at very low population sizes (Gilpin and Soule, 1986; Dennis, 1989). Another factor to consider is fisheries mortality, both targeted and incidental. However, to accurately determine population status and assess sources of mortality, directed study is required.
There are a number of potential sources of mortality. Given nearshore foraging behaviors, basking sharks are prone to ship strikes and becoming entangled in fishing gear (Darling and Keogh, 1994; COSEWIC, 2007; Larese and Coan, 2008; McFarlane et al., 2009). Off the U.S. West Coast, the majority of bycatch occurred in the large-mesh, drift-gillnet fishery with most takes occurring in the 1980's (Larese and Coan, 2008). Since that time, regulatory mandates including time-area closures and gear modifications to protect sea turtles and marine mammals (Larese and Coan, 2008) likely also protected basking sharks. Off Mexico, while commercial drift gillnet gear is currently prohibited, basking sharks have been taken by artisanal fishers, (Sandoval-Castillo and Ramirez-Gonzalez, 2008) although interactions are rare (Sosa-Nishizaki, pers. comm.). Off Canada, encounters are now also rare and only three sharks have been taken incidentally in the ground-fish trawl fishery since 1996 (COSEWIC, 2007; McFarlane et al., 2009). Observed bycatch in the U.S., Mexico and Canada, at least over the last 20–30 years, has been low.
Of greater concern is the potential for basking sharks to be taken outside the EEZs of the U.S., Mexico and Canada. Given their potential for large-scale movements (this study, Gore et al., 2008; Skomal et al., 2009; Braun et al., 2018), it is likely that the range of basking sharks in the ENP extends into the Central Pacific Ocean and possibly into the Northwest Pacific. A harpoon fishery operated off Japan from the 1700's until 1980 when sightings declined to only a few per year (CITES, 2002). They may also be vulnerable in the Central Pacific, although their propensity to remain deep may provide some protection. Incidental take in the high-seas, large-mesh, driftnet fisheries that operated in the Central North Pacific Ocean from the 1980's until 1994 was estimated at 54 per year (Bonfil, 1994). While the origin is not known, it is clear that undocumented basking shark take continues. The number of marketed fins is more than the number of sharks accounted for in CITES trade documents (Magnussen et al., 2007). One fin can have a value of over 50,000 $US providing a strong incentive for targeting or retaining basking sharks.
While some populations in the Atlantic may be recovering (Witt et al., 2012), this does not appear to be the case in the North Pacific (Squire, 1990; Darling and Keogh, 1994; COSEWIC, 2007; McFarlane et al., 2009). The listing of basking sharks by numerous national and international bodies indicates a broad concern for the species regionally and globally. Given the high price for basking shark fins, efforts should focus on reducing demand, enforcing existing regulations, better documenting trade, and reducing mortality.
Author Contributions
HD, SW, JH, OS, SK contributed to the conception, design and implementation of the study; HD wrote the first draft of the manuscript; AL, CL, RD, SB wrote sections of the manuscript; JW, RD, and AL performed analyses for different section; SV contributed to the design and implementation of the study. All authors contributed to manuscript revision, read and approved the submitted version.
Conflict of Interest Statement
The authors declare that the research was conducted in the absence of any commercial or financial relationships that could be construed as a potential conflict of interest.
Acknowledgments
We thank the members of the public and the recreational fishers for their reports that lead to tag deployments including BDoutdoors.com. The NOAA Species of Concern Program provided funding to purchase the tags and for tag deployments. We also thank our U.S., Mexican and Canadian colleagues for their efforts on the ENP Tri-National Basking Shark Working Group.
Supplementary Material
The Supplementary Material for this article can be found online at: https://www.frontiersin.org/articles/10.3389/fmars.2018.00163/full#supplementary-material
Supplemental Figure 1. Thermal profiles. Thermal profiles obtained from the PDT data collected during periods when shark A made dives that were shallower (June 21–23, gray diamonds) and deeper (July 9–10, black squares). Note, shark A remained near the coast throughout its deployment.
Supplemental Figure 2. Depth histograms. Depth histograms from (A) shark C and (B) shark D. Data are aggregated by month and indicated by shading (6 = June, 7 = July, etc…).
References
Alldredge, A. L., Robison, B. H., Fleminger, A., Torres, J. J., King, J. M., and Hamner, W. M. (1984). Direct sampling and in situ observation of a persistent copepod aggregation in the mesopelagic zone of the Santa Barbara Basin. Mar. Biol. 80, 75–81. doi: 10.1007/BF00393130
Baduini, C. L. (1995). Feeding Ecology of the Basking Shark (Cetorhinus maximus) Relative to Distribution and Abundance of Prey. Masters thesis, Moss Landing Marine Laboratories, San Jose State University. Available online at: http://islandora.mlml.calstate.edu/islandora/object/islandora%3A1748
Barber, R. T., and Smith, R. L. (1981). “Coastal upwelling ecosystems,” in Analysis of Marine Ecosystems, ed A.R. Longhurst (New York, NY: Academic Press), 31–68.
Block, B. A., Dewar, H., Farwell, C., and Prince, E. D. (1998). A new satellite technology for tracking the movements of Atlantic bluefin tuna. Proc. Natl. Acad. Sci. U.S.A. 95, 9384–9389.
Block, B. A., Jonsen, I. D., Jorgensen, S. J., Winship, A. J., Shaffer, S. A., Bograd, S. J., et al. (2011). Tracking apex marine predator movements in a dynamic ocean. Nature 475:86. doi: 10.1038/nature10082
Bonfil, R. (1994). Overview of World Elasmobranch Fisheries. FAO Fisheries Technical Paper 341. Rome: FAO. Available online at: http://www.fao.org/DOCREP/003/V3210E/V3210E00.HTM
Bradshaw, C. J., Fitzpatrick, B. M., Steinberg, C. C., Brook, B. W., and Meekan, M. G. (2008). Decline in whale shark size and abundance at Ningaloo Reef over the past decade: the world's largest fish is getting smaller. Biol. Cons. 141, 1894–1905. doi: 10.1016/j.biocon.2008.05.007
Braun, C., Skomal, G., and Thorrold, S. (2018). Integrating archival tag data and a high-resolution oceanographic model to estimate basking shark (Cetorhinus maximus) movements in the western Atlantic. Front. Mar. Sci. 5:25. doi: 10.3389/fmars.2018.00025
Brill, R. W. (1994). A review of temperature and oxygen toler-ance studies of tunas pertinent to fisheries oceanography, movement models and stock assessments. Fish. Oceanogr. 3, 204–216.
Campana, S. E., Dorey, A., Fowler, M., Joyce, W., Wang, Z., Wright, D., et al. (2011). Migration pathways, behavioural thermoregulation and overwintering grounds of blue sharks in the Northwest Atlantic. PLoS ONE 6:e16854. doi: 10.1371/journal.pone.0016854
Carey, F. G., and Robison, B. H. (1981). Daily patterns in the daily activity patterns of swordfish, Xiphias gladius, observed by acoustic telemetry. U.S. Fish. Bull. 79, 277–291.
Carey, F. G., and Scharold, J. V. (1990). Movements of blue sharks (Prionace glauca) in depth and course. Mar. Biol. 106, 329–342.
Carretta, J. V., Forney, K. A., Lowry, M. S., Barlow, J., Baker, J., Johnston, D., et al. (2009). US Pacific Marine Mammal Stock Assessments. NOAA-TM-NMFS-SWFSC-113.
CITES (2002). Consideration of proposals for amendment of Appendices I and II. Proposal: inclusion of Basking Shark (Cetorhinus maximus) on Appendix II of CITES. Prop. 12.36.
Compagno, L. J. V. (1984). FAO Species Catalogue. Sharks of the World. An Annotated and Illustrated Catalogue of Shark Species Known to Date. I. Hexanchiformes to Lamniformes, Vol. 4. Rome, Italy: FAO Fisheries Synopsis 249. Available online at: ftp://ftp.fao.org/docrep/fao/009/ad122e/ad122e00.pdf.
COSEWIC (2007). Assessment and Status Report on the Basking Shark (Cetorhinus Maximus) Pacific population in Canada. Committee on the Status of Endangered Wildlife in Canada. Vii + 34 p.
Cotton, P. A., Sims, D. W., Fanshawe, S., and Chadwick, M. (2005). The effects of climate variability on zooplankton and basking shark (Cetorhinus maximus) relative abundance off southwest Britain. Fish. Oceanogr. 14, 151–155. doi: 10.1111/j.1365-2419.2005.00331.x
Croll, D. A., Dewar, H., Dulvy, N. K., Fernando, D., Francis, M. P., Galván-Magaña, F., et al. (2016). Vulnerabilities and fisheries impacts: the uncertain future of manta and devil rays. Aquat. Conserv. Mar. Freshwater Ecosys. 26, 562–575. doi: 10.1002/aqc.2591
Croll, D. A., Marinovic, B., Benson, S., Chavez, F. P., Black, N., Ternullo, R., et al. (2005). From wind to whales: trophic links in a coastal upwelling system. Mar. Ecol. Prog. Ser. 289, 117–130. doi: 10.3354/meps289117
Curtis, T. H., Zeeman, S. I., Summers, E. L., Cadrin, S. X., and Skomal, G. B. (2014). Eyes in the sky: linking satellite oceanography and biotelemetry to explore habitat selection by basking sharks. Animal Biotelem. 2:12. doi: 10.1186/2050-3385-2-12
Darling, J. D., and Keogh, K. (1994). Observations of basking sharks, Cetorhinus maximus, in Clayoquot Sound, British Columbia. Can. Field Nat. 108, 199–210.
Demer, D. A., Berger, L., Bernasconi, M., Bethke, E., Bowell, K., Chu, D., et al. (2015). Calibration of acoustic instruments. ICES Coop. Res. Rep. 326:133.
Dennis, B. (1989). Allee effects: population growth, critical density, and the chance of extinction. Nat. Resour. Model. 3, 481–538.
Dewar, H., Mous, P., Domeier, M., Muljadi, A., Pet, J., and Whitty, J. (2008). Movements and site fidelity of the giant manta ray, Manta birostris, in the Komodo Marine Park, Indonesia. Mar. Biol. 155, 121–133. doi: 10.1007/s00227-008-0988-x
Dewar, H., Prince, E. D., Musyl, M. K., Brill, R. W., Sepulveda, C., Luo, J., et al. (2011). Movements and behaviors of swordfish in the Atlantic and Pacific Oceans examined using popup satellite archival tags. Fish. Oceanogr. 20, 219–241. doi: 10.1111/j.1365-2419.2011.00581.x
Doherty, P. D., Baxter, J. M., Gell, F. R., Godley, B. J., Graham, R. T., Hall, G., et al. (2017). Long-term satellite tracking reveals variable seasonal migration strategies of basking sharks in the north-east Atlantic. Sci. Rep. 7:42837. doi: 10.1038/srep42837
Dulvy, N. K., Baum, J. K., Clarke, S., Compagno, L. J., Cortés, E., Domingo, A., et al. (2008). You can swim but you can't hide: the global status and conservation of oceanic pelagic sharks and rays. Aquat. Conserv. Mar. Freshwater Ecosys. 18, 459–482. doi: 10.1002/aqc.975
Ebert, D. A. (2003). The Sharks, Rays and Chimaeras of California. Berkeley; Los Angeles; London, UK: University California Press.
Enright, J. T., and Honegger, H. W. (1977). Diurnal vertical migration: adaptive significance and timing. Part 2. Test of the model: details of timing. Limnol. Oceanogr. 22, 873–886.
Fowler, S. L. (2005). “Cetorhinus maximus (North Pacific subpopulation),” in IUCN 2009. IUCN Red List of Threatened Species. Version 2009.2. (www.iucnredlist.org). Available online at: http://www.iucnredlist.org/apps/redlist/details/39545/0.
Galuardi, B., Royer, F., Golet, W., Logan, J., Neilson, J., and Lutcavage, M. (2010). Complex migration routes of Atlantic bluefin tuna (Thunnus thynnus) question current population structure paradigm. Can. J. Fish. Aquat. Sci. 67, 966–976. doi: 10.1139/F10-033
Gilpin, M. E., and Soule, M. E. (1986). “Minimum viable populations: processes of extinction,” in Conservation Biology: The Science of Scarcity and Diversity, ed M. E. Soule (Sunderland, MA: Sinauer), 19–34.
Gleiss, A. C., Wright, S., Liebsch, N., Wilson, R. P., and Norman, B. (2013). Contrasting diel patterns in vertical movement and locomotor activity of whale sharks at Ningaloo Reef. Mar. Biol. 160, 2981–2992. doi: 10.1007/s00227-013-2288-3
Gore, M. A., Rowat, D., Hall, J., Gell, F. R., and Ormond, R. F. (2008). Trans-Atlantic migration and deep mid-ocean diving by basking shark. Biol. Lett. 23, 395–398. doi: 10.1098/rsbl.2008.0147
Hare, S. R., and Mantua, N. J. (2000). Empirical evidence for North Pacific regime shifts in 1977 and 1989. Prog. Oceanogr. 47, 103–145. doi: 10.1016/S0079-6611(00)00033-1
Hazen, E. L., Suryan, R. M., Santora, J. A., Bograd, S. J., Watanuki, Y., and Wilson, R. P. (2013). Scales and mechanisms of marine hotspot formation. Mar. Ecol. Prog. Ser. 487, 177–183. doi: 10.3354/meps10477
Hoelzel, A. R., Shivji, M. S., Magnussen, J., and Francis, M. P. (2006). Low worldwide genetic diversity in the basking shark (Cetorhinus maximus). Biol. Lett. 2, 639–642. doi: 10.1098/rsbl.2006.0513
Hoogenboom, J. L., Wong, S. N., Ronconi, R. A., Koopman, H. N., Murison, L. D., and Westgate, A. J. (2015). Environmental predictors and temporal patterns of basking shark (Cetorhinus maximus) occurrence in the lower Bay of Fundy, Canada. J. Exp. Mar. Biol. Ecol. 465, 24–32. doi: 10.1016/j.jembe.2015.01.005
Hoolihan, J. P., Luo, J., Abascal, F. J., Campana, S. E., De Metrio, G., Dewar, H., et al. (2011). Evaluating post-release behaviour modification in large pelagic fish deployed with pop-up satellite archival tags. ICES J. Mar. Sci. 68, 880–889. doi: 10.1093/icesjms/fsr024
ISC (2016). 2016 Pacific Bluefin Tuna Stock Assessment. Annex 9 In Report of the Sixteenth Plenary of the International Scientific Committee for Tuna and Tuna-Like Species in the North Pacific Ocean. 13-18 July 2016 Sapporo, Hokkaido, Japan. Available online at: http://isc.fra.go.jp/pdf/ISC16/ISC16_Annex_09_2016%20Pacific%20Bluefin%20Tuna%20Stock%20Assessment.pdf
IUCN (2007). IUCN Red List of Threatened Species. Available online at: www.iucnredlist.org.
IWC (1998). International Whaling Commission. Report of the Scientific Committee. Rep. Int. Whale Comm. 48, 53–118.
Johnson, C. L., and Checkley, D. M. (2004). Vertical distribution of diapausing Calanus pacificus (Copepoda) and implications for transport in the California undercurrent. Prog. Oceanogr. 62, 1–13. doi: 10.1016/j.pocean.2004.08.001
Jonsen, I. D., Myers, R. A., and James, M. C. (2007). Identifying leatherback turtle foraging behaviour from satellite telemetry using a switching state-space model. Mar. Ecol. Prog. Ser. 337, 255–264. doi: 10.3354/meps337255
Jordan, D. S. (1887). “Coast of California,” in The Whale Fishery. U.S. Commercial Fish and Fisheries, Fisheries and Fishery Industries of the United States, Sec. V, Vol. 2, 52–61. Available online at: www.mysticseaport.org.
Lam, C. H., Nielsen, A., and Sibert, J. R. (2010). Incorporating sea-surface temperature to the light-based geolocation model TrackIt. Mar. Ecol. Prog. Ser. 419, 71–84. doi: 10.3354/meps08862
Larese, J. P., and Coan, A. L. (2008). Fish and invertebrate bycatch estimates for the California drift gillnet fishery targeting swordfish and thresher sharks 1990-2006. NOAA Technical Memorandum. NOAA-TM-NMFS-SWFSC-426. 57 p. Available online at: http://swfsc.noaa.gov/publications/TM/SWFSC/NOAA-TM-NMFS-SWFSC-426.PDF
Lewison, R. L., Crowder, L. B., Read, A. J., and Freeman, S. A. (2004). Understanding impacts of fisheries bycatch on marine megafauna. Trends Ecol. Evol. 19, 598–604. doi: 10.1016/j.tree.2004.09.004
Lien, J., and Fawcett, L. (1986). Distribution of basking sharks Cetorhinus maximus incidentally caught in inshore fishing gear in Newfoundland. Can. Field Nat. 100, 246–252.
Locarnini, R. A., Mishonov, A. V., Antonov, J. I., Boyer, T. P., Garcia, H. E., Baranova, O. K., et al. (2010). World Ocean Atlas 2009, Vol 1, Temperature. Washington, DC: U.S. Government Printing Office. NOAA Atlas NESDIS 68, 184 pp.
Mac Lennan, D. N., Fernandes, P. G., and Dalen, J. (2002). A consistent approach to definitions and symbols in fisheries acoustics, ICES J. Mar. Sci. 59, 365–369. doi: 10.1006/jmsc.2001.1158
Magnussen, J. E., Pikitch, E. K., Clarke, S. C., Nicholson, C., Hoelzel, A. R., and Shivji, M. S. (2007). Genetic tracking of basking shark products in international trade. Animal Conservation 10, 199–207. doi: 10.1111/j.1469-1795.2006.00088.x
Marshall, A., Ishihara, H., Dudley, S. F. J., Clark, T. B., Jorgensen, S., Smith, W. D., et al. (2006). “Manta birostris,” in IUCN 2006. 2006 IUCN Red List of Threatened Species. Available online at: http://www.iucnredlist.org
McFarlane, G. A., King, J. R., and Beamish, R. J. (2000). Have there been recent changes in climate? Ask the fish. Prog. Oceanogr. 47, 147–169. doi: 10.1016/S0079-6611(00)00034-3
McFarlane, G., King, J., Leask, K., and Christensen, L. B. (2009). Assessment of information used to develop a Recovery Potential Assessment for basking shark Cetorhinus maximus (Pacific Population) in Canada. DFO Canadian Science Advisory Secretariat Research Document. 2008/071. vi + 98 p.
McKenzie, H. W., Lewis, M. A., and Merrill, E. H. (2009). First passage time analysis of animal movement and insights into the functional response. Bull. Mathematical Biol. 71, 107–129. doi: 10.1007/s11538-008-9354-x
McKinnell, S., and Seki, M. P (1998). Shark bycatch in the Japanese high seas squid driftnet fishery in the North Pacific. Ocean Fish. Res. 39, 127–138. doi: 10.1016/S0165-7836(98)00179-9
Miller, P. I., Scales, K. L., Ingram, S. N., Southall, E. J., and Sims, D. W (2015). Basking sharks and oceanographic fronts: quantifying associations in the north-east Atlantic. Funct. Ecol. 29, 1099–1109. doi: 10.1111/1365-2435.12423
Musyl, M. K., McNaughton, L. M., Swimmer, J. Y., and Brill, R. W. (2004). Convergent evolution of vertical movement behavior in swordfish, bigeye tuna, and bigeye thresher sharks. Pelagic Fish. Res. Prog. Newsl. 9, 1–4.
Mutoh, M., and Omori, M. (1978). Two records of patchy occurrences of the oceanic shrimp Sergestes similis Hansen off the east coast of Honshu, Japan. J. Oceanogr. 34, 36–38. doi: 10.1007/BF02109614
Nasby-Lucas, N., Dewar, H., Lam, C. H., Goldman, K. J., and Domeier, M. L. (2009). White shark offshore habitat: a behavioral and environmental characterization of the eastern Pacific shared offshore foraging area. PLoS ONE 4:e8163. doi: 10.1371/journal.pone.0008163
Nielsen, A., and Sibert, J. R. (2007). State-space model for light-based tracking of marine animals. Can. J. Fish. Aquat. Sci. 64, 1055–1068. doi: 10.1139/f07-064
NOAA (2004). U.S. Federal Register, Volume 69, No. 73. Notice: Endangered and threatened species: Establishment of Species of Concern List, addition of species to Species of Concern list, description of factors for identifying Species of Concern, and revision of Candidate Species list under the Endangered Species Act. Pages 19975 to 19979.
NOAA (2010). Available online at: http://www.nmfs.noaa.gov/pr/pdfs/species/baskingshark_detailed.pdf
Ohman, M. D., Drits, A. V., Clarke, M. E., and Plourde, S. (1998). Differential dormancy of co-occurring copepods. Deep Sea Res. Part II 45, 1709–1740. doi: 10.1016/S0967-0645(98)80014-3
Osgood, K. E., and Checkley, D. M. (1997). Seasonal variations in a deep aggregation of Calanus pacificus in the Santa Barbara Basin. Mar. Ecol. Prog. Ser. 148, 59–69.
Owen, R. E. (1984). Distribution and Ecology of the Basking Shark Cetorhinus maximus (Gunnerus 1765). MSc thesis, University of Rhode Island, Kingston, RI, USA.
Pauly, D., and Christensen, V. (1995). Primary production required to sustain global fisheries. Nature 374, 255–257. doi: 10.1038/374255a0
Priede, I. G. (1984). A basking shark (Cetorhinus maximus) tracked by satellite together with simultaneous remote sensing. Fish. Res. 2, 201–216.
Prince, E. D., and Goodyear, C. P. (2006). Hypoxia-based habitat compression of tropical pelagic fishes. Fish. Oceanogr. 15, 451–464 doi: 10.1111/j.1365-2419.2005.00393.x
Rosenberg, A., Bigford, T. E., Leathery, S., Hill, R. L., and Bickers, K. (2000). Ecosystem approaches to fishery management through essential fish habitat. Bull. Mar. Sci. 66, 535–542.
Sandoval-Castillo, J., Ramirez-Gonzalez, J., and Villavicencio-Garayzar, C. (2008). First record of basking shark (Cetorhinus maximus) in Mexico? Mar. Biodivers. Rec. 1:e19. doi: 10.1017/S1755267206001874
Scales, K. L., Miller, P. I., Embling, C. B., Ingram, S. N., Pirotta, E., and Votier, S. C. (2014). Mesoscale fronts as foraging habitats: composite front mapping reveals oceanographic drivers of habitat use for a pelagic seabird. J. R. Soc. Interface 11:20140679. doi: 10.1098/rsif.2014.0679
Schwartz, F. J. (2002). Basking sharks, Cetorhinus maximus, family Cetorhinidae, recorded in North Carolina waters 1901–2002. J. N. Carolina Acad. Sci. 118, 201–205.
Siders, Z. A., Westgate, A. J., Johnston, D. W., Murison, L. D., and Koopman, H. N. (2013). Seasonal variation in the spatial distribution of basking sharks (Cetorhinus maximus). in the lower Bay of Fundy, Canada. PLoS ONE 8:e82074. doi: 10.1371/journal.pone.0082074
Sims, D., and Quayle, V. A (1998). Selective foraging behaviour of basking sharks on zooplankton in a small-scale front. Nature 393, 460–464.
Sims, D. W. (1999). Thoureshold foraging behaviour of basking sharks on zooplankton: life on an energetic knife-edge? Proc. R. Soc. London Ser. B Biol. Sci. 266, 1437–1443.
Sims, D. W. (2008). Sieving a living: a review of the biology, ecology and conservation, status of the plankton-feeding basking Shark, Cetorhinus maximus. Adv. Mar. Biol. 54, 171–220. doi: 10.1016/S0065-2881(08)00003-5
Sims, D. W., and Reid, P. C. (2002). Congruent trends in long-term zooplankton decline in the north-east Atlantic and basking shark (Cetorhinus maximus) fishery catches off west Ireland. Fish. Oceanogr. 11, 59–63. doi: 10.1046/j.1365-2419.2002.00189.x
Sims, D. W., Southall, E. J., Richardson, A. J., Reid, P. C., and Metcalfe, J. D. (2003). Seasonal movements and behaviour of basking sharks from archival tagging: no evidence of winter hibernation. Mar. Ecol. Prog. Ser. 248, 187–196. doi: 10.3354/meps248187
Sims, D. W., Southall, E. J., Tarling, G. A., and Metcalfe, J. D. (2005). Habitat-specific normal and reverse diel vertical migration in the plankton-feeding basking shark. J. Anim. Ecol. 74, 755–761. doi: 10.1111/j.1365-2656.2005.00971.x
Sims, D. W., Speedie, C. D., and Fox, A. M. (2000). Movements and growth of a female basking shark re-sighted after a three year period. J. Marine Biol. Assoc. U.K. 80, 1141–1142. doi: 10.1017/S0025315400003283
Sims, D. W., Witt, M. J., Richardson, A. J., Southall, E. J., and Metcalfe, J. D. (2006). Encounter success of free-ranging marine predator movements across a dynamic prey landscape. Proc. R. Soc. B Biol. Sci. 273, 1195–1201. doi: 10.1098/Rspb.2005.3444
Skomal, G. B., Wood, G., and Caloyianis, N. (2004). Archival tagging of a basking shark, Cetorhinus maximus, in the western North Atlantic. J. Marine Biol. Assoc. U.K. 84, 795–799. doi: 10.1017/S0025315404009968h
Skomal, G. B., Zeeman, S. I., Chisholm, J. H., Summers, E. L., Walsh, H. J., McMahon, K. W., et al. (2009). Transequatorial migrations by basking sharks in the western Atlantic Ocean. Curr. Biol. 19, 1019–1022. doi: 10.1016/j.cub.2009.04.019
Smith, S. E., Au, D. W., and Show, C. (1998). Intrinsic rebound potentials of 26 species of Pacific sharks. Mar. Freshwater Res. 49, 663–678.
Smith, S. E., Au, D. W., and Show, C. (2008). “Intrinsic rates of increase in pelagic elasmobranchs,” in Sharks of the Open Ocean: Biology, Fisheries and Conservation, eds M. D. Camhi, E. K. Pikitch, and E. A. Babcock (Oxford: Blackwell), 288–297.
Springer, A. M., Estes, J. A., Van Vliet, G. B., Williams, T. M., Doak, D. F., Danner, E. M., et al. (2003). Sequential megafaunal collapse in the North Pacific Ocean: an ongoing legacy of industrial whaling? Proc. Natl. Acad. Sci. U.S.A. 100, 12223–12228. doi: 10.1073/pnas.1635156100
Squire, J. L. (1967). Observations of basking sharks and great white sharks in Monterey Bay: 1948-50. Copeia 1, 247–250.
Squire, J. L. (1990). Distribution and apparent abundance of the basking shark, Cetorhinus maximus, off the central and southern California coast, 1962-85. Mar. Fisheries Rev. 52, 8–11.
Teo, S. L., Boustany, A., Dewar, H., Stokesbury, M. J., Weng, K. C., Beemer, S., et al. (2007). Annual migrations, diving behavior, and thermal biology of Atlantic bluefin tuna, Thunnus thynnus, on their Gulf of Mexico breeding grounds. Mar. Biol. 151, 1–8. doi: 10.1007/s00227-006-0447-5
Tremblay, Y., Roberts, A. J., and Costa, D. P. (2007). Fractal landscape method: an alternative approach to measuring area-restricted searching behavior. J. Exp. Biol. 210, 935–945. doi: 10.1242/jeb.02710
Weng, K. C., Castilho, P. C., Morrissette, J. M., Landeira-Fernandez, A. M., Holts, D. B., Schallert, R. J., et al. (2005). Satellite tagging and cardiac physiology reveal niche expansion in salmon sharks. Science 310, 104–106. doi: 10.1126/science.1114616
Witt, M. J., Hardy, T., Johnson, L., McClellan, C. M., Pikesley, S. K., Ranger, S., et al. (2012). Basking sharks in the northeast Atlantic: spatio-temporal trends from sightings in UK waters. Mar. Ecol. Prog. Ser. 459, 121–134. doi: 10.3354/meps09737
Keywords: basking shark, habitat, diel vertical migration, satellite telemetry, Cetorhinus maximus, foraging ecology
Citation: Dewar H, Wilson SG, Hyde JR, Snodgrass OE, Leising A, Lam CH, Domokos R, Wraith JA, Bograd SJ, Van Sommeran SR and Kohin S (2018) Basking Shark (Cetorhinus maximus) Movements in the Eastern North Pacific Determined Using Satellite Telemetry. Front. Mar. Sci. 5:163. doi: 10.3389/fmars.2018.00163
Received: 16 January 2018; Accepted: 23 April 2018;
Published: 16 May 2018.
Edited by:
Mark Meekan, Australian Institute of Marine Science, AustraliaReviewed by:
Nuno Queiroz, University of Porto, PortugalYannis Peter Papastamatiou, Florida International University, United States
Copyright © 2018 Dewar, Wilson, Hyde, Snodgrass, Leising, Lam, Domokos, Wraith, Bograd, Van Sommeran and Kohin. This is an open-access article distributed under the terms of the Creative Commons Attribution License (CC BY). The use, distribution or reproduction in other forums is permitted, provided the original author(s) and the copyright owner are credited and that the original publication in this journal is cited, in accordance with accepted academic practice. No use, distribution or reproduction is permitted which does not comply with these terms.
*Correspondence: Heidi Dewar, aGVpZGkuZGV3YXJAbm9hYS5nb3Y=