 Maria L. Calleja1*
 Mohd I. Ansari1
 Anders Røstad1
 Luis Silva1
 Stein Kaartvedt2
 Xabier Irigoien1,3,4
 Xosé Anxelu G. Morán1
- 1Division of Biological and Environmental Sciences and Engineering, Red Sea Research Center, King Abdullah University of Science and Technology, Thuwal, Saudi Arabia
- 2Department of Biosciences, University of Oslo, Oslo, Norway
- 3Arrantza eta Elikaigintzarako Institutu Teknologikoa (AZTI), Pasaia, Spain
- 4Basque Foundation for Science (IKERBASQUE), Bilbao, Spain
The vast majority of marine dissolved organic carbon (DOC), the largest reservoir of reduced carbon on Earth, is believed to accumulate in the abyssal layers of the ocean over timescales of decades to millennia. However, evidence is growing that small animals that migrate vertically every day from the surface to mesopelagic layers are significantly contributing to the active vertical flux of organic matter. Whether that represents an important source of carbon available for microbial production and respiration at the mesopelagic realm, and its contribution to oceanic carbon budgets and energy flows, is yet to be explored. Here we present data suggesting that Red Sea migrating animals may produce an overlooked source of labile DOC (used at a mean rate of 2.1 μmol C L−1 d−1) that does not accumulate but fuels the metabolism in the twilight zone, generating a disregarded hotspot for heterotrophic prokaryotes.
Introduction
In the extensive oligotrophic ocean, dissolved organic carbon (DOC) is produced mostly in the euphotic zone and passively mixed downward (Jiao et al., 2010; Hansell, 2013) where deep heterotrophic prokaryotes (bacteria and archaea) shape both its amount and composition while remineralizing most of it back to carbon dioxide (Carlson and Hansell, 2014). DOC incorporation into bacterial biomass and respiration are crucial steps in the carbon cycle. More than 80% of the organic carbon annually exported downwards from surface waters is ultimately respired in the mesopelagic or twilight zone (Arístegui et al., 2007) considered as the depth range from 200 to 1,000 m. This is the region through which carbon must pass in order to reach the deep ocean (Arístegui et al., 2009), limiting the extent of carbon sequestration from the atmosphere.
Besides microbial communities, with activities documented to be higher than previously assumed (Gasol et al., 2009), the mesopelagic is also the region where many animals retreat during the day to find refuge from efficient visual predators (Robinson et al., 2010), making excursions to the surface waters to feed at night. During such migrations they actively transport freshly consumed carbon from the surface down to the mesopelagic layer in daily pulses, in what is called the diel vertical migration (DVM). Documented worldwide (Klevjer et al., 2016; Proud et al., 2017) the DVM to the mesopelagic layer is responsible for the biggest vertical movement of biomass on Earth (Steinberg et al., 2000, 2002; Hays, 2003). It has been documented that migrating zooplankton can supply 37% of the total organic carbon remineralized in mesopelagic waters and that the associated DOC flux can be more than three times the DOC flux gradient by diapycnal mixing (Steinberg et al., 2000).
Although most studies on DVM distribution patterns in the oceans have been focused on towed mesopelagic zooplankton, recent acoustic data from around the world oceans, acquired during the Malapsina expedition (Irigoien et al., 2014), estimated the mesopelagic fish biomass to be of 10 billion tons, about one order of magnitude higher than that estimated from formerly catch data (Lam and Pauly, 2005) probably due to low capture efficiency. This undercounted biomass of migrating fish and its associated DOC flux, estimated to exceed 40% of the total carbon export in the oligotrophic ocean (Davison et al., 2013), may have important implications for our understanding of the global ocean carbon fluxes. The amount of mesopelagic fish that migrates every night to the surface waters changes from one oceanic region to another (Klevjer et al., 2016). Assuming a constant feeding rate, the larger the quantity of fish migrating, the higher the carbon transported daily from the surface to the deep waters. The associated effects on microbe-DOC interactions at those depths and its ecological consequences are still to be explored.
The Red Sea is the world northernmost tropical sea and represents an extreme oligotrophic environment with high transparency of waters in the upper layers, and high temperatures (>21.6°C) throughout the subsurface layers (Halim, 1984). Particularly low zooplankton concentrations have been reported at mesopelagic depths (<6 individuals m−3), leaving most of the zooplankton of the Red Sea distributed in the upper 100-200 meters of the water column (Dypvik and Kaartvedt, 2013). Consequently, nearly the whole mesopelagic macrofauna community of the Red Sea is dominated by fish that, due to low feeding opportunities in deep waters, migrate to the epipelagic to feed at night, spending the day digesting, excreting and hiding from visual predators at mesopelagic depths (Dypvik and Kaartvedt, 2013), and generating a well differentiated day/night acoustic scattering signal (Klevjer et al., 2012). Acoustic data also reveal that more than 95% of the mesopelagic fish community migrates vertically on a diel basis (Klevjer et al., 2012).
As a result of these particular conditions the Red Sea offers a simplified natural system to study the potential impact of the mesopelagic migrating fish community and associated DOC supply, on the heterotrophic prokaryotes co-habiting these waters. We hypothesize that migrating fish is supplying a source of labile DOC to the mesopelagic layer that can be contributing to enhanced microbial respiration and biomass production at that layer.
To test this hypothesis we investigated, for the first time, the lability of dissolved organic matter and the carbon flow through heterotrophic prokaryotes within the acoustic deep scattering layer (DSL) of the mesopelagic Red Sea during daytime (550 m depth, Figure 1), and compare it with two overlaying water layers; the surface (5 m) and an intermediate depth (275 m). We did so by monitoring the DOC consumption, heterotrophic prokaryotes growth and biomass production, plus their single-cell physiological state and community composition through short-term (8 days) experiments of natural water samples pre-filtered through 0.8 μm and incubated at in situ light and temperature conditions. Hereafter we will use the term “bacteria” when referring to the heterotrophic prokaryotic communities, although archaea were significantly present at depth (Figure S4), and use “S” for surface waters (5 m), “I” for intermediate waters (275 m) and “D” for waters from the DSL (550 m).
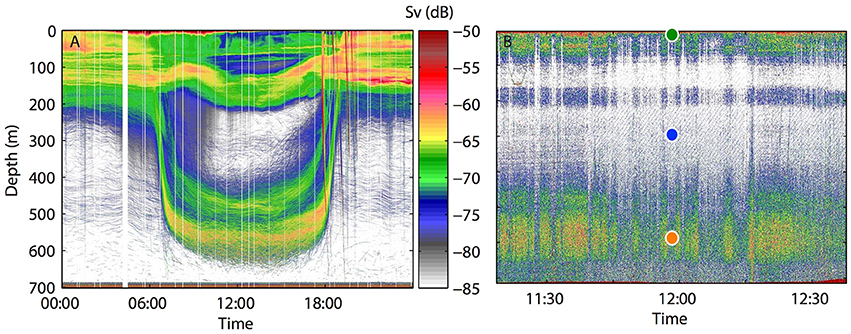
Figure 1. Acoustic data. (A) Typical diel cycle variation in the vertical distribution of migrating organisms from acoustic backscatter in the central Red Sea. Sv (dB) is a proxy for biomass. (B) Daytime uncalibrated echogram section recorded at the time of sampling. Contouring represents the presence (in orange) and absence (in white) of fish biomass. Circles indicate the depths of water samples collected to run the experiments from the three different water layers studied: surface (S, green), intermediate (I, blue) and deep scattering layer (D, orange).
Materials and Methods
Study Site
Sampling was conducted in the central Red Sea off King Abdullah Economic City (KAEC, 22.47 °N 39.03 °E) in November 11th 2015 on board of KAUST R/V Explorer. Detailed description of the study site is provided in Wiebe et al. (2016) and Røstad et al. (2016).
Sample Collection and Acoustic Data Acquisition
A SeaBird® SBE 11plus V 5.2 system was deployed to collect samples for the vertical characterization of the water column and to get enough water from 5, 275, and 550 meters depth for the experimental set up. Water temperature (T, °C), salinity (Sal), fluorescence (Fluor, R.U.) and dissolved oxygen concentration (mg L−1) were recorded in all depth profiles. Discrete samples for dissolved inorganic nutrients, DOC, total dissolved nitrogen (TDN) and bacterioplankton bulk and single-cell characteristics were collected at 14 different depths (5, 20, 40, 60, 70, 80, 100, 150, 200, 275, 400, 550, 600, and 700 m).
Continuous acoustic measurements were performed during the above sampling, in November 11th 2015, with a Simrad EK60 38 kHz echosounder mounted on the ships hull. To get calibrated and noise free measurements of the migrating organisms full diel cycle, a mooring with the same type of echosounder was deployed on the seafloor on 4 February 2016 at the same location, as described by Røstad et al. (2016).
Experimental Set Up
The different layers to sample water (5, 275, and 550 m) were chosen according to the acoustic data acquired the same day of the experiment (see Figure 1B). 10 L of water from each layer depth were collected at noon. The water was immediately filtered through 0.8 μm polycarbonate filters to exclude bacterial grazers and virtually all phytoplankton, distributed into 2 L acid cleaned polycarbonate bottles and incubated at in situ temperatures (set at 29.5°C for the surface layer and 22.0°C for both 275 and 550 m depth layers) during 8 days. Surface waters were incubated with a 12 h light/12 h dark cycle, in order to simulate real in situ conditions, while waters from 275 and 550 m were incubated in the dark. All incubations were duplicated and 2 pseudo-replicates were measured in each incubation. Subsamples for DOC concentration (μmol C L−1), total bacterial abundance (cells mL−1), Live and Dead bacterial cells (cells mL−1), and actively respiring bacteria (cells mL−1), were taken daily (see below) with the aim to test the potential bacterial growth and associated carbon flow through the system.
Inorganic Nutrients and DOC Analysis
Samples for dissolved inorganic nitrogen were taken at the beginning of the experiment, and after 1 and 6 days of incubation. Samples were filtered through 0.2 μm Millipore® polycarbonate filters and filtrates were stored frozen at −20°C until analysis. Nitrate () and nitrite () were analyzed by colorimetry on a Bruan and Luebbe® Autoanalyzer following the methods described at Hansen and Koroleff (2007) for the automated analysis in segmented flow. Limits of quantification were 0.2 and 0.06 μmol L−1 for and respectively. All standards were prepared with a nutrient-free artificial seawater matrix in acid-washed glassware.
Samples for DOC and total dissolved nitrogen (TDN) were filtered through 0.2 μm Millipore® polycarbonate filters, acidified with H3PO4 until pH 1-2, and kept in the dark at 4°C until analysis by high temperature catalytic oxidation (HTCO) at the laboratory. All glass material used was previously acid cleaned and burned (450°C, 4.5 h). Consensus reference material of deep sea carbon (42–45 μmol C L−1 and 31–33 μmol N L−1) and low carbon water (1–2 μmol C L−1), provided by D. A. Hansell and Wenhao Chen (Univ. of Miami), were used to monitor the ultimate of DOC and TDN concentration measurements. Dissolved organic nitrogen (DON) concentrations were calculated by subtracting the dissolved inorganic nitrogen (DIN) to the TDN concentrations (DON = TDN-DIN), where DIN (μmol C L−1) = []+ [].
Bulk and Single-Cell Heterotrophic Prokaryotes Properties
Heterotrophic prokaryotes were analyzed using a BD FACSCanto flow cytometer. Four different physiological groups were considered and their measurements and analysis followed the methodology described in more detail in Gasol and Morán (2015). Briefly, high nucleic acid (HNA) and low nucleic acid (LNA) cells were distinguished by their green fluorescence intensity after being stained with nucleic acid dye (SybrGreen, Molecular Probes) (Marechal et al., 1997). Samples were previously fixed with 1% paraformaldehyde + 0.05 mL glutaraldehyde (final concentration), and kept for 10 min at 4°C in the dark, then deep-frozen in liquid nitrogen, and stored at −80°C until further analysis. Membrane intact cells (referred in the text as Live) were distinguished from membrane-compromised cells (referred in the text as Dead) by the combination of SyberGreen (Molecular Probes) and propidium iodide (Sigma Chemical) (Grégori et al., 2001). Live cells were analyzed in vivo. Actively respiring cells (CTC+), were detected by the presence of red fluorescent oxidized crystals deposited after staining with 5-Cyano-2, 3-di-(p-tolyl) tetrazolium chloride salt (Sigma-Aldrich Co.) (Sherr et al., 1999), kept in the dark for 90 min and ran at high speed (~115 mL min−1). Bacterial abundance was estimated after daily calibrating the flow rate. An empirical calibration between side-angle light scatter (SSC) and bacteria cell diameter (cell diameter = 0.908 + 0.34 log (SSC) (Calvo-Díaz and Morán, 2006) was used to estimate biovolume (Bv, μm3). To monitor the ultimate accuracy of SCC value and to calibrate the flow cytometric signals 1.0 μm fluorescent latex beads (Molecular Probes), the same used in Calvo-Díaz and Morán (2006), were added to each sample as internal standards. Estimated biovolume was converted into cell-specific biomass using Gundersen et al. (2002) conversion: fg C cell−1 = 108.8 × [Bv]0.898 and then converted into bacterial biomass (BB, μmol C L−1).
Bacterial Growth and DOC Decay Rates
Bacterial specific growth rates (μ, d−1) were calculated as the slope of the natural logarithm of BA vs. time during the exponential growth phase of the four physiological groups considered.
Bacterial growth efficiencies (BGE, %) were estimated as the ratio of bacterial production rate (μmol C L−1 d−1) estimated from the increase in bacterial biomass during the exponential growth phase (ΔBB/Δt, where ΔBB = BBmax−BBmin), to the consumption of available carbon (μmol C L−1 d−1) estimated from the decrease in total DOC throughout the incubations as ΔDOC/Δt, where ΔDOC = [DOCInitial – DOCResidualAV]. DOCInitial is the initial DOC concentration and DOCResidualAV is the averaged concentration of residual DOC after the steepest decreased was observed and a relatively constant concentration was remaining. Bacterial carbon demand (BCD) equals the carbon utilization rates or consumption rate of available carbon expressed in μmol C L−1 d−1. Thus BCD = ΔDOC/Δt where Δt is the length of the DOC decay along the incubations. DOC decay rates (k, d−1) were calculated as the ratio of BCD and initial DOC concentration from each incubation. The fraction of DOC utilized during the incubations (DOCuse) was normalized by time (% of DOC utilized d−1), because of the varying lengths of the DOC decay at the different experiments. Thus DOCuse was calculated as [ΔDOC ×100/DOCInitial]/Δt and it was used as indicative of its lability. However it should be taken into account that these are potential carbon consumption rates observed in a confined incubation and they could to a certain extent differ from those in the environment.
Amplicon-Based Next-Generation Sequencing
For genomic analysis, 2 L of water were sampled at the beginning and end of the incubations. Samples were filtered using 0.22 μm filters and the filters were stored at −80°C. Genomic DNA was extracted from the stored filter using the Power® Soil DNA Isolation Kit (MoBio Laboratories, Carlsbad, CA) with slight modifications to the protocol by adding lysozyme and achromopeptidase to the lysis buffer (Ansari et al., 2015). DNA quality was assessed using 260/280 nm and 260/230 nm ratios with a NanoDrop ND-1000 Spectrophotometer (NanoDrop Technologies, US).
PCR amplification of the V4-V5 region of the 16SrDNA gene was performed using the forward primer 515F (5′-GTGYCAGCMGCCGCGGTAA-3′) and reverse primer 909R (5′-CCCGYCAATTCMTTTRAGT-3′) (Ansari et al., 2015) modified with Illumina adaptors. The PCR amplification was performed in a Gene Amp PCR-System 9700 (Applied Biosystems, USA) in a total volume of 25 μL containing 2.5 μL 10 × PremixF and 0.5 units of AccuPrime™ Taq DNA Polymerase High Fidelity (Life Technologies, USA), 0.4 μM of each primer, and 10 ng template DNA. Thermal cycling conditions were as follows: an initial denaturation at 95°C for 3 min, and 25 cycles at 95°C for 30 s, 55°C for 30 s, and 72°C for 30 s, with a final extension at 72°C for 5 min. The PCR cleanup of the product was performed using AMPure XP beads. As described in the MiSeq Reagent Kit Preparation Guide (Illumina, USA), the purified mixture was used in the index PCR to attach dual indices and Illumina sequencing adapters using the nextera XT index kit. Later the PCR products were purified and quantified, and different samples were pooled and submitted for sequencing.
Sequence Analysis and Data Processing
Raw sequence reads were first trimmed for their index, adaptor, and primer sequences. Trimmed sequences were then checked for their quality by removing reads that are, 250 nt in length and with Phred score, 20. Chimeras were identified on UCHIME by referencing a core reference set that was downloaded from Greengenes (i.e., gold strains gg16 – aligned.fasta). RDP Classifier was used for taxonomical assignments of the 16S rRNA gene sequences at 95% confidence level. Sequences were aligned using the RDP Infernal Aligner, and aligned sequences were binned for unique operational taxonomic units (OTUs) identified at 97% 16S rRNA gene similarity. The cluster matrix generated from RDP pipeline was then used in rarefaction analysis, and dissimilarity tests were based on the Bray-Curtis dissimilarity index using analysis of similarities (ANOSIM), non-parametric multivariate analysis of variance.
Statistical Analysis
STATISTICA software was used for statistical analyses. Analysis of variance (ANOVA) and post-hoc comparative tests were carried out with the use of Fisher's least significant difference (LSD) tests in order to reveal the significance (p < 0.05) between all the paired comparisons. The number (n) of data used to calculate the means and standard deviations illustrated in the figures was 2, corresponding to the duplicate incubations.
Results and Discussion
The 24 h echogram from Figure 1A shows the depth distribution of the acoustic scattering layers at the mesopelagic station sampled in the Red Sea. The data was collected in February 2016 and represents a pattern that is typical year-round, including November, as attested in Kaartvedt et al. (2017). Figure 1B displays the acoustic data during the time of water sampling for the experiment. A clear deep and intense scattering layer was recorded between 500 and 600 m depth during day-time. This layer, previously documented to be dominantly composed of skinnycheek lanternfish (Benthosema pterotum) among other species (Dalpadado and Gjøsaeter, 1987), and completely migrating to the surface at night (Klevjer et al., 2012; Dypvik and Kaartvedt, 2013) was the one chosen for the D experiment. The daily absence of migrating animals at 275 m was chosen for the I experiment. However, we may notice that this depth is directly affected by the daily migrating motion of fish, rapidly swimming through it twice per day.
Vertical distributions of environmental variables (Figure S1) revealed maximum oxygen values of 4.7 mg L−1 between 30-70 m depth, overlapping with the peak of Chla fluorescence (i.e., between 50 and 80 m), and decreased to ~ 0.6 mg L−1, corresponding to hypoxic waters (Ekau et al., 2010), from 300 m depth downward. Water temperature was 29.5°C in the upper 50 m, decreased sharply over the subsequent 150 m, and remained rather constant at ca. 22.0°C below 200 m. Initial DOC concentrations in μmol C L−1 in the experiments averaged 78.2 ± 0.4 at the S layer, 58.4 ± 0.2 at the I layer and 56.0 ± 0.3 at the D layer (Figure 2), not significantly different from those measured in the vertical profile (p > 0.5, Figure S2A). On the contrary, total bacterial abundance (BA, cells mL−1), dominated by LNA cells in the upper 200 m and by high nucleic acid (HNA) cells below 200 m (Figure S3A), showed significantly lower values (p < 0.05) at the beginning of the experiment (i.e., 2.05 × 10⁵, 4.94 × 10⁴ and 8.48 × 10⁴ at the S, I, and D layers respectively) than those from the vertical profile (i.e., 4.17 × 10⁵, 1.07 × 10⁵, and 9.88 × 10⁴ at 5, 275, and 550 m respectively). That could be explained by some grazing that may have occurred before water filtration, particularly higher at the S and I layers, where values before and after filtration differed by ca. 50%, compared with the differences found in D waters (~15%). Partial bacterial cell removal by filtration might also be expected (Gasol and Morán, 1999), especially of large cells, although this does not seem likely because of the increase in bacterial size with depth (Figure S3B).
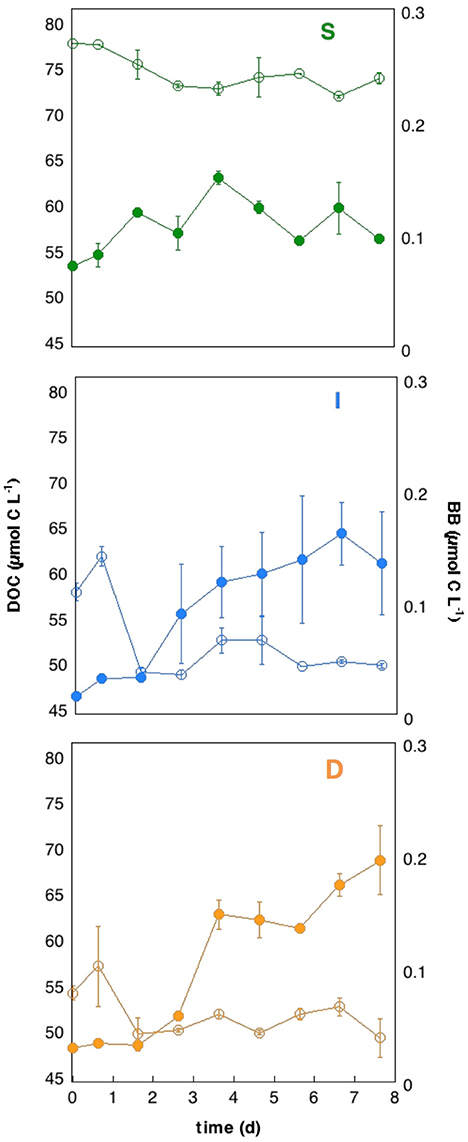
Figure 2. Carbon dynamics within the incubations. Evolution of averaged ± SD of bacterial biomass (BB, μmol C L−1) and dissolved organic carbon (DOC, μmol C L−1) concentrations along the incubations, from the different water layers studied: surface (S, green), intermediate (I, blue) and deep scattering layer (D, orange).
Interactions between DOC and heterotrophic prokaryotes within the incubations differed largely between the three depths assessed (Figure 2). DOC dynamics along the incubations were similar in all three experiments. DOC removal (in μmol C L−1) was significant (4.3 ± 0.2 at S, 7.2 ± 1.0 at I, and 4.6 ± 0.9 at D) during the first 3–4 days in all of the experiments (Figure 2), and values remained relatively constant for the rest of the incubation (averaging 73.8 ± 0.2 at S, 50.9 ± 0.7 at I, and 51.1 ± 0.5 at I and D). Heterotrophic prokaryotes dynamics in the incubations revealed a concomitant increase in bacterial abundance and biomass (BB, Figure 2) peaking at different times in each experiment: 3.6 days in S (2.78 ± 0.09 × 10⁵ cells mL−1, 0.150 ± 0.006 μmol C L−1), 6.6 days at I (1.78 ± 0.09 × 10⁵ cells mL−1, 0.161 ± 0.028 μmol C L−1) and 7.6 days at D (1.84 ± 0.05 × 10⁵ cells mL−1, 0.196 ± 0.030 μmol C L−1), and displayed a slightly slower but more sustained response at the incubations from mesopelagic waters (I and D) than at the surface (S). Specific growth rates (μH+L, Table S1) at the mesopelagic layers (0.26 ± 0.10 and 0.24 ± 0.05 d−1 for the I and D experiment, respectively) were significantly higher (p < 0.05) than at the surface layer (0.08 ± 0.01 d−1). It is worth mentioning that even if we started with similar cell sizes in all experiments (averaging 0.026 ± 0.002 μm3), huge increases were observed in the D incubations, reaching mean values of 0.088 ± 0.014 μm3 at the end of the D experiment (Figure 3) that represented a 3.6-fold increase relative to initial values, and 2.4 times larger cells than the largest measured in the S incubations (0.037 ± 0.001 μm3).
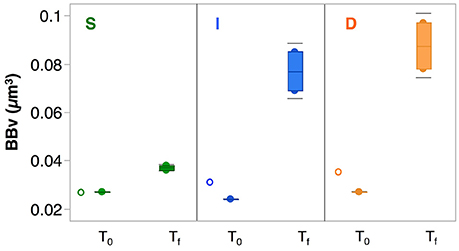
Figure 3. Prokaryotic cell size distribution. Distribution of prokaryotic cell size, represented as bacterial bio-volume (BBv, μm3), at the initial time (T0) and final time (Tf) of the incubations from water taken at surface (S, green), intermediate (I, blue) and deep scattering (D, orange) layers. The empty circles represent the BBv measured from the niskin sample, before the filtration for the experiment was performed. The horizontal line inside the boxes represents the mean value, and the horizontal gray lines outside the boxes indicate the standard deviation.
When jointly assessing the rates of DOC consumption and BB increases, estimated bacterial growth efficiency (BGE) yielded values between 1.57 ± 0.46% and 3.40 ± 0.53%, falling within the range of previous estimates for the oligotrophic and deep ocean (del Giorgio and Cole, 1998; Burd et al., 2010). The relatively larger increase in BB in the D experiment, resulted in significantly higher BGE at the deep scattering layer (3.40 ± 0.53%) relative to the surface (1.84 ± 0.26%) (p < 0.05, post-hoc, Fisher LSD test) and intermediate water (1.57 ± 0.46%) (p < 0.05, post-hoc Fisher LSD test) (Figure 4). Interestingly, initial DOC from the D layer showed significantly lower C:N ratios (13.97 ± 0.23) relative to the I layer (14.53 ± 0.32) and the S layer (14.48 ± 0.08) (p < 0.05, post-hoc Fisher LSD test), suggestive of a DOC with higher nitrogen content at the scattering layer depth, capable to support higher growth efficiencies (del Giorgio and Cole, 1998). The fraction of DOC utilized during the incubations (% DOC d−1), indicative of its lability, was significantly higher (p < 0.05, post-hoc Fisher LSD test) at the two mesopelagic layers (6.15 ± 0.02 and 4.33 ± 1.00 for the I and D experiments respectively) than that of the surface (2.09 ± 0.09 at the S experiment) (Table S2), indicating that surface DOC in the Red Sea during the day time was likely less labile than that at the I and D layers, as also suggested by the C:N values. We hypothesize that high transparency and UV radiation penetration in the epipelagic waters due to the high oligotrophy of the central Red Sea, together with the high temperatures experienced year round, may be triggering very strong chemical photo-degradation of surface DOC, transforming the freshly produced planktonic DOC into a more refractory and less bio-reactive material (Obernosterer and Benner, 2004). This, together with the inorganic nutrient limitation in surface waters (DIN values at the time of sampling were lower than 0.3 μmol N L−1 in surface waters, Figure S2B) may explain the small DOC utilized fraction at the surface layer during the daytime.
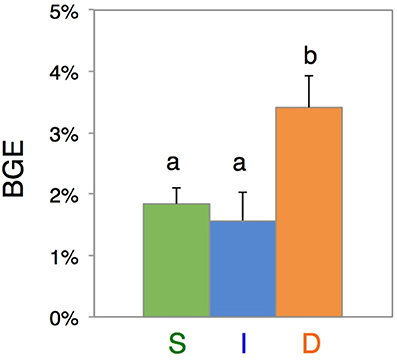
Figure 4. Prokaryotic biomass incorporation. Bacterial growth efficiencies (BGE, %) estimated for each water layer: surface (S, green), intermediate (I, blue) and deep scattering layer (D, orange). BGE values were calculated for the same period of bacterial exponential growth phase and DOC decay in each experiment, ranging from 3.6 to 4.6 days. Different lower case letters represent statistically significant differences (P < 0.05, post-hoc Fisher LSD test).
It is interesting to note that both mesopelagic layers, I and D, harbored heterotrophic bacterial communities that were more active than in surface waters (Table S1). Bacterial community composition from these layers showed the same initial predominant taxa (Figure S4). However, as mentioned above, the ability to incorporate the fraction of consumed DOC into their biomass (i.e., BGE) was significantly higher for the prokaryotes growing in the D incubations than for the ones growing in the I experiments (Figure 4).
The apparent bacterial carbon utilization rates for the mesopelagic layer measured in our experiments (2.1 μmol C L−1 d−1), are higher than previous estimates for the Atlantic ocean (1 μmol C L−1 yr−1) (Carlson et al., 2010) and the Mediterranean Sea (1.2 μmol C L−1 month−1; Santinelli et al., 2010). These differences can be partly attributed to differences in the temperature of mesopelagic waters between the different ocean basins (Raymond and Bauer, 2000; Carlson et al., 2010). The Red Sea harbors the warmest deep waters of the world ocean, displaying a constant temperature of ca. 22°C below 200 m (10°C higher than the warmest mesopelagic waters of the tropical oligotrophic ocean ranging between 4 and 12°C). As temperature has been documented to be a critical factor affecting both bacterial growth rates and respiration (Kirchman et al., 2009), the elevated temperatures may be favoring the growth rates of the heterotrophic prokaryote communities inhabiting mesopelagic Red Sea waters compared to the Mediterranean and North Atlantic mesopelagic waters (with temperatures of ca. 12 and 4°C, respectively) thus increasing the rate at which available DOM is being utilized. At the same time, warm waters can increase fish metabolic rates (Klevjer et al., 2012) and food can be metabolized and excreted faster. This may also trigger the supply of labile DOC at faster rates than in colder mesopelagic waters. Factors other than temperature, such as the proportion of vertically migrating animals, that changes spatially and seasonally accordingly to the DVM patterns of each ocean province (Klevjer et al., 2016), may also have an effect on the DOC supply and lability in the mesopelagic layer of other oceanic regions.
It has also been recently proposed that migrating animals in the mesopelagic ocean mechanically fragment and degrade particulate material into slow-sinking particulate and dissolved organic matter that is subsequently remineralized by microbes (Giering et al., 2014). This process might be occurring intensively when fish are rapidly migrating up and down twice per day between the surface and the acoustic layer, hence affecting the intermediate layers, represented by the I layer. We hypothesize that this may help explain the high rates of DOC consumption encountered at the I incubation. The effect of the presence and absence of migrating animals on the heterotrophic prokaryotes of the Red Sea twilight zone was evaluated further in another experiment at the same site (Morán et al., unpublished data), in which samples from the DSL collected during midday (when fish are at the DSL) and during midnight (when fish have migrated to the surface) on consecutive days were incubated. The fraction of labile DOC at the DSL almost doubled in the midday incubation (4.2% midday vs. 2.4% midnight), which coupled with greater heterotrophic prokaryote production during daytime resulted in significantly higher BGE values.
The physiological state of bacterial cells also diverged across the three considered depths, especially between incubations from S waters and those from mesopelagic waters (both I and D layers). The high percentage of Live bacteria (75–90%) in all three experiments for most of the incubation time (Figure S5A) provides evidence of the overall good physiological state of prokaryotes in mesopelagic waters. In the I and D layers there was a marked and significantly higher increase (p < 0.05) of the percentage of HNA bacteria (from ~50 to ~80%), than that observed at the S layer (from ~40 to ~58%) (Figure S5B). Actively respiring bacteria (CTC+) represented a minor fraction of the total community at the beginning of the experiment (with values ranging from 1.28 to 18.7 × 10³ cells ml−1), and they experienced an order of magnitude increase at the I and D experiments (% CTC+ increased from ~5 to ~ 50% at I and D, and only from ~10 to ~ 16% at S, Figure S5C) further confirming the presence of noticeable amounts of labile carbon being respired in the mesopelagic realm. It should be noted that this labile DOC was capable of sustaining twice as much bacterial biomass in the D layer compared with surface waters (Figure 2), mostly due to differences in mean cell size (Figure 3) and the increase in Rhodobacteraceae. This group of Alphaproteobacteria was initially of minor importance (0.4–5%) but grew to reach contributions of 34, 42, and 56% of BB at the S, I, and D experiments, respectively (Figure S4). It is worth noticing that in both mesopelagic layers (I and D) the dominant family (before the samples were incubated) was the ammonia-oxidizing archaea Nitrosopumilaceae, with contributions of 40 and 51% of total abundance at the I and D layers, respectively (Figure S4). This suggests that vertically migrating animals might contribute to increase ammonia concentrations in the mesopelagic waters of the Red Sea, thus supplying an important energy source for chemoautotrophic prokaryotes (Baltar et al., 2016). It could be that bacterial communities present in the mesopelagic, different from those in the epipelagic layer (Figure S4), are also better adapted to utilize DOC delivered by excretion of migrating mesopelagic fishes. At the end of the incubations each layer showed the dominance of different bacterial families: Flavobacteriaceae at the S layer, Oceanospirillaceae at the I layer and Alcanivoracaceae at the D layer.
It is interesting to note that mesopelagic fish were able to function and survive under conditions of low oxygen concentrations (~0.6 mg L−1, Figure S1). This is in accordance with recent findings from the Malaspina circumnavigation expedition which revealed that a large fraction of all organisms forming the mesopelagic scattering layers of all oceans are able to cope with very low oxygen values (Klevjer et al., 2016). Klevjer and co-workers showed that the proportion of vertically migrating animals was inversely correlated with deep water oxygen levels, suggesting that oxygen limitations at depth could be offset by vertical migration to the surface. This may help explain the high proportion (>95%) of the mesopelagic fish community performing the DVM in the Red Sea, with stronger consequences for the prokaryotic community of the mesopelagic realm.
Our results show ample evidence of the flow of previously undocumented amounts of labile DOC during daytime in the DSL of the mesopelagic Red Sea. With a mean experimental consumption rate of 2.1 ± 0.04 μmol C L−1 d−1, available DOC at the scattering layer enhanced heterotrophic prokaryotes growth relative to the surface layers. We thus hypothesize that vertically migrating animals, documented worldwide in the global mesopelagic ocean (Klevjer et al., 2016; Proud et al., 2017), feeding in the surface waters during night time and defecating at mesopelagic depth during the day generate hotspot micro-environments due to organic matter inputs that enhance the heterogeneity in the ocean interior, further stimulating the growth and organic matter remineralization by free living microbes (Azam and Malfatti, 2007). The effect of daily migrating animals, mainly dominated by fish in the Red Sea (Dypvik and Kaartvedt, 2013; Kaartvedt and Røstad, unpublished data), may contribute to the pool of labile mesopelagic DOC both directly, through exudation and defecation of organic material to the scattering layers during the daytime, and indirectly, by favoring solubilization of particles such as fecal pellets through mechanical fractionation while rapidly swimming to and from the surface layer every sunset and sunrise.
We demonstrate, for the first time, a relationship between the acoustic signal of the DSL and heterotrophic prokaryotic metabolism. The supply of significant amounts of labile DOC by fishes was able to sustain microbial growth efficiencies twice as high at the DSL of the mesopelagic Red Sea than those at the surface. Whether this is also the case in other oceanic regions is yet to be explored. We believe that a further understanding of the mechanisms driving the supply, uptake and processing of this overlooked source of carbon in the twilight zone could give insights into the long debate about unbalanced carbon budgets in the deep ocean (Burd et al., 2010).
Author Contributions
MC led the experiment design, data analysis and wrote the paper. MC, MA, and LS set up the experiments and performed the analyses. AR performed the acoustic research. SK and XI contributed to the interpretation of results and writing. XAGM conceived the research, contributed to data analysis and interpretation and writing.
Funding
This research was supported by King Abdullah University for Science and Technology through the baseline funding provided to XAGM.
Conflict of Interest Statement
The authors declare that the research was conducted in the absence of any commercial or financial relationships that could be construed as a potential conflict of interest.
Acknowledgements
We gratefully acknowledge the crew of the workboat R.V. KAUST Explorer and all the personnel from the coastal and marine resources core lab (CMORE) for their diligent field-work assistance. M. Viegas (KAUST) aided with fieldwork and sample collection. L. Alonso-Sáez (AZTII) and T. Hueter-Stauffer (KAUST) aided with constructive comments.
Supplementary Material
The Supplementary Material for this article can be found online at: https://www.frontiersin.org/articles/10.3389/fmars.2018.00259/full#supplementary-material
References
Ansari, M. I., Harb, M., Jones, B., and Hong, P. -Y. (2015). Molecular-based approaches to characterize coastal microbial community and their potential relation to the trophic state of Red Sea. Sci. Rep. 5:9001. doi: 10.1038/srep09001
Arístegui, J., Agustí, S., Middelburg, J. J., and Duarte, C. M. (2007). “Respiration in the mesopelagic and bathypelagic zones of the oceans” in Respiration in Aquatic Ecosystems, eds P. del Giorgio and P. Williams (New York, NY: Oxford University Press), 181–205.
Arístegui, J., Gasol, J. M., Duarte, C. M., and Herndl, G. J. (2009). Microbial oceanography of the dark ocean's pelagic realm. Limnol. Oceanogr. 54, 1501–1529. doi: 10.4319/lo.2009.54.5.1501
Azam, F., and Malfatti, F. (2007). Microbial structuring of marine ecosystems. Nat. Rev. Microbiol. 5, 782–791. doi: 10.1038/nrmicro1747
Baltar, F., Lundin, D., Palovaara, J., Lekunberri, I., Reinthaler, T., Herndl, G. J., et al. (2016). Prokaryotic responses to ammonium and organic carbon reveal alternative CO2 fixation pathways and importance of alkaline phosphatase in the mesopelagic North Atlantic. Front. Microbiol. 7:1670. doi: 10.3389/fmicb.2016.01670
Burd, A. B., Hansell, D. A., Steinberg, D. K., Anderson, T. R., Arístegui, J., Baltar, F., et al. (2010). Assessing the apparent imbalance between geochemical and biochemical indicators of meso- and bathypelagic biological activity: what the @$#! is wrong with present calculations of carbon budgets? Deep. Res. Part II Top. Stud. Oceanogr. 57, 1557–1571. doi: 10.1016/j.dsr2.2010.02.022
Calvo-Díaz, A., and Morán, X. A. G. (2006). Seasonal dynamics of picoplankton in shelf waters of the southern Bay of Biscay. Aquat. Microb. Ecol. 42, 159–174. doi: 10.3354/ame042159
Carlson, C. A., and Hansell, D. A. (2014). “DOM sources, sinks, reactivity, and budgets,” in Biogeochemistry of Marine Dissolved Organic Matter, 2nd Edn., eds D. Hansell and C. Carlson (Oxford: Elsevier; Academic Press), 65–126.
Carlson, C. A., Hansell, D. A., Nelson, N. B., Siegel, D. A., Smethie, W. M., Khatiwala, S., et al. (2010). Dissolved organic carbon export and subsequent remineralization in the mesopelagic and bathypelagic realms of the North Atlantic basin. Deep. Res. Part II Top. Stud. Oceanogr. 57, 1433–1445. doi: 10.1016/j.dsr2.2010.02.013
Dalpadado, P., and Gjøsaeter, J. (1987). Observations on mesopelagic fish from the Red Sea. Mar. Biol. 96, 173–183. doi: 10.1007/BF00427017
Davison, P. C., Checkley, D. M., Koslow, J. A., and Barlow, J. (2013). Carbon export mediated by mesopelagic fishes in the northeast Pacific Ocean. Prog. Oceanogr. 116, 14–30. doi: 10.1016/j.pocean.2013.05.013
del Giorgio, P. A. and Cole, J. J. (1998). Bacterial Growth Efficiency in Natural Aquatic Systems. Annu. Rev. Ecol. Syst. 29, 503–41, doi: 10.2307/221717
Dypvik, E., and Kaartvedt, S. (2013). Vertical migration and diel feeding periodicity of the skinnycheek lanternfish (Benthosema pterotum) in the Red Sea. Deep. Res. Part I Oceanogr. Res. Pap. 72, 9–16. doi: 10.1016/j.dsr.2012.10.012
Ekau, W., Auel, H., Pörtner, H. O., and Gilbert, D. (2010). Impacts of hypoxia on the structure and processes in pelagic communities (zooplankton, macro-inverterates and fish). Biogeosciences 7, 1669–1699. doi: 10.5194/bg-7-1669-2010
Gasol, J. M., Alonso-Sáez, L., Vaqué, D., Baltar, F., Calleja, M. L., Duarte, C. M., et al. (2009). Mesopelagic prokaryotic bulk and single-cell heterotrophic activity and community composition in the NW Africa-Canary Islands coastal-transition zone. Prog. Oceanogr. 83, 189–196. doi: 10.1016/j.pocean.2009.07.014
Gasol, J. M., and Morán, X. A. G. (2015). “Flow cytometric determination of microbial abundances and its use to obtain indices of community structure and relative activity,” in Hydrocarbon and Lipid Microbiology Protocols, Springer Protocol Handbooks, eds T. J. McGenity, K. N. Timmis, and B. N. Fernandez (Berlin; Heidelberg: Springer-Verlag), 159–187.
Gasol, J. M., and Morán, X. A. G. (1999). Effects of filtration on bacterial activity and picoplankton community structure as assessed by flow cytometry. Aquat. Microb. Ecol. 16, 251–264. doi: 10.3354/ame016251
Giering, S. L., Sanders, R., Lampitt, R. S., Anderson, T. R., Tamburini, C., Boutrif, M., et al. (2014). Reconciliation of the carbon budget in the ocean's twilight zone. Nature 507, 480–483. doi: 10.1038/nature13123
Grégori, G., Citterio, S., Ghiani, A., Labra, M., Sgorbati, S., Brown, S., et al. (2001). Resolution of viable and membrane-compromised bacteria in freshwater and marine waters based on analytical flow cytometry and nucleic acid double staining. Appl. Environ. Microbiol. 67, 4662–4670. doi: 10.1128/AEM.67.10.4662-4670.2001
Gundersen, K., Heldal, M., Norland, S., Purdie, D. A. A., and Knap, A. H. H. (2002). Elemental C, N, and P cell content of individual bacteria collected at the Bermuda Atlantic Time-Series Study (BATS) site. Limnol. Oceanogr. 47, 1525–1530. doi: 10.4319/lo.2002.47.5.1525
Halim, Y. (1984). Plankton of the Red Sea and the Arabian Gulf. Deep Sea Res. A Oceanogr. Res. Pap. 31, 969–982. doi: 10.1016/0198-0149(84)90051-7
Hansell, D. A. (2013). Recalcitrant dissolved organic carbon fractions. Ann. Rev. Mar. Sci. 5, 421–445. doi: 10.1146/annurev-marine-120710-100757
Hansen H. P., and Koroleff F. (2007). “Determination of nutrients,” in Methods of Seawater Analysis, 3rd Edn., eds K. Grasshoff, K. Kremling, and M. Ehrhardt (Wiley Online Library).
Hays, G. C. (2003). A review of the adaptive significance and ecosystem consequences of zooplankton diel vertical migrations. Hydrobiologia 503, 163–170. doi: 10.1023/B:HYDR.0000008476.23617.b0
Irigoien, X., Klevjer, T. A., Røstad, A., Martinez, U., Boyra, G., Acuña, J. L., et al. (2014). Large mesopelagic fishes biomass and trophic efficiency in the open ocean. Nat. Commun. 5:3271. doi: 10.1038/ncomms4271
Jiao, N., Herndl, G. J., Hansell, D. A., Benner, R., Kattner, G., Wilhelm, S. W., et al. (2010). Microbial production of recalcitrant dissolved organic matter: long-term carbon storage in the global ocean. Nat. Rev. Microbiol. 8, 593–599. doi: 10.1038/nrmicro2386
Kaartvedt, S., Røstad, A., and Aksnes, D. L. (2017). Changing weather causes behavioral responses in the lower mesopelagic. Mar. Ecol. Prog. Ser. 574, 259–263. doi: 10.3354/meps12185
Kirchman, D. L., Hill, V., Cottrell, M. T., Gradinger, R., Malmstrom, R. R., and Parker, A. (2009). Standing stocks, production, and respiration of phytoplankton and heterotrophic bacteria in the western Arctic Ocean. Deep. Res. Part II Top. Stud. Oceanogr. 56, 1237–1248. doi: 10.1016/j.dsr2.2008.10.018
Klevjer, T. A., Irigoien, X., Røstad, A., Fraile-Nuez, E., Benítez-Barrios, V. M., and Kaartvedt, S. (2016). Large scale patterns in vertical distribution and behaviour of mesopelagic scattering layers. Sci. Rep. 6:19873. doi: 10.1038/srep19873
Klevjer, T. A., Torres, D. J., and Kaartvedt, S. (2012). Distribution and diel vertical movements of mesopelagic scattering layers in the Red Sea. Mar. Biol. 159, 1833–1841. doi: 10.1007/s00227-012-1973-y
Lam, V., and Pauly, D. (2005). Mapping the global biomass of mesopelagic fishes. Sea around US Project Newsletter.
Marechal, E., Block, M. A., Dorne, A. J., Douce, R., Joyard, J., Marie, D., et al. (1997). Lipid synthesis and metabolism in the plastid envelope\rEnumeration and cell cycle analysis of natural populations of marine picoplankton by flow cytometry using the nucleic acid stain SYBR green I. Physiol. Plant. 100, 65–77. doi: 10.1111/j.1399-3054.1997.tb03455.x
Obernosterer, I., and Benner, R. (2004). Competition between biological and photochemical processes in the mineralization of dissolved organic carbon. Limnol. Oceanogr. 49, 117–124. doi: 10.4319/lo.2004.49.1.0117
Proud, R., Cox, M. J., Andrew, S., Proud, R., Cox, M. J., and Brierley, A. S. (2017). Biogeography of the global ocean' s mesopelagic report biogeography of the global ocean' s mesopelagic zone. Curr. Biol. 27, 113–119. doi: 10.1016/j.cub.2016.11.003
Raymond, P. A., and Bauer, J. E. (2000). Bacterial comsuptionof DOC duirng transport through a temperate estuary. Aquat. Microb. Ecol. 22, 1–12. doi: 10.3354/ame022001
Robinson, C., Steinberg, D. K., Anderson, T. R., Arístegui, J., Carlson, C. A., Frost, J. R., et al. (2010). Mesopelagic zone ecology and biogeochemistry - a synthesis. Deep. Res. Part II Top. Stud. Oceanogr. 57, 1504–1518. doi: 10.1016/j.dsr2.2010.02.018
Røstad, A., Kaartvedt, S., and Aksnes, D. L. (2016). Light comfort zones of mesopelagic acoustic scattering layers in two contrasting optical environments. Deep. Res. Part I Oceanogr. 113, 1–6. doi: 10.1016/j.dsr.2016.02.020
Santinelli, C., Nannicini, L., and Seritti, A. (2010). DOC dynamics in the meso and bathypelagic layers of the Mediterranean Sea. Deep. Res. Part II Top. Stud. Oceanogr. 57, 1446–1459. doi: 10.1016/j.dsr2.2010.02.014
Sherr, B. F., Del Giorgio, P., and Sherr, E. B. (1999). Estimating abundance and single-cell characteristics of respiring bacteria via the redox dye CTC. Aquat. Microb. Ecol. 18, 117–131. doi: 10.3354/ame018117
Steinberg, D. K., Goldthwait, S. A., and Hansel, D. A. (2002). Zooplankton vertical migration and the active transport of dissolved organic and inorganic nitrogen in the Sargasso Sea. Deep. Res. Part I 49, 1–17. doi: 10.1016/S0967-0637(02)00037-7
Steinberg, D. K., Steinberg, D. K., Carlson, C. A., Bates, N. R., Goldthwait, S. A., Madin, L. P., et al. (2000). Zooplankton vertical migration and the active transport of dissolved organic and inorganic carbon in the Sargasso Sea. Deep. Res. I 47, 137–158. doi: 10.1016/S0967-0637(99)00052-7
Keywords: Red Sea, mesopelagic layer, diel vertical migration, heterotrophic prokaryotes, dissolved organic carbon
Citation: Calleja ML, Ansari MI, Røstad A, Silva L, Kaartvedt S, Irigoien X and Morán XAG (2018) The Mesopelagic Scattering Layer: A Hotspot for Heterotrophic Prokaryotes in the Red Sea Twilight Zone. Front. Mar. Sci. 5:259. doi: 10.3389/fmars.2018.00259
Received: 30 March 2018; Accepted: 11 July 2018;
Published: 13 August 2018.
Edited by:
Jacob Carstensen, Aarhus University, DenmarkReviewed by:
Ryan Paerl, North Carolina State University, United StatesYngvar Olsen, Norwegian University of Science and Technology, Norway
Copyright © 2018 Calleja, Ansari, Røstad, Silva, Kaartvedt, Irigoien and Morán. This is an open-access article distributed under the terms of the Creative Commons Attribution License (CC BY). The use, distribution or reproduction in other forums is permitted, provided the original author(s) and the copyright owner(s) are credited and that the original publication in this journal is cited, in accordance with accepted academic practice. No use, distribution or reproduction is permitted which does not comply with these terms.
*Correspondence: Maria L. Calleja, bWFyaWEuY2FsbGVqYWNvcnRlc0BrYXVzdC5lZHUuc2E=