 Penelope A. Ajani
 Niall McGinty
 Zoe V. Finkel
 Andrew J. Irwin
- 1Climate Change Cluster (C3), University of Technology, Sydney, NSW, Australia
- 2Department of Mathematics and Computer Science, Mount Allison University, Sackville, NB, Canada
- 3Environmental Science Program, Mount Allison University, Sackville, NB, Canada
Phytoplankton dynamics are closely linked to the ocean-climate system with evidence that changing ocean conditions are substantially altering phytoplankton biogeography, abundance and phenology. Using phytoplankton community composition and environmental data spanning 1965 to 2013 from a long-term Pacific Ocean coastal station offshore from Sydney, Australia (Port Hacking 100 m), we used the Maximum Entropy Modelling framework (MaxEnt) to test whether phytoplankton realized niches are fixed or shift in response to changing environmental conditions. The mean niches of phytoplankton closely tracked changes in mean temperature, while the mean salinity and mixed layer depth realized niches were consistently at the extreme range of available conditions. Prior studies had shown a fixed niche for nitrate in some phytoplankton species at a site where nitrate concentration was decreasing and potentially limiting; however, at Port Hacking nitrate and silicate niches increased more rapidly than environmental conditions, apparently in response to periodic occurrences of elevated nutrient concentrations. This study provides further evidence that climate change model projections cannot assume fixed realized niches of biotic communities, whilst highlighting the importance of sustained ocean measurements from the southern hemisphere to enhance our understanding of global ocean trends.
Introduction
Warming of the Earth's ocean and atmosphere due to anthropogenic CO2 emissions has seen a global average increase in surface air temperature of 0.85°C over the past century (IPCC, 2014), with the upper ocean trapping the majority of the anthropogenic heating (IPCC, 2013). Atmospheric warming is associated with a decrease in pH and acidification of ocean waters (Rost et al., 2008; Beaufort et al., 2011). It is in these upper, sunlit waters of the global ocean that phytoplankton flourish, producing ~ 45 Gt a−1 of organic carbon (Falkowski et al., 1998; Field et al., 1998). Phytoplankton are a critical food source for higher trophic levels, sustaining marine food webs, which culminate in important fish stocks (Falkowski et al., 2004; Doney, 2006; Richardson and Poloczanska, 2008).
The flow-on effects that changes in climate and phytoplankton communities may have on ocean food webs and global biogeochemical cycles are poorly understood yet potentially profound and include the potential for harmful algal bloom intensification (Edwards and Richardson, 2004; Gobler et al., 2017). Moreover, establishing links between climate change and trends in the structure of phytoplankton assemblages is challenging, as phytoplankton have been shown to exhibit orders-of-magnitude variability over seasonal, inter-annual and inter-decadal time scales (Zingone et al., 2010).
With the potential for rapid dispersal, high reproduction rates and unexpected genetic structuring (Koester et al., 2013), both the fundamental niche of phytoplankton species and the ecological space or realized niche occupied in a particular community (Hutchinson, 1957) may be adaptable to changing ocean conditions. The set of all abiotic and biotic conditions in which a species can persist is called the fundamental niche and is usually determined experimentally in controlled conditions. Observational studies of natural communities can be used to document the realized niche where a species actually occurs, which can be thought of as a modification of the fundamental niche resulting from competition and biotic interactions. Various niche characteristics (e.g., niche position, breadth, overlap, plasticity, and conservatism) have been estimated under varying single- or multi-stressor conditions both in the laboratory (Collins et al., 2014; Boyd et al., 2015; Thomas et al., 2016; Ji et al., 2017) and the field (Irwin et al., 2012; Brun et al., 2015). However, understanding the organismal tolerance and plasticity that will drive evolutionary change remains uncertain, with model projections of biotic communities under climate change still assuming fixed realized niches (Chivers et al., 2017).
Recent approaches have used many species with different trait values to seed marine ecosystem models to examine emergent biogeography of microbial communities (Follows et al., 2007). Field based observations have been used to compare the changes in biogeography of different functional groups of phytoplankton and zooplankton to the velocity of climate change (isotherm movement) (Chivers et al., 2017). Combined with species distribution modeling (SDM), field observations have been used to model phytoplankton biogeography between historical and projected future ocean conditions (Barton et al., 2016) and to track species over time at a single location (Irwin et al., 2015). In the latter example, modeled phytoplankton data from a long-term coastal station CARIACO (Carbon Retention in a Colored Ocean) off the coast of Venezuela, revealed that species niches were not stable over decadal time periods, but were able to exhibit some adaptive capacity to changes in environmental conditions. Many questions remain, however, as we assess the importance and generality of this phenomenon. Little is known about how quickly species respond to environmental changes, if some species or functional groups are particularly flexible or resistant to changes, and what is the potential for contrasting effects of individual environmental drivers or directional changes. More time series are needed to resolve these open questions.
The Port Hacking 100 m (at a depth of 100 m) coastal monitoring station (hereafter PH100m), located on the east coast of Australia, is one of the longest established coastal stations in the Southern Hemisphere. Located 5 km from Sydney, this station has been the focus of many short-term phytoplankton and hydrological investigations since its inception in 1954, with its disparate phytoplankton datasets only recently assembled (Ajani et al., 2016). In 2009, this station became one of nine National Reference Stations located around Australia maintained by the Integrated Marine Observing System (IMOS) to monitor long-term changes in Australia's ocean (Lynch et al., 2014). PH100m is located within a very complex oceanographic setting, dominated by the East Australian Current (EAC), which originates in the Coral Sea to the north and brings warm, oligotrophic waters into more temperate latitudes (Ridgway and Dunn, 2003). The EAC has strengthened and moved poleward (Ridgway and Hill, 2012; Wu et al., 2012) with long-term increases in temperature, salinity, and nitrate and a decline in silicate recorded at this station over the past 60 years (Thompson et al., 2009).
While no concomitant shift in total phytoplankton abundance has been reported at this station over the past 60 years, species composition over the past decade has seen a decline in dinoflagellates compared to diatoms toward the present. There is also an emerging dominance of two tropical species Trichodesmium erythraeum (cyanobacterium) and Bacteriastrum spp. (diatom) at this station (Ajani et al., 2014a,b). This shift in composition, however, has only been reported over the most recent decade, when water temperatures declined amidst a long-term warming signal.
With this in mind, we studied the realized niches of phytoplankton species at PH100m to address the following questions. Do realized niches change in response to environmental change, or are they primarily conserved resulting in a restructuring of communities and changes in biogeography as environmental conditions change? The changes in physical and chemical conditions at PH100m allowed us to test for changes in realized niches over time, so we refined this question by examining how rapidly realized niches change. Another refinement recognizes that the realized niche for some environmental variables may be much more plastic than for others, so we investigate if niches change at different rates for different variables. Many environmental conditions and changes in conditions are correlated, so we investigate if these correlations are reflected in the realized niches and their changes. Finally, we investigate if species respond to changes in the mean environmental conditions, or if more detailed information about the distribution of environmental conditions is required to anticipate changes to realized niches.
Materials and Methods
Five disparate phytoplankton sampling campaigns were conducted at the PH100m coastal station (34°7'3.36”E, 151°13'5.52”S, Figure 1) over the period from 1965 to 2013 (approximately ~20 years of sampling over a ~50 year period). These were coded OSL (1965–1966), HALLE (1978–1979), AJANI97 (1997–1998) AJANI98 (1998–2009), and NRS (2009–2013) and their sampling frequencies, methodologies and references are summarized in Table 1. In brief, phytoplankton samples were collected approximately weekly to monthly using either discrete bottle samples or phytoplankton mesh nets (20 or 37 μm) and preserved before microscopic examination. Cells were identified to the lowest possible taxon using light microscopy and where identification to species level was not possible, cells were assigned to genus level only (e.g., Chaetoceros spp., Thalassiosira spp. etc.). For comparability across sampling campaigns, certain taxa were pooled to genus level. Simultaneous meaurements of several environmental parameters including temperature (°C), salinity, oxidized nitrogen (μmol nitrate and nitrite, hereafter “nitrate”), and dissolved reactive silicate (μmol L−1; hereafter “silicate”) occurred during these sampling campaigns (refer to references in Table 1 for all environmental collection and analytical methodologies).
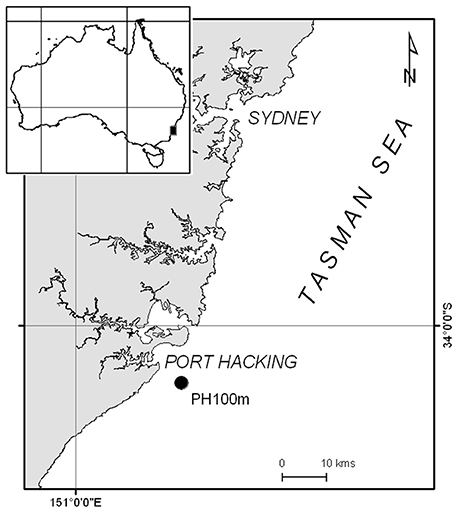
Figure 1. Map of study area showing southeast Australia (inset) and the coastal monitoring station Port Hacking 100 m (PH100m) indicated by black circle.
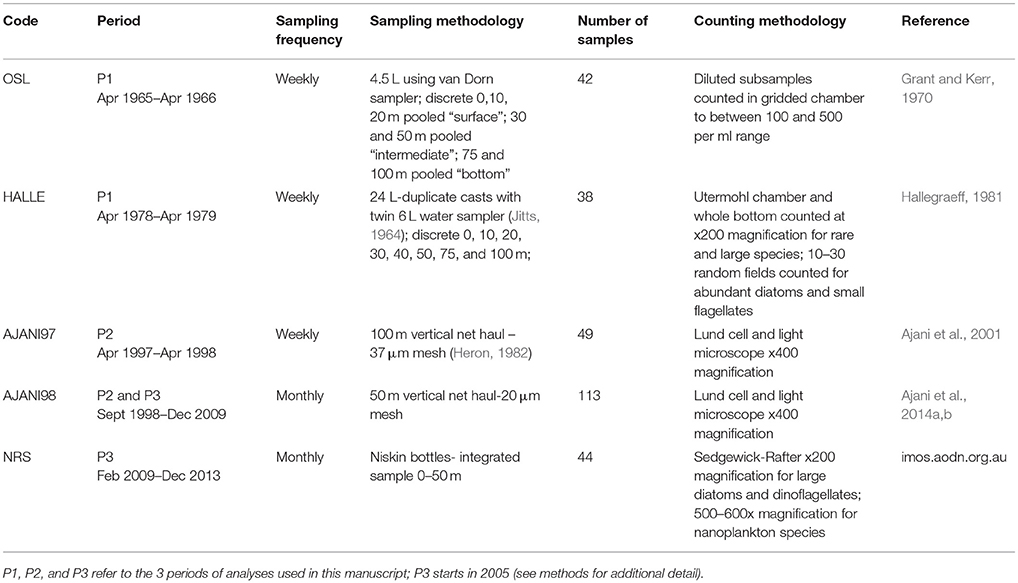
Table 1. Phytoplankton sampling campaign codes, frequency, duration, methodology and reference from PH100m coastal station (IMOS = Integrated Marine Observing System; NRS = National Reference Station).
All phytoplankton abundance data were pooled across 0–50 m except for AJANI97 and AJANI98 which were 0–100 m and converted to simple records of species presence, while all environmental parameters were averaged across the upper 50 m. To assess if the phytoplankton were tracking changes in thermal stratification at this location, we also calculated the mixed-layer depth (MLD) over the sampling duration. This was defined as the depth where the temperature was more than 0.5°C lower than the surface temperature (Levitus, 1982).
Differences in sampling methodology and frequency can introduce a sampling bias and effect model performance when performing niche models (Kramer-Schadt et al., 2013). Although this concern is largely focused on spatial distribution modeling, similar problems could arise from temporal models collected at a single station. Temporal filtering of weekly data to monthly reduced the number of viable species to model, but for those retained we found significant positive correlations (r = 0.78 to 0.93) between the filtered and unfiltered species in terms of how each species track their niche. Similarly, a comparison between the two principal modes of sample collection (net hauls and discrete bottle samples) during 2009, found that while cell counts were significantly lower in the bottle samples, over 72% of the species were collected by both methods and the five most abundant species were the same. We therefore did not correct for changes in sampling frequency or method. For sampling frequency in particular, the spatial filtering would have resulted in a significant loss of modeled species and our tests suggest there would be no change to the overall conclusions.
Tracking Changes in Phytoplankton Niches
To investigate whether phytoplankton niches have adapted to changing environmental conditions on a decadal scale at PH100m, we divided the combined dataset into three distinct periods representing different thermal regimes. The first period, P1, represented four years of stable colder temperatures before the rapid warming during the mid 1990s, and included data from the years 1964, 1965, 1978, and 1979. The second period, P2, which included data from 1997 to 2004, showed no abrubt step-wise changes in environmental conditions but did exhibit a significant decline in ocean temperatures. The final period, P3, showed evidence of renewed warming and included data collected from 2005 to 2013. We chose the end of year midpoint as the division for the two periods separating the data into an initial post El Niño cooling phase (P2) and a cooler period with renewed warming (P3).
Secondly, we investigated how quickly phytoplankton track changes environmental conditions by observing the rate at which the niche changed on a rolling annual basis. We limited this analysis to the years between 1997 and 2013 due to the large gaps present between the earlier four years of data. We calculated a running mean niche of each species using a 4-year moving window which provided a possible total of 14 niche measurements (i.e., 1997–2001, 1998–2002, …, 2010–2013). For both analyses, species that were found to occur at least 15 times in at least one period (P1, P2, and P3), or within one 4-year window, were retained for subsequent niche modeling.
Statistical Analysis
We used the Maximum Entropy Modelling framework (MaxEnt, Phillips and Dudik, 2008) to estimate the logistic probability of finding a particular species in univariate or multivariate niche space by comparing the environmental conditions where a taxon is present with the measured background environment of all sampling events. MaxEnt has become one of the most popular algorithms used to model species distributions. It has consistently been found in comparative studies to give robust estimates and to perform as one of the best algorithms available (Elith and Leathwick, 2009). Our focus is on using MaxEnt to describe the realized niches of phytoplankton and to test for changes over time in these niches. Alternative modeling frameworks could be used ranging from regression to machine learning. MaxEnt is both highly flexible, with weak a priori assumptions about the response of each species to each condition, and highly interpretable in contrast with some “black-box” machine learning techniques. For each MaxEnt model run, a total of 100 bootstrap re-sampling runs were performed. Threshold and hinge responses were disabled as our focus is primarily on the mean niche conditions for each species and to reduce the likelihood of overfitting of the model (Elith et al., 2011). Model performance was evaluated by examining the area under the curve (AUC) of the receiving operator characteristic, where values approaching one suggest a higher probability that a model will correctly identify a species presence. Using the AUC as a single measure for evaluating model performance can be prone to several biases (Yackulic et al., 2013). Nevertheless, by raising the minimum AUC for inclusion of a model to 0.7, we successfully removed the most poorly fitted models that may have biased our results. We used the permutation importance to measure the contribution of each variable to the total AUC on a percentage scale by permuting the values of one variable at a time at random and observing the decrease in model performance. A large decrease in the AUC indicates that the variable is very important in the characterisation of the species' niche.
To investigate whether phytoplankton niches have adapted to changing conditions on a decadal scale, we focused on each environmental variable individually and used the probability response curves to calculate the mean realized niche of each modeled species for each period (P1, P2, P3) or 4-year moving window during the period 1997–2013. For the decadal analysis, the background data were sampled from all observations. For the moving window approach, the background data were sampled from the years included in the moving window. For both analyses, only species that were found to occur at least 15 times in at least one period (P1, P2, and P3), or within one 4-year window were examined. The 100 bootstrap samples provided an estimate of 95% confidence intervals of the mean niche for each species. We restricted our analysis to environmental conditions that were common to all periods and removed extreme values present within individual periods of the time series. Had they been included these extreme values could have had an effect on the species niche calculation, where a difference in niches would be found largely due to the change in available background conditions.
We performed several tests to examine the effect of the changing environment on the realized niches. For each environmental variables, we calculated the community average mean niche for all species within a period as well as the background environmental conditions. We hypothesize that the magnitude and direction of the changes in the niche and environmental differences will be similar. We also hypothesized that the degree of niche change is dependent upon the initial niche and its distance from the mean environmental conditions. To test this, we first examined species that were found in two or more periods and used a linear regression model to examine the pair-wise relationship between the mean niche of the earliest period and the change in mean niches between the two periods. We then examined the rate at which changes to a species niche occurred. We computed the correlations between the running mean of the background environmental conditions and the running mean of the mean niche for all species that were modeled in at least 5 of the 14 time steps. To test for a delay in the response of the community to environmental change, we computed these correlations on simultaneous measures and with a lag of 1–4 years between the environmental conditions and the estimated mean niches. Since some of the changes in niches did not seem to be directly proportional to changes in the mean environmental conditions, we compared the distance between the mean niche and mean environmental conditions to the standard deviation of the environmental conditions in each 4-year moving window.
Results
Phytoplankton Niche Modelling
A total of 34 species were present in at least two periods with a mean AUC of 0.7 or greater (Supplementary Table 1). The variation in mean AUC was low with a standard deviation of < 0.1 across all three periods (P1: 0.71 ± 0.089; P2: 0.81 ± 0.063; P3: 0.72 ± 0.061). Four environmental variables (temperature, salinity, mixed layer depth, and nitrate concentration) allowed comparisons across all three periods while comparisons for silicate concentration were only possible between the latter time periods P2–P3 (Table 2). A total of 16 species were present in both periods P1 and P2 and 31 species were present in periods P2 and P3 (Supplementary Tables 2, 3). We found changes in the community average mean niches and the mean environmental conditions were always in the same direction for temperature, MLD and nitrate concentration between P1 and P2 and between P2 and P3. Changes in the community average mean niches exceeded changes in the environmental conditions for temperature, nitrate and silicate concentration (Table 2). Salinity and mixed layer depth changes were very small or not significantly different from the environment and mean niche between both pairs of periods. A few niche changes nominally in the opposing direction to changes in the environment all corresponded to small, non-significant changes in environmental conditions. Changes in the mean niches for each species were in the same direction as the environmental change for almost all species (Supplementary Tables 2, 3). For each species, the magnitude of niche change was negatively associated with their initial niches, indicating that species with niches in the initial period (P1 or P2) farthest from new conditions in the second period (P2 or P3) exhibited the largest change in their mean niche (Figure 2). We interpreted this as a signal of direct pressure on the realized niche due to changes in environmental conditions.
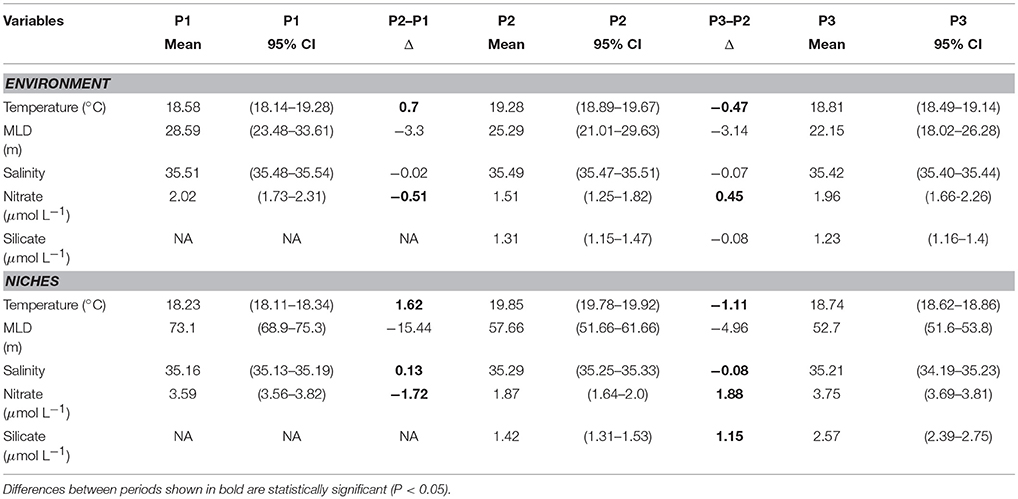
Table 2. Mean environmental conditions (top) and niches (bottom), 95% confidence interval on the mean, and change in means between two periods for temperature, mixed layer depth (MLD), salinity, nitrate and silicate concentrations over time (P1: 1965–1979, P2: 1997–2004, and P3: 2005–2009) at the Port Hacking monitoring station.
Figure 2. Changes in the mean realized niche as a function of the mean niche in an initial period. Each panel displays changes for one variable between periods P1 and P2 (triangles) and between periods P2 and P3 (circles): (A) temperature (°C), (B) mixed layer depth (m), (C) salinity, (D) nitrate concentration (μmol L−1), (E) silicate concentration (μmol L−1). Each symbol represents a single species. Regression lines illustrate that the greatest changes in the realized niche occur in species with an initial niche that is most dissimilar from the average conditions in the second period (P1–P2, solid line; P2–P3, dashed line). See Table 2 for changes in mean environmental conditions and niches. Silicate niches were not available in P1, so the first difference is not shown in panel (E). Colours correspond to the phytoplankton groups coccolithophores (gray), diatoms (green), dinoflagellates (red), and silicoflagellates (blue).
The most important variables determining a species' niche varied between the three periods examined (Table 3). In P1, temperature was the most important variable for all species overall (with a mean permutation importance of 36%), with nitrate concentration (21%) being marginally more important than the two remaining variables (silicate was not available for this period). For P2 temperature was the third most important variable (18%) having been supplanted by the added variable silicate concentration (32%) as most important and nitrate concentration (20%) as the second most important. Period P3 showed an increase in the importance of salinity (22%) and a slight decrease in importance for both nutrient variables (Table 3). Overall, all the predictors played an important role in determining the realized niches of species on average, with no clear signal in which one variable dominated the information characterizing the niches.
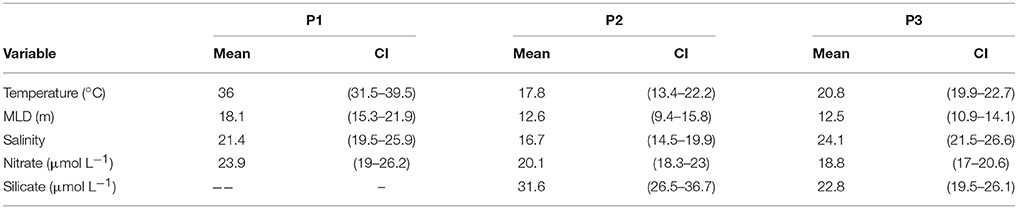
Table 3. The relative importance (Mean, %) and 95% confidence interval (CI) of each of the five environmental variables within each of the three periods (P1: 1964, 1965, 1978, 1979; P2: 1997–2004; P3:2005–2013) averaged over all species analyzed.
Tracking Change in Phytoplankton Niches
A total of 33 species appeared in suitable numbers of samples to model the niche at least once during the period 1997–2013 (Supplementary Table 4). There were strong positive correlations found between changes in environmental conditions and each species niche and the average niches of all species (Figure 3). We found no evidence of any lagged responses, meaning that the changes in mean niche likely occurred within one year of the corresponding change in the environment. The time-series analysis revealed three different patterns in the differences between the mean environment and mean realized niches and how they changed over time. For temperature, the mean niche was approximately equal to the mean temperature in the environment, changing at a similar rate and in the same direction. For salinity and mixed layer depth, the mean niches were at extreme values of the distributions of environmental conditions, corresponding to low (relatively fresh) salinity and large (relatively deep) mixed layer depths. Changes in environmental conditions and mean niches were relatively small for both of these variables (summarized in Table 2, Supplementary Table 3). A third pattern was observed for nitrate and silicate concentrations. Mean niches increased more rapidly than corresponding changes in the mean environmental conditions from 2000 to 2007. The changes arrested in the second half of the study from 2007 to 2013. Despite the increases in silicate niches, there was a steady decrease in the mean silicate concentrations between 1997 and 2013. We computed the difference between the community average mean niche and the mean environmental conditions for each variable. This separation between niches and environmental conditions was close to 0 for temperature, approximately constant for salinity and mixed layer depth, and increased rapidly for nitrate and silicate concentration. Since the mean environmental conditions was not predictive of this difference, we compared the difference to the standard deviation of the environmental conditions (Figure 4). Nitrate and silicate concentrations both showed strongly positive correlations demonstrating that changes in the distribution of environmental conditions (represented here by changes in the standard deviation, but likely due the increasing frequency of higher nutrient concentrations) led to the changes in the mean niches. No such relationship was found for the other environmental variables (dotted lines in Figure 4) Each variable is analyzed in a separate panel of Figure 4 and the final panel F overlays all the variables, standardized to zero mean and unit variance in each axis to facilitate comparison across variables. The community was dominated by diatoms so we attempted to determine if the silicate effect was stronger in diatoms compared to other functional types, but the small number of species of other groups made a careful taxonomic analysis inconclusive.
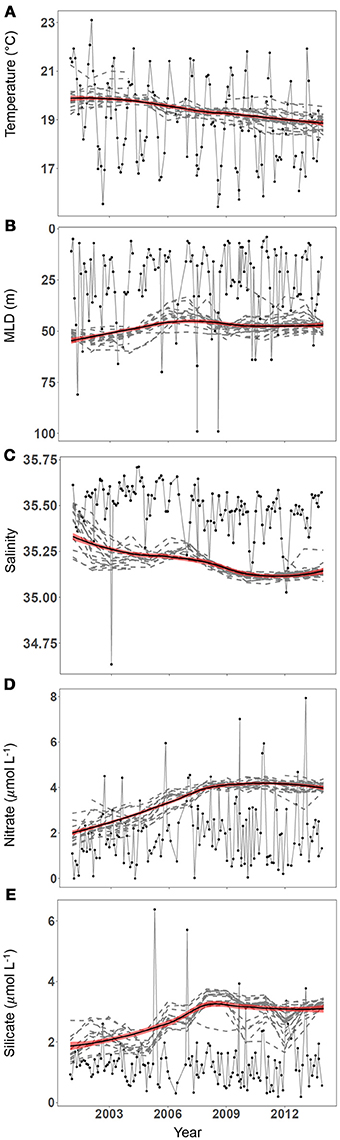
Figure 3. Mean realized niches change over time in response to changes in mean environmental conditions and their distributions. Running mean niches are compared to environmental conditions in panels (A–E). Monthly environmental conditions are shown (black line, filled circles) for (A) temperature (°C), (B) mixed layer depth (m), (C) salinity, (D) nitrate concentration (μmol L−1), and (E) silicate concentration (μmol L−1). The 4-year running mean of the mean realized niche for species found in at least 4 of the 15 periods between 1997 and 2013 (dashed lines) and a loess smoother (black, thick line) with a shaded region 1 standard error wide (red) are overlaid on these panels.
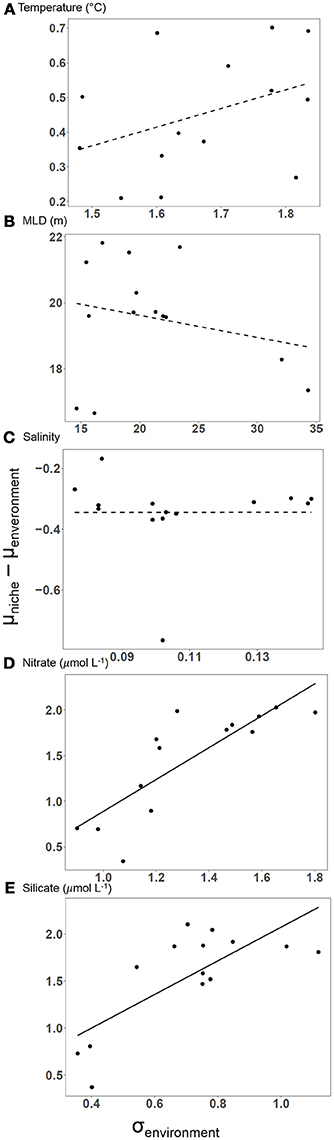
Figure 4. The difference between the community average of mean realized niches and the mean environmental conditions for each 4-year window as a function of the standard deviation of environmental conditions. For nitrate and silicate concentration (D, E) increasing variability in the environment led to larger differences between mean environmental conditions and mean realized niches (linear regressions, black line, p < 0.05). The relationship was non-significant (dashed line, p > 0.05) for temperature, mixed layer depth, and salinity (A–C) revealing close tracking of the mean or an extreme value of the environmental conditions for these variables.
Correlations in the Environment and Niche Interpretations
Correlations among environmental variables are ubiquitous in the ocean and always have the potential to complicate the analysis of observational data. Our focus has been on univariate species distribution models and the mean realized niche rather than on a multivariate model which might be selected to get the most explanatory power to be used for prediction. Univariate niches are generally easier to interpret (Elith et al., 2011; Irwin et al., 2012). The correlations among our predictors are generally small in this time series, and only significantly different from 0 for three pairs of variables: temperature and nitrate concentration, silicate and nitrate concentration, and a very small correlation between silicate concentration and salinity (Table 4). The sign of these correlations agrees with the relative changes in mean realized niches, but the relative changes in temperature and nitrate niches relative to changes in the mean environmental conditions are very different, indicating that there is an independent signal observed in changes in the temperature and nitrate realized niches.
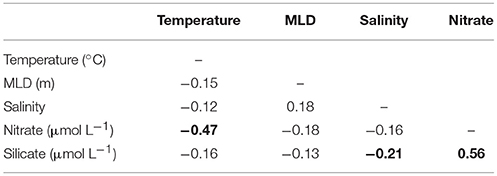
Table 4. The correlation matrix between the five environmental variables for all observations between 1997 and 2013. Significant (P < 0.05) correlations are in bold.
Discussion
The Port Hacking coastal monitoring station (PH100m) is one of the longest running ocean time series in the Southern Hemisphere (Figure 1). The hydrography of the region exhibits complexity at several time scales (Hallegraeff and Jeffrey, 1993; Ajani et al., 2001, 2016; Pritchard et al., 2003). Over the last 60 years there has been a long-term increase in temperature (0.75°C century−1), salinity (0.23 century−1), and nitrate concentration (0.56 μmol L−1 century−1) and decline in silicate concentration (−1.97 μmol L−1 century−1) (Thompson et al., 2009). Superimposed on these multi-decadal trends are seasonal, annual, and decadal variations. In recent years (1997–2013) there has been a decline in salinity, likely due to an increase in rainfall, a modest decline in sea surface temperatures, a decline in mixed layer depth, an increase in annual average nitrate concentrations and a decline in silicate concentrations. Climate predictions for Australia include warmer ocean temperatures and more intense rainfall events across the nation, although annual-average rainfall is projected to decline (www.csiro.au/state-of-the-climate). Australian climate patterns are also influenced by the long-term increasing trend in global air and ocean temperatures (http://www.bom.gov.au). It has been hypothesized that the decline in silicate and other environmental conditions will lead to changes phytoplankton community composition at this site (Ajani et al., 2014a,b). Phytoplankton are rapid and effective indicators of changes in the oceanic environment (Richardson and Schoeman, 2004). Here we determine the capacity of the realized niche of phytoplankton at this coastal site to track changes in their environment conditions since 1965, with an emphasis on the years from 1997 through 2013.
Microbes may have a high capacity to adapt to climate change through selection on standing diversity and de novo mutation, although there may be limits on the ability of species to adapt to multiple stressors (Collins, 2013). In the laboratory, evolutionary change has been demonstrated in numerous microbial species including Escherichia coli, Trichodesmium, Chlamydomonas, and Emiliania, often in less than a thousand generations, indicating that marine phytoplankton may be able to adapt to climate change nearly as rapidly as it occurs (Frank and Slatkin, 1990; Collins and Bell, 2004; Benner et al., 2013; Collins, 2013; Hutchins et al., 2015; Walworth et al., 2016). Despite this evidence, many researchers assume that the physiological traits and niches of phytoplankton are fixed as this facilitates projections of the effects of climate change and there remain few studies documenting changes in phytoplankton niches over time, especially in the field (Thomas et al., 2004, 2012; Flombaum et al., 2013; Barton et al., 2016).
The fundamental niche is the full set of environmental conditions under which a species can persist, and for phytoplankton, this is typically defined in the laboratory. In the field, species are influenced by the interaction of multiple environmental conditions and simultaneous, competition and other biotic interactions, all of which are rarely examined in the lab and as a result, their realized niche is generally a limited subset of their fundamental niche. At a tropical site in coastal Venezuelan waters (Station CARIACO) over a 15 year period (1995–2011), we observed changes in the realized niches of 67 phytoplankton species in response to warming of about 1.3°C and a decrease in nitrate concentration of about 0.7 μmol L−1 (Irwin et al., 2015). While changes in the realized temperature niche closely tracked changes in average conditions in the environment, we observed two distinct responses in the nitrate niches. Some species tracked the decrease in nitrate concentration while others retained an essentially fixed realized niche. We do not know if these results are typical of changes in phytoplankton at other sites, how rapidly the changes occurred, or the reason for the differences we observed in temperature and nitrate niche changes.
The evidence from the Port Hacking coastal station is that realized niches of phytoplankton track changes in environmental conditions (Figure 2, Table 2). We observed three patterns of changes in the realized environmental niches that we believe to be a result of mismatch between the fundamental niches and available environmental conditions. For temperature, the mean niche, averaged over all species, is very close to the mean environmental conditions and the mean niche closely tracks changes in the environment. The changes in mean niche have the same sign but are slightly larger than changes in ocean temperature, whether we examine changes from one period to the next (Table 2) or changes in the running-mean estimate over time (Figure 3A). This is expected, since the fundamental temperature niche for many species is generally wide compared to the ranges of temperatures observed at PH100m (Boyd et al., 2013; Brun et al., 2015). In addition, ocean currents can be expected to have exposed the drifting phytoplankton communities arriving at PH100m to large temperature fluctuations, which will have helped retain species with wide temperature niches (Doblin and van Sebille, 2016), although in some cases currents may promote local adaptations and barriers to gene flow (Rynearson and Armbrust, 2005). By contrast, mean niches are biased relative to the environment for salinity and mixed layer depth, with salinity niches being smaller (fresher) by about 0.25 psu compared to the environment and mixed layer depth niches being larger (deeper) by about 30 m. Mean niches for both these variables are generally at an extreme edge of the distribution of the environmental conditions, indicating an increased probability of finding phytoplankton species in general at one end of the distribution of these variables. Changes in environmental conditions between periods (Table 2) are not significant, and changes in mean niche are near zero but significant (for salinity) or not significant (for mixed layer depth). As with temperature, inter-annual variability in these environmental conditions is much larger than the changes over the time-series in mean niche (Figures 3B,C). More dramatic changes in mean salinity and mixed layer depth could be expected to change the corresponding niches, but the ability of species to persist at the edge of the distribution of these variables allowed the realized niches to remain largely unaffected over the study period. A third pattern is observed for nitrate and silicate concentrations. Relatively small changes in mean concentrations in the ocean (Table 2, Figures 3D,E) appear to have resulted in considerably larger changes in the mean niches, and for silicate concentration, the change is in the opposite direction (although the environmental change was not significantly different from zero). These three different kinds of changes in realized niches may be related to the mismatch between the fundamental niche and the available environmental conditions at this site.
Unlike Station CARIACO, where many phytoplankton species displayed a fixed niche for nitrate, the realized niche for nitrate concentration at PH100m tracks an increase in nitrate concentration at the site. Also somewhat surprisingly, for several variables, most notably nitrate and silicate concentration, the mean realized niche over all species, at times, increases more rapidly than the mean concentration in the environment (Figure 3). Differences in the concentration and temporal dynamics in nitrate concentrations between the two locations may account for the different phenomena at the two sites. The average monthly nitrate concentration at Station CARIACO was <1 μmol L−1, indicating that nitrate may be the limiting resource for many phytoplankton species at this location, whilst the higher concentrations observed at PH100m (~2 μmol L−1) may not be limiting for many species. Diatoms are known to thrive under variable conditions at PH100m, often taking advantage of nutrient pulses (Hallegraeff and Reid, 1986; Ajani et al., 2014a,b). Increasing nitrate loading in the coastal ecosystem offshore from Sydney is predicted to continue in future years, with more frequent upwelling events anticipated and an increase in anthropogenic nutrient loading via river discharges and ocean outfalls (Pritchard et al., 2003). How phytoplankton will react to this further increase in nitrate concentration will require further investigation over longer time scales and highlights the importance of Australia's National Reference Stations to monitor long-term changes in Australia's ocean.
Because of mismatch between fundamental and realized niche, the consequences of environmental changes on some of the realized niches are not sufficiently well described by changes in the mean conditions. Nitrate and silicate concentrations exhibit increasing frequency of relatively high concentrations over the 1997–2013 time series, starting most noticeably around 2005 (Figures 3D,E). The standard deviation of nutrient concentrations, measured over a calendar year, captures this increase and can be used to explain why mean realized niches increase more rapidly than mean environmental conditions (Table 2, Figures 4, Supplementary Tables 3, 4). The difference between mean realized niche and mean environmental condition is correlated with the standard deviation of the environmental conditions; all measured on a calendar year for nitrate and silicate concentrations (Figure 4). The corresponding relationship for temperature, salinity, and mixed layer depth was not significant.
The realized niches of phytoplankton changed rapidly in response to changes in environmental conditions at Port Hacking. We evaluated the lag-times associated with the mean realized environmental niches and environmental conditions and found the correlation was highest with no lag, demonstrating that there was no evidence of a lag even as small as 1 year between environmental change and corresponding changes in the realized niche. Analyses between non-overlapping periods in this study (Table 2, Figure 2) and a previous study at Station CARIACO showed changes in realized niches between periods but did not address the question of how quickly realized niches changed. This rapid change in realized niche suggests that niche tracking arises from rapid processes such as gene frequency change in the population caused by ecological selection or immigration of new ecotypes. We do not anticipate that physiological plasticity is responsible for these changes in realized niche, except possibly for temperature, since the interannual variation in environmental conditions is much larger than longer-term changes that we are emphasizing. If plasticity was responsible, then the niches would likely be much broader and uniform across species, encompassing the full range of environmental conditions (Irwin et al., 2015). Moreover, since the realized niche for temperature is very close to the mean conditions and tracks the mean very closely, it is possible that some of the species at Port Hacking have broad temperature niches relative to the range of environmental conditions.
Our analysis of phytoplankton realized niches at Port Hacking has demonstrated that realized niches for the species observed at this site approximately track changes in environmental conditions and that these changes happen with a time lag of less than 1 year. This reinforces results observed at Station CARIACO which showed that phytoplankton realized niches adapt to changing ocean conditions. Our analysis at PH100m provides a second, independent test of this idea. The longer time record at Port Hacking included some changes in environmental conditions in opposing directions compared to those observed at Station CARIACO, and some reversals, for example an increase in temperature (and niche) between 1965 and 79 (P1) and 1997–2004 (P2) followed by a decrease between 1997 and 2004 (P2) and 2005–2013 (P3). Our results also extend the previous analysis by illustrating that changes in mean conditions may not always be sufficient to explain the changes in the mean niche. Episodic increases in macronutrient concentrations were sufficient at Port Hacking to enable disproportionate increases in the corresponding realized niches, as phytoplankton exploited these new conditions. Furthermore, the East Australian Current is intensifying (poleward extension of approximately 350 km) and continuing to undergo significant warming (2.28°C/century) (Ridgway and Hill, 2012). This latitudinal shift and warming trend is predicted to cause shifts in phytoplankton abundance, distribution and composition along the east Australian coast with the emergence of tropical species into more temperate waters already documented (Hallegraeff et al., 2012; Ajani et al., 2014a,b). This spatial restructuring of the plankton may in turn cause changes in biotic interactions (predation, competition), with potential impacts on biogeochemical cycling, higher trophic levels, and biodiversity (Chivers et al., 2017). Taken together, these studies and the details of rates and magnitude of changes in realized niche, emphasize the need to expect changes in phytoplankton niches when designing ecosystem models used to project biotic responses to climate change. This study provides further evidence that climate change model projections cannot assume fixed realized niches of biotic communities, and highlights the importance of sustained ocean measurements from the southern hemisphere (as well as the northern hemisphere) to enhance our understanding of global ocean trends. Moreover, future work to test the proposed mechanisms for the observed niche flexibility should combine population genetics and microbial experimental evolution to allow for a mechanistic understanding how changes in realized niches can be predicted and thereby taken into account in climate change projections.
Author Contributions
PA, ZF, and AI are responsible for the conceptualisation of this work. PA, NM, and AI performed the analysis. All authors (PA, NM, ZF, and AI) are responsible for the writing, reviewing, and editing of this manuscript.
Funding
PA would like to thank the University of Technology Sydney Chancellor's Postdoctoral Fellowship scheme for funding; ZF and AI thank the Natural Science and Engineering Research Council (NSERC) Canada for funding.
Conflict of Interest Statement
The authors declare that the research was conducted in the absence of any commercial or financial relationships that could be construed as a potential conflict of interest.
Acknowledgments
We acknowledge all contributors, past and present to the PH100m time-series dataset especially Professor Gustaaf Hallegraeff, Ms Alex Coughlan, Professor Anthony Richardson, Dr Tim Ingleton, and Dr Andrew Allen. National Reference Station data are sourced from the Integrated Marine Observing System (IMOS). IMOS is a national collaborative research infrastructure, supported by the Australian Government. Finally, PA would like to thank the University of Technology Sydney Chancellor's Postdoctoral Fellowship scheme for funding; ZF and AI thank the Natural Science and Engineering Research Council (NSERC) Canada for funding. This work was supported by grants from the Simons Foundation (549935, AI; 549937 ZF).
Supplementary Material
The Supplementary Material for this article can be found online at: https://www.frontiersin.org/articles/10.3389/fmars.2018.00285/full#supplementary-material
References
Ajani, P., Hallegraeff, G., Allen, D., Coughlan, A., Richardson, A. J., Armand, L., et al. (2016). Establishing baselines: a review of eighty years of phytoplankton diversity and biomass in southeastern Australia. Oceanogr. Mar. Biol. 54, 387–412. doi: 10.1201/9781315368597-9
Ajani, P., Lee, R., Pritchard, T., and Krogh, M. (2001). Phytoplankton dynamics at a long-term coastal station off Sydney, Australia. J. Coast. Res. 34, 60–73.
Ajani, P.A., Allen, A. P., Ingleton, T., and Armand, L. (2014b). Erratum: a decadal decline in relative abundance and a shift in phytoplankton composition at a long-term coastal station off southeast Australia. Limnol. Oceanogr. 59, 2240–2242. doi: 10.4319/lo.2014.59.6.2240
Ajani, P. A., Allen, A. P., Ingleton, T., and Armand, L. (2014a). A decadal decline in relative abundance and a shift in microphytoplankton composition at a long-term coastal station off southeast Australia. Limnol. Oceanogr. 59, 519–531. doi: 10.4319/lo.2014.59.2.0519
Barton, A. D., Irwin, A. J., Finkel, Z. V., and Stock, C. A. (2016). Anthropogenic climate change drives shift and shuffle in North Atlantic phytoplankton communities. Proc. Natl. Acad. Sci. U.S.A. 113, 2964–2969. doi: 10.1073/pnas.1519080113
Beaufort, L., Probert, I., de Garidel-Thoron, T., Bendif, E. M., Ruiz-Pino, D., Metzl, N., et al. (2011). Sensitivity of coccolithophores to carbonate chemistry and ocean acidification. Nature 476, 80–83. doi: 10.1038/nature10295
Benner, I., Diner, R. E., Lefebvre, S. C., Li, D., Komada, T., Carpenter, E. J., et al. (2013). Emiliania huxleyi increases calcification but not expression of calcification-related genes in long-term exposure to elevated temperature and pCO(2). Philos. Trans. R. Soc. Lond. B Biol. Sci. 368:20130049. doi: 10.1098/rstb.2013.0049
Boyd, P. W., Lennartz, S. T., Glover, D. M., and Doney, S. C. (2015). Biological ramifications of climate-change-mediated oceanic multi-stressors. Nat. Clim. Chang. 5, 71–79. doi: 10.1038/nclimate2441
Boyd, P. W., Rynearson, T. A., Armstrong, E. A., Fu, F., Hayashi, K., Hu, Z., et al. (2013). Marine phytoplankton temperature versus growth responses from polar to tropical waters–outcome of a scientific community-wide study. PLoS ONE 8:e63091. doi: 10.1371/journal.pone.0063091
Brun, P., Vogt, M., Payne, M. R., Gruber, N., O'Brien, C. J., Buitenhuis, E. T., et al. (2015). Ecological niches of open ocean phytoplankton taxa. Limnol. Oceanogr. 60, 1020–1038. doi: 10.1002/lno.10074
Chivers, W. J., Walne, A. W., and Hays, G. C. (2017). Mismatch between marine plankton range movements and the velocity of climate change. Nat. Commun. 8:14434. doi: 10.1038/ncomms14434
Collins, S. (2013). New model systems for experimental evolution. Evolution 67, 1847–1848. doi: 10.1111/evo.12116
Collins, S., and Bell, G. (2004). Phenotypic consequences of 1,000 generations of selection at elevated CO2 in a green alga. Nature 431, 566–569. doi: 10.1038/nature02945
Collins, S., Rost, B., and Rynearson, T. A. (2014). Evolutionary potential of marine phytoplankton under ocean acidification. Evol. Appl. 7, 140–155. doi: 10.1111/eva.12120
Doblin, M. A., and van Sebille, E. (2016). Drift in ocean currents impacts intergenerational microbial exposure to temperature. Proc. Natl. Acad. Sci. U.S.A. 113, 5700–5705. doi: 10.1073/pnas.1521093113
Doney, S. C. (2006). Oceanography-Plankton in a warmer world. Nature 444, 695–696. doi: 10.1038/444695a
Edwards, M., and Richardson, A. J. (2004). Impact of climate change on marine pelagic phenology and trophic mismatch. Nature 430, 881–884. doi: 10.1038/nature02808
Elith, J., and Leathwick, J. R. (2009). Species distribution models: ecological explanation and prediction across space and time. Annu. Rev. Ecol. Evol. Syst. 40, 677–697. doi: 10.1146/annurev.ecolsys.110308.120159
Elith, J., Phillips, S. J., Hastie, T., Dudik, M., Chee, Y. E., and Yates, C. J. (2011). A statistical explanation of MaxEnt for ecologists. Divers. Distrib. 17, 43–57. doi: 10.1111/j.1472-4642.2010.00725.x
Falkowski, P. G., Barber, R. T., and Smetacek, V. (1998). Biogeochemical controls and feedbacks on ocean primary production. Science 281, 200–206.
Falkowski, P. G., Katz, M. E., Knoll, A. H., Quigg, A., Raven, J. A., Schofield, O., et al. (2004). The evolution of modern eukaryotic phytoplankton. Science 305, 354–360. doi: 10.1126/science.1095964
Field, C. B., Behrenfeld, M. J., Randerson, J. T., and Falkowski, P. (1998). Primary production of the biosphere: integrating terrestrial and oceanic components. Science 281, 237–240.
Flombaum, P., Gallegos, J. L., Gordillo, R. A., Rincon, J., Zabala, L. L., Jiao, N., et al. (2013). Present and future global distributions of the marine Cyanobacteria Prochlorococcus and Synechococcus. Proc. Natl. Acad. Sci. U.S.A. 110, 9824–9829. doi: 10.1073/pnas.1307701110
Follows, M. J., Dutkiewicz, S., Grant, S., and Chisholm, S. W. (2007). Emergent biogeography of microbial communities in a model ocean. Science 315, 1843–1846. doi: 10.1126/science.1138544
Frank, S. A., and Slatkin, M. (1990). The distribution of allelic effects under mutation and selection. Genet. Res. 55, 111–117. doi: 10.1017/S0016672300025350
Gobler, C. J., Hattenrath-Lehmann, T. K., Doherty, O. M., Griffith, A. W., Kang, Y., and Litaker, R. W. (2017). Reply to Dees et al.: Ocean warming promotes species-specific increases in the cellular growth rates of harmful algal blooms. Proc. Natl. Acad. Sci. U.S.A. 114, E9765–E9766. doi: 10.1073/pnas.1715749114
Grant, B. R., and Kerr, J. D. (1970). Phytoplankton numbers and species at Port Hacking station and their relationship to the physical environment. Austr. J. Mar.Freshw. Res. 21, 35–45. doi: 10.1071/MF9700035
Hallegraeff, G., Beardall, J., Brett, S., Doblin, M., and Thompson, P. (2012). “Phytoplankton,” in A Marine Climate Change Impacts and Adaptation Report Card for Australia 2012, eds E. S. Poloczanska, A. J. Hobday, and A.J. Richardson (Brisbane, QLD: CSIRO Marine and Atmospheric Research), 227–240.
Hallegraeff, G. M. (1981). Seasonal study of phytoplankton pigments and species at a coastal station off Sydney: importance of diatoms and the nanoplankton. Mar. Biol. 61, 107–118. doi: 10.1007/BF00386650
Hallegraeff, G. M., and Jeffrey, S. W. (1993). Annually recurrent diatom blooms in spring along the New South Wales coast of Australia. Austr. J. Mar.Freshw. Res. 44, 325–334. doi: 10.1071/MF9930325
Hallegraeff, G. M., and Reid, D. D. (1986). Phytoplankton species successions and their hydrological environment at a coastal station off Sydney. Austr. J. Mar.Freshw. Res. 37, 361–377. doi: 10.1071/MF9860361
Heron, A. C. (1982). A vertical free fall plankton net with no mouth obstructions. Limnol. Oceanogr. 27, 380–383. doi: 10.4319/lo.1982.27.2.0380
Hutchins, D. A., Walworth, N. G., Webb, E. A., Saito, M. A., Moran, D., McIlvin, M. R., et al. (2015). Irreversibly increased nitrogen fixation in Trichodesmium experimentally adapted to elevated carbon dioxide. Nat. Commun. 6:8155. doi: 10.1038/ncomms9155
Hutchinson, G. E. (1957). Cold spring harbor symposium on quantitative biology. Concluding Remarks 22, 415–427.
IPCC (2013). “Climate change 2013: the physical science basis,” in Contribution of Working Group I to the Fifth Assessment Report of the Intergovernmental Panel on Climate Change, eds T.F. Stocker, D. Qin, G. K. Plattner, M. Tignor, S.K. Allen, J. Boschung, A. Nauels, Y. Xia, V. Bex and P.M. Midgley (Cambridge, UK; New York, NY: Cambridge University Press).
IPCC (2014). “Climate Change 2014: Synthesis Report,” in Contribution of Working Groups I, II and III to the Fifth Assessment Report of the Intergovernmental Panel on Climate Change, ed R. K. Pachauri and L. A. Meyer (IPCC, Geneva: Core Writing Team).
Irwin, A. J., Finkel, Z. V., Muller-Karger, F. E., and Troccoli Ghinaglia, L. (2015). Phytoplankton adapt to changing ocean environments. Proc. Natl. Acad. Sci. U.S.A. 112, 5762–5766. doi: 10.1073/pnas.1414752112
Irwin, A. J., Nelles, A. M., and Finkel, Z. V. (2012). Phytoplankton niches estimated from field data. Limnol. Oceanogr. 57, 787–797. doi: 10.4319/lo.2012.57.3.0787
Ji, X., Verspagen, J. M. H., Stomp, M., and Huisman, J. (2017). Competition between cyanobacteria and green algae at low versus elevated CO2: who will win, and why? J. Exp. Bot. 68, 3815–3828. doi: 10.1093/jxb/erx027
Jitts, H. R. (1964). A twin six-litre plastic water sampler. Limnol. Oceonogr. 9:452. doi: 10.4319/lo.1964.9.3.0452
Koester, J. A., Swanson, W. J., and Armbrust, E. V. (2013). Positive selection within a diatom species acts on putative protein interactions and transcriptional regulation. Mol. Biol. Evol. 30, 422–434. doi: 10.1093/molbev/mss242
Kramer-Schadt, S., Niedballa, J., Pilgrim, J. D., Schröder, B., Lindenborn, J., Reinfelder, V., et al. (2013). The importance of correcting for sampling bias in MaxEnt species distribution models. Divers. Distribut. 19, 1366–1379. doi: 10.1111/ddi.12096
Levitus, S. (1982). Climatological Atlas of the World Ocean. NOAA Prof. Paper No. 13. Washington, DC. US Government Printing Office.
Lynch, T. P., Morello, E. B., Evans, K., Richardson, A. J., Rochester, W., Steinberg, C. R., et al. (2014). IMOS national reference stations: a continental-wide physical, chemical and biological coastal observing system. PLoS ONE 9:e113652. doi: 10.1371/journal.pone.0113652
Phillips, S. J., and Dudik, M. (2008). Modeling of species distributions with Maxent: new extensions and a comprehensive evaluation. Ecography 31, 161–175. doi: 10.1111/j.0906-7590.2008.5203.x
Pritchard, T., Lee, R., Ajani, P., Rendell, P., Black, K., and Koop, K. (2003). Phytoplankton responses to nutrient sources in coastal waters off southeastern Australia. Aquat. Ecosyst. Health Manag. 6, 105–117. doi: 10.1080/14634980301469
Richardson, A. J., and Poloczanska, E. S. (2008). Ocean science - Under-resourced, under threat. Science 320, 1294–1295. doi: 10.1126/science.1156129
Richardson, A. J., and Schoeman, D. S. (2004). Climate impact on plankton ecosystems in the Northeast Atlantic. Science 305, 1609–1612. doi: 10.1126/science.1100958
Ridgway, K., and Hill, K. (2012). “East Australian current,” in A Marine Climate Change Impacts and Adaptation Report Card for Australia 2012, eds E. S. Poloczanska, A. J. Hobday, and A. J. Richardson. Available online at: http://www.oceanclimatechange.org.au
Ridgway, K. R., and Dunn, J. R. (2003). Mesoscale structure of the mean East Australian current system and its relationship with topography. Prog. Oceanogr. 56, 189–222. doi: 10.1016/S0079-6611(03)00004-1
Rost, B., Zondervan, I., and Wolf-Gladrow, D. (2008). Sensitivity of phytoplankton to future changes in ocean carbonate chemistry: current knowledge, contradictions and research directions. Mar. Ecol. Progr. Ser. 373, 227–237. doi: 10.3354/meps07776
Rynearson, T. A., and Armbrust, E. V. (2005). Maintenance of clonal diversity during a spring bloom of the centric diatom Ditylum brightwellii. Mol. Ecol. 14, 1631–1640. doi: 10.1111/j.1365-294X.2005.02526.x
Thomas, C. D., Cameron, A., Green, R. E., Bakkenes, M., Beaumont, L. J., Collingham, Y. C., et al. (2004). Extinction risk from climate change. Nature 427, 145–148. doi: 10.1038/nature02121
Thomas, M. K., Kremer, C. T., Klausmeier, C. A., and Litchman, E. (2012). A global pattern of thermal adaptation in marine phytoplankton. Science 338, 1085–1088. doi: 10.1126/science.1224836
Thomas, M. K., Kremer, C. T., and Litchman, E. (2016). Environment and evolutionary history determine the global biogeography of phytoplankton temperature traits. Global Ecol. Biogeogr. 25, 75–86. doi: 10.1111/geb.12387
Thompson, P. A., Baird, M. E., Ingleton, T., and Doblin, M. A. (2009). Long-term changes in temperate Australian coastal waters: implications for phytoplankton. Mar. Ecol. Prog. Ser. 394, 1–19. doi: 10.3354/meps08297
Walworth, N. G., Fu, F. X., Webb, E. A., Saito, M. A., Moran, D., McLlvin, M. R., et al. (2016). Mechanisms of increased Trichodesmium fitness under iron and phosphorus co-limitation in the present and future ocean. Nat. Commun. 7:12081. doi: 10.1038/ncomms12081
Wu, L., Cai, W., Zhang, L., Nakamura, H., Timmermann, A., Joyce, T., et al. (2012). Enhanced warming over the global subtropical western boundary currents. Nat. Clim. Change 2, 161–166. doi: 10.1038/nclimate1353
Yackulic, C. B., Chandler, R., Zipkin, E. F., Royle, J. A., Nichols, J. D., Grant, E. H. C., et al. (2013). Presence-only modelling using MAXENT: when can we trust the inferences? Methods Ecol. Evol. 4, 236–243. doi: 10.1111/2041-210x.12004
Keywords: Port Hacking, climate change, MaxEnt, nitrate, species distribution models
Citation: Ajani PA, McGinty N, Finkel ZV and Irwin AJ (2018) Phytoplankton Realized Niches Track Changing Oceanic Conditions at a Long-Term Coastal Station off Sydney Australia. Front. Mar. Sci. 5:285. doi: 10.3389/fmars.2018.00285
Received: 30 April 2018; Accepted: 25 July 2018;
Published: 17 August 2018.
Edited by:
Kristian Spilling, Finnish Environment Institute (SYKE), FinlandReviewed by:
Andrew M. Fischer, University of Tasmania, AustraliaAlena S. Gsell, Netherlands Institute of Ecology (NIOO-KNAW), Netherlands
Copyright © 2018 Ajani, McGinty, Finkel and Irwin. This is an open-access article distributed under the terms of the Creative Commons Attribution License (CC BY). The use, distribution or reproduction in other forums is permitted, provided the original author(s) and the copyright owner(s) are credited and that the original publication in this journal is cited, in accordance with accepted academic practice. No use, distribution or reproduction is permitted which does not comply with these terms.
*Correspondence: Penelope A. Ajani, UGVuZWxvcGUuQWphbmlAdXRzLmVkdS5hdQ==
†Present Address: Zoe V. Finkel, Department of Oceanography, Dalhousie University, Halifax, NS, Canada
Andrew J. Irwin, Department of Mathematics and Statistics, Dalhousie University, Halifax, NS, Canada