 Sheree J. Watson
 Barbara J. Cade-Menun
 Joseph A. Needoba
 Tawnya D. Peterson
- 1Institute of Environmental Health, Oregon Health and Science University, Portland, OR, United States
- 2Agriculture and Agri-Food Canada, Swift Current Research and Development Centre, Swift Current, SK, Canada
- 3OHSU-PSU School of Public Health, Oregon Health and Science University, Portland, OR, United States
Estuaries are biologically productive transition zones between land and sea that play a vital role in transforming, recycling, and sequestering nutrients and organic matter, thus influencing nutrient loading to coastal systems. Yet, the processes involved in phosphorus (P) transformation and cycling among inorganic and organic P forms are poorly known in estuaries. To better understand the potential for P transformation and sequestration, we identified P forms and estimated their contributions to total P in intertidal wetland sediments of a river-dominated estuary (Columbia River, Oregon, USA) using solution 31P nuclear magnetic resonance spectroscopy (P-NMR). Inorganic P forms dominated sediment P extracts throughout the estuary, with orthophosphate accounting for 71–84% of total extracted P. However, biologically-derived inorganic and organic P forms were also detected. Polyphosphates were found in sediment extracts throughout the estuary, contributing as much as 10% of extracted P. Similar to other wetlands, orthophosphate monoesters and diesters made approximately equal contributions (~ 20%) to total extracted P. However, monoesters (e.g., phytate) were more abundant in sedimentary environments characterized by low organic matter content, while diesters (e.g., DNA) were more abundant in sedimentary environments with high organic matter, regardless of salinity. Collectively, the data show strong evidence for P transformation in sediments of a large, river-dominated estuary, which influences its transport to the coastal Pacific Ocean via the expansive Columbia River plume.
Introduction
Phosphorus (P) is an essential but often limiting nutrient in freshwater aquatic and terrestrial ecosystems (Daniel et al., 1998); however, downstream systems are increasingly under threat from nutrient-stimulated eutrophication (Conley et al., 2009; Tiessen et al., 2011). Watershed losses result from inefficient recycling, or poor sequestration, and lead to P transport from soils to surface waters; ultimately, excess P ends up in estuaries and coastal systems where it often results in nutrient-driven eutrophication. Eutrophication can lead to hypoxia, acidification, and harmful algal blooms (Paerl, 2006; Bricker et al., 2008) and represents a growing worldwide threat to human health and well-being (Millenium Ecosystem Assessment, 2006).
Estuaries are biologically productive transition zones comprising a variety of habitats including wetlands, mudflats, and seagrass beds between freshwater and marine systems. They play a vital role in transforming, recycling, and sequestering nutrients and organic matter (OM) prior to entering the coastal ocean (Barbier et al., 2011). Tidal mixing of fresh and saltwater within estuaries leads to particle flocculation (Sholkovitz, 1976) and the localized resuspension of bottom material in turbidity maxima (van Beusekom and Brockmann, 1998; Small and Prahl, 2004). Combined with downstream transport in rivers, estuaries are vulnerable to nutrient pollution because dissolved inorganic P (orthophosphate) desorption from sediment surfaces occurs when anions in seawater compete with phosphate anions for binding sites, leading to P efflux (Fox et al., 1986; Froelich, 1988; House and Warwick, 1999; Monbet et al., 2010). Moreover, the reducing conditions associated with intense OM remineralization increase P desorption, setting up a positive feedback loop whereby eutrophic conditions contribute to P mobilization and limit nutrient sequestration (Howarth et al., 2011; Li et al., 2013). This impairs the critical function of estuaries and wetlands, which is to reduce nutrient loads before they reach coastal waters (Barbier et al., 2011).
Phosphorus retention, or sequestration, in wetlands can occur via chemical, physical, or biological means. For example, orthophosphate is retained in sediment pore waters through adsorption from the water column, particularly in sediments dominated by clays and minerals (Reddy and DeLaune, 2008). Phosphorus (P) buffering is defined as the equilibrium reached between adsorption and desorption of orthophosphate at the water/sediment interface, which reduces variability in orthophosphate concentrations irrespective of input or removal processes (Froelich, 1988). High concentrations of inorganic P and minerals (i.e., Fe, Al, Ca, and Mg) in sediments result in the formation of both soluble and insoluble P compounds, predominantly Fe and Al minerals in acidic soils and Ca compounds in near-neutral to alkaline soils (Stevenson, 1986; Reddy et al., 1999; Richardson and Reddy, 2013). However, seasonality in hydrology, including flooding and drying, produces changes in soil redox conditions, which play a governing role in transformation, storage, and transport of P in wetlands.
In comparison, organic P in wetlands is associated with living systems including plants, microbes, detritus and organic matter, and commonly accounts for large fractions of total P (Vaithiyanathan and Richardson, 1997; Reddy et al., 1999). Although plant storage material is often the dominant source of organic P in wetland soils (Reddy and DeLaune, 2008), soil microbes play a key role in controlling degradation of organic matter and cycling of P in wetlands. For example, microbes secrete enzymes that readily mineralize organic P and can quickly assimilate orthophosphate released into pore water (Richardson, 1985; Kellogg and Bridgham, 2003; Noe et al., 2003). Microbes also regulate P in sediments through biomass, which can account for up to 25–50% of the total P in wetland mineral sediments (Wright et al., 2001; McDowell and Sharpley, 2003) and up to 70% of total P in hydrologically isolated sediments (Williams and Silcock, 2001).
Because the mobility and retention of P depends upon its chemical forms, the determination of chemical structures is critical for identifying possible sources and for estimating the potential for retention, sequestration, and transformation (Celi and Barberis, 2005; Condron et al., 2005; Quiquampoix and Mousain, 2005). The goal of this study was to investigate P forms and their contributions in a mesotidal, river-dominated system characterized by rapid flushing and short water residence times (1–5 d; Chawla et al., 2008; Columbia River estuary, Oregon, USA). Previous work in this estuary showed that water-column dissolved inorganic phosphate (DIP) exhibited seasonal non-conservative increases along a salinity gradient, suggesting the presence of P sources that were not accounted for when orthophosphate was measured in river and ocean end members (Gilbert et al., 2013). To address the knowledge gap, our goal was to determine what P forms are present in the peripheral bay sediments that might contribute to fluxes of DIP and to characterize variability in estuarine P forms as a function of sediment properties.
Materials and Methods
Field Sites
The Columbia River is the second largest by discharge in the USA (Sherwood et al., 1990), culminating in a river-dominated, salt-wedge estuary with strong seasonality in salinity and biogeochemical properties (Roegner et al., 2011). The U.S. Pacific Northwest coast is strongly influenced by summer upwelling when northerly winds promote the offshore transport of surface waters, which are replaced by nutrient-rich subsurface oceanic water (Huyer, 1983; Grantham et al., 2004). The Columbia River discharge varies with season, peaking at >10,000 m3 s−1 during the snowmelt-driven spring freshet (April–June) and declining to < 2,000 m3 s−1 in the dry season (July–October). Salt intrusion into the estuary is greatest during periods of low discharge, which typically occur coincidentally with upwelling-favorable conditions between June and September (Chawla et al., 2008). The estuary exchanges the majority of water in north and south paths that run along the peripheral bays, including Baker Bay (north) and Youngs and Cathlamet Bay (south; Figure 1).
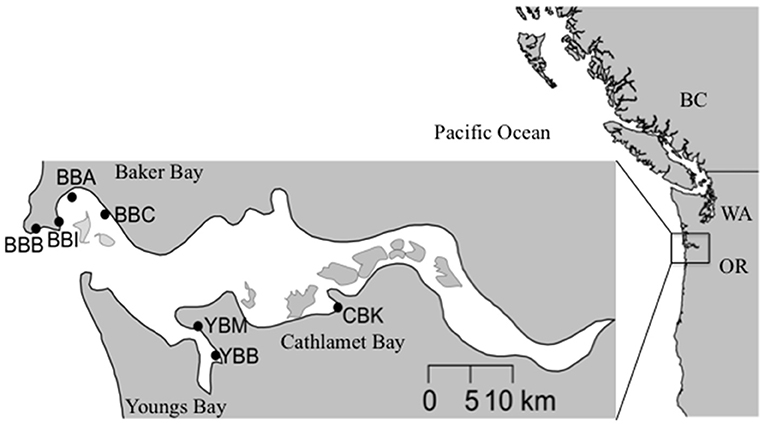
Figure 1. Map of the Columbia River estuary sampling sites within tidal wetlands from three lateral bays: Baker Bay (BB), Cathlamet Bay (CB), and Youngs Bay (YB). BBB, Baker Bay, Boat Launch; BBI, Baker Bay, Ilwaco harbor; BBA, Baker Bay, airport road; BBC, Baker Bay, Chinook Harbor; YBM, Youngs Bay, Mouth; YBB, Youngs Bay, Back; CBK, Cathlamet Bay, Knappa dock.
Compared to the estuary at large, the three peripheral bays included in this study share some similarities in terms of sediment characteristics (Sherwood et al., 1984; Sherwood and Creager, 1990); however, there are differences among them in terms of the composition (i.e., percent silt and clay vs. sand) and grain size. Although Baker and Youngs Bays receive considerable deposits of fine sand, silts, and clays, the sources of sediment deposits differ (Sherwood and Creager, 1990; Simenstad et al., 1990). Baker Bay and Cathlamet Bay receive fine sediments from suspended material, while Youngs Bay received fortnightly inputs of fine sediment from ephemeral estuarine turbidity maximum events (Sherwood and Creager, 1990). In addition, there are seasonal differences in depositional patterns, with the western side of Baker Bay receiving coarser sediment deposits than the east side in February and June. In Youngs Bay, the upstream reaches tend to accumulate a combination of long-term deposits of coarse and fine sediments, with the latter dominating on the fringes. Closer to the estuary's south channel, sediment deposits are coarser than in the other peripheral bay areas. Salinity varies throughout the year in peripheral bays as a function of river discharge; Baker Bay on the northern side of the estuary is mesohaline (i.e., brackish), with a range of 5–20 practical salinity units (PSU) during periods of relatively low flow (i.e., summer and autumn), while Youngs and Cathlamet Bays on the southern side of the estuary are oligohaline (0–5 PSU). The furthest upriver site, Cathlamet Bay, includes a diverse region of islands, tidal flats and marshes that experience seasonal exposure to salinity at depth.
Sample Collection and Chemical Analysis
Sediment texture (percent clay, silt) was determined using the hydrometer method (AgSource Laboratories, OR) on sediment samples from August 2013 prior to the collection of samples for the analysis of P forms. From September 2013–August 2014, sediment samples for the analysis of P forms were collected 1–2 h before low tide at sites within Baker Bay (four sites: BBB, BBI, BBA, BBC), Youngs Bay (two sites: YBB, YBM) and Cathlamet Bay (one site: CBK; Figure 1), all on exposed mudflats lacking any emergent vegetation at low tide. Cores were collected by pressing 50 mL Falcon conical centrifuge tubes with the bottom cut off into sediments. A full tube represented a sediment volume of ~43 cm3 (with a core diameter of 2.3 cm and a length of 10 cm). The tubes were transported back to the laboratory on ice (~2–6 h) and kept at −20°C pending analysis. For this study, sediment cores from March–April and May–August were coarsely sieved to remove large debris, air-dried in a fume hood, ground and homogenized prior to P-NMR extraction (Cheesman et al., 2013). Total P concentrations in the unextracted sediments were determined by ignition followed by extraction with dilute H2SO4 (SmartChem 170, Unity Scientific, MA). Following combustion, dissolved P from the sediment extracts was determined colorimetrically (Murphy and Riley, 1962) and total OM content was estimated by loss on ignition (LOI) at 500°C (Nelson and Sommers, 1996).
Samples collected from waters overlying sediments were filtered in the field by syringe (60 mL) through combusted (4 h at 450°C) 0.7 μm, 25 mm GF/F filters (Whatman, NY) into 60 mL acid-cleaned HDPE bottles (Nalgene) and transported to the lab on dry ice in a cooler, where they were stored at −20°C pending processing. Total nitrogen (N) and total P concentrations were determined on unfiltered water samples. A rapid flow analyzer (Astoria Analyzer, Astoria Pacific, Clackamas, OR) was used for colorimetric determination of dissolved nitrate+nitrite (NOx), ammonium, nitrite, and DIP (here measured as molybdate-reactive orthophosphate) concentrations and for measurement of total N and P after alkaline persulfate digestion (US EPA, 1983a,b; Antweiler et al., 1996; Zimmerman and Keefe, 1997; Patton and Kryskalla, 2003). Further, salinity and temperature measurements were checked during time of sampling by in situ sensor platforms (SATURN04, Cathlamet Bay; SATURN07, Baker Bay; SATURN09, Youngs Bay) in the Columbia River from a publicly available online database (www.stccmop.org) maintained by the Center for Coastal Margin Observation and Prediction (Baptista et al., 2015).
Extraction of Phosphorus
Using a modification of the Cade-Menun and Preston (1996) procedure, approximately 3.0 g of air-dried sediment was suspended in 30 mL of NaOH-EDTA (0.25 M NaOH, 50 mM Na2EDTA) and sonicated (Branson Digital, Cleveland, OH) for 1 min at 20 kHz (~55 W) in an ice bath followed by shaking at 150 rpm for 4 h. Samples were centrifuged for 10 min at 1,200 × g and the supernatant was removed, neutralized with 10% HCl and frozen at −80°C prior to lyophilization. An aliquot of each NaOH-EDTA extract was analyzed for Al, Ca, Fe, Mg, manganese (Mn), and P (mg L−1) by inductively coupled plasma atomic emission spectroscopy (ICP-AES) using a Plasma 400 emission spectrophotometer (PerkinElmer, Waltham, MA).
Solution P-NMR
Lyophilized extracts were redissolved in a solution combining 0.6–0.65 mL each of D2O, H2O, NaOH-EDTA solution, and 10 M NaOH, vortexed, centrifuged at 1,500 × g for 20 min, and stored at 4°C within 12 h of analysis. If precipitate formed (observed in two samples, from BBA and BBC), it was filtered out using 0.2-μm polycarbonate syringe filters prior to analysis. Spectra were collected on a Bruker Avance 500 MHz NMR spectrometer with a 10 mm broadband probe. The NMR delay times were determined based on the ratio of concentrations of P/(Fe+Mn) within the extracts (McDowell et al., 2006). A temperature of 21°C and a 45° pulse were used, with a pulse delay of 4.5 s. Acquisition time was 0.5 s and 2,800–5,830 scans (~4–8 h) were collected. Samples were analyzed with no spinning and no proton decoupling.
Data Analysis and Statistics
The NMR spectra were processed using NMR Utility Transform Software (NUTS; Acorn NMR, Livermore, CA, 2000 edition). Processing included standardizing the orthophosphate peak for each sample at 6.000 ppm. Phosphorus forms (P forms) were identified by their chemical shifts using published libraries for known peaks, with spiking for confirmation (Cade-Menun, 2015). Spectra were processed with 7–10 Hz line broadening for full spectra and 3 Hz line broadening to identify peaks in the orthophosphate monoester and diester regions (Cade-Menun and Liu, 2014). Corrections were made to account for orthophosphate diester degradation by summing the peak areas associated with degradation products (α- and β-glycerophosphate and mononucleotides, degraded from phospholipids and RNA respectively), subtracting this sum from the total monoester area, and adding it to the total diester area (Young et al., 2013; Schneider et al., 2016).
A constrained ordination was performed on the transformed P forms (abundance) and sediment environmental data (TotalP, LOI, Fe, Mn, Ca, and Mg). A redundancy analysis (RDA) is an extension of principal components analysis (PCA) designed to identify or reduce complexity of environmental data. The principal components were constrained to be linear combinations of the environmental variables, with the goal being to explain variation of the dependent variables (P form abundance) as much as can be explained by independent variables (sediment properties; Legendre and Legendre, 1998; Ramette, 2007). Phosphorus forms and sediment data were normalized with centered log ratio (clr) transformations (Abdi et al., 2015). Statistical analyses were performed with R using the vegan package (R Core Team, 2015).
Results
Chemical Analysis
Physicochemical characteristics associated with each sample are shown in Table 1. It should be noted that the small number of samples analyzed in this study limits spatial and temporal comparisons made across sites and environmental characteristics. Total sediment P concentrations varied by more than two-fold, with the highest value observed at CBK (1,366 mg kg−1) and the lowest at BBC (601 mg kg−1). The OM (LOI%) content mirrored total sediment P (11.3% at CBK, 2.2% at BBC). Sediment texture analysis demonstrated the largest percentage of clay and silt at the western side of Baker Bay (42.4%, BBB) and at the mouth of Youngs Bay (35%, YBM), which come from different sources in the estuary including fine suspended material and estuarine turbidity maxima events, respectively (Sherwood and Creager, 1990).
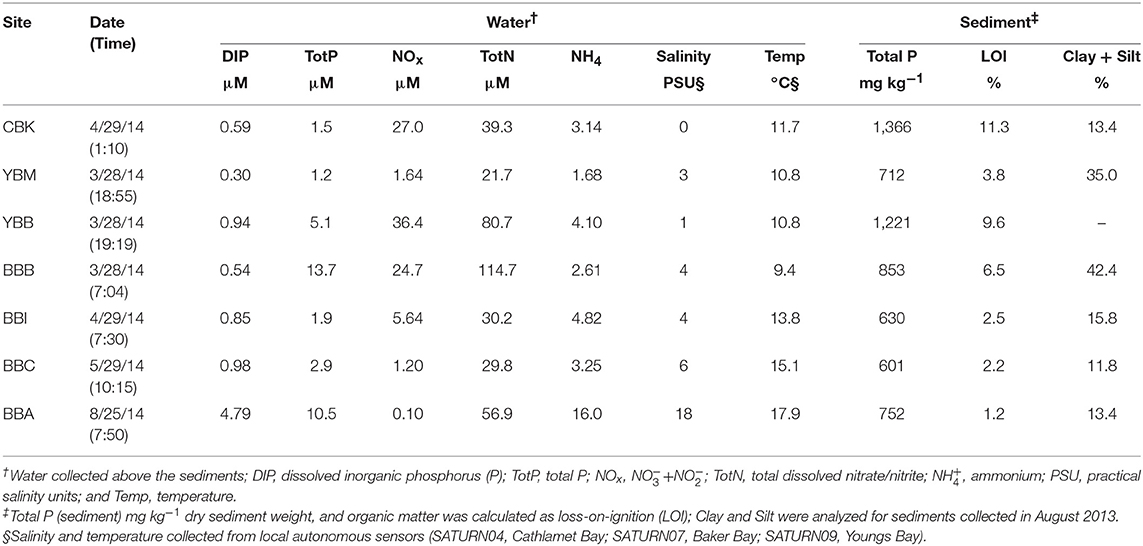
Table 1. Physicochemical characteristics of water and sediments collected from the estuary.
Monthly measurements of DIP, NOx, and ammonium (NH4) at the seven sites over a nine-month period (Jan–Sep 2014) are provided in Supplemental Materials (Figure S2). Only the measurements that coincide with the analysis of sediment P forms are indicated in Table 1. Water column DIP concentrations were low from March–May; in contrast, the sample taken in August at site BBA was one of the highest observed (4.79 μM; Table 1). The 9-month time series confirmed that DIP levels were low in the winter and spring but increased in the late summer (Figure S2). Higher salinity (6–18 PSU vs. 0–4 PSU) and higher DIP concentrations were observed in the August water sample compared to the others. High concentrations of NOx in overlying waters were observed in samples collected from March–May, with the exception of the BBC site; NOx concentrations were lowest in late summer (Table 1, Figure S2). Ammonium concentrations mirrored DIP throughout the year (Figure S2), with the lowest concentrations observed in spring and the highest value in the late summer (Table 1).
The P recovery following sediment NaOH-EDTA extraction varied from a low of 1.5 at site BBA to a high of 24.5% at YBB (Table 2). The samples with the lowest OM tended to have the lowest Fe and Mn concentrations in the extracts (e.g., 0.45 and 0.34 mg kg−1, respectively at BBC; Table 2), and therefore may have required longer delay times to be fully quantitative for extracted P. Higher concentrations of paramagnetic ions in samples (e.g., Fe, Mn) shorten 31P nuclei relaxation times, reducing the delay time required between pulses (McDowell et al., 2006), but potentially increasing line-broadening of peaks. Since it is unknown whether variation in the efficiency of P extraction among the samples led to any biases due to preferential extraction of certain P forms, quantifications should be interpreted with caution. Of the cations extracted with P, Ca was most abundant, ranging from 110 to 2077 mg kg−1 across samples (Table 2), while Fe concentrations ranged from 1.5 mg kg−1 (BBA) to 73.7 mg kg−1 (YBB), however caution should be taken in interpretation as these cation concentrations do not necessarily represent their actual concentrations in sediments.
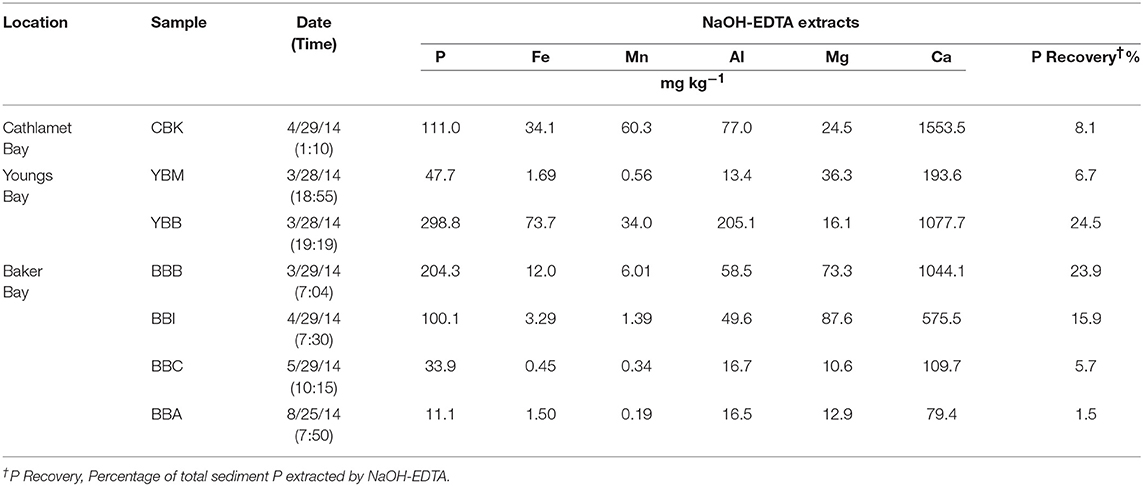
Table 2. Concentrations of P and selected cations in alkaline extracts from estuary lateral bay sediments.
Phosphorus Forms and Their Contributions to P in Sediments
Figure 2 shows example P-NMR spectra, which demonstrate peaks associated with P forms detected in estuarine sediments of the Columbia River; the remaining spectra are included as Supplemental Data (Figure S1). Chemical shifts associated with the peaks are summarized in Table S1 and the percentages of total extracted P accounted for by identified P forms are in Table S2.
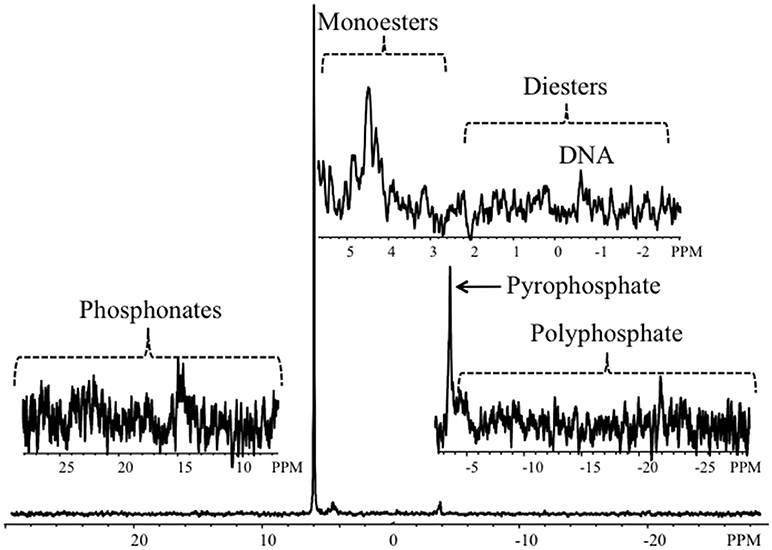
Figure 2. Representative P-NMR spectrum from a sediment sample collected in Youngs Bay (YBM). The full spectrum, scaled to the orthophosphate peak at 7 Hz line-broadening, is shown at the bottom; the upper right inset shows the orthophosphate monoester and orthophosphate diester regions, including a peak corresponding to DNA, the bottom right inset shows the pyrophosphate and polyphosphate region, and the bottom left inset shows the phosphonate region.
Total extracted P was dominated by inorganic forms (Pi; Figure 3A), which exceeded contributions from organic P (Po) by 2–6 times. Orthophosphate, which varied twenty-fold across sites (8.1–231.3 mg kg−1 at BBA and YBB, respectively), accounted for 70.7–84.4% of total P [Σ (Pi + Po)] and 87–99% of Pi (Table S2). Both pyrophosphate and polyphosphate were detected at all sites except BBA in the summer (where only polyphosphate was detected). There was little variation in concentration among most sites (Figure 3B), with pyrophosphate and polyphosphate accounting for 1–13% of Pi and 0.8–10.6% of total P, respectively (Table S2). The largest total polyphosphate (pyrophosphate + polyphosphate) concentrations were observed at the west end of Baker Bay (6.2 mg kg−1, BBI), while the lowest were observed in Cathlamet Bay, located in a southern bay of the estuary (CBK, 0.8 mg kg−1; Table 3).
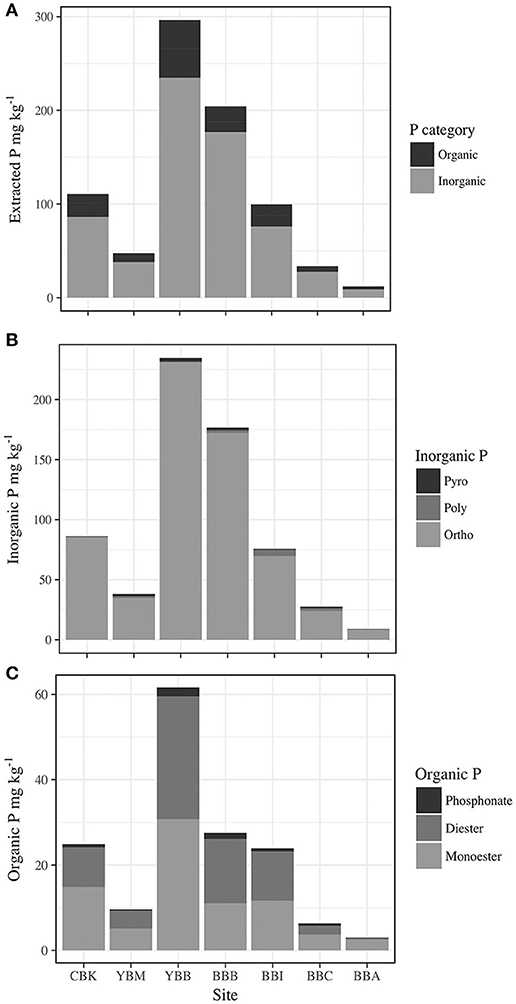
Figure 3. Concentration of P by forms in sediment extracts from sampled sites in the Columbia River estuary (CBK, YBM, YBB, BBB, BBI, BBC, and BBA), including (A) Total organic P (Po) and total inorganic P (Pi); (B) total inorganic phosphorus (Po) as forms (Pyro, pyrophosphate; Poly, polyphosphate; Ortho, orthophosphate); and (C) total organic phosphorus (Po) as forms (phosphonate; Diester, orthophosphate diester; Monoester, orthophosphate monoester).
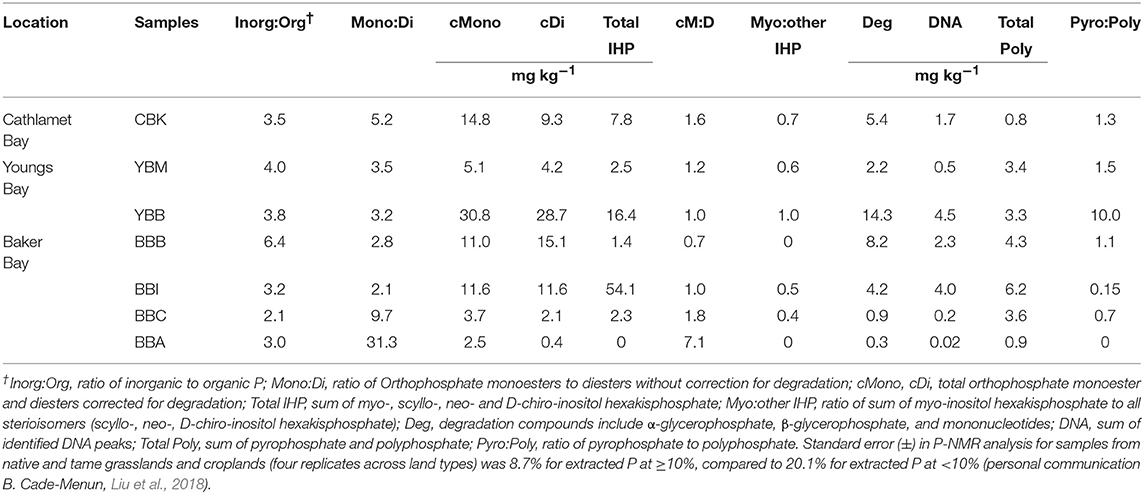
Table 3. Phosphorus form contributions at estuary lateral bay sample sites.
Concentrations of Po ranged from 2.9 to 59.5 mg kg−1, accounting for 13.5–26.6% of total extracted P in sediments (Figure 3C). Orthophosphate monoesters made the largest contribution to Po, where they accounted for 66–94% of Po and 9.4–25% of total extracted P. Identified monoesters comprised stereoisomers of inositol hexakisphosphate (IHP), including chiro, myo, neo, scyllo-IHP, as well as α- and β-glycerophosphate and mononucleotides. The IHP stereoisomers were broadly detected in estuarine sediments at concentrations that varied considerably (1.4–54.1 mg kg−1) over short distances, indicating high local heterogeneity (Table 3). For example, the lowest and highest IHP concentrations were observed within Baker Bay (BBB and BBI, respectively while BBA had no detectable IHP). Stereoisomers of IHP (chiro, myo, neo, scyllo) contributed approximately equally to IHP with the exception of BBB, where contributions from myo-IHP were small (Table 3).
Orthophosphate diesters made up 0.8–7.4% of extracted P, contributing 0.4–28.7 mg kg−1 of P (Table S2; Figure 3C). The highest concentration of total orthophosphate diesters was observed at YBB (28.7 mg kg−1). DNA was detected throughout the estuary, contributing as little as 0.2 mg kg−1 of P (BBC) and as much as 4.5 mg kg−1 of P (YBB), which also had the highest concentration of diester degradation products (α-and β-glycerophosphate and mononucleotides; Table 3). Though present at low concentrations, phosphonates were detected throughout estuarine sediments (0.7–1.4% P), ranging from 0.33 to 2.1 mg kg−1 of total extracted sediment P (Figure 3C).
Redundancy Analysis
An RDA Was Performed to explore possible relationships among P forms and sediment characteristics within lateral bay sediments (Figure 4). The biplots of the RDA model display ordination between response variables (P form abundance) and explanatory variables (TotalP, LOI, Fe, Mn, Ca, and Mg; Figure 4A), sites (non-quantitative centroids; CBK, YBM, YBB, BBB, BBI, BBC, and BBA) and explanatory variables (Figure 4B). The dominant constraining variable (RDA1) was explained by variation in organic matter (LOI; 90.6%) and secondarily (RDA2) by Mg concentrations (Mg; 6.7%), which together explained 97.3% of the variation observed in P forms.
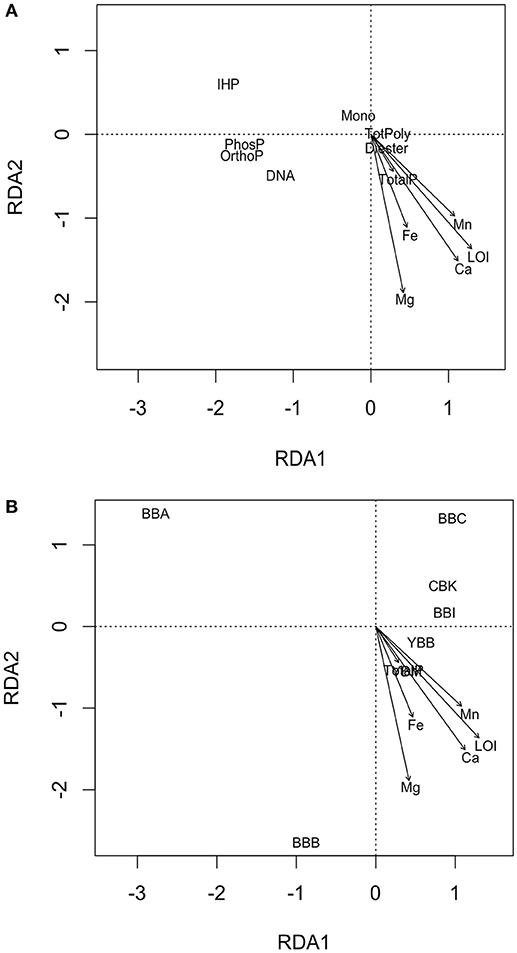
Figure 4. Schematic of two RDA biplots with objects ordinated as (A) response variables as points (TotPoly, total of pyrophosphates and polyphosphates; IHP, inositol hexakisphosphates; Mono, monesters; Diesters, diesters; OrthoP, orthophosphate; DNA, deoxyribonucleic acid; PhosP, phosphonate), and (B) non-quantitative points (sites CBK, YBM, YBB, BBC, BBI, BBA, BBB), and explanatory variables as arrows (LOI, loss-on-ignition, concentrations of Fe, Mn, Ca, Mg, and TotalP, total sediment P).
An ordination biplot was generated to look for correlative relationships among sediment characteristics and P form abundances (Figure 4A). For example, among the response variables (i.e., P form abundances), phytate (IHP)—and to a lesser degree, total monoesters (Mono)—were associated with low organic matter (LOI) found at BBA, BBC, BBI, and CBK (Figures 4A,B). In contrast, diesters (Diester), and to a weaker extent DNA were associated with high concentrations of organic matter, Ca, and Mg (LOI, Ca, Mg; Figure 4A), observed at YBM, YBB and BBB. Orthophosphate and phosphonates were weakly associated with high OM (LOI), and total polyphosphates (TotPoly; pyrophosphate and polyphosphates) were not associated with any explanatory variables. Differences in overlying water properties (total P, NOx, DIP, temperature, salinity) did not explain patterns in P form abundance (data not shown).
An ordination plot of sample sites and sediment characteristics split up sites into two groups according to their associative sediment characteristics (Figure 4B). For example, sites BBA, BBC, CBK and to a lesser extent BBI all had low organic matter, total sediment P and concentrations of cations (Ca, Mg, Fe, and Mn; Figure 4B), compared to sites YBB, YBM and BBB. The BBA site separated from the other sites because of its very low organic matter (LOI) and cation concentrations (Figure 4B). Correlation of explanatory variables can be obtained by taking the cosine of angles between vectors; this analysis revealed that sediment Ca and organic matter (LOI) were highly correlated, with angles ≤ 15° between most vectors (R = 0.97; Figures 4A,B).
Discussion
There are few studies reporting P forms in estuarine environments, and therefore the small data set presented here provides useful information about the potential for P cycling and retention in a river-dominated estuary. The time and costs associated with P-NMR often limit the number of samples that can be analyzed; in addition, samples are often homogenized and pooled, limiting potential replication. In addition, standardization of methods is being stressed in the literature so that P-NMR results can be compared across environments (Cade-Menun and Liu, 2014). For this reason, extracts were prepared from 10 cm diameter cores, which represents the homogenization of at least 1 year's worth of sediment deposition (based on rates of ~6 cm year−1; Sherwood and Creager, 1990). In addition, the extraction of organic P forms is notoriously difficult (Cade-Menun et al., 2006), therefore we used an alkaline extraction that optimizes the extraction of organic P forms; however, this tends to produce low extraction efficiencies, and this must be kept in mind when interpreting the data. The recovery rates reported here for NaOH-EDTA extracted P (6–24%) are comparable to other P-NMR studies in wetlands with similar sediment characteristics. For example, P recovery was 6–16% in calcareous soils and 16–30% in sediments with low OM and neutral pH (Cheesman et al., 2014). In contrast, higher recoveries (25–84%) have been reported in wetland sediments that are acidic (pH 3.6–4.8) or that have high OM (56–94%; Turner and Newman, 2005; Cheesman et al., 2014). It is likely that the residual P that was not extracted in our protocol was inorganic, alkali-stable, and associated with Ca or Mg minerals, since these forms are not readily extracted using NaOH-EDTA (Turner and Newman, 2005; Defforey et al., 2017). Nevertheless, despite low recovery of P in NaOH-EDTA extracts, we detected a range of P forms in estuarine sediments.
Polyphosphates and pyrophosphates were detected in all estuarine sediment samples, where they contributed as much as 13% of inorganic P (10% of total extracted P). In almost half the samples, polyphosphate concentrations exceeded pyrophosphate, in contrast to other studies (Turner and Newman, 2005; Zhang et al., 2009; Cheesman et al., 2010). This might be explained by the fact that, unlike the previous work cited, we included a neutralization step prior to lyophilization, which increases the stability of polyphosphate (Cade-Menun et al., 2006). Degradation of polyphosphate to pyrophosphate (either in situ or during sediment extraction) may also account for the fact that only a handful of studies report detection of polyphosphate in wetlands (Zhang et al., 2009; Cheesman et al., 2014).
Polyphosphate is biologically produced across the domains of life, including by bacteria, fungi, protozoa, plants, and mammals (Kornberg, 1995; Brown and Kornberg, 2004; Kulaev et al., 2004) and is thought to be indicative of microbial activity rather than linked to particular soil or sediment types (Cheesman et al., 2014). Interestingly, we detected polyphosphate in sediments with different characteristics, from brackish sediments in Baker Bay where concentrations were highest BBI (low OM, low Fe, and Mn) and BBB (high OM, high Fe, and Mn), and further supported by our RDA which found total polyphosphates not affiliated with measured sediment properties. Further, the presence of diesters (e.g., DNA) as an indicator of microbial activity was associated with high OM, Fe, and Mn concentrations and total P in sediments, suggesting that microbial biomass may be a major contributor to organic matter in river-dominated estuary sediments. Polyphosphates found throughout sediments produced by microbial activity may be a source of cycled P in dynamic, diel cycled environments such as estuaries, perhaps much more than has generally been assumed and further investigation is certainly warranted.
Although extracted P was dominated by inorganic forms, organic P accounted for ~30% of total P and was comprised of P forms that are considered both labile (e.g., RNA, phospholipids) and stable (e.g., IHP), despite rapid flushing and a low contribution of organic P compared to other freshwater wetlands (Turner and Newman, 2005; Turner et al., 2006; Cheesman et al., 2010, 2014) or lake sediments (Carman et al., 2000). The dominant organic P form in these estuarine sediments was the orthophosphate monoester myo-inositol hexakisphosphate (myo-IHP, also called phytate), which is derived from plants, and was detected in all but one sample. Inositol phosphates (myo-IHP, and stereioisomers scyllo-, neo-, and D-chiro-IHP), accrue in terrestrial soils and in aquatic sediments, particularly when clay content is high and pH is low; under these conditions, phytate tends to be the dominant form (Turner et al., 2002). In the river-dominated estuary, phytate was associated with low OM in both fresh and brackish sediments, with the highest concentrations occurring in samples from Baker Bay with relatively high salinity (BBA; >15 PSU). Usually, sedimentary phytate concentrations tend to be lower in the presence of salt and under hypoxic conditions, (Suzumura and Kamatani, 1995a,b) due to the destabilization of phytate complexes (Gardolinski et al., 2004) formed through complexation with iron oxides in acidic soils or by minerals in sediments with high mineral content (Turner et al., 2002; Turner and Newman, 2005; Turner and Weckström, 2009; Cheesman et al., 2014). High variability in phytate concentrations in the higher-salinity samples may indicate a varying effect of salinity and/or sediment complexing agents as Baker Bay has the greatest variation in biogeochemical conditions.
Other Influences on P Forms and P Retention
Peripheral bay environments in this study are considered depositional environments, where fine material (mainly consisting of clays and silts) is deposited from suspended fluvial material (Sherwood and Creager, 1990). The composition of sediments and grain sizes varies seasonally in the estuary; however, the peripheral bays are consistently sites of long-term deposition of fine sediments. Differences in P forms found at the different sites within these bays could reflect differences in sediment sorting, and/or diagenetic processes. For example, sites differ in terms of the origin of deposited sediments, with Baker and Cathlamet Bay sediment originating from fluvial washload and Youngs Bay sediment originating from a combination of washload and deposits from ephemeral estuarine turbidity maxima.
In addition to sequestration of organic forms, P retention is influenced by abiotic buffering processes, which limit fluctuations in DIP through mineral precipitation with Fe, Mg, Ca, and Mn (e.g., Fe oxyhydroxides, Ca mineral precipitates; Richardson and Marshall, 1986; Froelich, 1988; Reddy et al., 1999; Bridgham et al., 2001). Retention also occurs through abiotic adsorption to sediment surfaces, particularly on fine particles (Li et al., 2013), which dominate the depositional environment of peripheral bays in the estuary. The relatively low and similar DIP concentrations in waters overlying Columbia River estuary sediments (Gilbert et al., 2013; Figure S2)—despite variations in total P within the sediments—may be explained by buffering of P (Froelich, 1988), which warrants further exploration as this would affect P retention in these depositional environments. In addition, the limited sample set suggests that YBB and BBB sites had high concentrations of extractable Ca2+, which readily forms mineral precipitates with P if in high concentrations in sediment environments, (e.g., CaHPO4 from Ca+2 and ) at comparable rates with sediment P sorption (Reddy et al., 1999; Li et al., 2013). Further studies should investigate relationships between P forms and total cation concentrations in different sedimentary environments within the estuary to determine how they might affect P mineralization and sequestration.
Conclusions
A variety of P forms were identified in river-dominated estuary sediment extracts, which were dominated by inorganic P. Although orthophosphate made the largest contribution to inorganic P, polyphosphate and pyrophosphate were found throughout the lateral bays, constituting up to 13% of extracted inorganic P. Organic forms accounted for ~30% of total extracted P, and included both labile P forms (e.g., phospholipids, RNA) and resistant forms (e.g., IHP), which were detected at approximately equal concentrations throughout the estuary. Sample-to-sample variability was greatest among organic P forms, with orthophosphate monoesters such as phytate (myo-IHP) being most abundant when OM content was low. In contrast, orthophosphate diesters were more abundant in sediments with high OM, suggesting that microbial activity might play a larger role in P cycling in sediments with high OM. Low orthophosphate concentrations in overlying waters along with variable sediment P concentrations suggest P buffering may occur within peripheral bays. These data demonstrate that despite short water residence times and rapid flushing, sediments of a river-dominated estuary have the potential to sequester P in inorganic and inorganic forms, thus influencing P loading to the coastal ocean via the large Columbia River plume.
Author Contributions
SW collected and analyzed all samples, wrote the manuscript, and managed communication among all the authors. BC-M ran the NMR experiments and analyzed spectra with SW. JN and SW analyzed water samples and JN contributed to sediment P analysis as well as design of the work. TP had substantial contributions to the conception and design of the work and along with BC-M critically revised the work for intellectual content and contributions.
Funding
This work was supported by the National Science Foundation (NSF OCE-0424602), a Science and Technology Center, the Center for Coastal Margin Observation and Prediction (CMOP). Further, travel grants were provided by the National Science Foundation-sponsored Consortium of Universities for the Advancement of Hydrological Science, Inc. (CUAHSI), and an N.L. Tartar Trust Research Award from Oregon Health and Science University (OHSU) for work in Canada.
Conflict of Interest Statement
The authors declare that the research was conducted in the absence of any commercial or financial relationships that could be construed as a potential conflict of interest.
Acknowledgments
The NMR analysis was done at the Saskatchewan Structural Sciences Centre at the University of Saskatchewan, with support funding from Agriculture and Agri-Food Canada; we thank Drs. K. Brown and P. Zhu for their assistance. Total sediment analysis was done with J. Morse at Portland State University.
Supplementary Material
The Supplementary Material for this article can be found online at: https://www.frontiersin.org/articles/10.3389/fmars.2018.00302/full#supplementary-material
References
Abdi, D., Cade-Menun, B. J., Ziadi, N., and Parent, L. E. (2015). Compositional statistical analysis of soil 31P-NMR forms. Geoderma 257–258, 40–47. doi: 10.1016/j.geoderma.2015.03.019
Antweiler, R. C., Patton, C. J., and Taylor, H. E. (1996). Automated Colorimetric Methods for Determination of Nitrate Plus Nitrite, Nitrite, Ammonium and Orthophosphate Ions in Natural Water Samples. Report, USGS Report.
Baptista, A. M., Seaton, C., Wilkin, M. P., Riseman, S. F., Needoba, J. A., Maier, D., et al. (2015). Infrastructure for collaborative science and societal applications in the Columbia River estuary. Front. Earth Sci. 9, 659–682. doi: 10.1007/s11707-015-0540-5
Barbier, E. B., Hacker, S. D., Kennedy, C., Koch, E. W., Stier, A. C., and Silliman, B. R. (2011). The value of estuarine and coastal ecosystem services. Ecol. Monogr. 81, 169–193. doi: 10.1890/10-1510.1
Bricker, S. B., Longstaff, B., Dennison, W., Jones, A., Boicourt, K., Wicks, C., et al. (2008). Effects of nutrient enrichment in the nation's estuaries: a decade of change. Harmful Algae 8, 21–32. doi: 10.1016/j.hal.2008.08.028
Bridgham, S. D., Johnston, C. A., Schubauer-Berigan, J. P., and Weishampel, P. (2001). Phosphorus sorption dynamics in soils and coupling with surface and pore water in riverine wetlands. Soil Sci. Soc. Am. J. 65, 577–588. doi: 10.2136/sssaj2001.652577x
Brown, M. R., and Kornberg, A. (2004). Inorganic polyphosphate in the origin and survival of species. Proc. Natl. Acad. Sci. U.S.A. 101, 16085–16087. doi: 10.1073/pnas.0406909101
Cade-Menun, B. J. (2015). Improved peak identification in 31P-NMR spectra of environmental samples with a standardized method and peak library. Geoderma 257–258, 102–114. doi: 10.1016/j.geoderma.2014.12.016
Cade-Menun, B. J., and Liu, C. W. (2014). Solution 31P-NMR spectroscopy of soils from 2005-2013: a review of sample preparation and experimental parameters. Soil Soc. Am. J. 78, 19–37. doi: 10.2136/sssaj2013.05.0187dgs
Cade-Menun, B. J., Navaratnam, J. A., and Walbridge, M. R. (2006). Characterizing dissolved and particulate phosphorus in water with P-31 nuclear magnetic resonance spectroscopy. Environ. Sci. Technol. 40, 7874–7880. doi: 10.1021/es061843e
Cade-Menun, B. J., and Preston, C. M. (1996). A comparison of soil extraction procedures for 31P NMR spectroscopy. Soil Sci. 161, 770–785. doi: 10.1097/00010694-199611000-00006
Carman, R., Gunnar, E., and Damberg, C. (2000). Distribution of organic and inorganic phosphorus compounds in marine and lacustrine sediments: a 31P NMR study. Chem. Geol. 163, 101–114. doi: 10.1016/S0009-2541(99)00098-4
Celi, L. R., and Barberis, E. (2005). “Abiotic stabilzation of organic phosphorus in the environment,” in Organic Phosphorus in the Environment, eds B. L.Turner, E. Frossard, and D. S. Baldwin (Cambridge, MA: CABI Publishing), 113–132. doi: 10.1079/9780851998220.0113
Chawla, A., Jay, D. A., Baptista, A. M., Wilkin, M., and Seaton, C. (2008). Seasonal variability and estuary-shelf interactions in circulation dynamics of a river-dominated estuary. Estuaries Coasts. 31, 269–288. doi: 10.1007/s12237-007-9022-7
Cheesman, A. W., Turner, B. L., Inglett, P. W., and Reddy, K. R. (2010). Phosphorus transformations during decomposition of wetland macrophytes. Environ. Sci. Tech. 44, 9265–9271. doi: 10.1021/es102460h
Cheesman, A. W., Turner, B. L., and Reddy, K. R. (2014). Forms of organic phosphorus in wetland soils. Biogeosciences 11, 6697–6710. doi: 10.5194/bg-11-6697-2014
Cheesman, A. W., Turner, B. L., and Rocca, I. (2013). “Phosphorus characterization in wetland soils by solution Phosphorus-31 nuclear magnetic resonance spectroscopy,” in Methods in Biogeochemistry of Wetlands, eds R. D. DeLaune, C. J. Richardson, and J. P. Megonigal (Madison, WI: Soil Science Society of America), 639–665.
Condron, L. M., Turner, B. L., and Cade-Menun, B. J. (2005). “Chemistry and dynamics of soil organic phosphorus,” in Phosphorus Agriculture and the Environment, eds J. T. Sims and A. N. Sharpley (Madison, WI: Soil Science Society of America), 87–121.
Conley, D. J., Paerl, H. W., Howarth, R. W., Boesch, D. F., Seitzinger, S. P., Havens, K. E., et al. (2009). Controlling eutrophication: nitrogen and phosphorus. Science 323, 1014–1015. doi: 10.1126/science.1167755
Daniel, T. C., Sharpley, A. N., and Lemuyon, J. L. (1998). Agricultural phosphorus and eutrophication: a symposium review. J. Env. Qual. 27, 251–257. doi: 10.2134/jeq1998.00472425002700020002x
Defforey, D., Cade-Menun, B. J., and Paytan, A. (2017). A new solution 31 P NMR sample preparation scheme for marine sediments. Limnol. Oceanogr. Meth. 15, 381–393. doi: 10.1002/lom3.10166
Fox, L. E., Sager, S. L., and Wofsy, S. C. (1986). The chemical control of soluble phosphorus in the Amazon estuary. Geochim. Cosmochim. Acta 50, 783–794. doi: 10.1016/0016-7037(86)90354-6
Froelich, P. N. (1988). Kinetic control of dissolved phosphate in natural rivers and estuaries: a primer on the phosphate buffer mechanism. Limnol. Oceanogr. 33, 649–668. doi: 10.4319/lo.1988.33.4_part_2.0649
Gardolinski, P. C., Worsfold, P. J., and McKelvie, I. D. (2004). Seawater induced release and transformation of organic and inorganic phosphorus from river sediments. Water Res. 38, 688–692. doi: 10.1016/j.watres.2003.10.048
Gilbert, M., Needoba, J., Koch, C., Barnard, A., and Baptista, A. (2013). Nutrient loading and transformations in the Columbia River estuary determined by high-resolution in situ sensors. Estuaries Coasts. 36, 708–727. doi: 10.1007/s12237-013-9597-0
Grantham, B. A., Chan, F., Nielsen, K. J., Fox, D. S., Barth, J. A., Huyer, A., et al. (2004). Upwelling-driven nearshore hypoxia signals ecosystem and oceanographic changes in the northeast Pacific. Nature 429, 749–754. doi: 10.1038/nature02605
House, W. A., and Warwick, M. S. (1999). Interactions of phosphorus with sediments in the River Swale, Yorkshire, UK. Hydrol. Process. 13, 1103–1115. doi: 10.1002/(SICI)1099-1085(199905)13:7 < 1103::AID-HYP792>3.0.CO;2-6
Howarth, R., Chan, F., Conley, D. J., Garnier, J., Doney, S. C., Marino, R., et al. (2011). Coupled biogeochemical cycles: eutrophication and hypoxia in temperate estuaries and coastal marine ecosystems. Front. Ecol. Environ. 9, 18–26. doi: 10.1890/100008
Huyer, A. (1983). Coastal upwelling in the California current system. Prog. Oceanogr. 12, 259–284. doi: 10.1016/0079-6611(83)90010-1
Kellogg, L. E., and Bridgham, S. D. (2003). Phosphorus retention and movement across an ombrotrophic-minerotrophic peatland gradient. Biogeochemistry 63, 299–315. doi: 10.1023/A:1023387019765
Kornberg, A. (1995). Inorganic polyphosphate: toward making a forgotten polymer unforgettable. J. Bacteriol. 177, 491–496. doi: 10.1128/jb.177.3.491-496.1995
Kulaev, I. S., Vagabov, V. M., and Kulakovskaya, T. V. (eds.). (2004). “The occurence of polyphosphates in living organisms,” in The Biochemistry of Inorganic Polyphosphates (Hoboken, NJ: John Wiley and Sons), 37–44. doi: 10.1002/0470858192
Li, M., Whelan, M. J., Wang, G. Q., and White, S. M. (2013). Phosphorus sorption and buffering mechanisms in suspended sediments from the Yangtze estuary, and Hangzhou Bay, China. Biogeosciences 10, 3341–3348. doi: 10.5194/bg-10-3341-2013
Liu, J., Cade-Menun, B. J., Yang, J., Hu, Y., Liu, C. W., Tremblay, J., et al. (2018). Long-term land use affects phosphorus speciation and the composition of phosphorus cycling genes in agricultural soils. Front. Microbiol. 9:1643. doi: 10.3389/fmicb.2018.01643
McDowell, R. W., and Sharpley, A. N. (2003). Uptake and release of phosphorus from overland flow in a stream environment. J. Environ. Qual. 32, 937–948. doi: 10.2134/jeq2003.9370
McDowell, R. W., Stewart, I., and Cade-Menun, B. J. (2006). An examination of spin-lattice relaxation times for analysis of soil and manure extracts by liquid state phosphorus-31 nuclear magnetic resonance spectroscopy. J. Environ. Qual. 35, 293–302. doi: 10.2134/jeq2005.0285
Millenium Ecosystem Assessment (2006). Ecosystems and Human Well-being Synthesis. Washington, DC: Island Press. Available online at: https://www.millenniumassessment.org/documents/document.356.aspx.pdf
Monbet, P., McKelvie, I. D., and Worsfold, P. J. (2010). Sedimentary pools of phosphorus in the eutrophic Tamar estuary (SW England). J. Environ. Monitor. 12, 296–304. doi: 10.1039/B911429G
Murphy, J., and Riley, J. P. (1962). A modified single solution method for the determination of phosphate in natural waters. Anal. Chim. Acta 27, 31–36. doi: 10.1016/S0003-2670(00)88444-5
Nelson, D. W., and Sommers, L. E. (1996). “Total carbon, organic carbon, and organic matter,” in Methods of Soil Analysis, Part 3, Chemical Methods, ed D. L. Sparks (Madison, WI: Soil Science Society of America), 961–1010.
Noe, G. B., Scinto, L. J., Taylor, J., Childers, D. L., and Jones, R. D. (2003). Phosphorus cycling and partitioning in an oligotrophic everglades wetlands ecosytem: a radioisotope tracing study. Freshwater Biol. 48, 1993–2008. doi: 10.1046/j.1365-2427.2003.01143.x
Paerl, H. W. (2006). Assessing and managing nutrient-enhanced eutrophication in estuarine and coastal waters: interactive effects of human and climatic perturbations. Ecol. Eng. 26, 40–54. doi: 10.1016/j.ecoleng.2005.09.006
Patton, C. J., and Kryskalla, J. R. (2003). Methods of Analysis by the U.S. Geological Survey National Water Quality Laboratory - Evaluation of Alkaline Persulfate Digestion as an Alternative to Kjeldahl Digestion for Determination of Total and Dissolved Nitrogen and Phosphorus in Water, ed USGS (Denver, CO), 1–40. Available online at: https://nwql.usgs.gov/pubs/WRIR/WRIR-03-4174.pdf
Quiquampoix, H., and Mousain, D. (2005). Enzymatic hydrolysis of organic phosphorus, in Organic Phosphorus in the Environment (Cambridge, MA: CABI Publishing), 89–112.
R Core Team (2015). R: A Language and Environment for Statistical Computing. Vienna: R Foundation for Statistical Computing.
Ramette, A. (2007). Multivariate analyses in microbial ecology. FEMS Microbiol. Ecol. 62, 142–160. doi: 10.1111/j.1574-6941.2007.00375.x
Reddy, K. R., and DeLaune, R. D. (eds.). (2008). “Phosphorus,” in Biogeochemistry of Wetlands: Science and Applications (Boca Raton, FL: CRC Press, Taylor and Francis Group, LLC), 325–404. doi: 10.1201/9780203491454.ch9
Reddy, K. R., Kadlec, R. H., Flaig, E., and Gale, P. M. (1999). Phosphorus retention in streams and wetlands: a review. Crit. Rev. Environ. Sci. Technol. 29, 83–146. doi: 10.1080/10643389991259182
Richardson, C. J. (1985). Mechanisms controlling phosphorus retention capacity in freshwater wetlands. Science 228, 1424–1427. doi: 10.1126/science.228.4706.1424
Richardson, C. J., and Marshall, P. E. (1986). Processes controlling movement, storage, and export of phosphorus in a fen peatland. Ecol. Mongr. 56, 279–302. doi: 10.2307/1942548
Richardson, C. J., and Reddy, K. R. (2013). “Methods for soil phosphorus characterization and analysis of wetland soils,” in Methods in Biogeochemistry of Wetlands Number 10, eds R. D. DeLaune, K. R. Reddy and C. J. Richardson (Madison, WI: Soil Science Society of America), 603–638.
Roegner, C. G., Needoba, J. A., and Baptista, A. M. (2011). Coastal upwelling supplies oxygen-depleted water to the Columbia River estuary. PLoS ONE 6:e18672 doi: 10.1371/journal.pone.0018672
Schneider, K. D., Cade-Menun, B. J., Lynch, D. H., and Voroney, R. P. (2016). Soil phosphorus forms from organic and forage fields. Soil Sci. 80, 328–340. doi: 10.2136/sssaj2015.09.0340
Sherwood, C., Jay, D. A., Harvey, R. B., Hamilton, P., and Simenstad, C. A. (1990). Historical changes in the Columbia River estuary. Prog. Oceanogr. 25, 299–352. doi: 10.1016/0079-6611(90)90011-P
Sherwood, C. R., and Creager, J. S. (1990). Sedimentary geology of the Columbia River estuary. Prog. Oceanogr. 25, 15–80. doi: 10.1016/0079-6611(90)90003-K
Sherwood, C. R., Creager, J. S., Roy, E. H., Gelfenbaum, G., and Dempsey, T. (1984). Sedimentary Processes and Environments in the Columbia River Estuary, Columbia River Estuary Data Development Program. Astoria, OR: Columbia River Estuary Study Taskforce.
Sholkovitz, E. R. (1976). The flocculation of dissolved organic and inorganic matter during the mixing of river and seawater. Geochim. Cosmochim. Acta 40, 831–845. doi: 10.1016/0016-7037(76)90035-1
Simenstad, C. A., Small, L. F., McIntire, C. D., Jay, D. A., and Sherwood, C. (1990). Columbia River estuary studies: an introduction to the estuary, a brief history, and prior studies. Prog. Oceanogr. 25, 1–13. doi: 10.1016/0079-6611(90)90002-J
Small, L. F., and Prahl, F. G. (2004). A particle conveyor belt process in the Columbia River estuary: evidence from chlorophyll a and particulate organic carbon. Estuaries 27, 999–1013. doi: 10.1007/BF02803426
Stevenson, F. J. (1986). Cycles of Soil: Carbon, Nitrogen, Phosphorus, Sulfur, Micronutrients. New York, NY: John Wiley and Sons.
Suzumura, M., and Kamatani, A. (1995a). Mineralization of inositol hexaphosphate in aerobic and anaerobic marine sediments: implications for the phosphorous cycle. Geochim. Cosmochim. Acta 59, 1021–1026. doi: 10.1016/0016-7037(95)00006-2
Suzumura, M., and Kamatani, A. (1995b). Origin and distribution of inositol hexaphosphate in estuarine and coastal sediments. Limnol. Oceanogr. 40, 1254–1261. doi: 10.4319/lo.1995.40.7.1254
Tiessen, H., Ballester, M. V., and Salcedo, I. (2011). “Phosphorus and global change,” in Soil Biology, eds E. K. Bünemann, A. Oberson and E. Frossard (Berlin, Heidelberg: Springer), 295–316.
Turner, B. L., and Newman, S. (2005). Phosphorus cycling in wetland soils. J. Environ. Qual. 34, 1921–1929. doi: 10.2134/jeq2005.0060
Turner, B. L., Newman, S., and Reddy, K. R. (2006). Overestimation of organic phosphorus in wetland soils by alkaline extraction and molybdate colorimetry. Environ. Sci. Tech. 40, 3349–3354. doi: 10.1021/es052442m
Turner, B. L., Paphazy, M. J., Haygarth, P. M., and Mckelvie, I. D. (2002). Inositol phosphates in the environment. Phil. Trans. R. Soc. London Ser. B 357, 449–469. doi: 10.1098/rstb.2001.0837
Turner, B. L., and Weckström, K. (2009). Phytate as a novel phosphorus-specific paleo-indicator in aquatic sediments. J. Paleolimnol. 42, 391–400. doi: 10.1007/s.10933-008-9283-6
US EPA (1983a). “Phosphorus, all forms Method 365.1 (colorimetric, automated ascorbic acid),” in Methods for Chemical Analysis of Water and Wastes EPA-600/4-79-020 (Cincinnati, OH: Environmental Monitoring and Support Laboratory, Office of Research and Development, US EPA).
US EPA (1983b). “Sample Preservation,” in Methods for Chemical Analysis of Water and Wastes, EPA-600/4-79-020 (Cincinnati, OH: Environmental Monitoring and Support Laboratory, Office of Research and Development, US EPA).
Vaithiyanathan, P., and Richardson, C. J. (1997). Nutrient profiles in the everglades: examination along the eutrophication gradient. Sci. Total Environ. 205, 81–95. doi: 10.1016/S0048-9697(97)00191-5
van Beusekom, J. E. E., and Brockmann, U. H. (1998). Transformation of phosphorus in the elbe estuary. Estuaries 21, 518–526. doi: 10.2307/1353291
Williams, B. L., and Silcock, D. J. (2001). Does nitrogen addition to raised bogs influence peat phosphorus pools? Biogeochemistry 53, 307–321. doi: 10.1023/A:1010675601613
Wright, R. B., Lockaby, B. G., and Walbridge, M. R. (2001). Phosphorus availability in an artificially flooded southeastern floodplain forest soil. Soil Sci. Am. J. 65, 1293–1302. doi: 10.2136/sssaj2001.6541293x
Young, E. O., Ross, D. S., Cade-Menun, B. J., and Liu, C. W. (2013). Phosphorus speciation in riparian soils: a phosphorus-31 nuclear magnetic resonance spectroscopy and enzyme hyrdolysis study. Soil Sci. Soc. Am. J. 77, 1636–1647. doi: 10.2136/sssaj2012.0313
Zhang, R., Wu, F., He, Z., Zheng, J., Song, B., and Jin, L. (2009). Phosphorus composition in sediments from seven different trophic lakes, China: a phosphorus-31 NMR study. J. Environ. Qual. 38, 353–359. doi: 10.2134/jeq2007.0616
Keywords: phosphorus, 31P-nuclear magnetic resonance, sediments, river, estuary
Citation: Watson SJ, Cade-Menun BJ, Needoba JA and Peterson TD (2018) Phosphorus Forms in Sediments of a River-Dominated Estuary. Front. Mar. Sci. 5:302. doi: 10.3389/fmars.2018.00302
Received: 28 February 2018; Accepted: 08 August 2018;
Published: 04 September 2018.
Edited by:
Toshi Nagata, The University of Tokyo, JapanReviewed by:
Masahiro Suzumura, National Institute of Advanced Industrial Science and Technology (AIST), JapanSue Newman, South Florida Water Management District, United States
Copyright © 2018 Watson, Needoba and Peterson, and Her Majesty the Queen in Right of Canada, as represented by the Minister of Agriculture and Agri-Food Canada. This is an open access article distributed under the terms of the Creative Commons Attribution License (CC BY). The use, distribution or reproduction in other forums is permitted, provided the original author(s) and the copyright owner(s) are credited and that the original publication in this journal is cited, in accordance with accepted academic practice. No use, distribution or reproduction is permitted which does not comply with these terms.
*Correspondence: Sheree J. Watson, c2hlcmVld0BoYXdhaWkuZWR1