 Emily Fox
 Erin Meyer
 Alison R. Taylor
- Department of Biology and Marine Biology, University of North Carolina, Wilmington, Wilmington, NC, United States
Despite the oceanographic and geological significance of coccolithophores, the cellular mechanisms that underlie the intracellular production and subsequent secretion of their CaCO3 coccoliths remain poorly understood. Tools for labeling coccoliths and coccospheres in order to track their production would be of great value. We therefore evaluated the use of calcein, a derivative of fluorescein, as a method to fluorescently label coccoliths. The calcein method readily labeled pre-existing coccospheres in a range of coccolithophore species, including diploid and haploid life history phases, without compromising the coccolith structure. Calcite staining was verified though epifluorescence and confocal microscopy, and both stained and unstained cells and coccoliths were readily distinguished using flow cytometry. The fluorescence of stained coccoliths was retained for >3 days allowing us to confirm their polar secretion by distinguishing pre-existing coccoliths from the accumulation and distribution of non-fluorescent coccoliths produced after calcein exposure. The calcein treatment had no significant effect on photosynthetic physiology, external calcite morphology, or growth rates of the cells over an 8-day period. The calcein staining method therefore represents a simple non-invasive, non-toxic optical technique to ‘tag’ calcium carbonate coccoliths and track their production in response to environmental manipulations or pharmacological treatments. Moreover, calcein staining of the coccosphere allowed for heterogenous patterns of calcification, growth, and cell division to be detected in a population of cells. This is the first description of the use of calcein to stain the biomineral structures of calcifying phytoplankton and this approach has the potential to be applied to detailed cytological investigations as well as high-throughput analysis of cultured cells or field populations.
Introduction
Biomineralization in Marine Systems
Coccolithophores are a group of calcifying unicellular marine phytoplankton recognized for production of extracellular calcium carbonate (CaCO3) plates known as coccoliths. Coccolithophores are the most abundant marine calcifying organism in the world’s oceans (Taylor A.R. et al., 2017) and dominate annual global pelagic calcification, estimated at around 1.6 ± 0.3 Pg y-1 (Balch et al., 2007). They therefore play a significant role in biogeochemical cycles by removing CO2 from the atmosphere via photosynthesis, while also contributing to the carbonate counter pump through the use of bicarbonate () to produce coccoliths. Coccolithophore calcification plays a critical role in carbon export dynamics (Balch, 2018) as the calcite structures facilitate formation of organic aggregates in marine snow, and ultimately coccolith sedimentation results in calcareous deposits on the ocean floor which gave rise to major chalk formations over geological time-scales (De Vargas et al., 2007). In spite of their global importance, the cellular mechanism by which coccolithophores produce their CaCO3 coccoliths, the regulation of this process, and the coordination of coccolith production with cellular metabolism remain poorly understood. Nevertheless, it is well established that diploid heterococcolith bearing species produce coccoliths formed by complex radial crystal units within the cell before secreting them onto the cell surface where they are integrated into the covering of the cell termed the coccosphere. Coccolithophores exhibit a haplo-diplontic life cycle with motile haploid cells producing calcified scales comprising numerous simple calcite rhombohedra suggesting a distinct calcification mechanism (see Taylor A.R. et al., 2017 and references therein).
The study of coccolithophore calcification has been facilitated by a variety of experimental techniques. For example, flow cytometry has been used for over 20 years to investigate natural populations of coccolithophores (Brussaard et al., 2001; Jacquet et al., 2002; Wilson et al., 2002) and in laboratory studies of single coccolithophore strains (Green et al., 1996). The distinctive side scatter (SSC) signature of the outer coccoliths, a measure of cell surface granularity or roughness, enables coccolithophore populations to be identified, although in mixed populations non-coccolith cell wall structures or granular morphologies may confound interpretation. Polarized light flow cytometry and circularly polarized light microscopy have also been successfully applied to selectively detect coccolithophores and to estimate PIC and individual coccolith mass in selected species (Beaufort, 2005; von Dassow et al., 2012; Fuertes et al., 2014). However, implementation of these methods requires specialized optics. An additional challenge is how to track coccolith production at the single cell level. Thus, we tested a simple non-invasive optical technique to ‘tag’ the external calcium carbonate produced by live coccolithophore cells with the fluorescent calcium binding dye calcein.
Calcein is a fluorescein-based metallofluorescent indicator (Figure 1) that has been used in complexometric determination of Ca2+ in solution due to its reversible fluorescence in the bound/unbound form (Markuszewski, 1976). When excited with blue light (of ∼488 nm) the calcein-Ca2+ complex emits a green fluorescence (∼520 nm) with a pH optimum between pH 8–9 (Markuszewski, 1976). Calcein also binds to Ca2+ in biominerals, and has been used extensively to label calcified skeletal structures of marine metazoans such as fishes, molluscs, cnidarians, echinoderms, and crustaceans (see Table 1 for review of literature). However, few studies have utilized calcein to study calcification in protists. One notable exception are the foraminifera, in which calcein serves as a valuable non-toxic probe used to discriminate pre-existing and newly formed calcite chambers, understand various processes associated with shell production, examine ontogenetic variations, facilitate validation of biomineral proxies, and detect meifaunal calcifiers in situ (Bernhard et al., 2004, 2015; Bentov et al., 2009; Dissard et al., 2009; Kurtarkar et al., 2015).
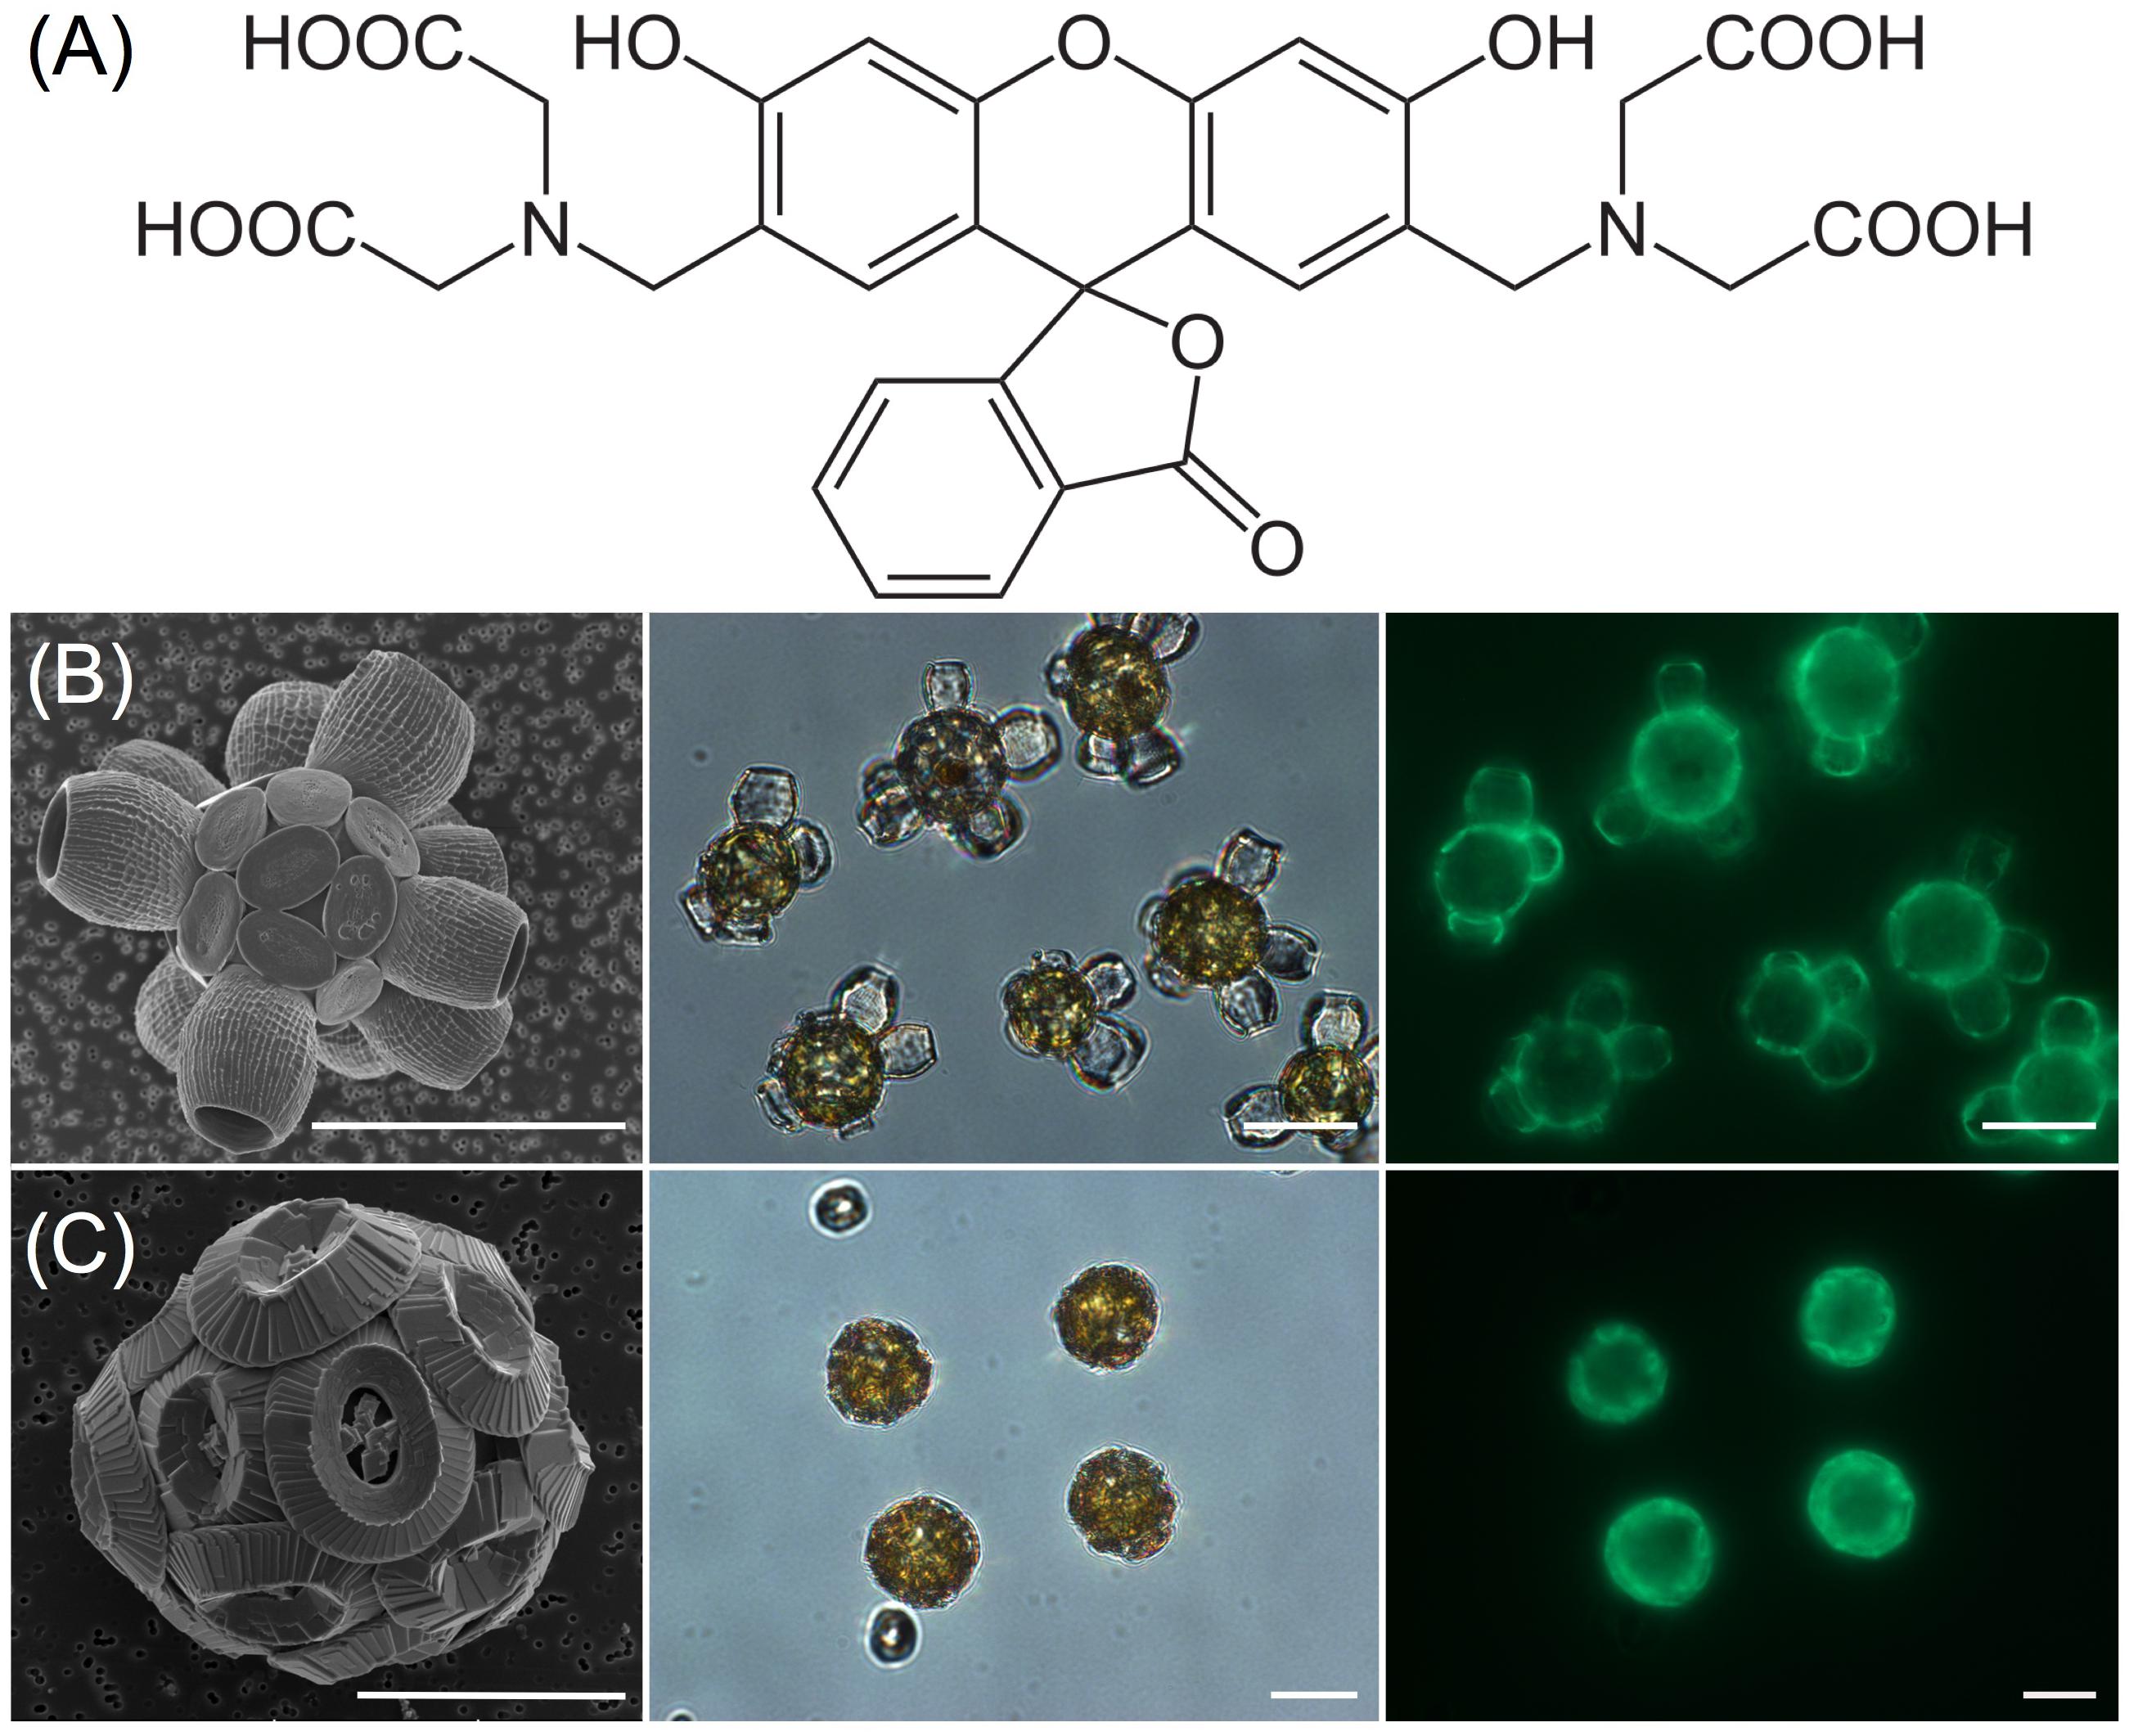
FIGURE 1. Calcein staining of calcium carbonate coccoliths using epifluorescence. (A) The structure of calcein (Bis[N,N-bis(carboxymethyl)aminomethyl]fluorescein) with four carboxyl groups that coordinate and bind with Ca2+ ions, thereby altering fluorescence properties. (B) Scyphosphaera apsteinii, from left to right; SEM, DIC micrograph and corresponding calcein epifluorescence (FITC filterset) image of cells 24 h after calcein staining and washing protocol. (C) Coccolithus braarudii, from left to right; SEM, DIC micrograph, and corresponding calcein epifluorescence image of cells 24 h after calcein staining and washing protocol. Scale bars represent 10 μm.
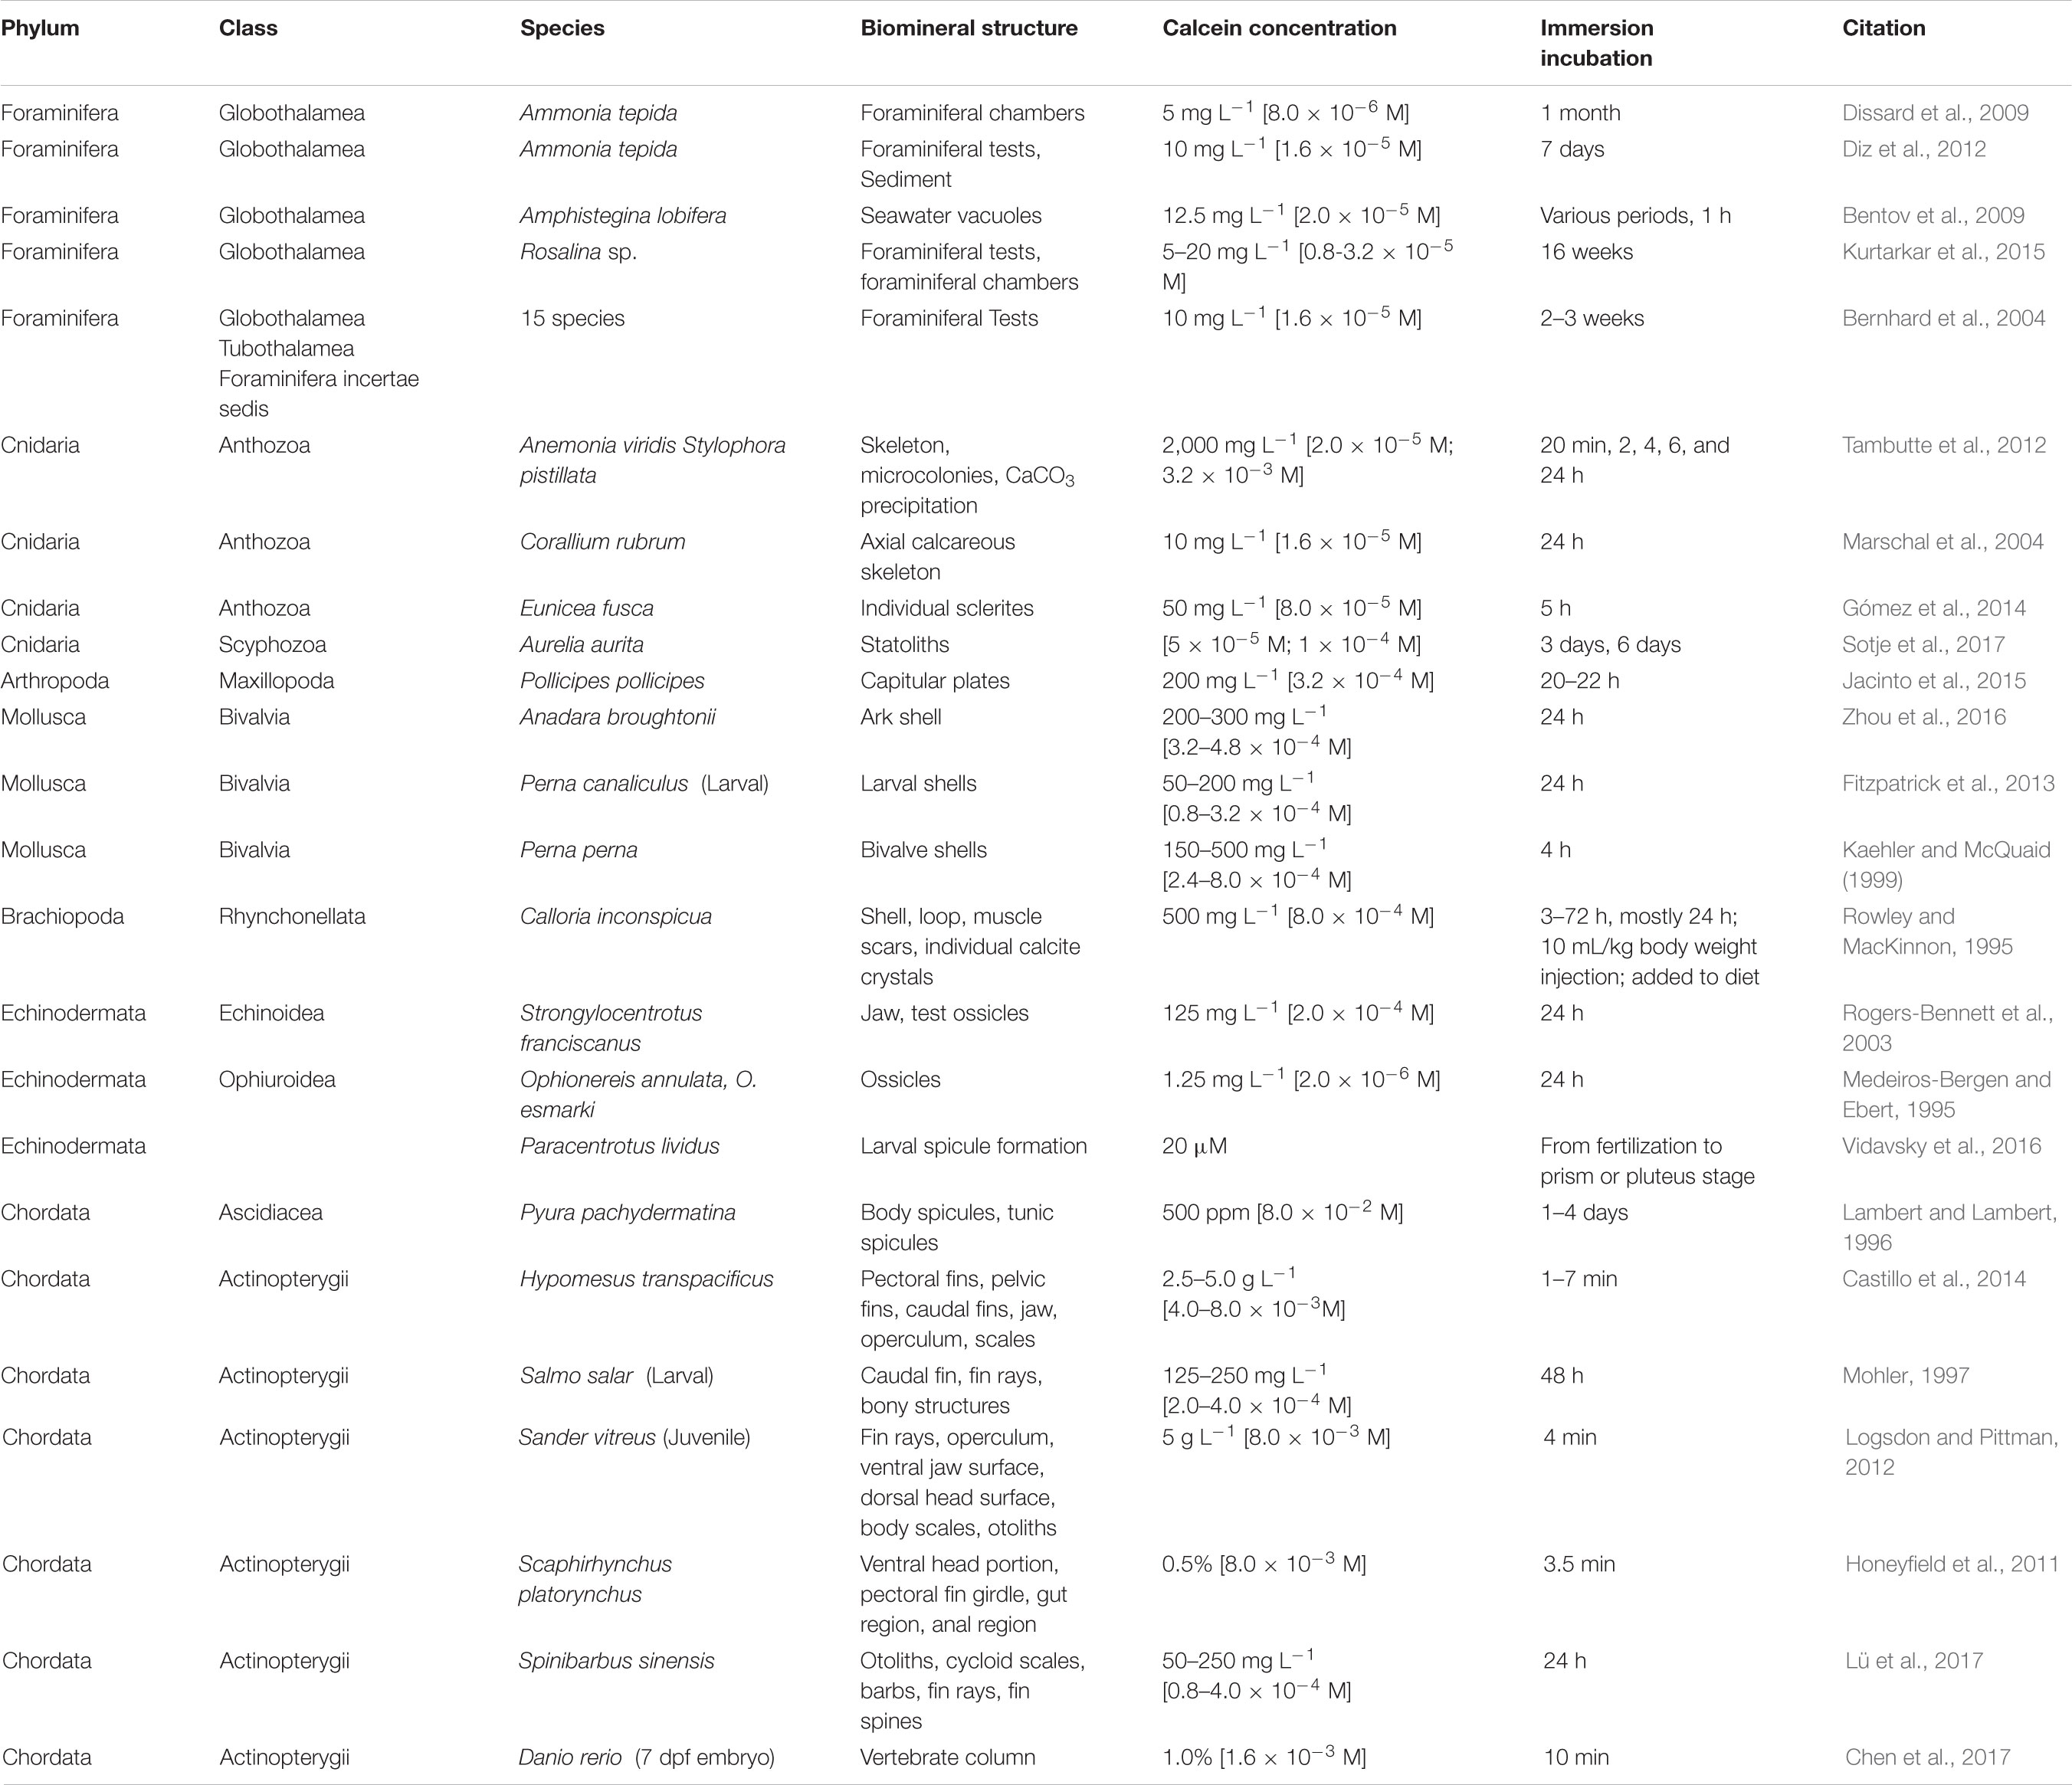
TABLE 1. Survey of the use of calcein to investigate biomineral structures in marine organisms.
Our goal was to evaluate the effectiveness of calcein staining to fluorescently label coccolithophore calcite and validate its application to calcification studies. The study focused on five species of coccolithophore representing three of the four major coccolithophore groups (Isochrysidales, Coccolithales, and Zygodiscales). In order to validate the calcein method for coccolithophore research we devised several objectives; (1) Develop a calcein staining protocol and verify in five species of coccolithophore, (2) Confirm the calcein staining protocol did not significantly affect coccolith structure, (3) Verify that calcein staining has no short or long-term deleterious effects on live coccolithophore cells, (4) Test the stability of calcein staining over multiple days, (5) Use calcein staining to track coccolith production/calcification, and (6) Evaluate the potential for use in flow cytometry.
Materials and Methods
Phytoplankton Culture
Diploid heterococcolithophore strains of Scyphosphaera apsteinii (RCC 1456), Calcidiscus leptoporus (RCC 1130), Gephyrocapsa oceanica (RCC 1303) and haploid holococcolithophore strains of Coccolithus braarudii (RCC 3777) and Syracosphaera pulchra (RCC 1461) were obtained from the Roscoff Culture Collection, France. Heterococcolithophore strains of Emiliania huxleyi B92/11 and Coccolithus braarudii 182G were obtained from the Plymouth Algal Culture Collection, United Kingdom. All strains were maintained in semi-continuous unialgal batches of 40 mL in disposable polystyrene flasks containing autoclaved and filter-sterilized seawater supplemented with either LH nutrients and silicon (for S. apsteinii, C. leptoporus, G. oceanica) or F/2 nutrients (for E. huxleyi and C. braarudii). Cultures were grown at 16°C in a 14:10 light dark cycle with a light intensity of ∼100 μmol m-2 s-1 with sub-culturing at mid-late exponential growth phase. For calcein staining, cells were harvested from cultures that were early to mid-exponential phase, as determined by cell counting using either a Sedgwick Rafter chamber or hemocytometer. Under the growth conditions specified above, this was typically 6–8 days for E. huxleyi and G. oceanica, 8–14 days for C. leptoporus and C. braarudii, and 10–16 days for S. apsteinii.
Calcein Staining
We reviewed pertinent literature in which calcein has been used to mark CaCO3 biominerals (Table 1) to determine a suitable staining protocol for single cells. The best staining results were achieved by making a fresh 20 mM stock of calcein (Bis[N,N-bis(carboxymethyl)aminomethyl]fluorescein, C0875, Sigma-Aldrich, Figure 1A) in dry dimethyl sulfoxide (DMSO) immediately prior to each experiment and storing on ice in the dark until needed. For staining, 5 mL aliquots of cells were transferred to a 7 mL polystyrene bijou bottle and allowed to settle, before drawing off the culture media and replacing with 5 mL of F/2 seawater that was buffered with 2 mM HEPEs and adjusted to pH 8.2 with NaOH. Calcein staining was started by adding 50 μL of the 20 mM calcein stock to the 5 mL aliquot of cells in buffered F/2 seawater followed by gentle mixing. This resulted in a final concentration of 0.2 mM calcein with 0.01% DMSO. Use of buffered F/2 was important because addition of 0.2 mM calcein to unbuffered culture media caused a decrease of ∼0.75 pH unit that could affect homeostasis, recalcification, and structure of coccoliths (Taylor et al., 2011). Addition of 0.2 mM calcein to buffered F/2 resulted in drop of <0.2 pH unit. Bijou bottles were replaced in the incubator under normal growth conditions and gently inverted a few times every 15 min to insure cells were resuspended and well mixed during the 2 h calcein staining period. After 2 h incubation, cells were washed at least three times by gentle centrifugation (1,000–3,000 rpm for 1 min), removal of supernatant, and addition of fresh F/2 or LH media depending on the species.
Growth Rate and Physiology
Growth rates were determined after calcein treatment by daily cell counting using a Sedgwick Rafter chamber for the larger species and a hemocytometer for the smaller species. For each replicate culture (N = 4), a 1.5 mL aliquot of cells was treated with calcein as described above, or DMSO alone (control). After incubation and washing, the aliquots of cells were placed into 40 mL of fresh media in a culture flask and cell numbers determined at the same time each day over several days (up to 10 days for the slower growing species). A minimum of five grids and 300 cells were counted for each independent culture replicate. Cell numbers (N) over the days (t) in exponential growth (maximum growth) were used to determine growth rate (r) using the equation:
With doublings d-1 calculated:
Photophysiology measurements were also determined after a 2 h calcein treatment (as above) and compared with control cells that had only been treated with DMSO. The quantum yield of photosystem II for dark adapted cells (Fv/Fm) was determined using an Aqua Pen AP-100 (PSI, Drasov, Czechia). An aliquot of cells from each treatment replicate (N = 4) was dark adapted at 16°C for 10 min before placing in a spectrophotometry cuvette for Fv/Fm measurements. An average of three measurements (with a 20 s delay between each) was taken for every replicate.
SEM Analysis of Coccolith Structure
For SEM observations, 1.5 mL aliquots of cells were filtered onto 13 mm 0.4 μm isopore filters (Merck Millipore Ltd.) and rinsed with 5 mL of Nanopure water buffered with 1 mM HEPES to pH 8.0 to remove salts without affecting the coccolith calcite. Filters were air-dried, mounted onto an aluminum SEM stub with carbon adhesive tabs before sputter coating with 10 nm Pt/Pd. Samples were imaged using a Phillips XL-FEG SEM in high resolution secondary electron mode with a primary beam acceleration of 5 KeV and spot size 3.
Confocal Imaging
Following staining and washing, the cells were transferred to 35 mm glass coverslip petri dishes and visualized using a Leica SP8 confocal microscope supported by LASX (Leica) application suite for acquisition and analysis. A 488 nm laser was used to excite both calcein and chlorophyll, the emissions of which were collected at 500–520 nm and 650–750 nm, respectively. To minimize photodamage of the chloroplasts and avoid any photobleaching of the calcein stained coccoliths, laser strength was set to ≤3% and photomultiplier voltages were set to 680 and 550 V for calcein and chlorophyll channels, respectively. A pinhole of 1.5 Airy units was used with a high numerical aperture ×40 or ×63 oil immersion lens resulting in a confocal optical thickness of 1.04 and 0.90 μm, respectively. Lower (at the coverslip) and mid optical sections were acquired though each group of cells that were subsequently scored for calcein staining. A look-up table (‘glow under-over’) was applied in order to determine pixel saturation, and cells were scored as intensely stained when >20% of their calcein signal reached pixel saturation.
Flow Cytometry
A BD FACS Celesta flow cytometer (FC) was used to analyze samples of stained and unstained coccolithophores. A 488 nm excitation laser with a 530 ± 30 nm FITC emission filter (labeled BB515 channel) was used to detect calcein fluorescence and a 695 ± 40 nm PerCP-Cy5.5 filter to detect chlorophyll autofluorescence. An unstained mixed sample of S. apsteinii (the largest coccolithophore at ∼25 μm diameter) and E. huxleyi (the smallest at ∼4 μm diameter) was run to ensure that the full size range of the species investigated could be detected and adequately discriminated. Mixing of coccolithophore samples by inversion of the sample tube immediately prior to mounting on the cytometer was especially important for the larger heavier species because they can sediment rapidly. Detector settings for SSC, forward scatter (FSC), FITC, and Chl were subsequently set for each species to ensure adequate signal collection over five decades on a logarithmic scale when comparing stained and unstained samples. Each species was calcein labeled for 2 h according to the procedure described above, washed three times by gentle centrifugation and resuspended in fresh culture media before FC analysis. Optimal flow and detector settings were established for stained E. huxleyi and C. braarudii before running the unstained samples with the same cytometer parameters. Mixtures of stained and unstained cells were also analyzed. No specific gating was applied, but in some cases a low threshold was applied to the FSC to eliminate spurious events due to debris or bacteria. Either 5,000, 10,000, or 20,000 cells were counted for any given experiment. All flow cytometer trials were run on duplicate cultures in two independent experiments yielding reproducible results. FlowJo (Ashland, OR, United States) or Flowing Software version 2.5.1 (Perttu Terho, Turku Centre for Biotechnology) was used for data visualization and construction of dot plots.
Results
Calcein Labeling and Confocal Imaging of Coccolithophores
Calcein staining trials using epi-fluorescence demonstrated the intense staining of coccolith calcite (Figures 1B,C) that persisted for 24 h. Examination of stained, washed cells with confocal imaging allowed for increased sensitivity and higher spatial resolution of the fluorescence signal, especially for tracking production of new coccoliths. For each species, 100% of cells were stained using the buffered calcein protocol (Figure 2). Stain intensity was generally strong but varied among the population, with a proportion of cells in any given field exhibiting a saturated signal (Supplementary Figure S1). Discarded coccoliths or empty coccospheres were also strongly labeled (not shown). Staining of coccoliths was heterogenous as some morphological features of the coccoliths exhibited more intense calcein fluorescence signal (Figure 3). Detailed morphological features of the coccoliths were therefore visible in the calcein channel, suggesting preferential staining of specific crystal edges of the coccoliths (Figure 3) or where access to Ca2+ ions within the biomineral structure was greater. For example, the edges of radial crystals were labeled brightly in C. leptoporus and C. braarudii. Holococcoliths from haploid phases were also readily labeled by incubation with calcein (Figure 4).
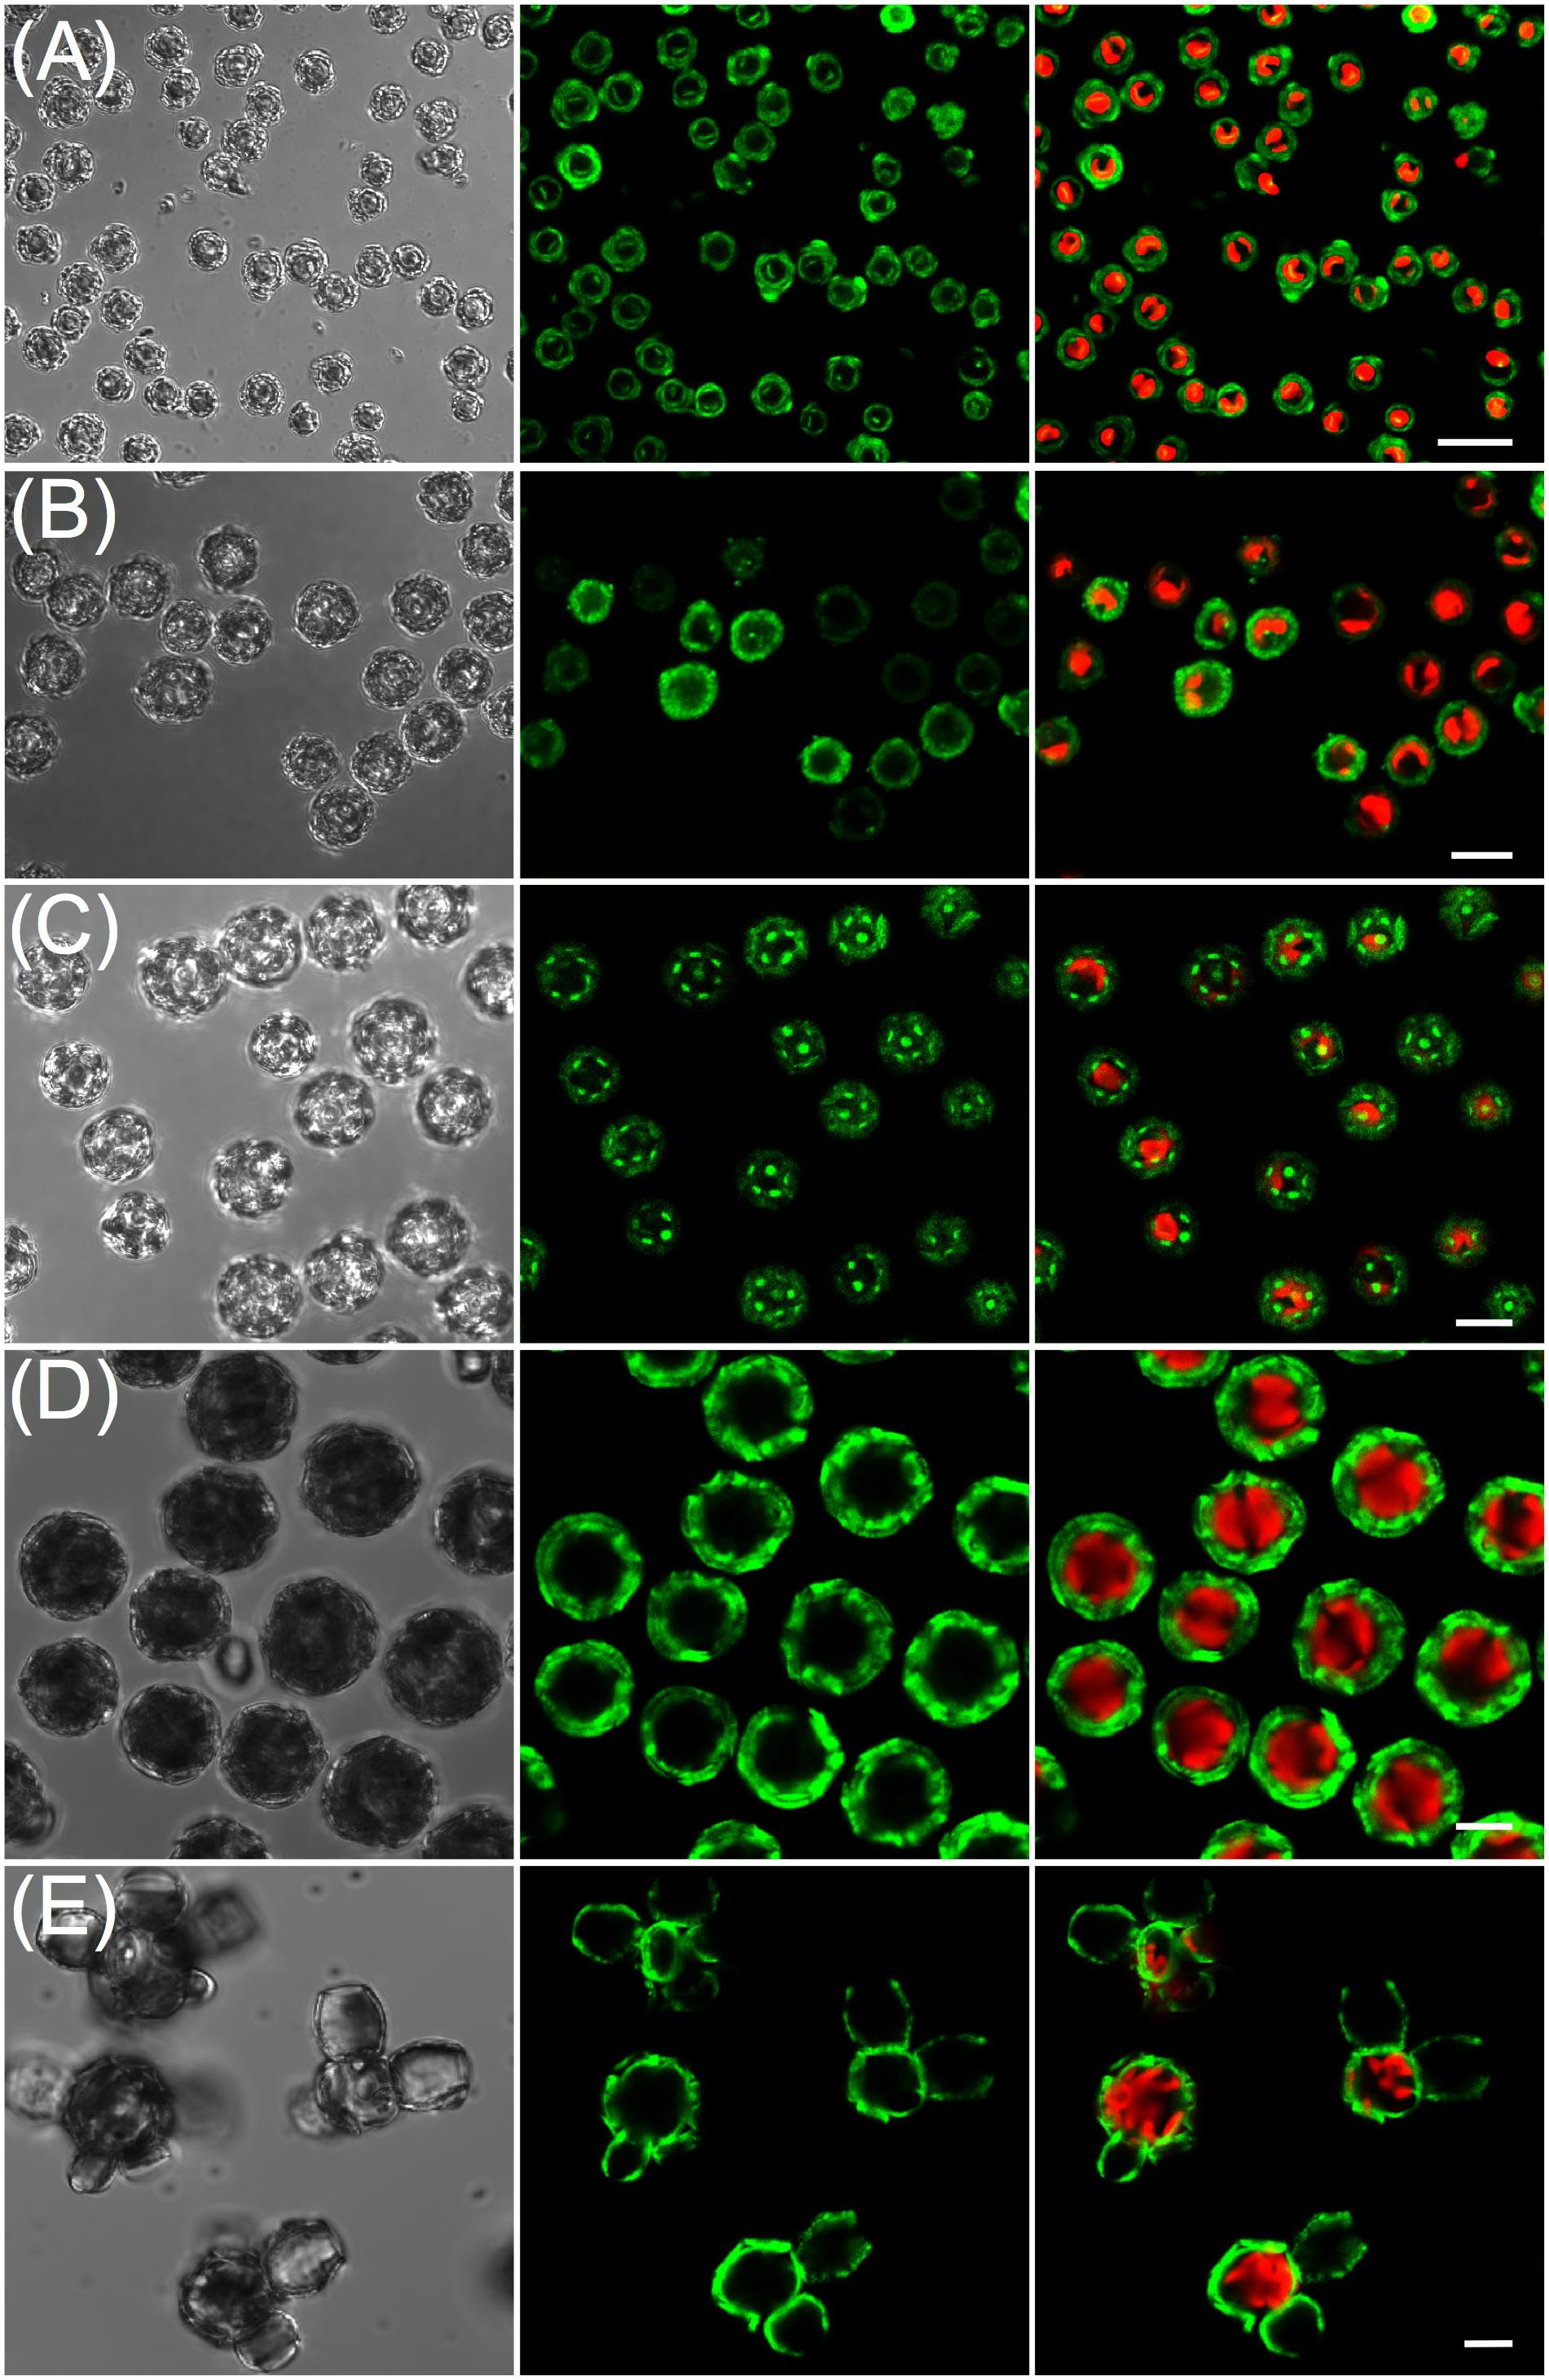
FIGURE 2. Confocal microscopy of coccolithophore species stained with calcein. Five species of heterococcolithophore cultures were stained for 2 h with 0.2 mM calcein in buffered FSW and then washed before confocal imaging. (A) Emiliania huxleyi; (B) Gephyrocapsa oceanica; (C) Calcidiscus leptoporus; (D) Coccolithus braarudii; (E) Scyphosphaera apsteinii. Left panels show cells viewed in differential-phase contrast (DIC), middle panels show the calcein channel, and the right hand panel is the chlorophyll autofluorescence (shown in red) with overlay of calcein fluorescence (shown in green). Scale bars represent 10 μm.
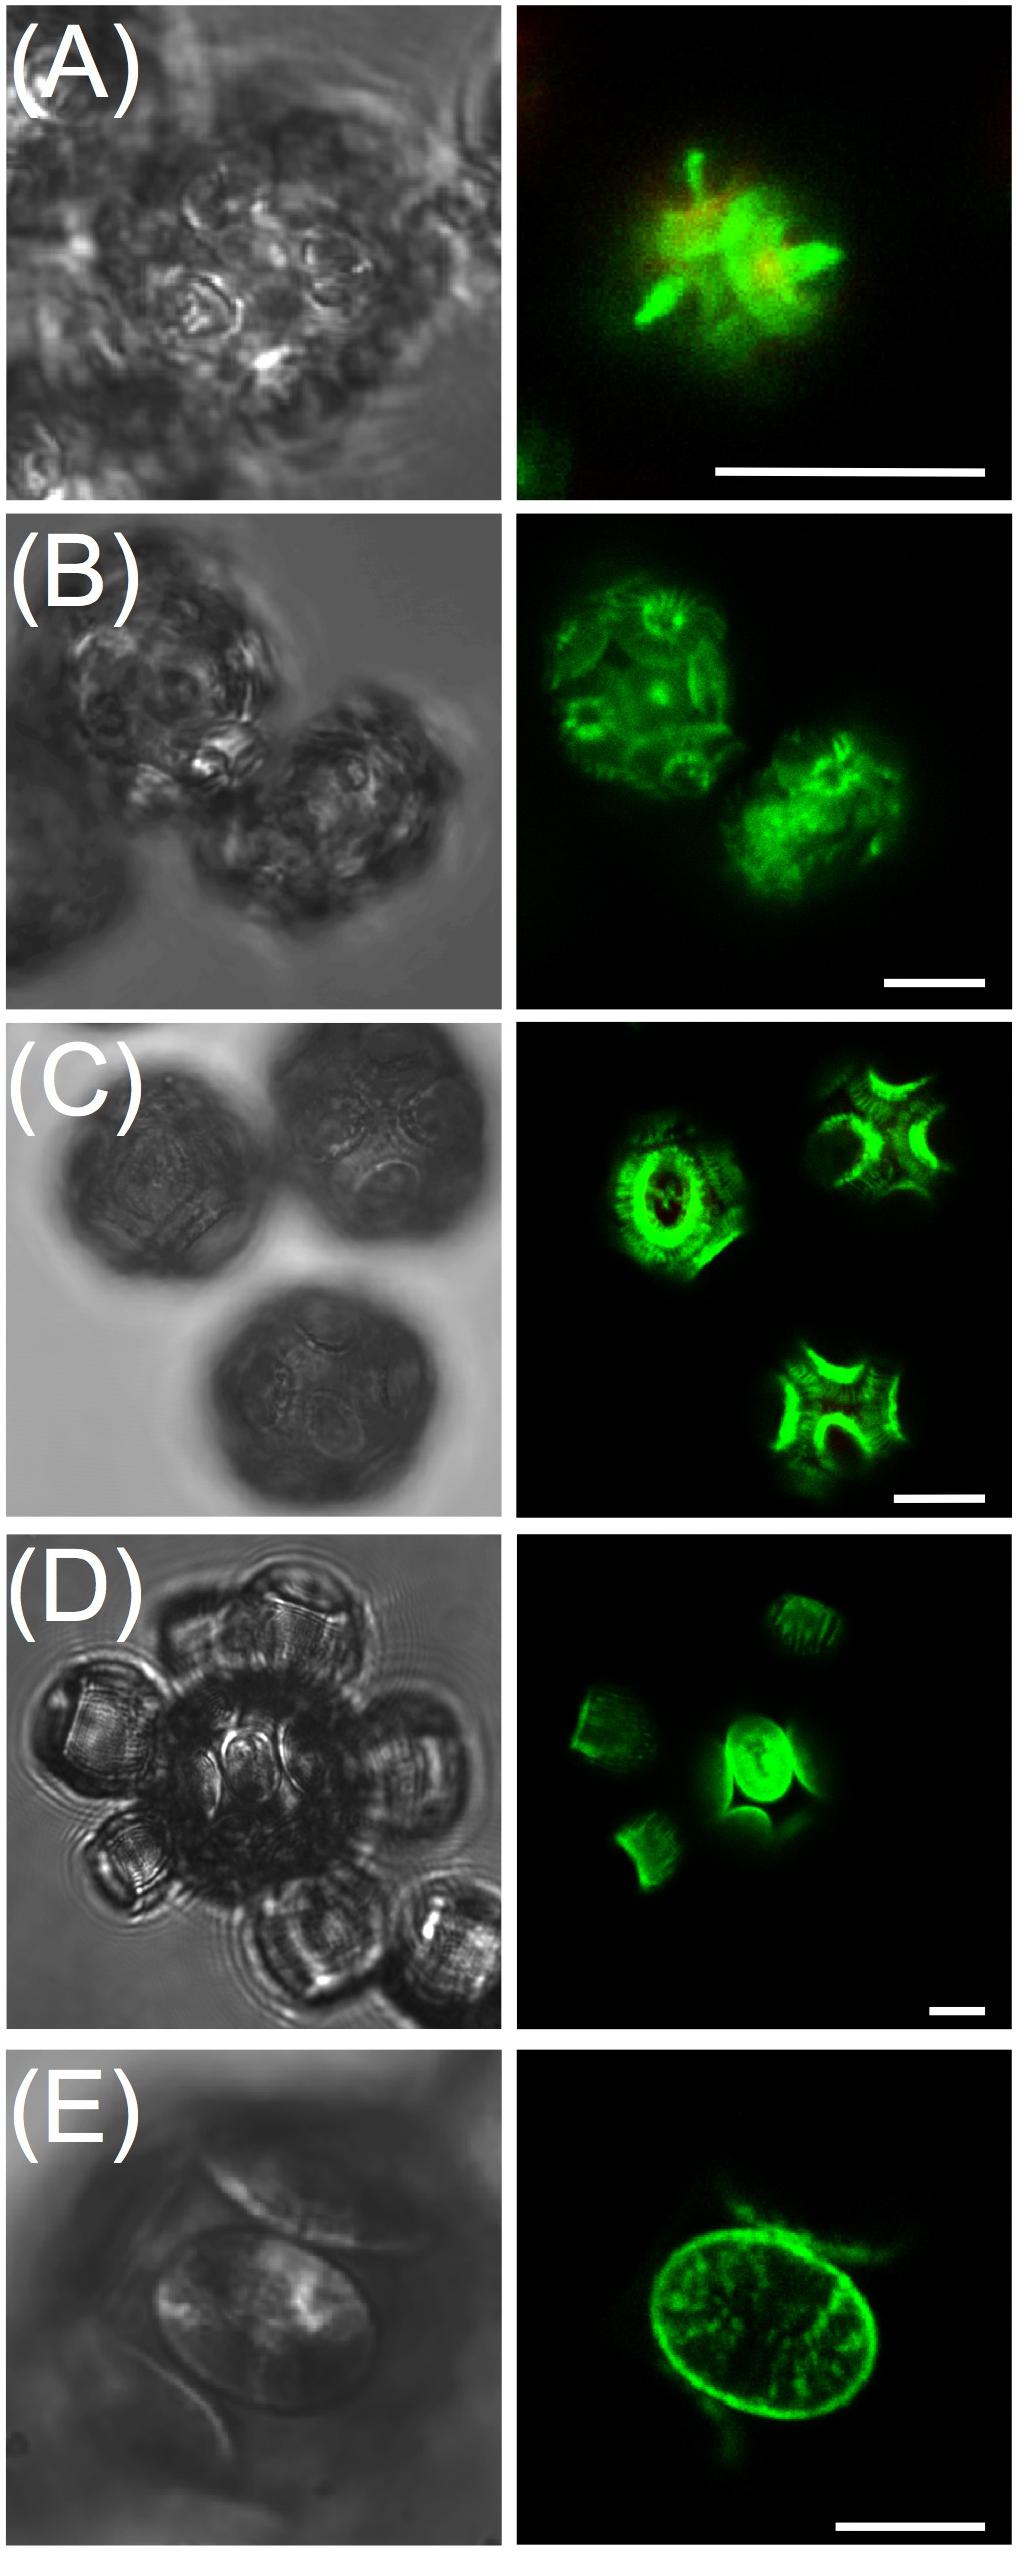
FIGURE 3. Calcein labeled coccoliths. Confocal sections illustrating the heterogeneous calcein labeling of heterococcoliths. (A) Gephyrocapsa oceanica; (B) Calcidiscus leptoporus; (C) Coccolithus braarudii; (D) Scyphosphaera apsteinii. (E) Detail of a murolith of S. apsteinii. Scale bars represent 5 μm.
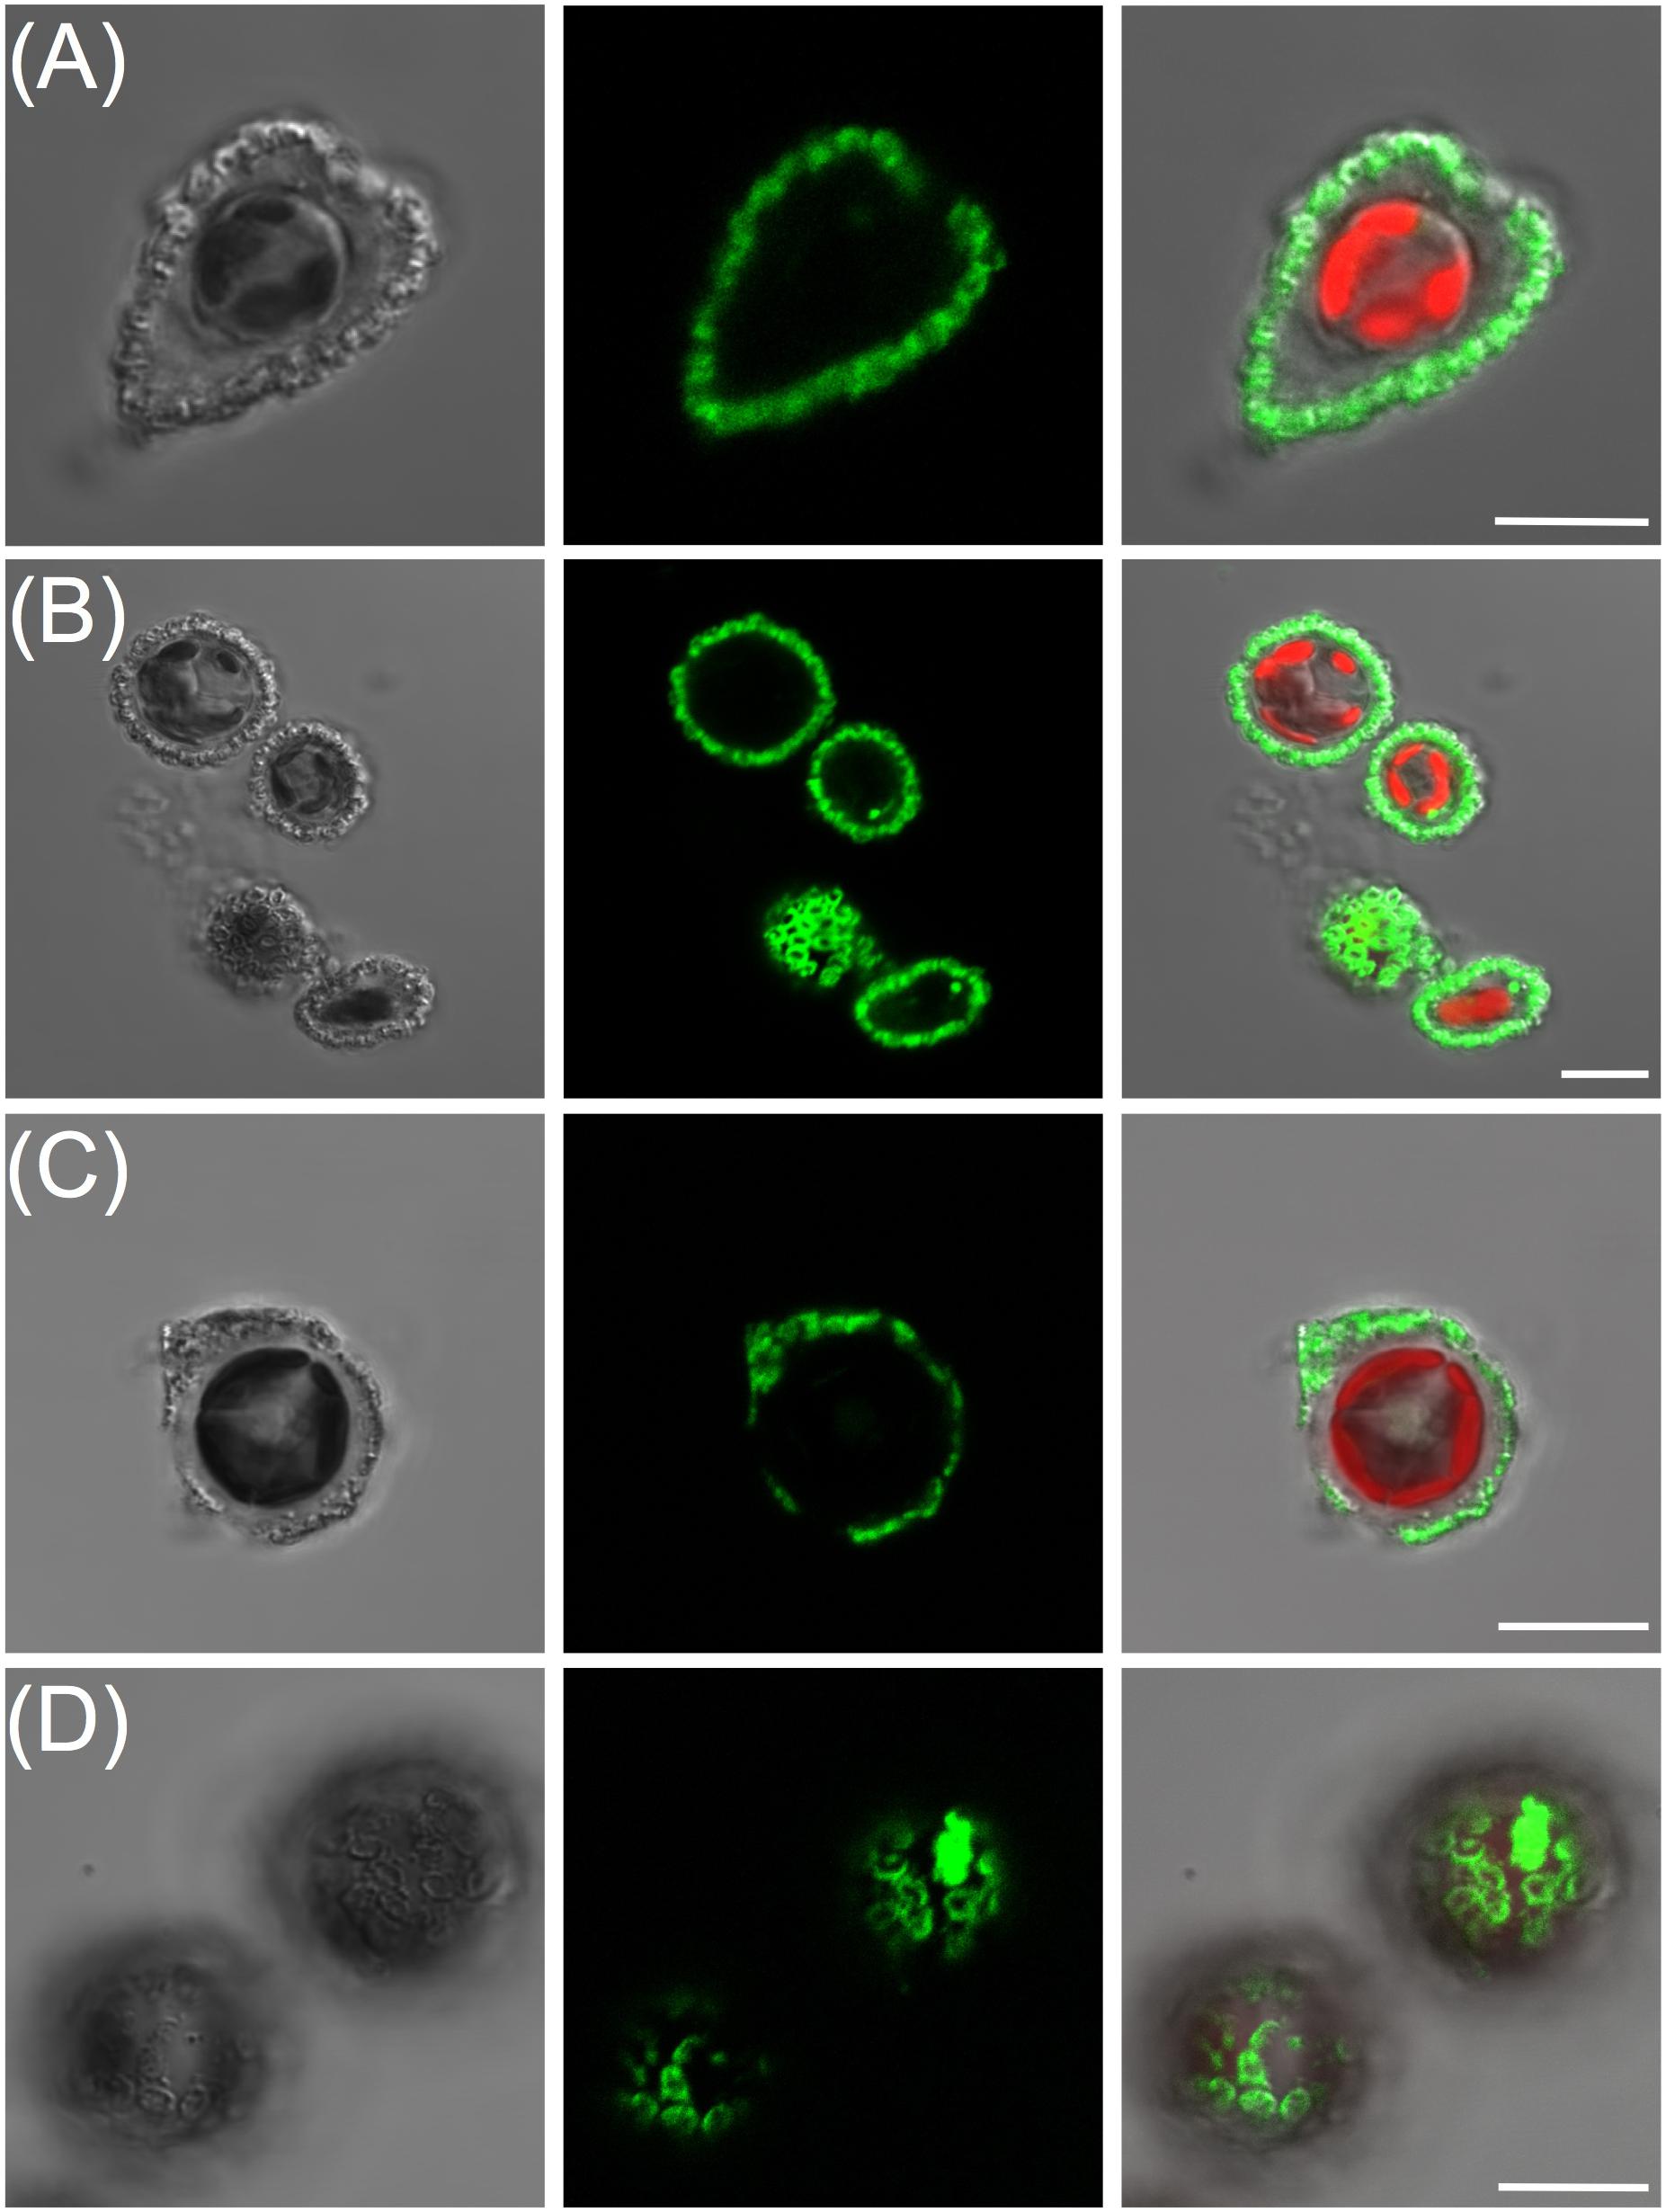
FIGURE 4. Calcein readily labels holococcolith bearing strains. From left to right panels are DIC, calcein, and overlay of DIC, calcein and chlorophyll. (A) Syracosphaera pulchra showing brightly labeled holococcoliths associated with the organic layer surrounding the cell. (B) Lower confocal section through haploid S. pulchra cells showing intense rings of fluorescence corresponding to holococcoliths imaged at the coverslip surface. (C) Coccolithus braarudii haploid holococcolith stage showing stained holococcoliths and (D) lower confocal section closest to the cover-slip showing ring-like pattern of calcein stained holococcoliths. Scale bars represent 10 μm.
In order to validate the calcein labeling method as an approach to study coccolithophore calcification, we first conducted SEM analysis to examine whether the 2 h calcein treatment affected coccolith structure. No defects were found when the external culture medium was HEPES buffered and adjusted to pH 8.2 prior to addition of the calcein (Figure 5A), even though this resulted in a ∼0.2 pH unit drop in the extracellular medium. We also examined whether cells exposed to the dye maintained normal photosynthetic physiology (Fv/Fm) immediately post-labeling and subsequently maintained normal growth rates over an 8-day period (Figures 5B,C). No significant differences were observed in quantum yield of photosynthesis following a 2 h calcein staining period (N = 4 independent replicates, p ≧ 0.1 Student’s t-test). Similarly, for each species examined, no significant effect on exponential phase growth rate was observed, and dividing cells were frequently observed in cultures that were monitored over several hours (e.g., Figure 5D, N = 3 independent replicates, p ≧ 0.4, Student’s t-test). Together these data demonstrate a 2 h calcein treatment had no immediate or longer-term detrimental effect on cell division, metabolism, or homeostasis, which is consistent with lack of toxicity that is widely reported in the calcein literature.
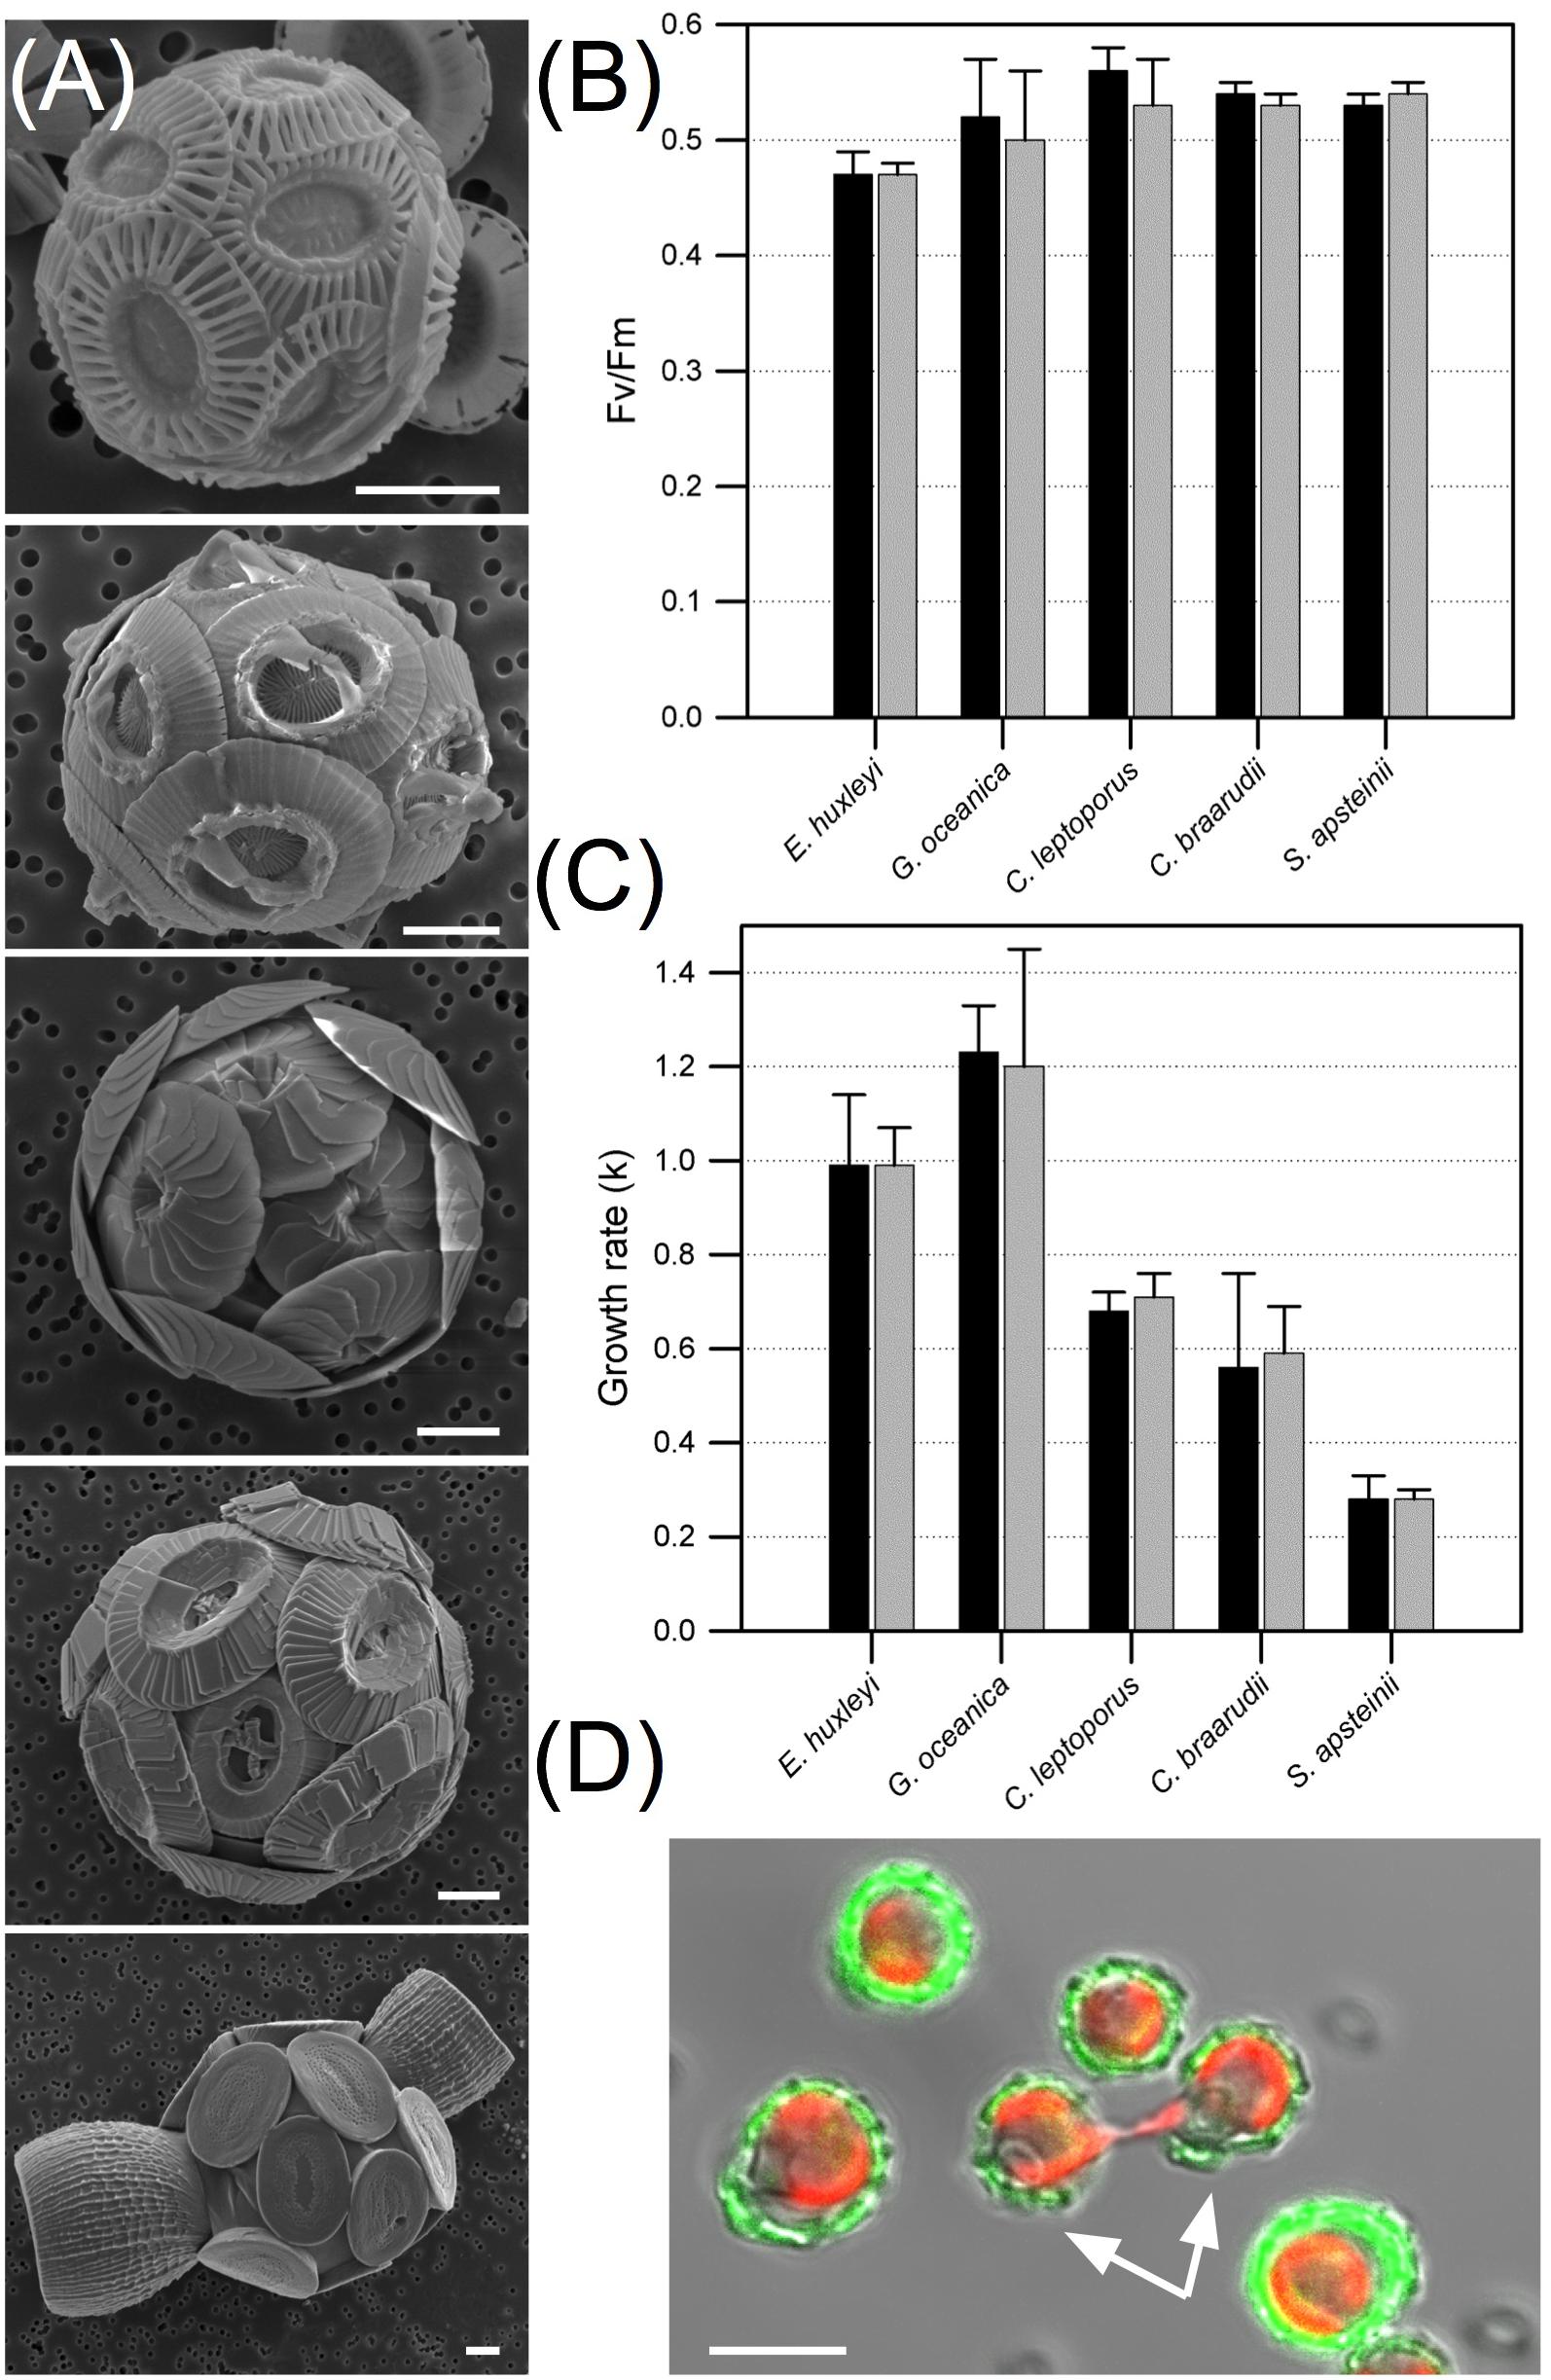
FIGURE 5. Growth, physiology and coccolith structure are unaffected by calcein treatment. (A) Scanning electron micrographs showing representative coccolithophore cells treated for 2 h with calcein in buffered seawater media. Species from top; Emiliania huxleyi, Gephyrocapsa oceanica, Coccolithus braarudii, Calcidiscus leptoporus, and Scyphosphaera apsteinii. Scale bars represent 2 μm. (B) Quantum yield of photosystem II (Fv/Fm) of dark adapted cells processed for 2 h in the presence (gray bars) and absence (DMSO only, black bars) of calcein (N = 4 independent replicates for each species ± SD, no significant differences with t-test, p ≧ 0.1). (C) Growth rates (k) of coccolithophores determined over 8 days post-calcein staining (gray bars) compared to 2 h treatment with DMSO solvent alone (black bars; N = 3 independent replicates for each species ± SD, no significant differences with t-test, p ≧ 0.4). (D) Dividing E. huxleyi cells (indicated with white arrows) 8 h after calcein labeling. Scale bar represents 5 μm.
Having established the efficacy of the labeling protocol, we tested whether new coccolith production could be tracked by calcein labeling, washing, and tracking coccolith fluorescence over 3 days. Production of new (unlabeled) heterococcoliths was demonstrated for each species (Figure 6) which typically exhibited a non-random distribution (e.g., Figures 6C,D), with new coccoliths integrated into the coccosphere in the same region. Calcein labeling also proved a useful tool to detect metabolically quiescent cells in a population of coccolithophores (Figure 7). In the case of cells harvested from an early exponential phase E. huxleyi culture, the majority of cells examined after 10 h incubation in the light had produced multiple new unstained coccoliths (Figure 7A). However, in populations from a late exponential to stationary phase culture, a subset of cells continued to calcify and divide by 12 h post-staining while the rest of the population remained quiescent, as evidenced by cells with intact and completely stained coccospheres (i.e., no new coccoliths produced and no cell division). The same batch of cells sampled 40 h post staining showed the majority of cells had resumed calcification with a few retaining mostly stained coccoliths showing they were yet to fully resume calcification and cell division.
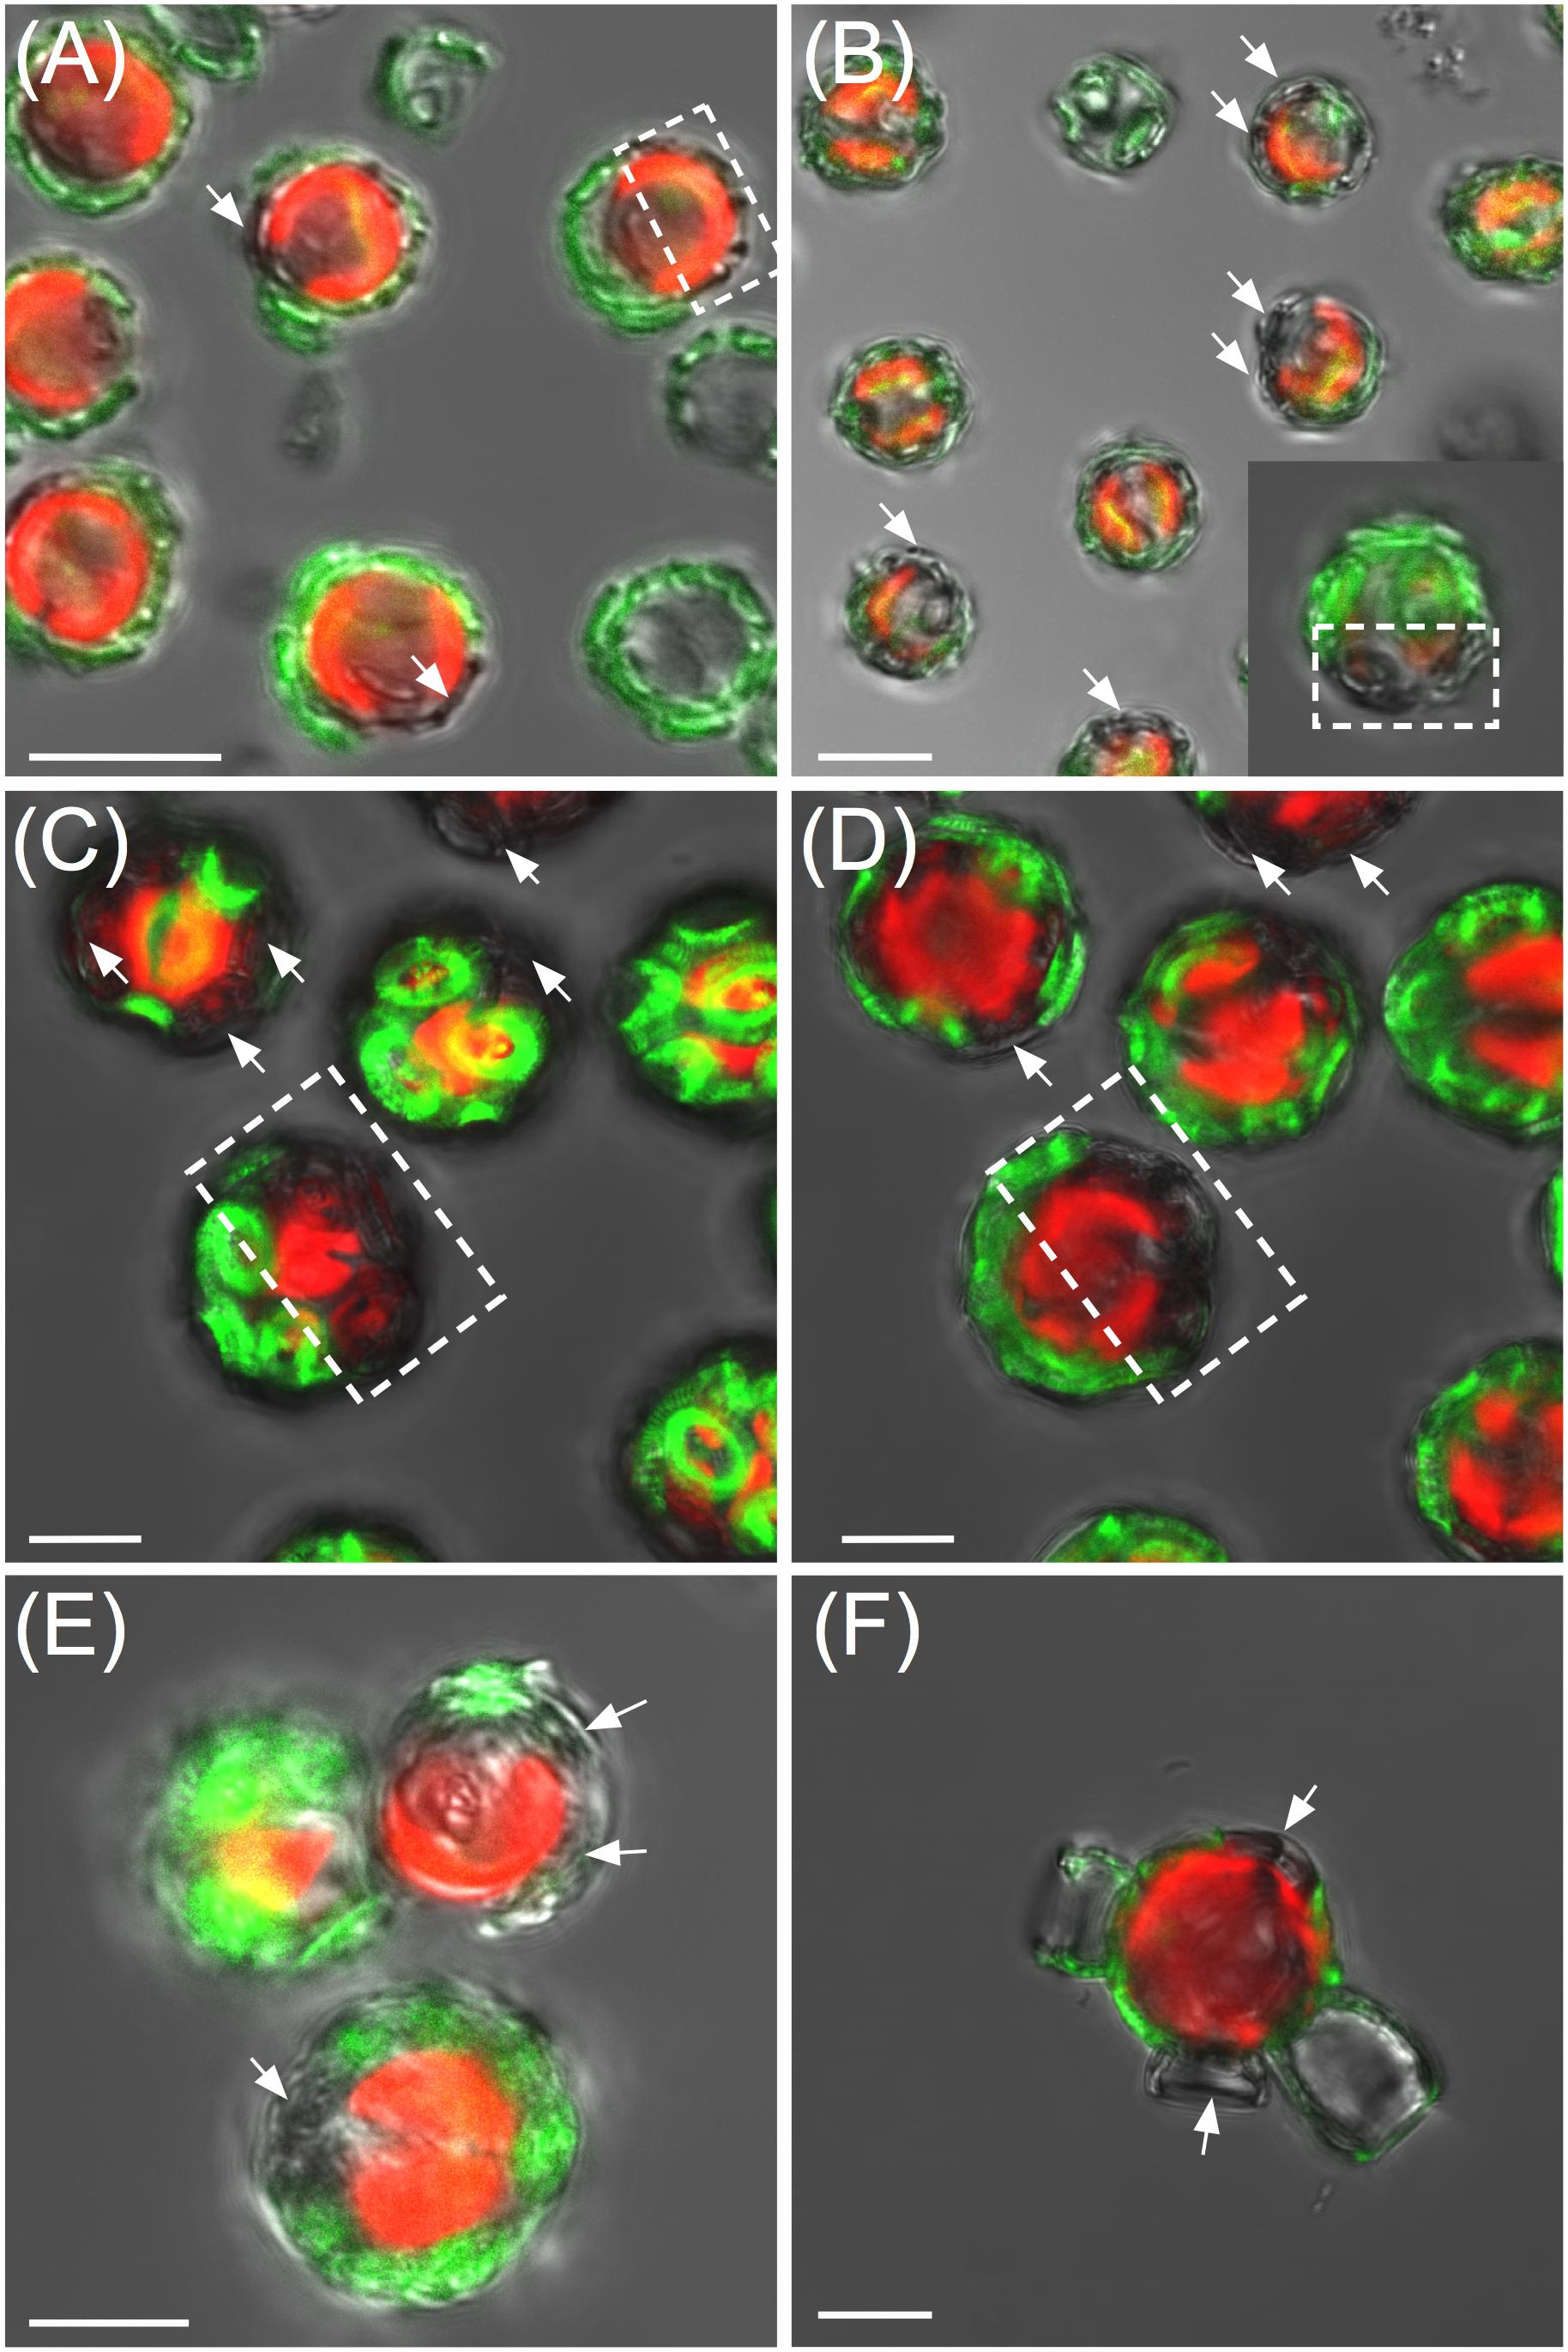
FIGURE 6. Tracking of heterococcolith production using calcein. (A) Emiliania huxleyi 10 h post-staining showing cells that have secreted several new coccoliths, examples highlighted with arrows. In some cells, a clear polarity was observed in the position of the newly synthesized coccoliths (unstained, highlighted by dotted box). (B) Gephyrocapsa oceanica 10 h post-staining. (C) Coccolithus braarudii 24 h post-staining. (D) Mid-section of the same Coccolithus braarudii cells in (C). (E) Calcidiscus leptoporus 18 h post-staining. (F) Scyphosphaera apsteinii 24 h post-staining. Fluorescence was retained for individual coccoliths for at least 72 h, although overall fluorescence per cell diminished as new coccoliths were produced and cells divided. Scale bars represent 5 μm.
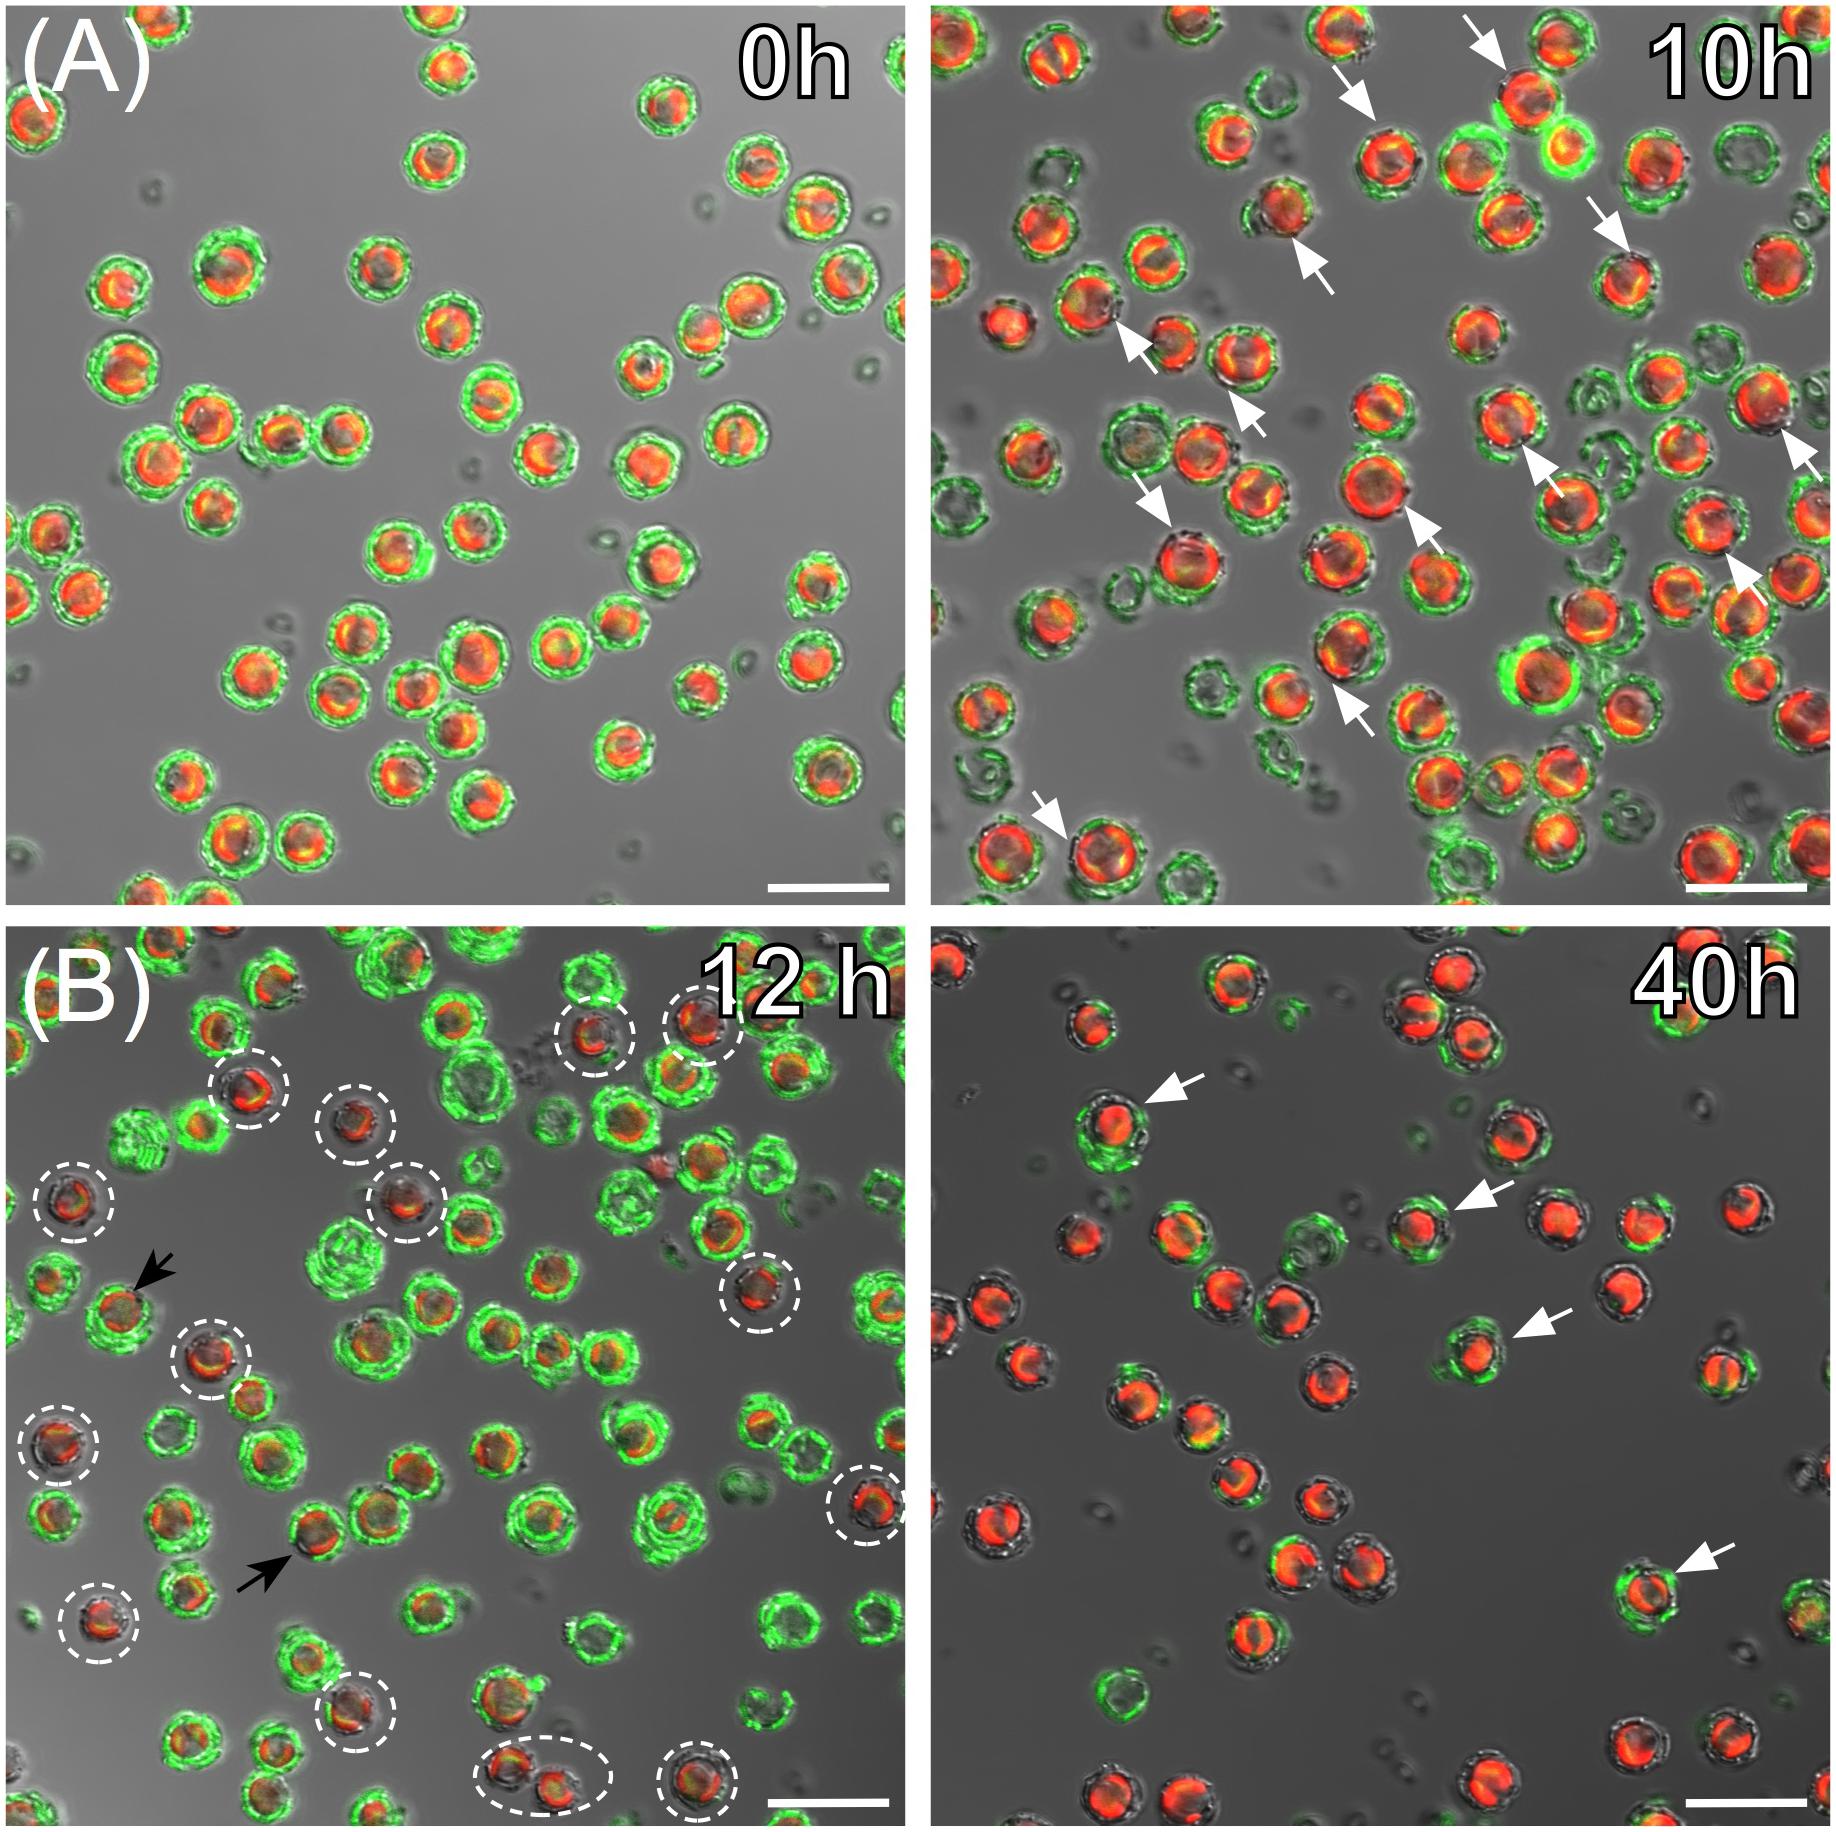
FIGURE 7. Visualizing growth dynamics and calcification in exponential and stationary cultures of Emiliania huxleyi. (A) DIC, calcein (green), and chlorophyll (red) confocal overlay images of cells from an early exponential phase culture immediately after calcein staining (0 h left panel) and 10 h post-staining (right panel). By 10 h, the majority of cells have secreted new unstained coccoliths (examples indicated with white arrows). (B) Cells from a stationary phase culture after 12 h post-calcein staining in fresh nutrient replete media (left), and after 40 h in nutrient replete media (right). At 12 h a sub-set of cells (dotted circles) have calcified and are actively dividing among a population of cells that appear metabolically inactive as evidenced by intact, stained coccospheres. After 40 h in nutrient replete conditions all cells have resumed calcification and cell division which is supported by coccospheres with none or just 1–2 fluorescent coccoliths. A few cells (white arrows) still have the majority of their coccoliths labeled with calcein, suggesting a recent resumption of calcification compared to the majority of cells.
Calcein Analysis Using Flow Cytometry
The potential application of the calcein method to high throughput modes of detection was examined with flow cytometry. First, a mixed population of unstained S. apsteinii and E. huxleyi were analyzed in the flow cytometer to establish suitable detector settings and ensure that the full size range of species were amenable to detection and quantification (Supplementary Figure S2). FSC (proxy for particle size) and SSC (granularity/roughness) signals were lower for E. huxleyi than S. apsteinii, as expected based on their very different size and coccolith morphology (Figure 5A). Next, stained and unstained samples of E. huxleyi (Figure 8) and the much larger C. braarudii (Figure 9) were analyzed. For each species, unstained and stained cells and detached coccoliths were clearly discriminated in the BB515 channel (calcein green fluorescence) but were no different in the PerCp-Cy5 (chlorophyll) channel. A background green fluorescence signal was detected for unstained cells in the calcein channel, which likely reflects a degree of cross-talk with plastid autofluorescence. This could be eliminated with a bespoke emission filter and/or application of compensation protocols.
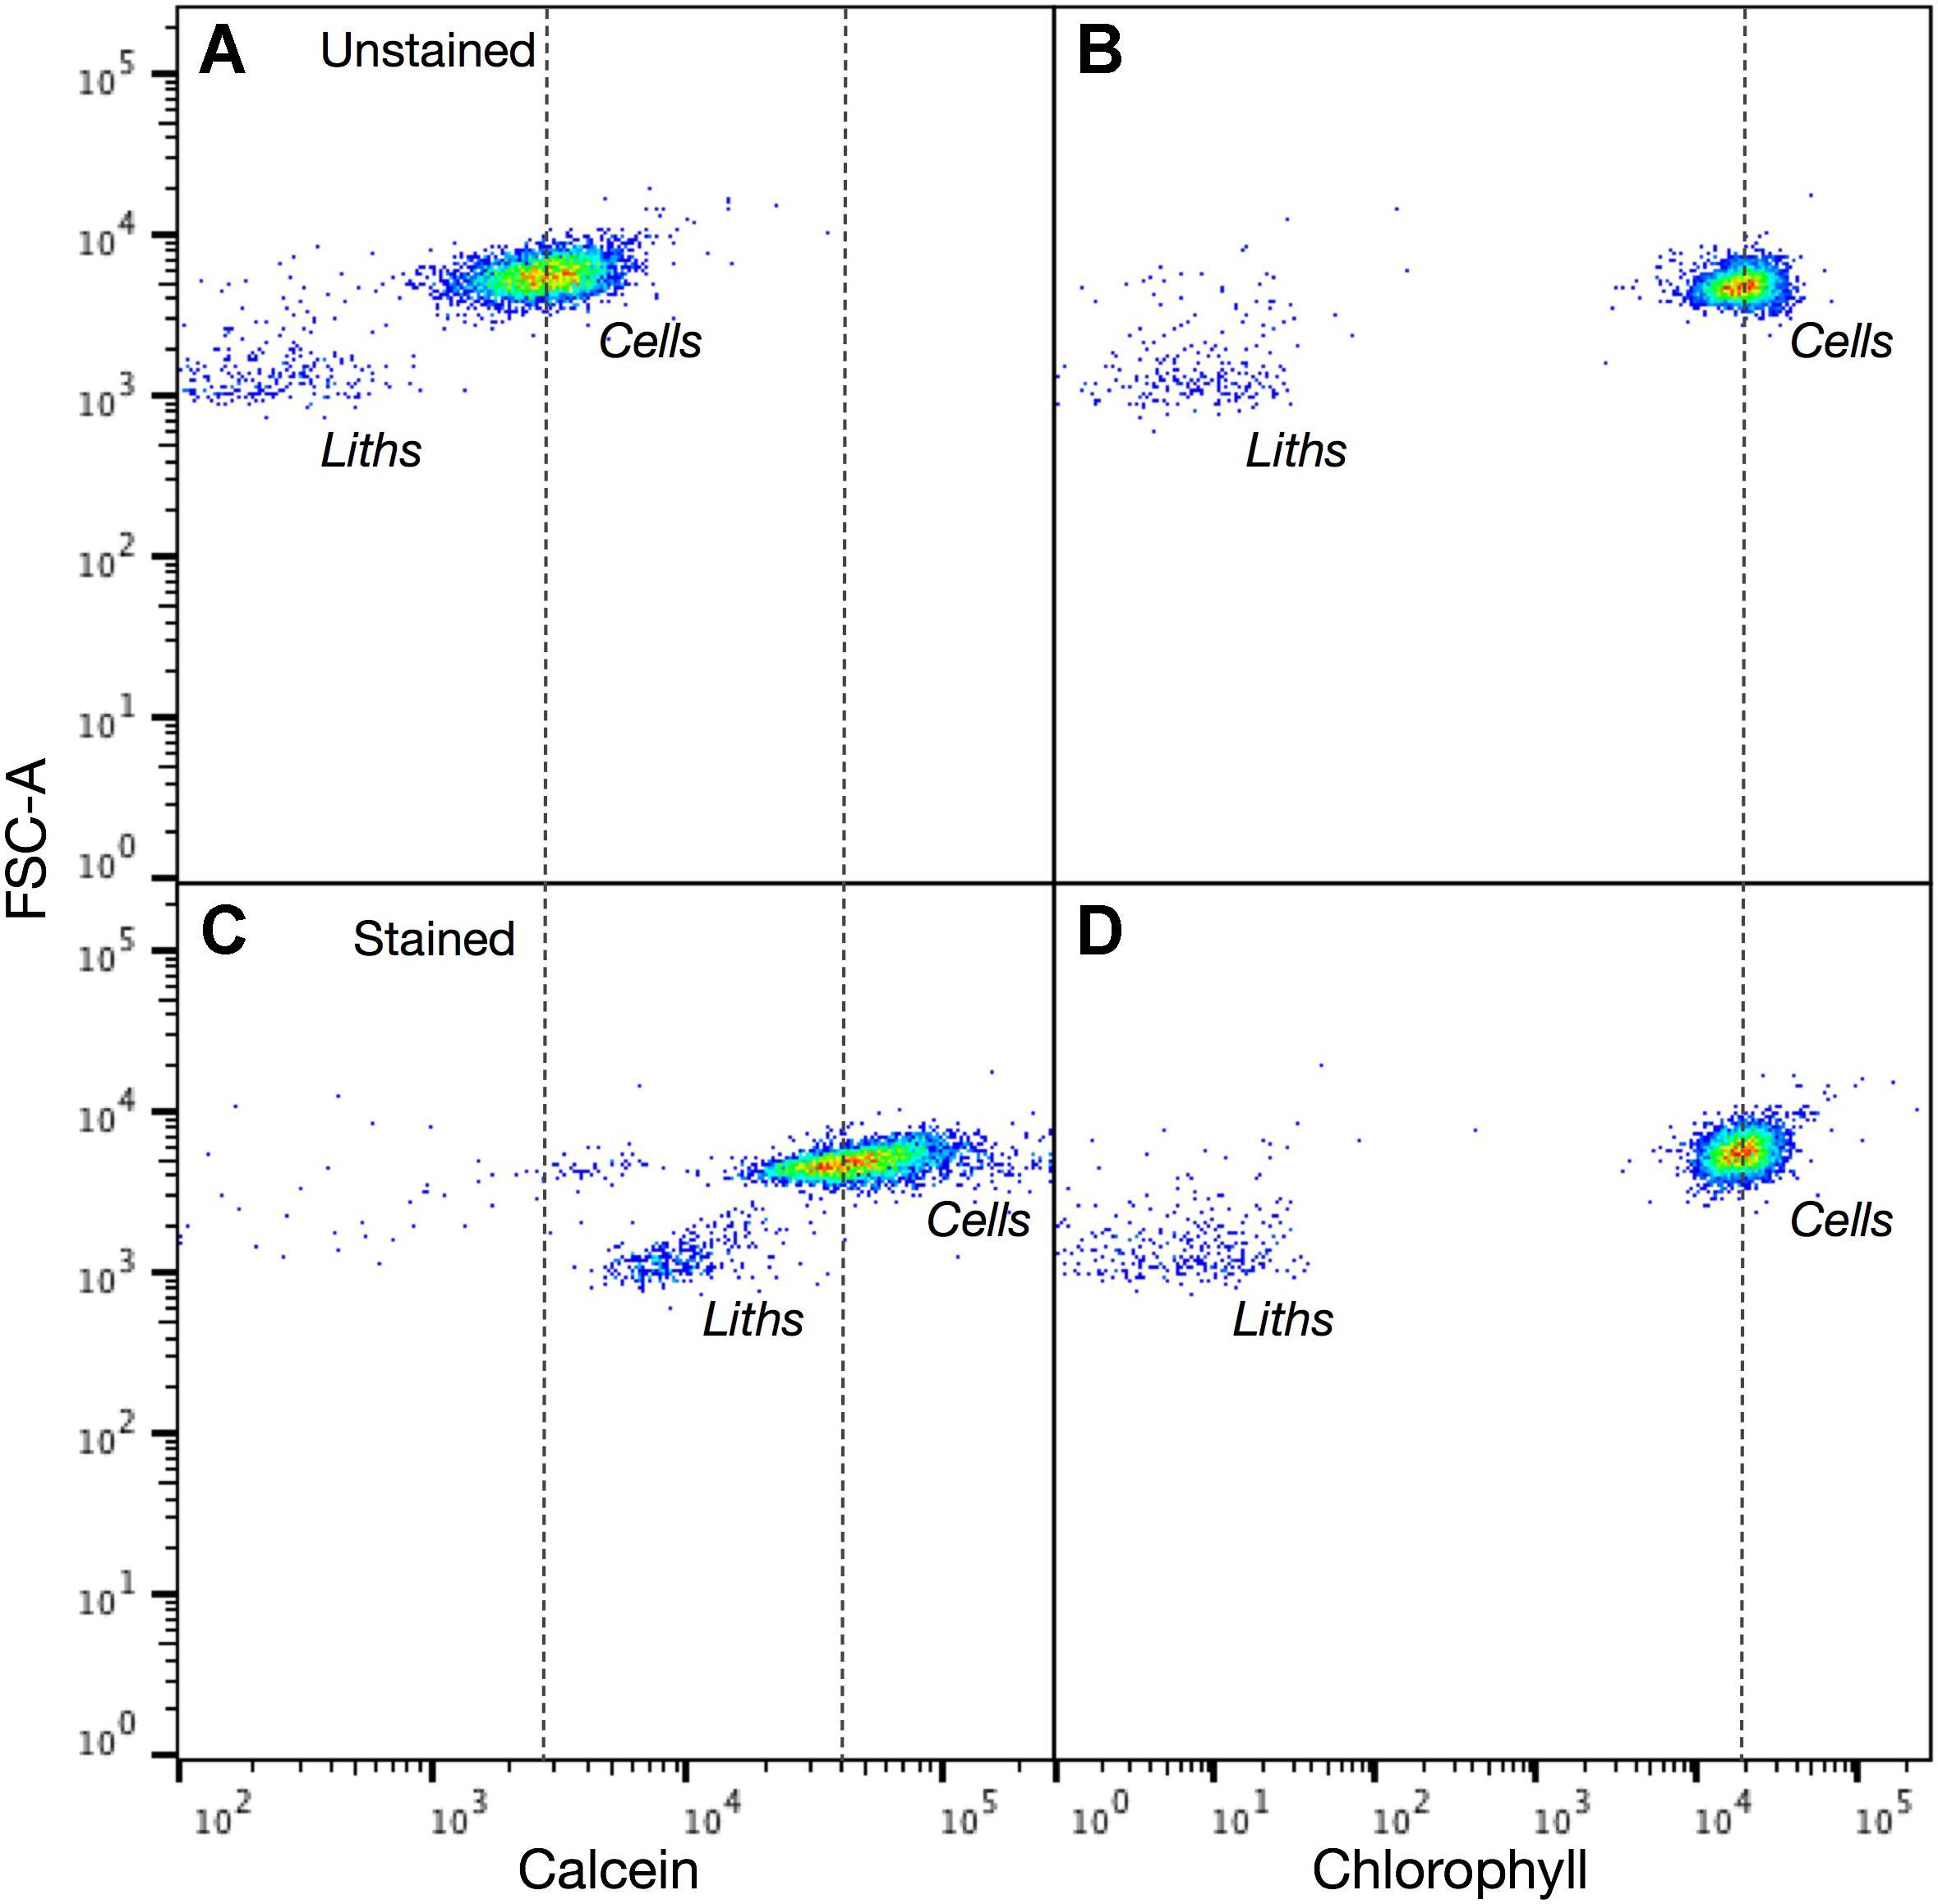
FIGURE 8. Calcein labeled and unlabeled Emiliania huxleyi cells are readily detected using flow cytometry. Intensity dot plots of (A) calcein and (B) chlorophyll signals vs. forward scatter (FSC-A) for unstained E. huxleyi cells. (C,D) Intensity dot plots of calcein and chlorophyll channels for cells after 2 h staining with calcein. Both cells and detached coccoliths are readily identified in each channel. For chlorophyll there is no change in the distribution of unstained and stained cells or coccoliths (dotted line for reference). The stained and unstained populations of cells and coccoliths are clearly distinguished in the calcein channel (dotted lines for reference). 5,000 events counted.
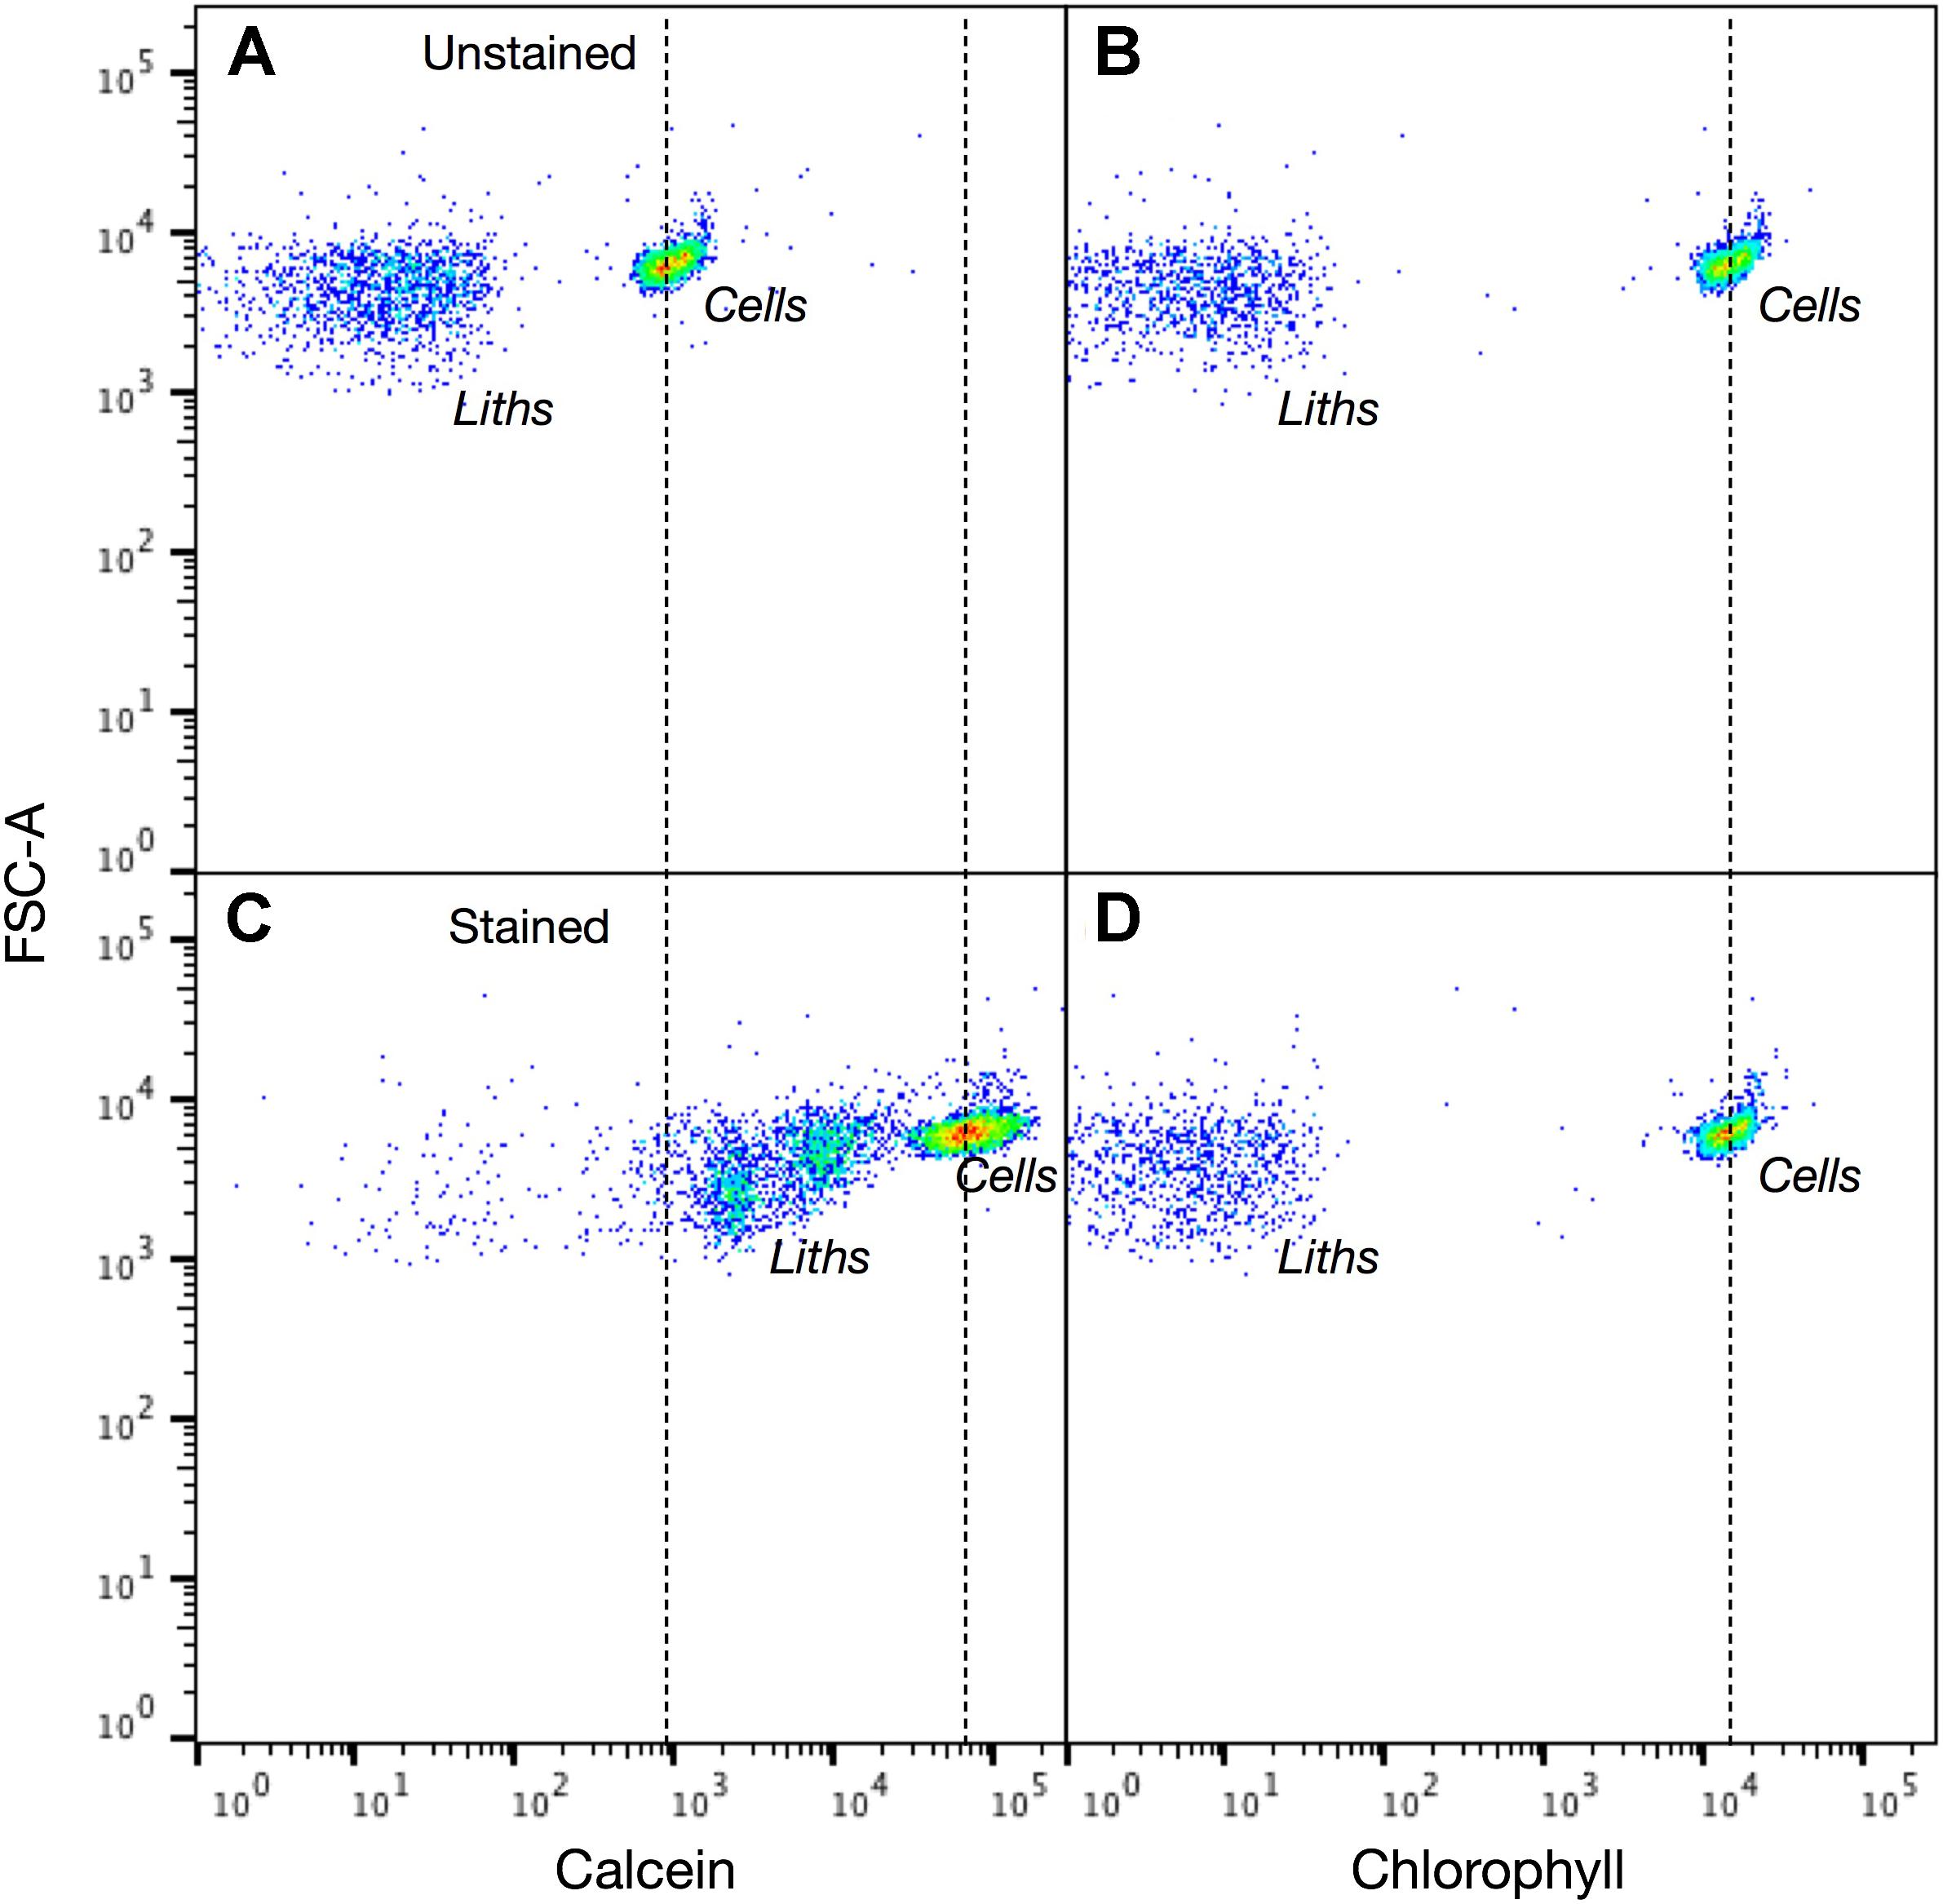
FIGURE 9. Calcein labeled and unlabeled Coccolithus braarudii cells are readily detected using flow cytometry. Intensity dot plots of (A) calcein and (B) chlorophyll signals vs. forward scatter (FSC-A) for unstained C. braarudii cells. (C,D) Intensity dot plots of calcein and chlorophyll channels for cells after 2 h staining with calcein. Both cells and detached coccoliths are readily identified in each channel. For chlorophyll there is no change in the distribution of unstained and stained cells or coccoliths (dotted line for reference). The stained and unstained populations of cells and coccoliths are clearly distinguished in the calcein channel (dotted lines for reference). 5,000 events counted.
To further support the efficacy of calcein staining at the population level, we tracked a population of early exponential E. huxleyi cells post-calcein staining with flow cytometry (Figure 10). As predicted from analysis with confocal imaging, a shift in the calcein signal of the population toward an ‘unstained’ signature was detected within a few hours after staining (Supplementary Figure S3).
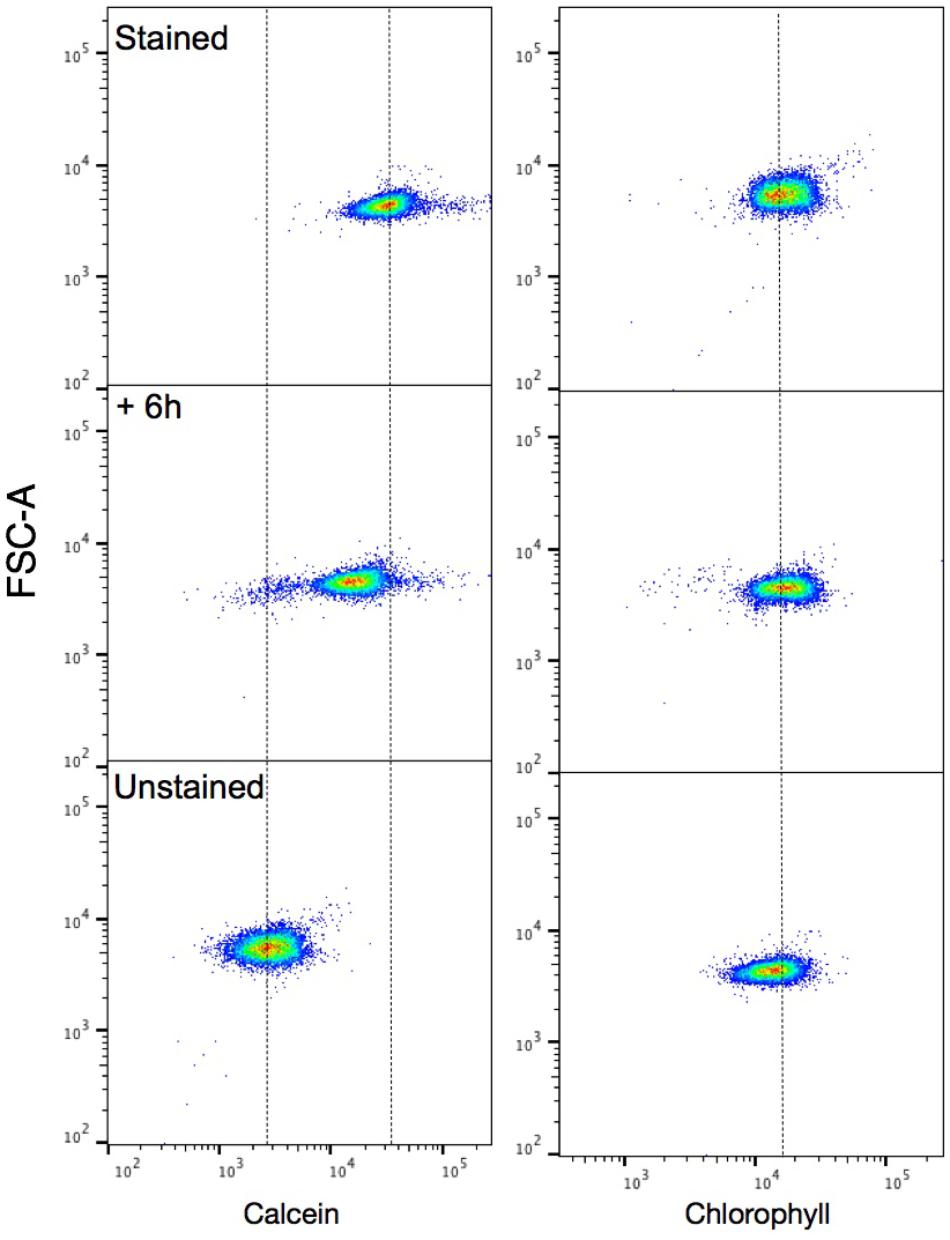
FIGURE 10. Tracking of calcification in Emiliania huxleyi using flow cytometry. Intensity dot plots of calcein (Left) and chlorophyll (Right) signals vs. forward scatter (FSC-A) for stained E. huxleyi cells. From top; stained, +6 h, and unstained cells showing a shift in the +6 h population toward an unstained signature. 10,000 events were collected and a threshold on the chlorophyll channel was used to exclude collection of detached coccoliths. Dotted lines are used for reference on each channel.
Discussion
Staining Method and Confocal Analysis
We examined the utility of calcein as a non-toxic marker for coccolithophore calcification and established that this fluorescent probe is suitable for labeling of both hetero- and holococcoliths across a range of species. Staining in buffered media between pH 7.7–8.0 had no effect on coccolith structure. Calcein treatment also had no effect on coccolithophore viability, which is consistent with multiple studies on fishes, corals, bivalves, gastropods, and foraminifera (e.g., Moran, 2000; Frenkel et al., 2002; Fitzpatrick et al., 2013; Holcomb et al., 2013; Kurtarkar et al., 2015). Although calcein has been reported to be stable in buffered seawater and can be reused (Rowley and MacKinnon, 1995), we found the most consistent coccolith calcite staining was achieved when using freshly made stock solutions and dilutions. Once stained, calcein labeled coccoliths could be detected in the coccosphere surrounding the cell for at least 3 days and likely over longer periods, although this was not examined because of the relatively fast growth and cell division rates of these algae. It is possible that some photobleaching of the calcein bound to coccolith calcite could occur over several day’s growth in high light, although this was not examined. However, it should be noted that calcein marked biominerals of fishes, invertebrates, and foraminifera have been tracked for extended periods, with calcein fluorescence detected after several weeks and even months (see Table 1 and references therein).
The pattern of calcein staining of coccoliths was heterogeneous with bright fluorescence associated with specific structures or crystal surfaces. Unlike live coral microcolonies (Tambutte et al., 2012) or foraminifera (Bernhard et al., 2004), calcein is not incorporated into the coccolith calcite structure during intracellular precipitation. Rather, calcein interacts with the surface of pre-existing secreted coccoliths. The specific crystal face, presence of coccolith associated organic material, and boundary layer pH will all affect binding and fluorescence of calcein.
We considered the possibility of labeling internal coccoliths with Calcein-AM which is an uncharged acetoxymethyl ester of calcein that is cell permeable and becomes internalized and Ca2+ sensitive when acted upon by cellular esterases. However, Sviben et al. (2016) used calcein-AM to identify an intracellular Ca and P rich vacuole-like compartment in E. huxleyi that was distinct from the coccolith vesicle. In a preliminary study, we also found internalization and staining of non-coccolith compartments using the calcein-AM probe (data not shown) and deemed it unsuitable for further analysis.
Tracking Calcification, Polar Secretion, and Patterns of Cell Growth
By monitoring newly synthesized (and unstained) coccoliths, we were able to confirm the polar secretion of coccoliths which appear clustered at the apical pole of the coccolithophore cell, which was especially apparent in C. braarudii (Figure 6). This approach will be valuable in monitoring calcification at the single cell level over a wide range of species and in response to environmental variables and treatments that may influence the calcification machinery. Additionally, calcein labeling of holococcoliths should provide critical insights into the biomineralization of these organic scales decorated with clusters of minute (∼100 nm) calcite rhombohedra. In contrast to heterococcoliths, little is known about mechanisms and dynamics of holococcolith production, although it has been proposed to occur in an extracellular compartment (Rowson et al., 1986).
A further valuable discovery arising from our assessment was that calcein labeling of the whole coccosphere allows for detection of viable but non-dividing cells versus actively calcifying and growing cells among a coccolithophore population. For example, a subpopulation of cells in stationary phase cultures of E. huxleyi produced new coccoliths and underwent cell division over 12 h after calcein staining and sub-culturing into fresh media. The remaining cells were not actively calcifying over this period, as evidenced by coccospheres in which all coccoliths were fluorescing. After 40 h, all cells had resumed calcification, and presumably growth, at least to some degree (Figure 7). Growth resumption from stationary phase cultures has been studied extensively in microbes where a resource ‘bet-hedging’ strategy has been proposed to function in which sub populations of cells rapidly resume growth in response to newly available carbon, while others remain quiescent (Grimbergen et al., 2015; Martins and Locke, 2015; Bergkessel et al., 2016). The heterogeneous resumption of growth insures whole population viability when resources for growth may only be transiently available over temporal or spatial scales (Lidstrom and Konopka, 2010). Given the dynamic and unpredictable environment that phytoplankton experience, it is likely that heterogenous growth phenotypes exist among their isogenic populations, as has been determined in Chlamydomonas (Damodaran et al., 2015). The identification of cells in different metabolic (using calcein) and cell-cycle states (e.g., combining with DNA staining) has the potential to advance our understanding of the role that growth arrest and metabolic heterogeneity plays in coccolithophore population dynamics. Moreover this can be implemented with high-throughput approaches (below), and could be amenable to single-cell omics (Martinez Martinez et al., 2011) and single cell metabolic profiling (Taylor G.T. et al., 2017).
Flow Cytometry
High throughput methods of determining coccolithophore abundance include well established SSC, FSC, and pigment analysis of mixed populations (Tarran et al., 2001; Zubkov and Burkill, 2006) with specificity improved by analysing the forward scattering depolarization of the incident laser which allows for the degree of calcification to be estimated (von Dassow et al., 2012). In this study, an unstained mixed coccolithophore population was readily separated into two populations based on SSC and FSC signal. This confirmed that even relatively large complex coccolithophores such as S. apsteinii are amenable to flow cytometer analysis, although rapid sedimentation of these larger heavy cells needs to be taken into consideration. Calcein stained and unstained E. huxleyi and C. braarudii were easily distinguished in either separate or combined populations. We also demonstrated the ability to optically label coccoliths and monitor calcification using high throughput flow cytometry. Calcein labeling could therefore be applied to environmental or field samples using flow cytometry to distinguish calcified cells and discarded coccoliths from other similarly sized particles. Calcein could also be used to detect calcified structures using high throughput 3D fluorescence imaging that was recently developed for rapid morphological profiling and taxonomic classification of marine microbial eukaryotes (Colin et al., 2017).
Concluding Remarks
Calcein labeling has been used extensively as a non-toxic fluorescent marker in order to investigate biomineralization of calcified structures in a wide range of marine organisms. Remarkably, its application to coccolithophore calcification has not been previously reported. Here, we successfully addressed our main objectives to validate the use of calcein to label the extracellular coccosphere and follow new production of coccoliths over multiple days in cells of several coccolithophore species using fluorescence and confocal fluorescence microscopy. We also demonstrated the usefulness of calcein labeling for high throughput analysis of coccolithophore populations using flow cytometry. The ability to simultaneously mark batches of cells could also be a valuable tool with which to examine metabolic heterogeneity.
Author Contributions
AT conceived the study, collected the data, supervised the experiments, analyzed the data, and wrote the paper. EF conducted confocal imaging, growth and physiology experiments, analyzed the data, and edited the paper. EM conducted SEM, growth and physiology experiments, and edited the paper. NP conducted preliminary proof of concept experiments and analyzed the literature.
Funding
AT acknowledges financial support from the NSF (NSFGEO-NERC 1638838) and a UNCW Summer Undergraduate Research and Creativity Award. NP acknowledges support through a NOAA Hollings Undergraduate Scholarship.
Conflict of Interest Statement
The authors declare that the research was conducted in the absence of any commercial or financial relationships that could be construed as a potential conflict of interest.
Acknowledgments
We thank Katie Valentine and Kelsey Billet for preliminary technical assistance. We acknowledge the Richard M. Dillaman Biological Imaging Facility at UNCW.
Supplementary Material
The Supplementary Material for this article can be found online at: https://www.frontiersin.org/articles/10.3389/fmars.2018.00326/full#supplementary-material
FIGURE S1. Heterogeneous calcein staining among cells. The graph illustrates that in each species a proportion of cells exhibit a saturating signal in the calcein channel, suggesting more calcein is bound to calcite in these coccospheres, or the local boundary layer chemistry may be sufficiently different in these cells to cause higher fluorescence emission.
FIGURE S2. Flow cytometry of coccoliths. Forward scatter (FSC, proxy for cell size) versus side scatter (granularity), chlorophyll, and calcein for a mixed population of unstained E. huxleyi (94%) cells and S. apsteinii (∼6%) cells. The side scatter signal is characteristic of coccolithophores due to their calcite coccosphere. The two very different sized coccolithophore species were readily distinguished. The signal in the calcein channel for each species is likely due to autofluorescence of photopigments that are not excluded by the FITC filterset.
FIGURE S3. Flow cytometry of a mixed population of E. huxleyi. Forward scatter (FSC, proxy for cell size) versus side scatter (granularity), chlorophyll, and calcein for a mixed population of unstained (46.6% of events) and unstained (38.1% of events) E. huxleyi cells. The mixed sample is described by a single population in the SSC and chlorophyll plots, whereas discrete populations of stained and unstained cells are detected in the calcein plot.
References
Balch, W., Drapeau, D., Bowler, B., and Booth, E. (2007). Prediction of pelagic calcification rates using satellite measurements. Deep Sea Res. Part II Top. Stud. Oceanogr. 54, 478–495. doi: 10.1016/j.dsr2.2006.12.006
Balch, W. M. (2018). The ecology, biogeochemistry, and optical properties of coccolithophores. Annu. Rev. Mar. Sci. 10, 71–98. doi: 10.1146/annurev
Beaufort, L. (2005). Weight estimates of coccoliths using the optical properties (birefringence) of calcite. Micropalentology 51, 289–297. doi: 10.2113/gsmicropal.51.4.289
Bentov, S., Brownlee, C., and Erez, J. (2009). The role of seawater endocytosis in the biomineralization process in calcareous foraminifera. Proc. Natl. Acad. Sci. U.S.A. 106, 21500–21504. doi: 10.1073/pnas.0906636106
Bergkessel, M., Basta, D. W., and Newman, D. K. (2016). The physiology of growth arrest: uniting molecular and environmental microbiology. Nat. Rev. Microbiol. 14, 549–562. doi: 10.1038/nrmicro.2016.107
Bernhard, J. M., Blanks, J. K., Hintz, C. J., and Chandler, G. T. (2004). Use of the fluorescent calcite marker calcein to label foraminiferal tests. J. Foraminifer. Res. 34, 96–101. doi: 10.2113/0340096
Bernhard, J. M., Phalen, W. G., McIntyre-Wressnig, A., Mezzo, F., Wit, J. C., Jeglinski, M., et al. (2015). Technical note: towards resolving in situ, centimeter-scale location and timing of biomineralization in calcareous meiobenthos - the calcein-osmotic pump method. Biogeosciences 12, 5515–5522. doi: 10.5194/bg-12-5515-2015
Brussaard, C. P. D., Marie, D., Thyrhaug, R., and Bratbak, G. (2001). Flow cytometric analysis of phytoplankton viability following viral infection. Aquat. Microb. Ecol. 26, 157–166. doi: 10.3354/ame026157
Castillo, G., Morinaka, J., Fujimura, R., DuBois, J., Baskerville-Bridges, B., Lindberg, J., et al. (2014). Evaluation of calcein and photonic marking for cultured delta smelt. N. Am. J. Fish. Manag. 34, 30–38. doi: 10.1080/02755947.2013.839970
Chen, Y., Zhou, J. L., Cheng, L., Zheng, Y. Y., and Xu, J. (2017). Sediment and salinity effects on the bioaccumulation of sulfamethoxazole in zebrafish (Danio rerio). Chemosphere 180, 467–475. doi: 10.1016/j.chemosphere.2017.04.055
Colin, S., Coelho, L. P., Sunagawa, S., Bowler, C., Karsenti, E., Bork, P., et al. (2017). Quantitative 3D-imaging for cell biology and ecology of environmental microbial eukaryotes. eLife 6:e26066. doi: 10.7554/eLife.26066
Damodaran, S. P., Eberhard, S., Boitard, L., Rodriguez, J. G., Wang, Y., Bremond, N., et al. (2015). A millifluidic study of cell-to-cell heterogeneity in growth-rate and cell-division capability in populations of isogenic cells of Chlamydomonas reinhardtii. PLoS One 10:e0118987. doi: 10.1371/journal.pone.0118987
De Vargas, C., Aubry, M.-P., Probert, I., and Young, J. R. (2007). “Origin and evolution of coccolithophores: from coastal hunters to oceanic farmers,” in The Evolution of Aquatic Photoautotrophs, eds P. G. Falkowski and A. H. Knoll (New York, NY: Academic Press).
Dissard, D., Nehrke, G., Reichart, G. J., Nouet, J., and Bijma, J. (2009). Effect of the fluorescent indicator calcein on Mg and Sr incorporation into foraminiferal calcite. Geochem. Geophys. Geosyst. 10:Q11001. doi: 10.1029/2009gc002417
Diz, P., Barras, C., Geslin, E., Reichart, G.-J., Metzger, E., Jorissen, F., et al. (2012). Incorporation of Mg and Sr and oxygen and carbon stable isotope fractionation in cultured Ammonia tepida. Mar. Micropaleontol. 9, 16–28. doi: 10.1016/j.marmicro.2012.04.006
Fitzpatrick, M. P., Jeffs, A. G., and Dunphy, B. J. (2013). Efficacy of calcein as a chemical marker of green-lipped mussel (Perna canaliculus) larvae and its potential use for tracking larval dispersal. Aquac. Res. 44, 345–353. doi: 10.1111/j.1365-2109.2011.03034.x
Frenkel, V., Kindschi, G., and Zohar, Y. (2002). Noninvasive, mass marking of fish by immersion in calcein: evaluation of fish size and ultrasound exposure on mark endurance. Aquaculture 214, 169–183. doi: 10.1016/S0044-8486(02)00135-7
Fuertes, M. -Á, Flores, J.-A., and Sierro, F. J. (2014). The use of circularly polarized light for biometry, identification and estimation of mass of coccoliths. Mar. Micropaleontol. 113, 44–55. doi: 10.1016/j.marmicro.2014.08.007
Gómez, C. E., Paul, V. J., Ritson-Williams, R., Muehllehner, N., Langdon, C., and Sánchez, J. A. (2014). Responses of the tropical gorgonian coral Eunicea fusca to ocean acidification conditions. Coral Reefs 34, 451–460. doi: 10.1007/s00338-014-1241-3
Green, J. C., Course, P. A., and Tarran, G. A. (1996). The life-cycle of Emiliania huxleyi: a brief review and a study of relative ploidy levels analysed by flow cytometry. J. Mar. Syst. 9, 33–44. doi: 10.1016/0924-7963(96)00014-0
Grimbergen, A. J., Siebring, J., Solopova, A., and Kuipers, O. P. (2015). Microbial bet-hedging: the power of being different. Curr. Opin. Microbiol. 25, 67–72. doi: 10.1016/j.mib.2015.04.008
Holcomb, M., Cohen, A. L., and McCorkle, D. C. (2013). An evaluation of staining techniques for marking daily growth in scleractinian corals. J. Exp. Mar. Biol. Ecol. 440, 126–131. doi: 10.1016/j.jembe.2012.12.003
Honeyfield, D. C., Kindschi, G. A., Bell, T. A., and Mohler, J. W. (2011). Dietary calcein marking of shovelnose sturgeon and the effect of sunlight on mark retention. N. Am. J. Aquac. 73, 129–134. doi: 10.1080/15222055.2011.559869
Jacinto, D., Penteado, N., Pereira, D., Sousa, A., and Cruz, T. (2015). Growth rate variation of the stalked barnacle Pollicipes pollicipes (Crustacea: Cirripedia) using calcein as a chemical marker. Sci. Mar. 79, 117–123. doi: 10.3989/scimar.04135.08B
Jacquet, S., Heldal, M., Iglesias-Rodriguez, D., Larsen, A., Wilson, W., and Bratbak, G. (2002). Flow cytometric analysis of an Emiliania huxleyi bloom terminated by viral infection. Aquat. Microb. Ecol. 27, 111–124. doi: 10.3354/ame027111
Kaehler, S., and McQuaid, C. D. (1999). Use of the fluorochrome calcein as an in situ growth marker in the brown mussel Perna perna. Mar. Biol. 133, 455–460. doi: 10.1007/s002270050485
Kurtarkar, S. R., Saraswat, R., Nigam, R., Banerjee, B., Mallick, R., Naik, D. K., et al. (2015). Assessing the effect of calcein incorporation on physiological processes of benthic foraminifera. Mar. Micropaleontol. 114, 36–45. doi: 10.1016/j.marmicro.2014.10.001
Lambert, G., and Lambert, C. (1996). Spicule formation in the New Zealand Ascidian Pyura pachydermatina (Chordata, Ascidiacea). Connect. Tissue Res. 34, 263–269. doi: 10.3109/03008209609005270
Lidstrom, M. E., and Konopka, M. C. (2010). The role of physiological heterogeneity in microbial population behavior. Nat. Chem. Biol. 6, 705–712. doi: 10.1038/nchembio.436
Logsdon, D. E., and Pittman, B. J. (2012). Evaluation of osmotic induction of calcein treatments for marking Juvenile Walleyes. N. Am. J. Fish. Manag. 32, 796–805. doi: 10.1080/02755947.2012.690821
Lü, H., Chapelsky, A., Zhang, Z., Li, R., Rao, W., and Fu, M. (2017). Can calcein and alizarin complexone be used for double immersion marking of juvenile qingbo Spinibarbus sinensis? Fish. Sci. 83, 767–776. doi: 10.1007/s12562-017-1105-1
Markuszewski, R. (1976). Structure, Fluorescence, and Chelating Properties of Calcein. Ph.D. thesis, University of Iowa, Iowa City.
Marschal, C., Garrabou, J., Harmelin, J. G., and Pichon, M. (2004). A new method for measuring growth and age in the precious red coral Corallium rubrum (L.). Coral Reefs 23, 423–432. doi: 10.1007/s00338-004-0398-6
Martinez Martinez, J., Poulton, N. J., Stepanauskas, R., Sieracki, M. E., and Wilson, W. H. (2011). Targeted sorting of single virus-infected cells of the coccolithophore Emiliania huxleyi. PLoS One 6:e22520. doi: 10.1371/journal.pone.0022520
Martins, B. M., and Locke, J. C. (2015). Microbial individuality: how single-cell heterogeneity enables population level strategies. Curr. Opin. Microbiol. 24, 104–112. doi: 10.1016/j.mib.2015.01.003
Medeiros-Bergen, D. E., and Ebert, T. A. (1995). Growth, fecundity and mortality rates of two intertidal brittlestars (Echinodermata: Ophiuroidea) with contrasting modes of development. J. Exp. Mar. Biol. Ecol. 189, 47–64. doi: 10.1016/0022-0981(95)00010-O
Mohler, J. W. (1997). Management briefs: immersion of larval Atlantic Salmon in calcein solutions to induce a non-lethally detectable mark. N. Am. J. Fish. Manag. 17, 751–756. doi: 10.1577/1548-8675(1997)017<0751:MBIOLA>2.3.CO;2
Moran, A. L. (2000). Calcein as a marker in experimental studies newly-hatched gastropods. Mar. Biol. 137, 893–898. doi: 10.1007/s002270000390
Rogers-Bnnett, L., Rogers, D. W., Bennett, W. A., and Ebert, T. A. (2003). Modeling red sea urchin (Strongylocentrotus franciscanus) growth using six growth functions. Fish Bull. 101, 614–626.
Rowley, A. F., and MacKinnon, D. I. (1995). Use of the fluorescent marker calcein in biomineralisation studies of brachiopods and other marine organisms. Bull. Inst. Oceanogr. Monaco Spec. 14, 111–120.
Rowson, J. D., Leadbeater, B. S. C., and Green, J. C. (1986). Calcium carbonate deposition in the motile (Crystallolithus) phase of Coccolithus pelagicus (Prymnesiophyceae). Br. Phycol. J. 21, 359–370. doi: 10.1080/00071618600650431
Sotje, I., Dishon, T., Hoffmann, F., and Holst, S. (2017). New methods of morphometric analyses on scyphozoan jellyfish statoliths including the first direct evidence for statolith growth using calcein as a fluorescent marker. Microsc. Microanal. 23, 553–568. doi: 10.1017/S1431927617000344
Sviben, S., Gal, A., Hood, M. A., Bertinetti, L., Politi, Y., Bennet, M., et al. (2016). A vacuole-like compartment concentrates a disordered calcium phase in a key Coccolithophorid alga. Nat. Commun. 7:11228. doi: 10.1038/ncomms11228
Tambutte, E., Tambutte, S., Segonds, N., Zoccola, D., Venn, A., Erez, J., et al. (2012). Calcein labelling and electrophysiology: insights on coral tissue permeability and calcification. Proc. R. Soc. B Biol. Sci. 279, 19–27. doi: 10.1098/rspb.2011.0733
Tarran, G. A., Zubkov, M. V., Sleigh, M. A., Burkill, P. H., and Yallop, M. (2001). Microbial community structure and standing stocks in the NE Atlantic in June and July of 1996. Deep Sea Res. Part II Top. Stud. Oceanogr. 48, 963–985. doi: 10.1016/s0967-0645(00)00104-1
Taylor, A. R., Brownlee, C., and Wheeler, G. (2017). Coccolithophore cell biology: chalking up progress. Annu. Rev. Mar. Sci. 9, 283–310. doi: 10.1146/annurev-marine-122414-034032
Taylor, A. R., Chrachri, A., Wheeler, G., Goddard, H., and Brownlee, C. (2011). A voltage-gated H+ channel underlying pH homeostasis in calcifying coccolithophores. PLoS Biol. 9:e1001085. doi: 10.1371/journal.pbio.1001085
Taylor, G. T., Suter, E. A., Li, Z. Q., Chow, S., Stinton, D., Zaliznyak, T., et al. (2017). Single-cell growth rates in photoautotrophic populations measured by stable isotope probing and resonance raman microspectrometry. Front. Microbiol. 8:1449. doi: 10.3389/fmicb.2017.01449
Vidavsky, N., Addadi, S., Schertel, A., Ben-Ezra, D., Shpigel, M., Addadi, L., et al. (2016). Calcium transport into the cells of the sea urchin larva in relation to spicule formation. Proc. Natl. Acad. Sci. U.S.A. 113, 12637–12642. doi: 10.1073/pnas.1612017113
von Dassow, P., van den Engh, G., Iglesias-Rodriguez, D., and Gittins, J. R. (2012). Calcification state of coccolithophores can be assessed by light scatter depolarization measurements with flow cytometry. J. Plankton Res. 34, 1011–1027. doi: 10.1093/plankt/fbs061
Wilson, W. H., Tarran, G., and Zubkov, M. V. (2002). Virus dynamics in a coccolithophore-dominated bloom in the North Sea. Deep Sea Res. Part II Top. Stud. Oceanogr. 49, 2951–2963. doi: 10.1016/s0967-0645(02)00065-6
Zhou, S., Zhang, X., Li, W., Li, L., and Cai, X. (2016). Experimental evaluation of fluorescent (alizarin red S and calcein) and clip-tag markers for stock assessment of ark shell. Chin. J. Oceanol. Limnol. 35, 265–274. doi: 10.1007/s00343-016-5137-7
Keywords: coccolithophore, coccolith, calcein, calcification, haptophyte, secretion, flow cytometry, bet hedging
Citation: Fox E, Meyer E, Panasiak N and Taylor AR (2018) Calcein Staining as a Tool to Investigate Coccolithophore Calcification. Front. Mar. Sci. 5:326. doi: 10.3389/fmars.2018.00326
Received: 20 April 2018; Accepted: 24 August 2018;
Published: 18 September 2018.
Edited by:
Alfred Portius Wheeler, Clemson University, United StatesReviewed by:
Gary H. Dickinson, The College of New Jersey, United StatesChristine Ferrier-Pagès, Scientific Centre of Monaco, Monaco
Copyright © 2018 Fox, Meyer, Panasiak and Taylor. This is an open-access article distributed under the terms of the Creative Commons Attribution License (CC BY). The use, distribution or reproduction in other forums is permitted, provided the original author(s) and the copyright owner(s) are credited and that the original publication in this journal is cited, in accordance with accepted academic practice. No use, distribution or reproduction is permitted which does not comply with these terms.
*Correspondence: Alison R. Taylor, dGF5bG9yYUB1bmN3LmVkdQ==