 Sarah K. Hu
 Paige E. Connell
 Lisa Y. Mesrop
 David A. Caron
- Biological Sciences, University of Southern California, Los Angeles, CA, United States
Molecular analysis revealed diel rhythmicity in the metabolic activity of single-celled microbial eukaryotes (protists) within an eddy in the North Pacific Subtropical Gyre (ca. 100 km NE of station ALOHA). Diel trends among different protistan taxonomic groups reflected distinct nutritional capabilities and temporal niche partitioning. Changes in relative metabolic activities among phototrophs corresponded to the light cycle, generally peaking in mid- to late-afternoon. Metabolic activities of protistan taxa with phagotrophic ability were higher at night, relative to daytime, potentially in response to increased availability of picocyanobacterial prey. Tightly correlated Operational Taxonomic Units throughout the diel cycle implicated the existence of parasitic and mutualistic relationships within the microbial eukaryotic community, underscoring the need to define and include these symbiotic interactions in marine food web descriptions. This study provided a new high-resolution view into the ecologically important interactions among primary producers and consumers that mediate the transfer of carbon to higher trophic levels. Characterizations of the temporal dynamics of protistan activities contribute knowledge for predicting how these microorganisms respond to environmental forcing factors.
Introduction
Single-celled microbial eukaryotes (protists) fulfill vital ecological roles as primary producers and consumers at and near the base of marine food webs. Environmental factors (e.g., light-dark cycling) influence protistan trophic interactions, thus studies to characterize how protistan biological activity varies or responds to such changes are critical for understanding ecosystem functioning. Microbial cell cycles have been shown to be synchronized with regular light-dark cycling (diel), especially among photoautotrophs. However, there is still a need for a comprehensive understanding of how taxon-specific functional roles and trophic interactions are shaped by short-term temporal dynamics (i.e., diel periodicity).
Diel synchronization of picophytoplankton behavior, such as cell division and growth, are key biological activities affecting organic matter production and the transfer of carbon to higher trophic levels via protistan grazers. In the North Pacific Subtropical Gyre (NPSG), picocyanobacteria (predominantly Prochlorococcus) are numerically dominant in the upper 200 m of the water column and represent a significant amount of autotrophic biomass and carbon fixation in this oligotrophic ecosystem (van den Engh et al., 2017). Flow cytometric measurements have demonstrated picophytoplankton cell size to typically increase throughout the course of the light period, followed by a simultaneous decrease in mean cell size and increase in cell abundance, which corresponds to cell division (Vaulot and Marie, 1999). Additionally, a peak in cell division rates occurring in the late afternoon and dusk has consistently been observed in Synechococcus, Prochlorococcus, and phototrophic picoeukaryotes, although the exact timing appears to be somewhat taxon-specific (Vaulot and Marie, 1999; Binder and DuRand, 2002; Tsai et al., 2009).
Molecular analyses have also provided evidence for diel periodicity in cell cycle regulation among dominant phytoplankton. For example, metatranscriptomic studies found transcripts associated with energy acquisition pathways to be more abundant during the day, relative to nighttime (Poretsky et al., 2009; Aylward et al., 2015). Aylward et al. (2015) suggested that the temporal dynamics of the entire microbial community were driven by the metabolic activity of the dominant phytoplankton, as evidenced by high daily abundances in transcripts responsible for carbon fixation and photosynthesis among photoautotrophs followed by peaks in transcripts associated with translation and oxidative phosphorylation in heterotrophic prokaryotic species. Both Aylward et al. (2015) and Poretsky et al. (2009) reported Ostreococcus (green alga, chlorophyte) as one of the dominant photoautotrophic contributors to daily peaks in photosynthetic processes; however, molecular studies devoted to the short-term temporal dynamics (e.g., daily) of the protistan community are lacking.
Our ability to characterize the diversity of in situ assemblages of microbial eukaryotes has improved dramatically with the application of high-throughput methods for sequencing ribosomal DNA (rDNA) (de Vargas et al., 2015; Massana et al., 2015; Le Bescot et al., 2016). Additionally, recent tag-sequencing efforts that target cellular ribosomal RNA (rRNA) have provided an approach for determining the metabolically active members of the community by comparing rRNA- and rDNA-derived tag sequences. The latter are more likely to include dead, inactive cellular material (Blazewicz et al., 2013), while the former serve as a proxy for presumed transcriptional activity and the precursor for protein synthesis (Poulsen et al., 1993; Corinaldesi et al., 2011; Lejzerowicz et al., 2013; Egge et al., 2015; Massana, 2015).
We investigated diel shifts in community composition (based on rDNA sequences) and relative activity (based on rRNA sequences) of naturally occurring protistan assemblages (18S V4 tag sequencing of rDNA and rRNA, respectively) in the North Pacific Subtropical Gyre (NPSG) at 4 h intervals over a period of 3 days (Lagrangian sampling). While DNA-based estimates of species richness were relatively unchanging, RNA-derived results demonstrated regular, daily fluctuations in species richness and relative abundance that typically peaked mid-day. We demonstrate how many key photoautotrophic species exhibited diel patterns synchronized to the light period, but were temporally offset from one another. The relative activity of many taxa capable of phagotrophy also had diel periodicity, which may be linked to the availability of prey (e.g., phytoplankton). Finally, we used co-occurrences between Operational Taxonomic Units (OTUs) to infer symbiosis, specifically revealing the frequency of parasitism between Syndiniales and other alveolates, and mutualism among rhizarian hosts and endosymbiotic algae.
Materials and Methods
Sample Collection
Seawater samples were collected from a depth of 15 m every 4 h for 3 days following a Lagrangian sampling schematic in an anticyclonic eddy in the North Pacific Subtropical Gyre (Figure 1A), as a part of the Simons Collaboration on Ocean Processes and Ecology (SCOPE; http://scope.soest.hawaii.edu/) cruise efforts in July 2015 (Table S1). Samples were collected using 10 L Niskin bottles mounted on a CTD rosette at ~ 6 a.m., 10 a.m., 2 p.m., 6 p.m., 10 p.m., and 2 a.m. Corresponding temperature, salinity, dissolved oxygen, and chlorophyll a data were derived from the same CTD casts. For each molecular sample, 3.5 L of seawater was prefiltered through 100 μm Nitex mesh to minimize the presence of multicellular eukaryotes, and vacuum filtered onto sterile GF/F filters (nominal pore size 0.7 μm, Whatman, International Ltd. Florham Park, NJ, USA). Filters were stored immediately in 1.5 mL of RLT+ buffer (with β-Mercaptoethanol, Qiagen, Valencia, CA, USA), and flash frozen in liquid nitrogen (protocols.io: dx.doi.org/10.17504/protocols.io.hisb4ee). Samples for flow cytometry were taken at the same time points (16 samples) and processed using an InFlux Flow Cytometer as described in protocols.io (Enumeration of bacteria and cyanobacteria by flow cytometry, protocols.io: dx.doi.org/10.17504/protocols.io.j2wcqfe).
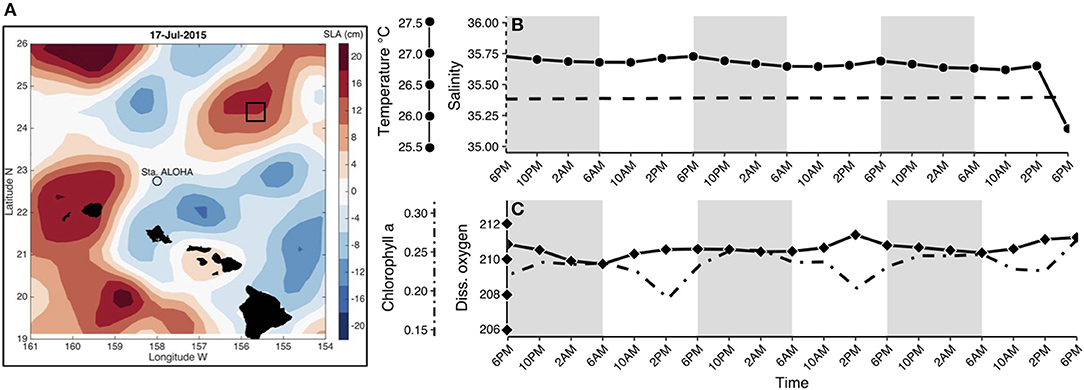
Figure 1. (A) Location of Lagrangian sampling within an anticyclonic eddy in the North Pacific Subtropical Gyre, colors represent Sea Level Anomalies (SLA) in cm adapted from Wilson et al. (2017). Additional information regarding sample collection can be found in Table S1. Environmental parameters were obtained from CTD casts for each time point at the depth sampled (15 m). Variables included (from left to right axes): (B) temperature in Celsius (solid line with circles), salinity in PSU (dashed line), (C) chlorophyll a concentration in μg/L (dot-dash line) and dissolved oxygen in μmol/L (solid line with diamonds). Shaded regions in (B–C) indicate the dark cycle (night period).
PCR and Sequence Library Preparation
Frozen filters were simultaneously thawed and bead-beaten by adding RNase-free silica beads and vortexing for 5 min. Total DNA and RNA was extracted using a DNA/RNA AllPrep kit (Qiagen, Valencia, CA, USA, #80204) with an in-line genomic DNA removal step (RNase-free DNase reagents, Qiagen #79254). Total RNA was reverse transcribed into cDNA using a cDNA synthesis kit (iScript Select cDNA Synthesis, BioRad, #1708896, Hercules, CA). The extraction protocol can be found online at protocols.io: dx.doi.org/10.17504/protocols.io.hk3b4yn.
The V4 hypervariable region of the 18S rRNA gene was targeted for sequencing using Stoeck et al. (2010) forward (5′-CCAGCASCYGCGGTAATTCC-3′) and reverse (5′-ACTTTCGTTCTTGATYRA-3′) primers. The V4 hypervariable region was chosen because the length (ca. 400 bps) provides more phylogenetic resolution and better estimates of diversity compared to shorter hypervariable regions (Hu et al., 2015). PCR reactions consisted of a final concentration of 1X Q5 High Fidelity Master Mix (NEB #M0492S, Ipswich, MA), 0.5 μM each of forward and reverse primers, and 10 ng of genetic material. The PCR thermal profile was adapted from (Rodríguez-Martínez et al., 2012), with an initial activation step (Q5 specific) of 98°C for 2 min, followed with 10 cycles of 98°C for 10 s, 53°C for 30 s, 72°C for 30 s, and 15 cycles of 98°C for 10 s, 48°C for 30 s, and 72°C for 30 s, and a final extension of 72°C for 2 min. PCR products were purified using an AMPure bead clean up (Beckman Coulter #A63881, Brea, CA). Purified PCR product (ca. 400 bp amplicon size) concentrations were normalized and indexed using Illumina-specific P5 and P7 indices. Indexed samples were pooled at equimolar concentrations and sequenced using MiSeq 250 × 250 bp PE sequencing (Laragen, Culver City, CA). The library preparation protocol can be found online at protocols.io: dx.doi.org/10.17504/protocols.io.hdmb246.
Sequence Processing and Data Analysis
Paired end sequences were merged with a 20 bp minimum overlap using fastqjoin (Aronesty, 2011) and quality checked (requiring Q score > 30) using QIIME (v1.9.1; Caporaso et al., 2010). V4 primers were removed using cutadapt (v1.15; Martin, 2011) and sequences shorter than 150 or longer than 500 bps were removed using a custom script. Quality checked sequences from each sample were pooled and chimeras were removed using vsearch (v1.11.1; Rognes et al., 2016) by searching against the Protist Ribosomal database (PR2 release 4.7; Guillou et al., 2013). Finally, sequences were clustered into approximately species designations, Operational Taxonomic Units (OTUs), defined as groups of sequences with at least 97% sequence similarity to one another. OTUs were generated using the open-reference OTU clustering algorithm (Rideout et al., 2014) in QIIME, which combines both de novo and reference based (PR2 database v4.75, https://github.com/vaulot/pr2database) OTU clustering (Guillou et al., 2013). Taxonomy was assigned based on the PR2 database using uclust (Edgar, 2010) at 90% similarity.
Data Synthesis and Statistical Analyses
Final sequence counts and OTU taxonomic information were compiled in R (R Core Team, 2014). Global singletons (OTUs that exist only once in the whole dataset and contain only one sequence) were removed from the final results. Sequences in each sample (including both RNA and DNA derived samples) were randomly subsampled so that all samples had the same number of sequences (equal to the sample with the fewest total number of sequences). Manual taxonomic group names were assigned at approximately phylum or class levels to more easily visualize the complex microbial community (Hu et al., 2016). Major taxonomic groups discussed in the main text comprised at least 0.1% of the total number of rRNA or rDNA sequences.
An RNA:DNA ratio was calculated for each OTU (after normalization) in order to infer relative metabolic activity (Fu and Gong, 2015; Hu et al., 2016). OTUs were removed if they did not have either RNA or DNA sequences. All comparisons of relative abundance (OTU or sequence abundance) or activity (RNA:DNA ratio) were performed within each major taxonomic group to avoid problems related to varying gene copy number among the various protistan groups. Means and standard mean errors of RNA:DNA ratios at each time point were used to examine relative changes throughout the course of a day. Combined DNA and RNA tag-sequencing approaches are a popular approach for characterizing microbial community diversity and potential metabolic activity (Charvet et al., 2014; Logares et al., 2014; Fu and Gong, 2015; Hu et al., 2016; Laroche et al., 2017), yet caution should be taken before inferring relative activity from RNA:DNA read ratios. Here, we applied a conservative approach by ensuring ecological interpretations were made for individual taxonomic groups and not across protistan lineages. Temporal shifts in relative activity were only compared within a taxonomic group because the number of 18S copies can vary widely among different protistan groups making comparisons between major taxonomic groups problematic (also see Hu et al., 2016).
Two types of statistical tests were employed to investigate periodicity and possible co-occurrence among rRNA OTUs; the RNA-sequence library was chosen in order to serve as a closer proxy to the metabolically active component of the protistan community. Due to the compositional nature of OTU-based analyses, we first applied a centered log-ratio transformation to normalize sequence counts across samples (“compositions” R package) (Gloor et al., 2017). Prior to running the Rhythmicity Analysis Incorporating Nonparametric method (RAIN) analysis (Thaben and Westermark, 2014), the data was de-trended by calculating the least-squares fit of the data and subtracting the result from the data (“pracma” R package). RAIN was used to evaluate significant diel rhythmicity within the OTU results based on rRNA sequence abundances (p < 0.05; rDNA results are reported in Table S3).
In order to identify temporally significant interactions among OTUs and environmental conditions, extended Local Similarity Analysis (eLSA) was computed for OTUs based on rRNA sequence abundances (Xia et al., 2011, 2013). rRNA OTUs were first filtered so that each OTU had more than one sequence and appeared in samples from all 19 time points, then data were center log-ratio transformed. The eLSA analysis also detected temporally shifted co-occurrences up to 12 h. OTUs with no taxonomy assignment were removed and only highly significant correlations were selected based on the p-value (p < 0.05), q-value (q < 0.05), and Spearman rank correlation coefficient (> 0.5 or < −0.5). To estimate the frequency of parasitism, we inferred negatively correlated or positive, but time-delayed OTUs to be indicative of a potentially parasitic relationship, while positively correlated OTUs reflected possible mutualism between rhizarian hosts and putative endosymbionts (Chow et al., 2014).
Data Accessibility
Scripts for sequence quality control and data analysis can be found at GitHub (https://github.com/shu251/18Sdiversity_diel) and raw sequence data are available under SRA BioProject PRJNA393172. Quality checked reads and final OTU table used for downstream data analysis is available as Supplementary Material (10.5281/zenodo.1243295).
Results
Environmental Characterization of an Anticyclonic Eddy
Lagrangian sampling (total of 19 samples) was conducted in an anticyclonic eddy northeast of station ALOHA (Figure 1A). This oligotrophic region of the Pacific Ocean is persistently nutrient deplete in the upper euphotic zone and experiences only moderate seasonal fluctuations in primary production (Karl and Church, 2014). Changes in the majority of environmental variables were minor throughout the sampling period (Figures 1B,C), with the exception of chlorophyll a fluorescence, which decreased during the day (minimum: 0.19 μg/L) and increased at night (maximum: 0.27 μg/L; dot-dashed line in Figure 1C). Cell counts obtained using flow cytometry showed that populations of heterotrophic bacteria, Prochlorococcus, Synechococcus, and phototrophic picoeukaryote abundances did not change dramatically during the sampling period (Figure S1). Phototrophic picoeukaryote cell abundances were highest at night (0.01 × 10⁵ cells/mL) and lowest during the transition from day to night (0.004 × 10⁵ cells/mL).
Sequence Results
The 18S ribosomal RNA gene (rDNA) and ribosomal RNA (rRNA) sequence libraries resulted in an average of 196,410 and 162,815 sequences per sample, which clustered into an average of 1,575 and 1,103 OTUs per sample, respectively (Figure S2). To normalize across the entire dataset, samples from both rDNA and rRNA sequence libraries were randomly subsampled to 77,221 sequences per sample, which left a total of 3,831 OTUs from the combined rDNA and rRNA sequence library.
Temporal Shifts in Total Community Richness and Diversity
The total number of rRNA OTUs varied more than two-fold across the 19 samples collected (min: 541 OTUs, max: 1,320 OTUs; red line in Figure 2), while the total number of OTUs based on rDNA remained similar throughout the study (1,000–1,400 OTUs, black line in Figure 2). Numbers of rRNA OTUs were highest in the mid- to late-afternoon, and at that time typically corresponded to the total number of rDNA OTUs (compare red and black lines, Figure 2). Community composition derived from rDNA did not change appreciably over the sampling period (Figures 3A,B, Figure S3), while community composition as revealed by the total number of rRNA OTUs changed substantially (Figures 3C,D, Figure S3). Specifically, relative increases in the total number of rRNA OTUs (red line in Figure 2) corresponded to increases in the total number of dinoflagellate (Figure 3C), haptophyte, chlorophyte, and diatom rRNA OTUs (Figure 3D).
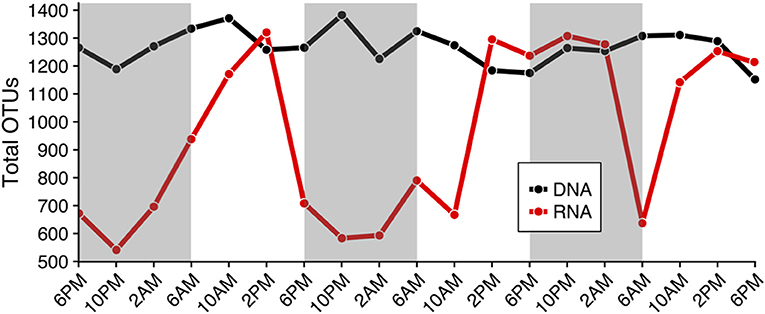
Figure 2. Total number of Operational Taxonomic Units (OTUs) based on rDNA and rRNA results (black and red lines, respectively) throughout the diel cycle (x-axis), which is representative of species richness. The number of rRNA OTUs changed more than two-fold over the diel period and was typically higher in the mid- to late- afternoon (min: 541, max: 1,320 OTUs). rDNA estimates of species richness (total OTUs) remained approximately the same throughout the diel sampling period (1,000–1,400 OTUs). Shaded regions indicate the dark cycle (night period).
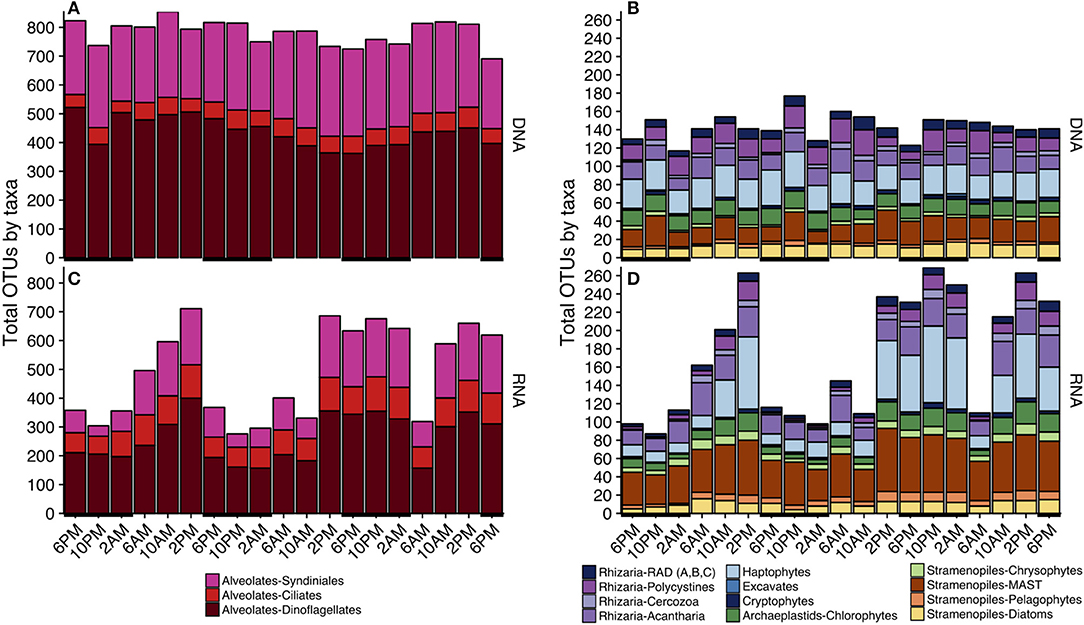
Figure 3. Taxonomic composition of total OTUs at each sampling point based on either the rDNA (A,B) or rRNA (C,D) sequence library. Since alveolate sequences dominated each sample (Table S2), alveolates (A,C) and non-alveolates (B,D) are visualized separately. Black horizontal lines indicate periods of darkness (6 p.m.−6 a.m.). Only major taxonomic groups that made up > 0.1% of the total rDNA or rRNA reads are represented; a full list of sequence abundances can be found in Table S2. A more complete breakdown of taxonomic groups by total OTUs can be found in Figure S3.
Similar to OTU richness, relative abundances of rRNA sequences within the various major taxa fluctuated throughout the 3-day sampling period while rDNA sequence abundances remained static for most taxonomic groups (Figure 4). The rDNA sequence library was comprised of ca. 50% dinoflagellate reads, which included Gyrodinium, Azadinium, Prorocentrum, and non-classified Dinophyceae followed by ca. 20% metazoan reads, and ca. 9% Syndiniales Group-I (Table S2, Figure 4A). Over one fourth of the rRNA sequence library were dinoflagellates (ca. 27%), which included Gyrodinium, Azadinium and several non-classified Dinophyceae, followed by ciliates (further identified as Oligohymenophorea; ca. 10%), and stramenopiles (mainly diatoms and members of the MArine STramenopile group, MAST-3; ca. 15%) (Table S2, Figure 4B). MDS plots visualizing the relationship between samples based on Bray-Curtis dissimilarity analysis revealed that samples clustered differently with respect to time of day when derived from rRNA vs. rDNA (stress = 0.065 vs. 0.106, respectively, Figure S4).
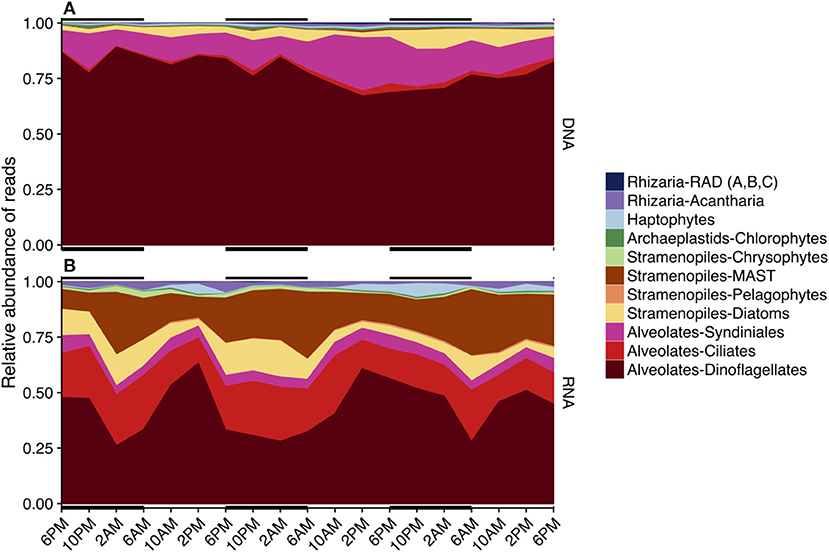
Figure 4. Area plots of the relative sequence abundance of rDNA (A) or rRNA (B) reads for each major taxonomic group. Black horizontal lines indicate periods of darkness (6 p.m.−6 a.m.). Only major taxonomic groups that made up > 0.1% of the total rDNA or rRNA reads are represented here; a full list of sequence abundances can be found in Table S2. Dinoflagellates dominated both sequence libraries (rDNA and rRNA), but the rRNA-based library had fewer total dinoflagellate sequences. The second most abundant sequences in the rDNA sequence library belonged to Syndiniales, while ciliates, MArine STramenopiles (MAST), and diatoms were next in abundance in the rRNA library.
Significant diel periodicities among dinoflagellate, ciliate, Syndiniales, haptophyte, and stramenopile OTUs were identified in the rRNA dataset based on the non-parametric RAIN analysis (Table 1, p < 0.05). There were 315 rRNA OTUs with significant diel rhythmicity which accounted for 50.8% of the rRNA sequence library (Table 1, Table S3, p < 0.05). There were also 182 rDNA OTUs with significant diel rhythmicity, which made up only 34.9% of the DNA sequence library (Table S3, p < 0.05).
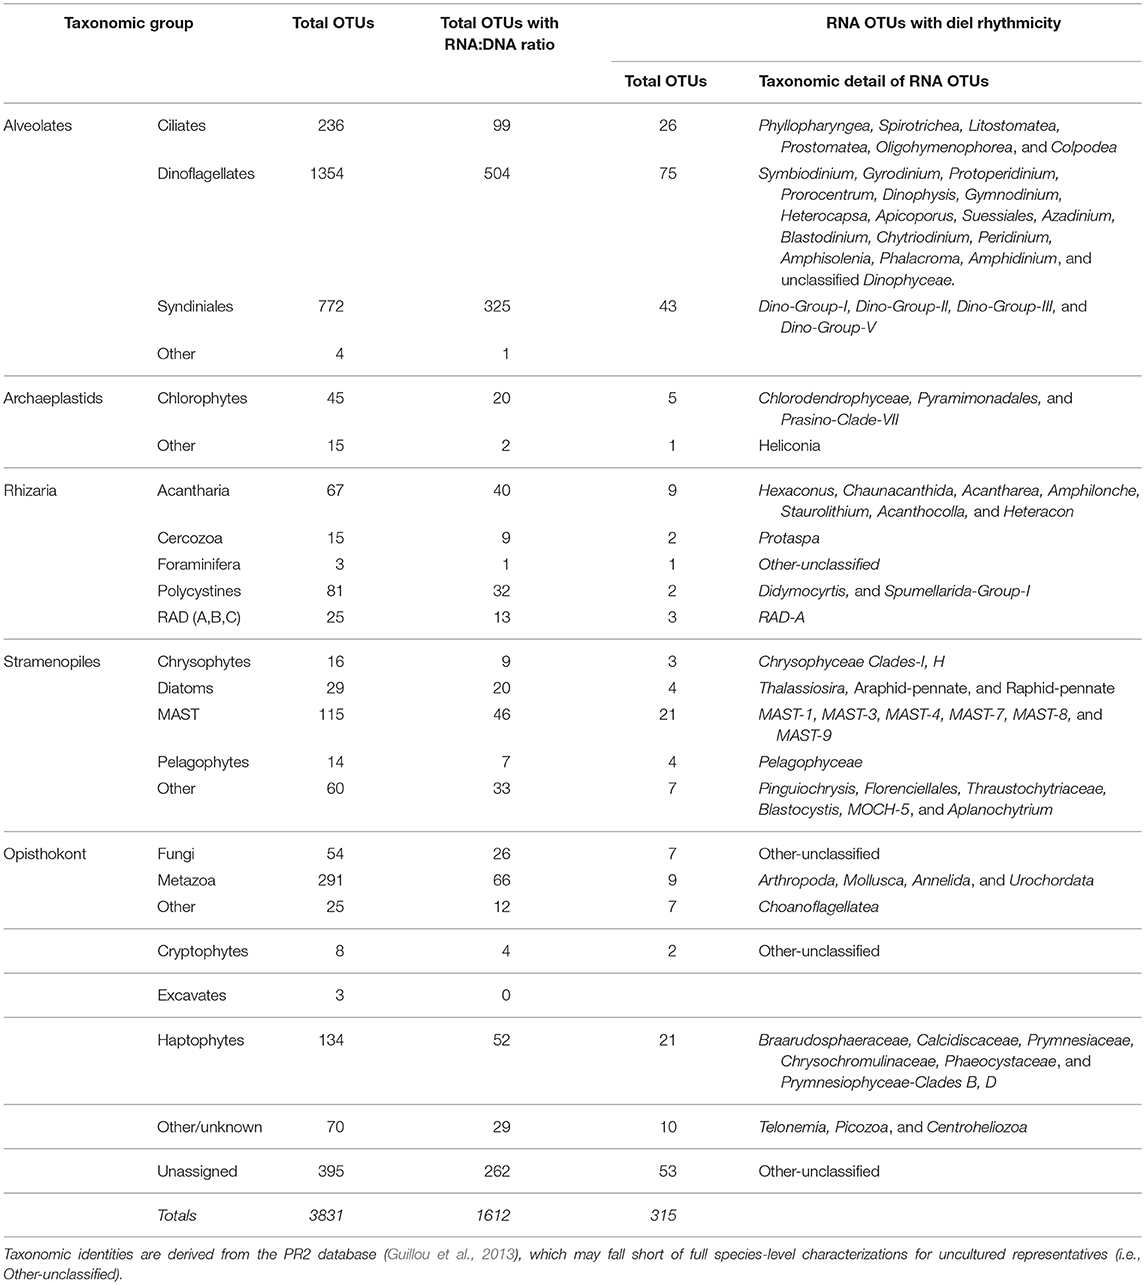
Table 1. Total number of OTUs, total number of OTUs with both RNA and DNA sequences (Figures 5, 6), total number of rRNA OTUs and taxonomic identities of those OTUs found to have significant rhythmicity based on RAIN analysis (p < 0.05, see Materials and Methods); a full list is available in Table S3.
Relative Metabolic Activity Varied as a Factor of Taxonomic Group and Time of Day
Patterns of relative metabolic activity throughout the course of a day were inferred from changes in the number of ribosomal RNA reads in each major taxonomic group. Within each taxonomic group, the mean and standard mean error of the RNA:DNA read ratios of OTUs at each time point were calculated (Figures 5, 6). OTUs with missing rDNA or rRNA sequences were excluded (also see Hu et al., 2016; Laroche et al., 2017), retaining 91% of the total number of sequences and 1,612 total OTUs (Table 1). Taxon-specific gene copy number, cell size, and metabolic capabilities contribute variation in rRNA tag-sequencing results (Blazewicz et al., 2013). We acknowledge this variability by comparing ratios only within major taxonomic groups (also see Hu et al., 2016). Taxonomic groups were broadly classified as either phototrophic/mixotrophic (chloroplast-containing) or non-phototrophic to examine trends in RNA:DNA ratios over the diel period (Figures 5, 6, respectively; taxa not discussed are included in Figure S5).
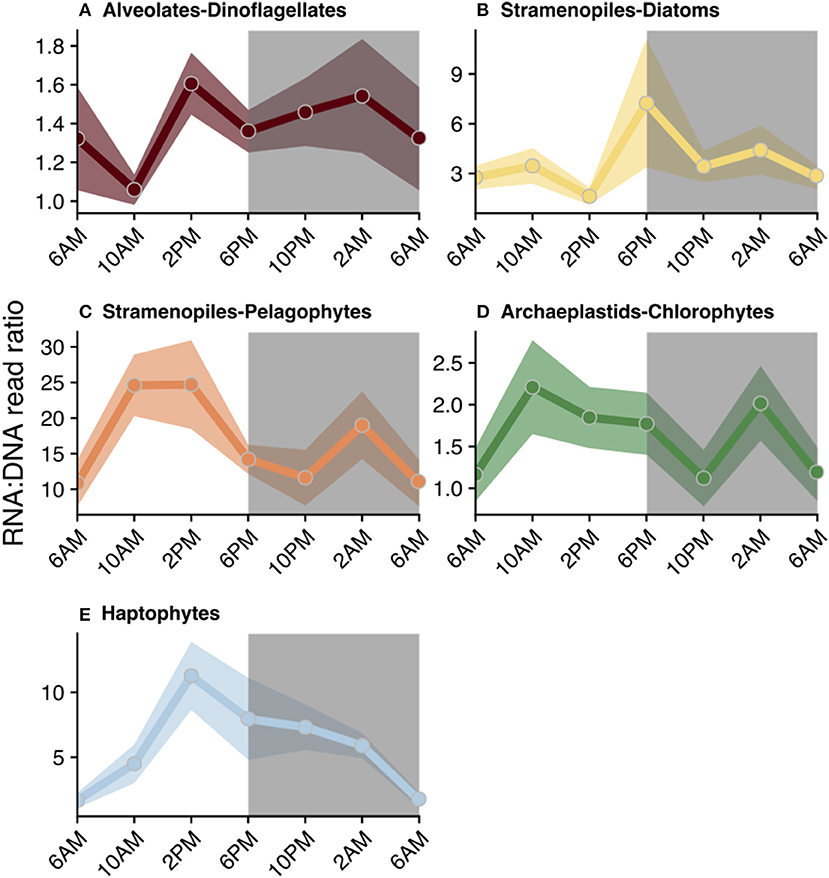
Figure 5. Diel trends in relative metabolic activity inferred from changes in mean RNA:DNA ratios among phototrophic/mixotrophic taxonomic groups: (A) dinoflagellates, (B) diatoms, (C) pelagophytes, (D) chlorophytes, and (E) haptophytes. For each time point, the average RNA:DNA ratio for OTUs within the same taxonomic group was calculated to better illustrate relative changes throughout the course of a day (circles). Shading surrounding each line represents the standard mean error of the RNA:DNA ratios for OTUs assigned to each taxonomic group. Total number of OTUs included for analysis and a summary of the OTUs found to have significant diel periodicity are reported in Table 1. Gray shaded regions indicate the dark cycle (night period). To better represent the cyclical nature of the study, 6 a.m. was plotted twice.
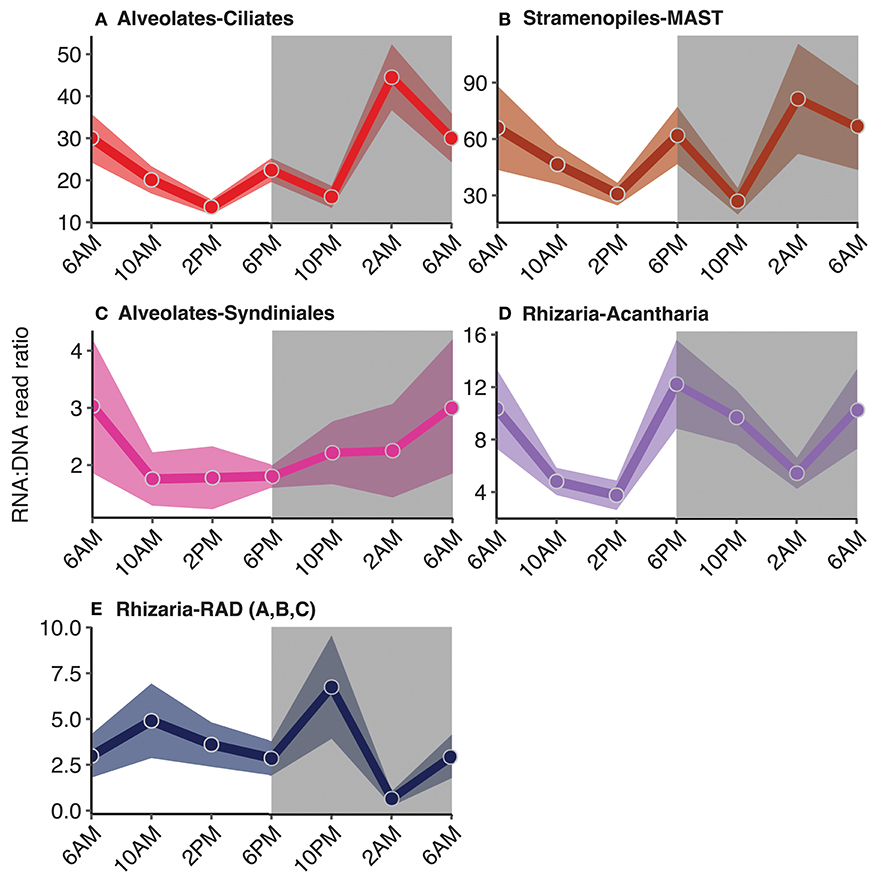
Figure 6. Diel trends in relative metabolic activity inferred from changes in mean RNA:DNA ratios among non-phototrophic taxonomic groups: (A) ciliates, (B) MArine STramenopiles (MAST), (C) Syndiniales, and rhizarian groups, (D) acantharia and (E) radiolaria. For each time point, the average RNA:DNA ratio for OTUs within the same taxonomic group was calculated to better illustrate relative changes throughout the course of a day (circles). Shading surrounding each line represents the standard mean error of the RNA:DNA ratios for OTUs assigned to each taxonomic group. Total number of OTUs included for analysis and a summary of the OTUs found to have significant diel periodicity are reported in Table 1. Gray shaded regions indicate the dark cycle (night period). To better represent the cyclical nature of the study, 6 a.m. was plotted twice.
RNA:DNA ratios for most chloroplast-containing taxonomic groups peaked mid-day (10 a.m. or 2 p.m.) and again at night (10 p.m. or 2 a.m., Figure 5). Individual dinoflagellate OTUs with significant diel rhythmicity included (n = 75): Gyrodinium Prorocentrum, Dinophysis, and many non-classified Dinophyceae OTUs (Table 1, Table S3, p < 0.05). Diatom RNA:DNA ratios were highest at 6 p.m. and four OTUs exhibited significant periodicity (Figure 5B, Table 1, Table S3, p < 0.05). Four pelagophyte (Pelagophyceae), 5 chlorophyte (mainly, Pyramimonadales), and 21 haptophyte (mainly, Chrysochromulineaceae) OTUs were found to have significant rhythmicity (Table 1, Table S3, p < 0.05).
RNA:DNA ratios for ciliates (which are primarily non-phototrophic) and MAST peaked at dusk and again toward the end of the dark cycle (6 p.m. and 2 a.m., Figures 6A,B). 26 of the 236 ciliate OTUs exhibited significant rhythmicity, including species belonging to the Spirotrichea class (Table 1, Table S3, p < 0.05). Additionally, there were 21 MAST OTUs with significant rhythmicity mainly including groups 1, 3, and 7 (Table 1, Table S3, p < 0.05). Relative metabolic activities among Syndiniales had a clear diel trend, increasing throughout the dark cycle (Figure 6C). Syndiniales OTUs with significant rhythmicity mainly belonged to Groups II and III (n = 43; Table 1, Table S3, p < 0.05). Rhizarian groups, including acantharia and radiolaria (RAD groups A, B, and C), had higher relative metabolic activities at dusk compared to daytime; there were 9 acantharian and 3 radiolarian OTUs found to have significant rhythmicity (Figures 6D,E, Table 1, Table S3; p < 0.05).
Potential Symbiotic Relationships Supported by Significantly Co-Occurring OTUs
eLSA analysis based on rRNA OTUs (n = 201) and associated metadata resulted in over 22,500 total correlations. The analysis yielded 1,684 correlations after filtering for highly significant co-occurring OTUs (see section Materials and Methods). The top 20 correlations between major taxonomic groups (based on frequency of significantly co-occurring OTUs) are summarized in Table 2, a full list is reported in Table S4. Dinoflagellate and ciliate OTUs made up the majority of the significant interactions, followed by stramenopiles (Table 2, Table S4). Additionally, many OTUs involved in significant interactions were also found to have significant diel rhythmicity (top 20 listed in Table 2; compare Tables S3, S4).
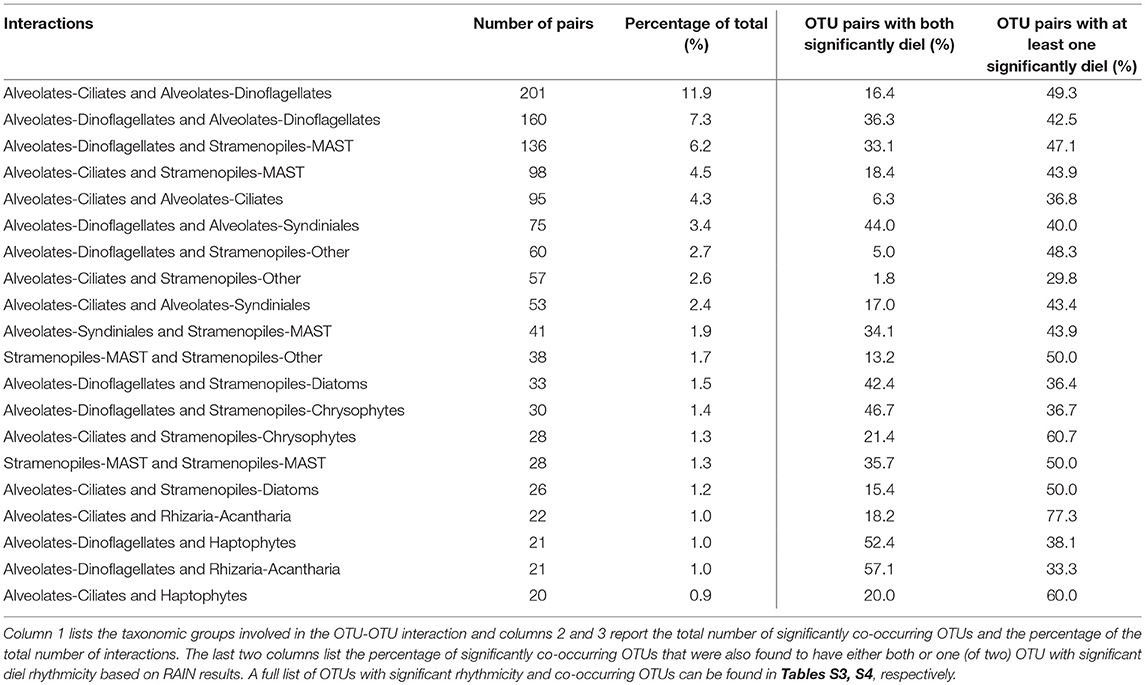
Table 2. Results of the top 20 significantly co-occurring OTUs based on Local Similarity Analysis results (see section Materials and Methods for significance thresholds).
Results from eLSA were primarily examined for putative symbiosis, specifically Syndiniales parasitism of other protists, or mutualism between rhizarian hosts and endosymbionts (Table 3). Syndiniales OTUs with either negative or positive with time-delayed relationships with other OTUs made up 53% of the significant correlations (127/238 OTU pairs; Table 3A, Table S4). The majority of correlated OTUs with Syndiniales were identified as ciliates, dinoflagellates, or stramenopiles (Table 3A). 51% of the significantly co-occurring OTUs with rhizaria were positive (42/82; Table 3B, Table S4). All rhizarian OTUs were identified as acantharia (Table S4), and were mainly found to significantly correlate with ciliate and dinoflagellate OTUs (Table 3B). Significant correlations between OTUs and environmental parameters were also detected; dinoflagellate, ciliate, and MAST OTUs were the most common taxonomic groups significantly co-correlated to chlorophyll a, dissolved oxygen, salinity, or temperature (Table S5). Measured chlorophyll a appeared to have a diel trend (Figure 1C), and the eLSA results revealed that dissolved oxygen, salinity, and temperature had a higher number of OTUs with significantly co-occurring patterns (Table S5).
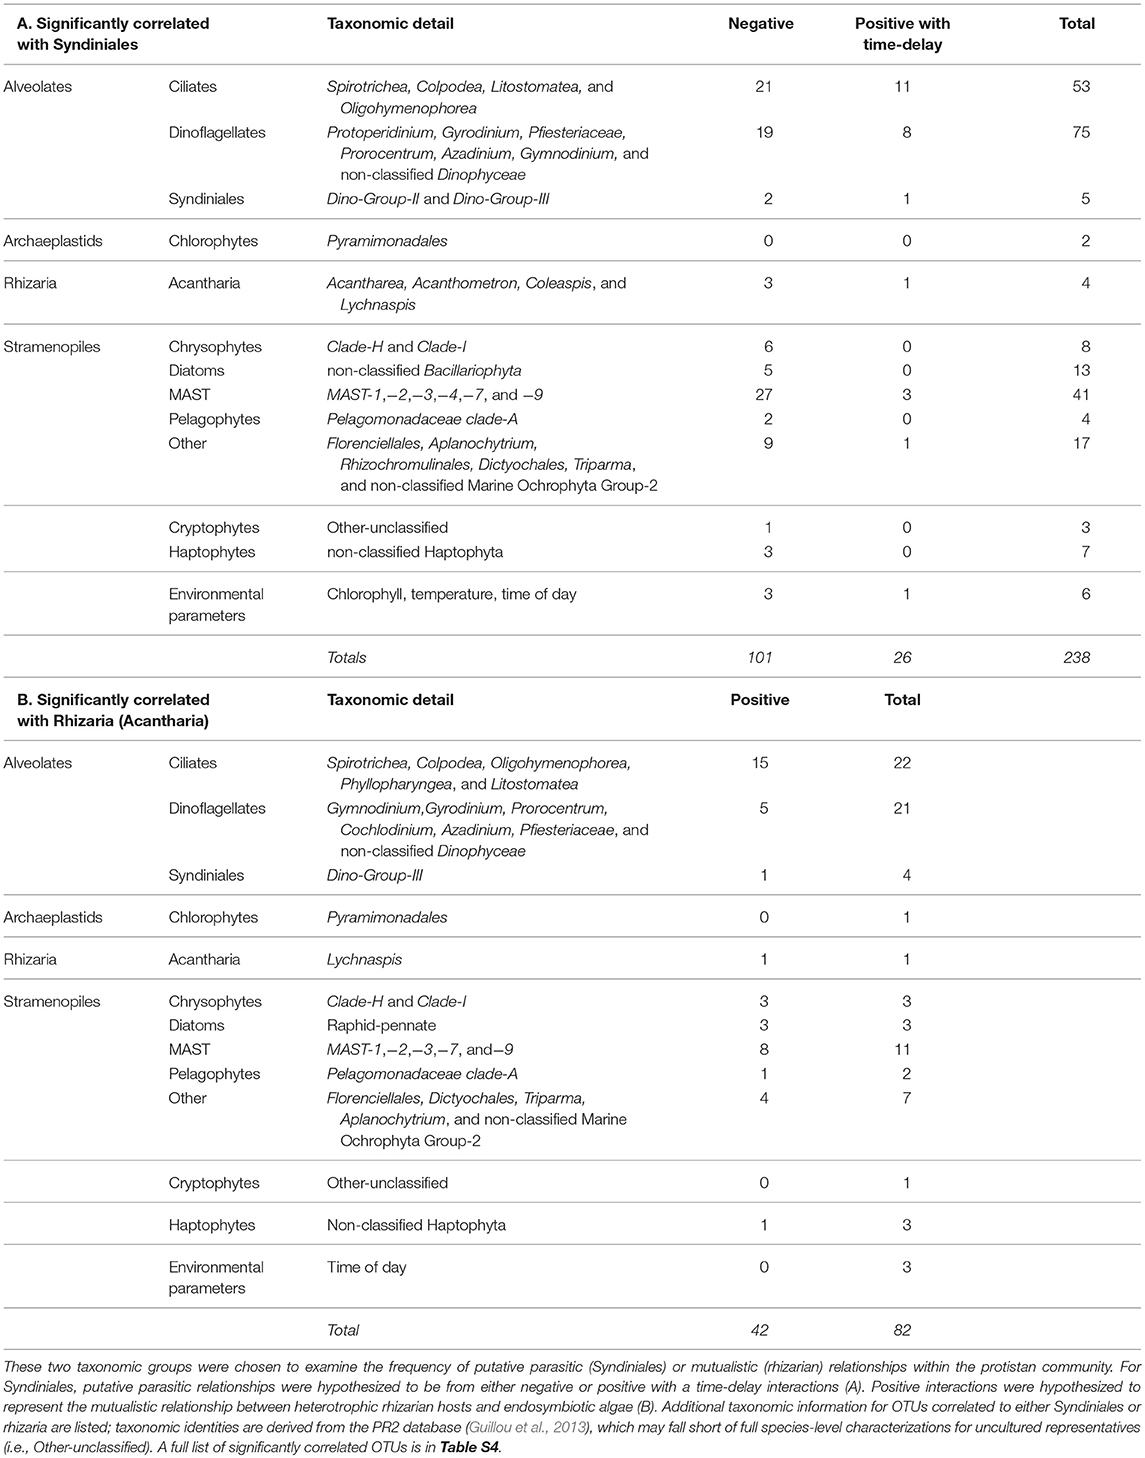
Table 3. Summary of significantly correlated OTUs associated with either (A) Syndiniales or (B) rhizaria.
Discussion
Studies with high-resolution sampling, such as this one, contribute insights into the daily timing of the metabolic activities of major protistan groups underlying microbial community structure and function. Our study of rhythmicity in the relative metabolic activities of those taxa allowed us to infer the timing of photosynthetic processes and important trophic linkages, including predator-prey and symbiotic interactions.
Regular, long-term (i.e., monthly or seasonal) ecological studies in the North Pacific Subtropical Gyre (NPSG) have provided valuable information on the complex microbial interactions that drive ecosystem-level biogeochemical cycling at longer time scales (Church et al., 2013; Pasulka et al., 2013; Karl and Church, 2014; Rii et al., 2016; Böttjer et al., 2017), but we are unaware of any studies that have examined changes in protistan composition on temporal scales of hours, as conducted here. Previous findings revealed summertime peaks in C:Chl a and heterotrophic biomass, emphasizing the importance of characterizing protistan trophic strategy in addition to community abundances in ecological studies (Pasulka et al., 2013). By documenting the short-term temporal (diel) dynamics of protists in this study, we expand on current knowledge of protistan roles in marine food webs.
Total Species Richness and Community Composition Based on rDNA and rRNA
Diel shifts in community species richness were more clearly represented in the rRNA sequence results relative to rDNA results (Figures 2–4, Figures S3, S4). rRNA-derived estimates of richness have previously been shown to be responsive to seasonal conditions (Charvet et al., 2014; Hu et al., 2016). In this study, rRNA estimates of species richness revealed a temporally varying subset of the protistan community, while rDNA species richness remained relatively high and unchanged (Figure 2). We hypothesize that diel periodicity observed in the total rRNA OTUs represented changes in transcriptional activity, resulting in significant changes in the relative abundances of OTUs within a dataset, with other less-active OTUs falling below the level of detection at certain times of day. Observed changes in the potential metabolic activity of specific protistan taxa at different times of day thereby corresponded to apparent changes in community composition and species richness (Figure 3). For example, higher metabolic activities of dinoflagellate and haptophyte OTUs, and to some extent chlorophyte, pelagophyte, and diatom OTUs from mid-afternoon to early evening resulted in strong representation of those taxa in the rRNA-derived dataset. As a consequence, the relative importance of sequences from other taxa were reduced, changing apparent species richness (compare red line in Figure 2 to Figures 3C,D).
The composition of major protistan taxonomic groups, based on relative rRNA reads, fluctuated throughout the course of a day (Figure 4) and a higher number of rRNA OTUs were found to have significant diel rhythmicity based on RAIN analysis compared to rDNA OTUs (Table 1). These results provided additional support that rRNA results offered a clearer approach to follow microbial community responses to the light-dark cycle. Previous DNA-based work at a coastal time-series station found that some spatial (within 5 km) and temporal (once daily) variability during sample collection did not dramatically change long-term (e.g., monthly or seasonal) ecological interpretations (Lie et al., 2013; Needham et al., 2017). Those studies, based on DNA sequencing, have provided estimates of total community diversity suitable to detect monthly or seasonal shifts, while results derived here from RNA sequencing better reflect the short-term temporal dynamics in the microbial community. Moreover, our results indicate that time of day should be considered when characterizing daily or weekly microbial responses to environmental changes using ribosomal RNA for 18S tag-sequencing analyses.
Finally, the timing of shifts in relative sequence abundance and inferred metabolic activities (RNA:DNA ratios) for several taxonomic groups or nutritional modes (e.g., photosynthetic taxa) across the diel cycle indicated some common ecological strategies for different protistan lineages to persist at very short time scales (Figures 4–6). However, the exact timing of these peaks varied somewhat among taxonomic groups (Figures 5, 6), presumably reflecting group-specific differences in requirements and availability of key resources (e.g., solar energy, prey, or dissolved nutrients).
Phytoplankton Metabolic Activity is Synchronized With the Light Cycle
Diel rhythmicity in the biological activities of marine phytoplankton have been reported in both culture- and field-based studies, including periodicity in photosynthetic capacity (Lorenzen, 1963; Harding et al., 1982), chlorophyll a accumulation (Owens et al., 1980), uptake and assimilation of nutrients (Goering et al., 1964; Eppley et al., 1971a,b; Bender et al., 2012), and transcriptional regulation of cellular processes (Smayda, 1975; Nelson and Brand, 1979; Bender et al., 2012; Askworth et al., 2013; Smith et al., 2016). While the magnitude and exact timing of various metabolic processes is often group-specific among taxa (Nelson and Brand, 1979), light-dark cycling is a common environmental forcing factor. Therefore, general synchrony in inferred activities might be expected, especially among photoautotrophs. Such synchrony might also be expected to result in diel variations in carbon content per cell and average cell sizes, which has been reported (Binder and DuRand, 2002; Zinser et al., 2009; Hunter-Cevera et al., 2014). Assuming cellular rDNA content remains relatively constant (Zhu et al., 2005), changes in relative metabolic activity (higher RNA:DNA ratio), as observed in this study, likely reflected increased photosynthesis and carbon fixation with the availability of sunlight during the day. RNA:DNA ratios generally increased from morning to evening among primarily phototrophic taxa (Figure 5).
The relative metabolic activity of chlorophytes (inferred from RNA:DNA ratios), for example, correlated with the light cycle: ratios increased throughout the day, with a peak mid-day/afternoon, and then decreased at night (Figure 5D). This finding is in agreement with changes in chlorophyll a throughout the day (Figure 1C) and consistent with two molecular-based studies Poretsky et al. (2009) and Aylward et al. (2015). These studies found transcripts associated with energy acquisition in the chlorophyte Ostreococcus to peak during the day. Further, Aylward et al. (2015) observed a diel progression of the transcripts associated with carbon fixation in the morning, followed by photosynthesis-related transcripts mid-day. Other taxonomic groups also demonstrated increased relative metabolic activity throughout the day, but daily maxima in RNA:DNA ratios were often somewhat temporally offset (e.g., 6 p.m. for diatoms, 10 a.m. for pelagophytes, or 6 p.m. for chlorophytes and haptophytes; Figures 5B–E) or exhibited secondary peaks during the dark cycle (e.g., 2 a.m. for diatoms, pelagophytes, and chlorophytes, Figures 5B–D).
Peaks in relative metabolic activity during the dark cycle among primarily phototrophic groups indicates that these taxa continue to synthesize intracellular compounds in the absence of light, presumably relying on carbon stores accumulated during daytime for energy. Phytoplankton have been shown to continue synthesizing protein throughout the nighttime at rates that may equal or exceed synthesis during the day (Cuhel et al., 1984). This behavior might explain the secondary peaks in RNA:DNA ratios observed in diatoms, pelagophytes, and chlorophytes (Figures 5B–D). In support of this observation, both field- and culture-based work has reported continued transcription in phytoplankton during dark periods (Poretsky et al., 2009; Askworth et al., 2013; Aylward et al., 2015). For example, diatoms cultured in a light-dark cycle switched from the expression of genes associated with the synthesis of chloroplast-related proteins during the light period to mitochondria-related proteins in the dark (Bender et al., 2012). Similarly, Smith et al. (2016) noted that diatoms in the dark increased the transcription of genes associated with the catabolism of stored carbon.
Nighttime increases in RNA:DNA by phytoplankton at station ALOHA could likely be a consequence of continued nutrient uptake during the dark period with concomitant cellular reorganization, as daytime photosynthate is transformed from carbon rich storage products into nutrient-requiring components (e.g., protein, nucleic acids). Rates of nutrient acquisition are size- and taxon-dependent (Hein et al., 1995; Finkel et al., 2009), consequently it could be anticipated that the timing of these processes will be group-specific. Such specificity may explain the temporally offset peaks in RNA:DNA ratios observed in larger diatoms compared to smaller chlorophytes in Figures 5B,D. Similar to the diel trend in diatom potential activity reported here (Figure 5B), Owens et al. (1980) noted that diel C:Chl a ratios in a natural diatom-dominated phytoplankton population increased during the transition from light to dark and decreased at the start of the next light cycle. Additionally, increases in relative metabolic activity during the transition from dark to light may also be attributed to anticipatory increases in transcripts related to photosynthetic machinery (Askworth et al., 2013). Understanding the temporal fluctuations in the metabolic activity among physiologically distinct photoautotrophs, such as chlorophytes and diatoms, is key for characterizing environmental forcing factors that may impact primary production and species composition of the phytoplankton community.
Another possible explanation for the secondary (nighttime) peaks observed in the RNA:DNA ratios among photosynthetic taxa in the present study (Figure 5) is supplementation of phototrophy with phagotrophic ingestion of prey (i.e., mixotrophy). Some mixotrophic algae conduct phagotrophy in response to periods of reduced availability of inorganic nutrients and/or light (Nygaard and Tobiesen, 1993; McKie-Krisberg et al., 2015; Gerea et al., 2018). Increases in relative metabolic activity in the absence of light may reflect grazing activity among taxonomic groups that include potentially mixotrophic taxa including species of chlorophytes, pelagophytes, haptophytes, and dinoflagellates (Stoecker, 2006; McKie-Krisberg and Sanders, 2014; Unrein et al., 2014). However, microscopical analyses from the same cruise summarized in this study found that the ingestion of bacterial prey by mixotrophic phytoflagellates occurred throughout the day and night, but did not display significant diel periodicity (Connell et al., in prep). Taken together, these findings indicate that behaviors other than mixotrophy (e.g., nighttime nutrient uptake and cellular reorganization) may better explain secondary peaks in RNA:DNA ratios among predominantly-photosynthetic protistan taxa.
Diel Trends in Heterotrophic Metabolic Activity Implied Predator-Prey Interactions
While the synchronization of photoautotrophic activity with available solar energy was an anticipated finding in this study, the diel periodicity observed for phagotrophic protists was unexpected. Most protistan groups characterized by phagotrophic taxa had higher relative metabolic activities at night compared to daytime (Figure 6) and several groups were found to have significant diel periodicities, including dinoflagellates, haptophytes, ciliates, and MAST (Table 1, Table S2). Significant OTU interactions, (derived from eLSA) which may be representative of putative predator-prey relationships among dinoflagellates, ciliates, and MAST, included OTUs with significant diel rhythmicity (Table 2), providing additional support for heterotrophic protistan processes in coordination with the light-dark cycle.
Studies conducted at station ALOHA have found that cell division rates among picophytoplankton consistently peaked at dusk, presumably increasing the number of prey available to grazers (Vaulot and Marie, 1999; Binder and DuRand, 2002; Tsai et al., 2009; Wilson et al., 2017). Additional work from the same cruise as reported in this study, however, found that division events of the picophytoplankton (predominantly Prochlorococcus) consistently peaked at dusk, yet day-to-day cell abundances of these same primary producers remained relatively stable. This suggests that mortality via protistan grazing and other sources of mortality contributed to relatively stable picophytoplankton cell abundances throughout the day despite a consistent diel periodicity in picophytoplankton cell division (Ribalet et al., 2015; Connell et al., in prep). Higher RNA:DNA ratios at night among phagotrophic protists, compared to daytime ratios, is consistent with increased grazing activity during the night (Figure 6). Supporting this observation, Connell et al. found significant diel periodicity in the percentage of heterotrophic nanoflagellates (2-20 μm phagotrophs) containing ingested picoplanktonic prey, with the highest percentages of ingested prey recorded during the night. Because a large percentage of the primary production in the euphotic zone at station ALOHA, and elsewhere in the ocean, is consumed by protistan grazers (Strom et al., 1997; Calbet and Landry, 2004; Schmoker et al., 2013), our findings identify an important aspect regarding the composition and metabolic activity of the grazer community that is linked to the day-night cycle.
Significantly Co-occurring OTUs Inferred Parasitism and Mutualism Among Protists
Symbiotic associations between protistan species are well-documented, but typically not included in current food web descriptions, due to the complex and diverse nature of these relationships (Worden et al., 2015). Putative symbiotic partnerships among protists were inferred from significant time-dependent associations among OTUs using eLSA (Xia et al., 2011). While we cannot definitively identify the nature of these interactions, we characterized significantly co-occurring OTUs based on the known ecology of the putative symbioses: parasitism with Syndiniales, or mutualism with rhizaria.
Syndiniales are an exclusively parasitic order known to obligately kill their hosts (Guillou et al., 2008). Recent global surveys have shown that parasitism in marine environments may be a previously overlooked but very significant source of mortality in aquatic food webs (Lima-Mendez et al., 2015). Based on parasitoid life cycle ecology, the strongest putative parasite-host relationships were hypothesized to be either negative or positive but time-delayed interactions (see also: Chow et al., 2014). In the present study, 53% of the significant interactions with Syndiniales were either negative, or positive with a time-delay, and the majority of these interactions were associated with their most common host, dinoflagellates (Table 3A). Network analyses from a recent global ocean survey (de Vargas et al., 2015; Lima-Mendez et al., 2015) detected a significant number of associations involving parasitic Syndiniales, but these interactions were derived from rDNA sequences. Due to the variable rDNA copy number among alveolates, the number of OTU correlations in those studies may be inflated (Krabberød et al., 2017). However, the use of rRNA sequences in the present study, which presumably provides a better characterization of active protists, supported putative host-parasite relationships between OTUs within the Syndiniales and numerous other alveolates (Tables 2, 3A, Table S4). These findings demonstrate a potentially important underestimation of protistan mortality near station ALOHA. Additionally, Syndiniales infections of dinoflagellates have been shown to alter dinoflagellate behavior (e.g., inhibit phototaxis and swimming speed in Park et al., 2002); thus, we speculate that parasitic infections of protistan species may have a more complex impact on marine food webs than mortality alone (e.g., altered host cell activity).
Recent surveys of protistan diversity have documented the previously underappreciated global abundance and contribution to carbon export by rhizaria (Burki and Keeling, 2014; Biard et al., 2016; Caron, 2016; Guidi et al., 2016). While difficult to study due to the delicate nature of their skeletal structures and lack of cultured representatives (Ohtsuka et al., 2015), molecular surveys have been more successful in characterizing the in situ ecological roles of rhizaria (Biard et al., 2016; Guidi et al., 2016; Hu et al., 2016). Rhizaria occupying the euphotic zone commonly form symbiotic partnerships with phototrophic protists, most notably dinoflagellates and haptophytes (Decelle et al., 2012, 2015; Ohtsuka et al., 2015). This relationship is hypothesized to be mutualistic; endosymbionts support host nutrition and in turn the host serves as a refuge from predation and a source of nutrients for primary productivity by the symbionts in oligotrophic oceanic ecosystems (Michaels, 1988). Rates of primary production can be much higher within the holobiont (rhizarian host plus endosymbiont) than in the surrounding environment (Caron and Swanberg, 1990; Caron et al., 1995); therefore, understanding the nature of this holobiont has implications for improving our ability to measure the amount of carbon available in marine food webs.
We found 82 OTUs to be significantly correlated with rhizaria, based on eLSA results (Table 3B). Positive interactions with acantharian hosts included the likely endosymbionts: dinoflagellates and haptophytes (Table 3B). Consistent with our findings, many dinoflagellate and haptophyte endosymbionts have been found with acantharian hosts, sometimes with multiple microalgal symbionts (Decelle et al., 2012, 2015) (Table 3B). Rhizaria in the NPSG (in either solitary or colony form) may exceed the size of our prefiltration (>100 μm; see Materials and Methods), thus the frequency of rhizaria with endosymbionts may be underestimated in this study. Additionally, rhizaria are phagotrophic and have been observed to prey on a wide variety of microorganisms (Anderson et al., 1984; Swanberg and Caron, 1991); thus, co-occurring OTUs with rhizaria may also be a result of predator-prey interactions. Nevertheless, our work demonstrates how molecular information can be used to infer the ecology of difficult-to-study species interactions.
Summary
Collective efforts over the past 30 years have highlighted the global geochemical significance of microbial communities in the NPSG (Church et al., 2013; Karl and Church, 2014); this study contributes to our growing understanding of how protistan trophic interactions may influence carbon cycling and microbial community structure. The inferred metabolic activities of euphotic zone protists near Station ALOHA were found to correspond to the light-dark cycle and reflect group-specific nutritional capabilities. The potential activity of photoautotrophs typically followed the light cycle, suggesting the main driver to be photosynthesis-related processes. However, metabolic activity throughout the dark cycle suggested some phytoplankton continue to synthesize protein at night—likely relying on intracellular carbon reserves. Additionally, putative grazing activity among heterotrophs and potential mixotrophs, showed significant diel coordination with known changes in picophytoplankton population abundances, emphasizing the important role grazers play in structuring microbial communities. Finally, significantly co-occurring OTUs were representative of key trophic interactions among parasitic Syndiniales and mutualistic symbiont-bearing heterotrophs, highlighting the ecologically significant, yet understudied, contribution of symbiosis to marine food web dynamics.
Author Contributions
DC and PC conducted field work. LM assisted with sample processing. SH analyzed data and wrote the paper.
Conflict of Interest Statement
The authors declare that the research was conducted in the absence of any commercial or financial relationships that could be construed as a potential conflict of interest.
Acknowledgments
This work was supported by a grant from the Simons Foundation (P49802) to DC; Simon's Collaboration on Ocean Processes and Ecology (SCOPE). Authors would like to thank the captain and crew of the R/V Kilo Moana and the SCOPE operations team. In particular, we would like to acknowledge Sam Wilson as the Chief Scientist on the cruise, Benedetto Barone for generation of Sea Level Anomalies map, and Eric Shimabukuro. For helpful discussion on the statistics used in this manuscript, authors would like to thank Jacob Cram, Stephen Beckett, Ashley Coenen, and Daniel Muratore.
Supplementary Material
The Supplementary Material for this article can be found online at: https://www.frontiersin.org/articles/10.3389/fmars.2018.00351/full#supplementary-material
Figure S1. Cell counts (105 cells /mL) for heterotrophic bacteria (black, solid line), Prochlorococcus (black, dashed line), Synechococcus (red), and phototrophic picoeukaryotes (blue) based on flow cytometry. Abundances are shown for heterotrophic bacteria and Prochlorococcus on the left axis, and for Synechococcus and phototrophic picoeukaryotes on the right axis. See Materials and Methods for sample processing information; data courtesy of SCOPE ops team at the University of Hawaii—protocols.io: dx.doi.org/10.17504/protocols.io.j2wcqfe.
Figure S2 (A). Total sequences and (B) distribution of OTUs for rDNA and rRNA sequence libraries (top and bottom, respectively) before subsampling both libraries to 42,719 sequences (see section Materials and Methods). Global singletons (OTUs with only one sequence in the entire dataset) were excluded in this analysis. OTUs are labeled as singletons (OTUs found in more than one sample with one sequence), doubletons (OTUs with 2 sequences), or OTUs with 3 or more sequences (colors in bar plots on the right).
Figure S3. Taxonomic composition of total OTUs at each sampling point based on either the rDNA (Top) or rRNA (Bottom) sequence library. Black horizontal lines indicate periods of darkness (6 p.m.−6 a.m.).
Figure S4. MDS clustering by samples based on either (A) RNA-derived results or (B) DNA-derived results, derived from a Bray-Curtis dissimilarity matrix (vegan package in R). Results cluster samples based on community diversity. There was less stress associated with the RNA-derived results (stress = 0.065) relative to DNA-derived results (stress = 0.106).
Figure S5. Diel trends in relative metabolic activity inferred from changes in mean RNA:DNA ratios among non-phototrophic taxonomic groups: (A) Chrysophytes, (B) Cercozoa, and (C) Polycystines. For each time point, the average RNA:DNA ratio for OTUs within the same taxonomic group was calculated to better illustrate relative changes throughout the course of a day (circles). Shading surrounding each line represents the standard mean error of the RNA:DNA ratios for OTUs assigned to each taxonomic group. Total number of OTUs included for analysis and a summary of the OTUs found to have significant diel periodicity are reported in Table 1. Gray shaded regions indicate the dark cycle (night period). To better represent the cyclical nature of the study, 6 a.m. was plotted twice.
Table S1. Collection information for each sample. Samples were collected every 4 h for 3 days, following a Lagrangian sampling schematic. Reported here, are the dates, time of sampling, location, depth (all 15 m), and amount filtered per sample. All collected seawater was pre-filtered through an 100 μm Nitex mesh screen to remove multicellular eukaryotes. See protocols.io dx.doi.org/10.17504/protocols.io.hisb4ee and Materials and Methods section for more information.
Table S2. Total sequence count results for both rDNA and rRNA sequence libraries. OTUs were assigned taxonomic identities based on their alignment to the PR2 database (Guillou et al., 2013), also see section Materials and Methods. Manual taxonomic group names were assigned at approximately class or phylum levels (see columns “Taxa” and “Taxa2”) in order to visualize the complex microbial community.
Table S3. Full list of OTUs found to have significant diel rhythmicity based on RAIN analysis (see Material and Methods). Taxonomic identities (Level 1-8) are derived from the PR2 database (Guillou et al., 2013), which may fall short of full species-level characterizations for uncultured representatives (i.e., “XX” and Other-unclassified).
Table S4. List of highly significantly correlated OTUs based on Local Similarity Analysis (Xia et al., 2011, 2013). OTUs were derived from the RNA sequence library and were first filtered so that each OTU had at least 10 sequences and appeared in all 19 time points; data was then center log-ratio transformed. OTUs without a taxonomy assignment (Unknown or unclassified) were discarded. OTU interactions were considered significant based on p-value (q < 0.05), q-value (q < 0.05), and Spearman rank correlation coefficients (> 0.5 or < −0.5). Table lists type of significantly correlated pair (top 20 are summarized in main text Table 2), OTU identity, manually assigned taxonomic name, and full taxonomic identity from the PR2 database.
Table S5. Number of OTUs significantly correlated to environmental parameters based on Local Similarity Analysis. Table is organized by the major taxonomic group and sub-group (columns 1 and 2). The total number of OTUs correlated to chlorophyll, dissolved oxygen, salinity, and temperature are listed in the remaining columns.
References
Anderson, O. R., Swanberg, N. R., and Bennett, P. (1984). An estimate of predation rate and relative preference for algal versus crustacean prey by a spongiose skeletal radiolarian. Mar Biol. 78, 205–207.
Aronesty, E. (2011). ea-utils: Command-Line Tools for Processing Biological Sequencing Data. Available online at: https://github.com/ExpressionAnalysis/ea-utils
Askworth, J., Coesel, S., Lee, A., Armbrust, E. V., Orellana, M. V., and Baliga, N. S. (2013). Genome-wide diel growth state transitions in the diatom Thalassiosira pseudonana. Proc. Natl. Acad. Sci. U.S.A. 110,7518–7523. doi: 10.1073/pnas.1300962110
Aylward, F. O., Eppley, J. M., Smith, J. M., Chavez, F. P., Scholin, C. A., and DeLong, E. F. (2015). Microbial community transcriptional networks are conserved in three domains at ocean basin scales. Proc. Natl. Acad. Sci. U.S.A. 112, 5443–5448. doi: 10.1073/pnas.1502883112
Bender, S. J., Parker, M. S., and Armbrust, E. V. (2012). Coupled effects of light and nitrogen source on the urea cycle and nitrogen metabolism over a diel cycle in the marine diatom Thalassiosira pseudonana. Protist 163, 232–251. doi: 10.1016/j.protis.2011.07.008
Biard, T., Stemmann, L., Picheral, M., Mayot, N., Vandromme, P., Hauss, H., et al. (2016). In situ imaging reveals the biomass of giant protists in the global ocean. Nature 532, 504–507. doi: 10.1038/nature17652
Binder, B. J., and DuRand, M. D. (2002). Diel cycles in surface waters of the equatorial Pacific. Deep Sea Res. II 49, 2601–2617. doi: 10.1016/S0967-0645(02)00050-4
Blazewicz, S. J., Barnard, R. L., Daly, R. A., and Firestone, M. K. (2013). Evaluating rRNA as an indicator of microbial activity in environmental communities: limitations and uses. ISME J. 7, 2061–2068. doi: 10.1038/ismej.2013.102
Böttjer, D., Dore, J. E., Karl, D. M., Letelier, R. M., Mahaffey, C., Wilson, S. T., et al. (2017). Temporal variability of nitrogen fixation and particulate nitrogen export at Station ALOHA. Limnol. Oceanogr. 62, 200–216. doi: 10.1002/lno.10386
Burki, F., and Keeling, P. J. (2014). Rhizaria. Curr. Biol. 24, R103–R107. doi: 10.1016/j.cub.2013.12.025
Calbet, A., and Landry, M. R. (2004). Phytoplankton growth, microzooplankton grazing, and carbon cycling in marine systems. Limnol. Oceanogr. 49, 51–57. doi: 10.4319/lo.2004.49.1.0051
Caporaso, J. G., Kuczynski, J., Stombaugh, J., Bittinger, K., Bushman, F. D., Costello, E. K., et al. (2010). QIIME allows analysis of high-throughput community sequencing data. Nat. Methods 7, 335–336. doi: 10.1038/nmeth.f.303
Caron, D. A. (2016). Ocean science: the rise of Rhizaria. Nature 532, 444–445. doi: 10.1038/nature17892
Caron, D. A., Michaels, A. F., Swanberg, N. R., and Howse, F. A. (1995). Primary productivity by symbiont-bearing planktonic sarcodines (Acantharia, Radiolaria, Foraminifera) in surface waters near Bermuda. J. Plankton Res. 17, 103–129.
Caron, D. A., and Swanberg, N. R. (1990). The ecology of planktonic sarcodines. Aquat. Sci. 3, 147–180.
Charvet, S., Vincent, W. F., and Lovejoy, C. (2014). Effects of light and prey availability on Arctic freshwater protist communities examined by high-throughput DNA and RNA sequencing. FEMS Microbiol. Ecol. 88, 550–564. doi: 10.1111/1574-6941.12324
Chow, C. E., Kim, D. Y., Sachdeva, R., Caron, D. A., and Fuhrman, J. A. (2014). Top-down controls on bacterial community structure: microbial network analysis of bacteria, T4-like viruses and protists. ISME J. 8, 816–829. doi: 10.1038/ismej.2013.199
Church, M. J., Bjorkman, K. M., and Karl, D. M. (2013). HOT turns 25: a quarter century of Hawaii Ocean Time-series OCB. News 6, 1–35. Available online at: https://darchive.mblwhoilibrary.org/handle/1912/7117
Connell, P., Ribalet, F., Armbrust, E. V., and Caron, D. A. (in prep) Diel oscillations in feeding strategies of heterotrophic mixotrophic nanoplankton in the North Pacific Subtropical Gyre.
Corinaldesi, C., Barucca, M., Luna, G. M., and Dell'Anno, A. (2011). Preservation, origin and genetic imprint of extracellular DNA in permanently anoxic deep-sea sediments. Mol. Ecol. 20, 642–654. doi: 10.1111/j.1365-294X.2010.04958.x
Cuhel, R. L., Ortner, P. B., and Lean, D. R. S. (1984). Night synthesis of protein by algae. Limnol. Oceanogr. 29, 731–744.
de Vargas, C., Audic, S., Henry, N., Decelle, J., Mahé, F., Logares, R., et al. (2015). Eukaryotic plankton diversity in the sunlit ocean. Science 348, 1–12. doi: 10.1126/science.1261605
Decelle, J., Colin, S., and Foster, R. A. (2015). “Photosymbiosis in marine planktonic protists,” in Marine Protists, eds S. Ohtsuka, T. Suzaki, T. Horiguchi, N. Suzuki, and F. Not (Tokyo: Springer Japan), 465–500.
Decelle, J., Siano, R., Probert, I., Poirier, C., and Not, F. (2012). Multiple microalgal partners in symbiosis with the acantharian Acanthochiasma sp. (Radiolaria). Symbiosis 58, 233–244. doi: 10.1007/s13199-012-0195-x
Edgar, R. C. (2010). Search and clustering orders of magnitude faster than BLAST. Bioinformatics 26, 2460–2461. doi: 10.1093/bioinformatics/btq461
Egge, E. S., Johannessen, T. V., Andersen, T., Eikrem, W., Bittner, L., Larsen, A., et al. (2015). Seasonal diversity and dynamics of haptophytes in the Skagerrak, Norway, explored by high-throughput sequencing. Mol. Ecol. 24, 3026–3042. doi: 10.1111/mec.13160
Eppley, R. W., Carlucci, A. F., Holm-Hansen, O., Kiefer, D., McCarthy, J. J., Venrick, E. L., et al. (1971a). Phytoplankton growth and composition in shipboard cultures supplied with nitrate, ammonium, or urea as the nitrogen source. Limnol. Oceanogr. 16, 741–751.
Eppley, R. W., Rogers, J. N., McCarthy, J. J., and Sournia, A. (1971b). Light/dark periodicity in nitrogen assimilation of the marine phytoplankters Skeletonema costatum and Coccolithus huxleyi in N-limited chemostat culture. J. Phycol. 7, 150–154.
Finkel, Z. V., Beardall, J., Flynn, K. J., Quigg, A., Rees, T. A. V., and Raven, J. A. (2009). Phytoplankton in a changing world: cell size and elemental stoichiometry. J. Plankton Res. 32, 119–137. doi: 10.1093/plankt/fbp098
Fu, R., and Gong, J. (2015). Single cell analysis linking ribosomal (r)DNA and rRNA copy numbers to cell size and growth rate provides insights into molecular protistan ecology. J. Eukaryot. Microbiol. 38, 42–49. doi: 10.1111/jeu.12425
Gerea, M., Queimaliños, C., and Unrein, F. (2018). Grazing impact and prey selectivity of picoplanktonic cells by mixotrophic flagellates in oligotrophic lakes. Hydrobiologia 1–17. doi: 10.1007/s10750-018-3610-3
Gloor, G. B., Macklaim, J. M., Pawlowsky-Glahn, V., and Egozcue, J. J. (2017). Microbiome datasets are compositional: and this is not optional. Front. Microbiol. 8:2224. doi: 10.3389/fmicb.2017.02224
Goering, J. J., Dugdale, R. C., and Menzel, D. W. (1964). Cyclic diurnal variations in the uptake of ammonia and nitrate by photosynthetic organisms in the Sargasso Sea. Limnol. Oceanogr. 9, 448–451.
Guidi, L., Chaffron, S., Bittner, L., Eveillard, D., Larhlimi, A., Roux, S., et al. (2016). Plankton networks driving carbon export in the oligotrophic ocean. Nature 532, 465–470. doi: 10.1038/nature16942
Guillou, L., Bachar, D., Audic, S., Bass, D., Berney, C., Bittner, L., et al. (2013). The Protist ribosomal reference database (PR2): a catalog of unicellular eukaryote Small Sub-Unit rRNA sequences with curated taxonomy. Nucleic Acids Res. 41, D597–D604. doi: 10.1093/nar/gks1160
Guillou, L., Viprey, M., Chambouvet, A., Welsh, R. M., Kirkham, A. R., Massana, R., et al. (2008). Widespread occurrence and genetic diversity of marine parasitoids belonging to Syndiniales (Alveolata). Environ. Microbiol. 10, 3349–3365. doi: 10.1111/j.1462-2920.2008.01731.x
Harding, L. W., Prézelin, B. B., Sweeney, B. M., and Cox, J. L. (1982). Diel oscillations of the Photosynthesis-Irradiance (P-I) relationship in natural assemblages of phytoplankton. Mar. Biol. 67, 167–178.
Hein, M., Pedersen, M. F., and Sand-Jensen, K. (1995). Size-dependent nitrogen uptake in micro- and macroalgae. Mar. Ecol. Prog. Ser. 118, 247–253.
Hu, S. K., Campbell, V., Connell, P., Gellene, A. G., Liu, Z., Terrado, R., et al. (2016). Protistan diversity and activity inferred from RNA and DNA at a coastal ocean site in the eastern North Pacific. FEMS Microbiol. Ecol. 92:fiw050. doi: 10.1093/femsec/fiw050
Hu, S. K., Liu, Z., Lie, A. A. Y., Countway, P. D., Kim, D. Y., Jones, A. C., et al. (2015). Estimating protistan diversity using high-throughput sequencing. J. Eukaryot. Microbiol. 62, 688–693. doi: 10.1111/jeu.12217
Hunter-Cevera, K. R., Neubert, M. G., Solow, A. R., Olson, R. J., Shalapyonok, A., and Sosik, H. M. (2014). Diel size distributions reveal seasonal growth dynamics of a coastal phytoplankter. Proc. Natl. Acad. Sci. U.S.A. 111, 9852–9857. doi: 10.1073/pnas.1321421111
Karl, D. M., and Church, M. J. (2014). Microbial oceanography and the Hawaii Ocean Time-series programme. Nat. Rev. Microbiol. 12, 699–713. doi: 10.1038/nrmicro3333
Krabberød, A. K., Bjorbækmo, M., Shalchian-Tabrizi, K., and Logares, R. (2017). Exploring the oceanic microeukaryotic interactome with metaomics approaches. Aquat. Microb. Ecol. 79, 1–12. doi: 10.3354/ame01811
Laroche, O., Wood, S. A., Tremblay, L. A., Lear, G., Ellis, J. I., and Pochon, X. (2017). Metabarcoding monitoring analysis: the pros and cons of using co-extracted environmental DNA and RNA data to assess offshore oil production impacts on benthic communities. PeerJ 5, e3347. doi: 10.7717/peerj.3347
Le Bescot, N., Mahé, F., Audic, S., Dimier, C., Garet, M.-J., Poulain, J., et al. (2016). Global patterns of pelagic dinoflagellate diversity across protist size classes unveiled by metabarcoding. Environ. Microbiol. 18, 609–629. doi: 10.1111/1462-2920.13039
Lejzerowicz, F., Voltsky, I., and Pawlowski, J. (2013). Identifying active foraminifera in the Sea of Japan using metatranscriptomic approach. Deep Sea Res. II 86–87, 214–220. doi: 10.1016/j.dsr2.2012.08.008
Lie, A. A. Y., Kim, D. Y., Schnetzer, A., and Caron, D. A. (2013). Small-scale temporal and spatial variations in protistan community composition at the San Pedro Ocean Time-series station off the coast of southern California. Aquat. Microb. Ecol. 70, 93–110. doi: 10.3354/ame01652
Lima-Mendez, G., Faust, K., Henry, N., Decelle, J., Colin, Sb, Carcillo, F., et al. (2015). Determinants of community structure in the global plankton interactome. Science 348:1262073. doi: 10.1126/science.1262073
Logares, R., Audic, S., Bass, D., Bittner, L., Boutte, C., Christen, R., et al. (2014). Patterns of rare and abundant marine microbial eukaryotes. Curr. Biol. 24, 813–821. doi: 10.1016/j.cub.2014.02.050
Lorenzen, C. J. (1963). Diurnal variation in photosynthetic activity of natural phytoplankton populations. Limnol. Oceanogr. 8, 56–62.
Martin, M. (2011). Cutadapt removes adapter sequences from high-throughput sequencing reads. Embnet J. 17, 10–12. doi: 10.14806/ej.17.1.200
Massana, R. (2015). “Protistan diversity in environmental molecular surveys,” in Marine Protists, eds S. Ohtsuka, T. Suzaki, T. Horiguchi, N. Suzuki, and F. Not (Tokyo: Springer Japan), 3–21.
Massana, R., Gobet, A., Audic, S., Bass, D., Bittner, L., Boutte, C., et al. (2015). Marine protist diversity in European coastal waters and sediments as revealed by high-throughput sequencing. Environ. Microbiol. 17, 4035–4049. doi: 10.1111/1462-2920.12955
McKie-Krisberg, Z. M., Gast, R. J., and Sanders, R. W. (2015). Physiological responses of three species of Antarctic mixotrophic phytoflagellates to changes in light and dissolved nutrients. Microb. Ecol. 70, 21–29. doi: 10.1007/s00248-014-0543-x
McKie-Krisberg, Z. M., and Sanders, R. W. (2014). Phagotrophy by the picoeukaryotic green alga Micromonas: implications for Arctic Oceans. ISME J. 8, 1953–1961. doi: 10.1038/ismej.2014.16
Michaels, A. F. (1988). Vertical-distribution and abundance of acantharia and their symbionts. Mar. Biol. 97, 559–569.
Needham, D. M., Sachdeva, R., and Fuhrman, J. A. (2017). Ecological dynamics and co-occurrence among marine phytoplankton, bacteria and myoviruses shows microdiversity matters. ISME J. 11, 1614–1629. doi: 10.1038/ismej.2017.2
Nelson, D. M., and Brand, L. E. (1979). Cell division periodicity in 13 species of marine phytoplankton on a light:dark cycle. J. Phycol. 15, 67–75.
Nygaard, K., and Tobiesen, A. (1993). Bacterivory in algae: a survival strategy during nutrient limitation. Limnol. Oceanogr. 38, 273–279.
Ohtsuka, S., Suzaki, T., Horiguchi, T., Suzuki, N., and Not, F. (2015). Marine Protists: Diversity and Dynamics. Tokyo: Springer Japan.
Owens, T. G., Falkowski, P. G., and Whitledge, T. E. (1980). Diel periodicity in cellular chlorophyll content in marine diatoms. Mar. Biol. 59, 71–77.
Park, M. G., Cooney, S. K., Kim, J. S., and Coats, D. W. (2002). Effects of parasitism on diel vertical migration, phototaxis/geotaxis, and swimming speed of the bloom-forming dinoflagellate Akishiwo sanguinea. Aquat. Microb. Ecol. 29, 11–18. doi: 10.3354/ame029011
Pasulka, A. L., Landry, M. R., Taniguchi, D. A. A., Taylor, A. G., and Church, M. J. (2013). Temporal dynamics of phytoplankton and heterotrophic protists at station ALOHA. Deep Sea Res. II 93, 44–57. doi: 10.1016/j.dsr2.2013.01.007
Poretsky, R. S., Hewson, I., Sun, S., Allen, A. E., Zehr, J. P., and Moran, M. A. (2009). Comparative day/night metatranscriptomic analysis of microbial communities in the North Pacific subtropical gyre. Environ. Microbiol. 11, 1358–1375. doi: 10.1111/j.1462-2920.2008.01863.x
Poulsen, L. K., Ballard, G., and Stahl, D. A. (1993). Use of rRNA fluorescence in situ hybridization for measuring the activity of single cells in young and established biofilms. Appl. Environ. Microb. 59, 1354–1360.
R Core Team (2014). R: A Language and Environment for Statistical Computing [2014]. Vienna. Available online at: http://www.R-project.org/
Ribalet, F., Swalwell, J., Clayton, S., Jiménez, V., Sudek, S., Lin, Y., et al. (2015). Light-driven synchrony of Prochlorococcus growth and mortality in the subtropical Pacific gyre. Proc. Natl. Acad. Sci. U.S.A. 112, 8008–8012. doi: 10.1073/pnas.1424279112
Rideout, J. R., He, Y., Navas-Molina, J. A., Walters, W. A., Ursell, L. K., Gibbons, S. M., et al. (2014). Subsampled open-reference clustering creates consistent, comprehensive OTU definitions and scales to billions of sequences. PeerJ 2:e545. doi: 10.510.7717/peerj.7545
Rii, Y. M., Karl, D. M., and Church, M. J. (2016). Temporal and vertical variability in picophytoplankton primary productivity in the North Pacific Subtropical Gyre. Mar. Ecol. Prog. Ser. 562, 1–18. doi: 10.3354/meps11954
Rodríguez-Martínez, R., Rocap, G., Logares, R., Romac, S., and Massana, R. (2012). Low evolutionary diversification in a widespread and abundant uncultured protist (MAST-4). Mol. Biol. Evol. 29, 1393–1406. doi: 10.1093/molbev/msr303
Rognes, T., Flouri, T., Nichols, B., Quince, C., and Mahé, F. (2016). VSEARCH: a versatile open source tool for metagenomics. PeerJ 4:e2584. doi: 10.7717/peerj.2584
Schmoker, C., Hernández-León, S., and Calbet, A. (2013). Microzooplankton grazing in the oceans: impacts, data variability, gaps of knowledge, and future directions. J. Plankton Res. 35, 691–706. doi: 10.1093/plankt/fbt023
Smayda, T. J. (1975). Phased cell division in natural populations of the marine diatom Ditylum brightwelli and the potential significance of diel phytoplankton behavior in the sea. Deep Sea Res. 22, 151–165.
Smith, S. R., Gillard, J. T. F., Kustka, A. B., McCrow, J. P., Badger, J. H., Zheng, H., et al. (2016). Transcriptional orchestration of the global cellular response of a model pennate diatom to diel light cycling under iron limitation. PLoS Genet. 12:e1006490. doi: 10.1371/journal.pgen.1006490
Stoeck, T., Bass, D., Nebel, M., Christen, R., Jones, M. D. M., Breiner, H.-W., et al. (2010). Multiple marker parallel tag environmental DNA sequencing reveals a highly complex eukaryotic community in marine anoxic water. Mol. Ecol. 19, 21–31. doi: 10.1111/j.1365-294X.2009.04480.x
Stoecker, D. K. (2006). Mixotrophy among Dinoflagellates. J. Eukaryot. Microbiol. 46, 397–401. doi: 10.1111/j.1550-7408.1999.tb04619.x
Strom, S. L., Benner, R., Ziegler, S., and Dagg, M. J. (1997). Planktonic grazers are a potentially important source of marine dissolved organic carbon. Limnol. Oceanogr. 42, 1364–1374.
Swanberg, N. R., and Caron, D. A. (1991). Patterns of sarcodine feeding in epipelagic oceanic plankton. J. Plankton Res. 13, 287–312.
Thaben, P. F., and Westermark, P. (2014). Detecting rhythms in time series with RAIN. J. Biol. Rhythms 29, 391–400. doi: 10.1177/0748730414553029
Tsai, A.-Y., Wen-Mei, C., and Kuo-Ping, C. (2009). Diel patterns of grazing by pigmented nanoflagellates on Synechococcus spp. in the coastal ecosystem of subtropical western Pacific. Hydrobiologia 636, 249–256. doi: 10.1007/s10750-009-9954-y
Unrein, F., Gasol, J. M., Not, F., Forn, I., and Massana, R. (2014). Mixotrophic haptophytes are key bacterial grazers in oligotrophic coastal waters. ISME J. 8, 164–176. doi: 10.1038/ismej.2013.132
van den Engh, G. J., Doggett, J. K., Thompson, A. W., Doblin, M. A., Gimpel, C. N. G., and Karl, D. M. (2017). Dynamics of Prochlorococcus and Synechococcus at station ALOHA revealed through flow cytometry and high-resolution vertical sampling. Front. Mar. Sci. 4:359. doi: 10.3389/fmars.2017.00359
Vaulot, D., and Marie, D. (1999). Diel variability of photosynthetic picoplankton in the equatorial Pacific. J. Geophys. Res. Oceans 104, 3297–3310.
Wilson, S. T., Aylward, F. O., Ribalet, F., Barone, B., Casey, J. R., Connell, P. E., et al. (2017). Coordinated regulation of growth, activity and transcription in natural populations of the unicellular nitrogen-fixing cyanobacterium Crocosphaera. Nat. Microbiol. 2:17118. doi: 10.1038/nmicrobiol.2017.118
Worden, A. Z., Follows, M. J., Giovannoni, S. J., Wilken, S., Zimmerman, A. E., and Keeling, P. J. (2015). Rethinking the marine carbon cycle: Factoring in the multifarious lifestyles of microbes. Science 347:1257594. doi: 10.1126/science.1257594
Xia, L. C., Ai, D., Cram, J., Fuhrman, J. A., and Sun, F. (2013). Efficient statistical significance approximation for local similarity analysis of high-throughput time series data. Bioinformatics 29, 230–237. doi: 10.1093/bioinformatics/bts668
Xia, L. C., Steele, J. A., Cram, J. A., Cardon, Z. G., Simmons, S. L., Vallino, J. J., et al. (2011). Extended local similarity analysis (eLSA) of microbial community and other time series data with replicates. BMC Syst. Biol. 5:S15. doi: 10.1186/1752-0509-5-S2-S15
Zhu, F., Massana, R., Not, F., Marie, D., and Vaulot, D. (2005). Mapping of picoeucaryotes in marine ecosystems with quantitative PCR of the 18S rRNA gene. FEMS Microbiol. Ecol. 52, 79–92. doi: 10.1016/j.femsec.2004.10.006
Keywords: microbial eukaryotes, protists, diel periodicity, daily patterns, metabolic activity, microbial ecology, protistan ecology
Citation: Hu SK, Connell PE, Mesrop LY and Caron DA (2018) A Hard Day's Night: Diel Shifts in Microbial Eukaryotic Activity in the North Pacific Subtropical Gyre. Front. Mar. Sci. 5:351. doi: 10.3389/fmars.2018.00351
Received: 05 July 2018; Accepted: 11 September 2018;
Published: 10 October 2018.
Edited by:
Susana Agusti, King Abdullah University of Science and Technology, Saudi ArabiaReviewed by:
Xin Lin, Xiamen University, ChinaRoberta L. Hansman, IAEA International Atomic Energy Agency, Monaco
Copyright © 2018 Hu, Connell, Mesrop and Caron. This is an open-access article distributed under the terms of the Creative Commons Attribution License (CC BY). The use, distribution or reproduction in other forums is permitted, provided the original author(s) and the copyright owner(s) are credited and that the original publication in this journal is cited, in accordance with accepted academic practice. No use, distribution or reproduction is permitted which does not comply with these terms.
*Correspondence: Sarah K. Hu, U2FyYWguSHVAdXNjLmVkdQ==