 Trystan Sanders
 Lara Schmittmann
 Jennifer C. Nascimento-Schulze
 Frank Melzner
- Marine Ecology, Helmholtz Centre for Ocean Research (GEOMAR), Kiel, Germany
In coastal temperate regions such as the Baltic Sea, calcifying bivalves dominate benthic communities playing a vital ecological role in maintaining biodiversity and nutrient recycling. At low salinities, bivalves exhibit reduced growth and calcification rates which is thought to result from physiological constraints associated with osmotic stress. Calcification demands a considerable amount of energy in calcifying molluscs and estuarine habitats provide sub-optimal conditions for calcification due to low concentrations of calcification substrates and large variations in carbonate chemistry. Therefore, we hypothesize that slow growth rates in estuarine bivalves result from increased costs of calcification, rather than costs associated with osmotic stress. To investigate this, we estimated the cost of calcification for the first time in benthic bivalve life stages and the relative energy allocation to calcification in three Mytilus populations along the Baltic salinity gradient. Our results indicate that calcification rates are significantly reduced only in 6 psu populations compared to 11 and 16 psu populations, coinciding with ca. 2–3-fold higher calcification costs at low salinity and temperature. This suggests that reduced growth of Baltic Mytilus at low salinities results from increased calcification costs rather than osmotic stress related costs. We also reveal that shell growth (both calcification and shell organic production) demands 31–60% of available assimilated energy from food, which is significantly higher than previous estimates. Energetically expensive calcification represents a major constraint on growth of mytilids in the estuarine and coastal seas where warming, acidification and desalination are predicted over the next century.
Introduction
The Baltic Sea is characterized by a natural salinity gradient exists decreasing from fully marine in the West to almost freshwater [<3 practical salinity units (psu)] in the East (Meier, 2006). This gradual salinity gradient provides an excellent model to investigate the physiological responses of marine invertebrates to salinity stress. Marine mytilid mussels dominate the Baltic benthos acting as a foundation species and play an important ecological role in benthic nutrient recycling (Kautsky and Wallentinus, 1980; Norling and Kautsky, 2008). Baltic mytilid mussels (from here on: Baltic Mytilus) are all hybrids of Mytilus edulis-like genotypes and M. trossulus-like genotypes with M. edulis-like genotypes being dominant in the high saline western Baltic and M. trossulus-like genotypes dominating the low saline eastern Baltic (Väinölä and Hvilsom, 1991). The genetic transition zone where dominance shifts from M. edulis-like to M. trossulus-like genotypes or vice-versa, is in the south-western Baltic Sea located near Ahrenshoop on the German coast (Figure S1, Stuckas et al., 2017).
At salinities <10 psu, growth rates of Baltic Mytilus are significantly reduced with individuals reaching smaller maximum sizes of ~35 mm shell length compared to >70 mm at 33 psu.
Comparisons between Baltic M. edulis-like and M. trossulus-like populations have revealed local adaptation to different salinity habitats (Kautsky et al., 1990; Kossak, 2006). Reciprocal acclimation experiments have demonstrated that environmental salinity explains the majority of salinity induced changes in growth and feeding rates (Tedengren et al., 1990; Riisgård et al., 2013). Reduced growth rates at low salinities have been suggested to be a result of unfavorable protein metabolism and higher physiological costs associated with osmotic stress (Tedengren and Kautsky, 1986; Maar et al., 2015). However, oxygen consumption rates have not been found to be impacted by salinity suggesting no increased metabolic maintenance costs at low salinity (Landes et al., 2015). Concentrations of Ca2+ and HCO relevant for calcification also decrease with salinity which, coupled with low winter water temperatures, leads to extended periods of aragonite undersaturation (Ωarag < 1: Tyrrell et al., 2008; Beldowski et al., 2010). This imposes kinetic constraints on calcification and can cause net dissolution of CaCO3 structures (Melzner et al., 2011; Thomsen et al., 2015). Low seawater concentrations of calcification substrate coupled with kinetic constraints on calcification may increase the energetic costs of calcification and subsequently limit growth at low salinities.
Calcium carbonate exoskeletons are extensive throughout the animal and in bivalve molluscs, shells can constitute over 70% of total animal mass (Eklöf et al., 2017). Despite this, the energetic costs of CaCO3 biomineralisation are still not fully understood. This is because (1) animals can modulate energy investment between shell and body tissue growth in response to a range of environmental factors (Anthony et al., 2002; Brookes and Rochette, 2007) and (2) there is a limited understanding of the mechanisms of calcification at the tissue and cellular level, especially in bivalves. Consequently, estimating calcification costs is problematic and no direct estimates for shell formation costs in benthic bivalve life-stages exist. This makes it difficult to assess the impacts of environmental change on bivalve energetics, growth, and fitness. This is particularly important in the Baltic Sea where bivalve molluscs play an important ecological role. Climatic and oceanographic models predict desalination of the Baltic Sea in the next 50–100 years due to more extreme precipitation events coupled with increased freshwater run-off into the Baltic Sea from the surrounding catchment area (Meier, 2006; Gräwe et al., 2013). Projected decreases in salinity by ca. 2 psu may lead to extensive distribution shifts of Baltic Mytilus westwards by up to 600 km, particularly in the central part of the Baltic, where the salinity ranges between 5 and 8 psu (Gräwe et al., 2013). This could have large scale implications for benthic communities in the future. It is thus of great interest to better understand the physiological and energetic mechanisms that underlie reduced growth in the low salinity parts of the Baltic Sea.
In this study, we tested whether calcification costs, rather than costs associated with osmotic stress are the main factor limiting mussel growth at low salinities (6 psu) characteristic for the central Baltic Sea. To investigate this, energy budgets of three locally adapted populations of Baltic Mytilus along the natural salinity gradient were determined in the lab at their respective native salinities (16, 11, and 6 psu). Two temperatures were used (8 and 18°C) to simulate seasonal differences and impose kinetic constraints on calcification by decreasing CaCO3 saturation state at low temperature. By using a regression approach across three feeding regimes, energy available for calcification (Scope for Shell Growth) was correlated with calcification rates to obtain direct estimates for calcification costs for the first time in juvenile mussels.
Materials and Methods
Experimental Design
We factored potential local adaptation of Baltic Mytilus populations to low salinity into our experimental design by testing three separate, locally adapted populations along the south-western Baltic salinity gradient (Figure S1) at their native salinities (Usedom 6 psu; Ahrenshoop 11 psu; Kiel 16 psu; Table S1). Animals were reared at two temperatures (8°C and 18°C) and three feeding regimes (high food: 6,000 microalgae cells ml−1, medium food: 3,000 cells ml−1 and low food: 500 cells ml−1) with 4 replicates, 2 L tanks per treatment (40 animals per tank, total of 72 replicate tanks, 2,880 animals in total; experimental design depicted in Figure S2). Three feeding regimes were used to induce a wide range of growth and calcification rates for regression analyses to calculate calcification costs and were not included as a factor in subsequent analyses (see section: Statistics). We used a discrete feeding method as it was vital to ensure uniform energy intake between salinities. It was also important to ensure maximum particle retention to accurately quantify energy intake, therefore 6,000 cells ml−1 was chosen as the high food treatment as higher cell concentrations result in production of pseudofaeces and < 100% particle intake (Riisgård et al., 2013: Figure S3). Animals were fed twice daily for the duration of the 8 weeks experiment with a live microalga mix consisting of Isochrysis galbana, Tetraselmis suecica, and Rhodomonas salina at a ratio of 1:1:1 (Supplementary Methodologies). Water was changed weekly with water prepared in relation to the specific carbonate chemistry at each site (Table S2). During water changes, tanks were cleaned, animal numbers per tank were counted and any dead animals removed. Mortality was minimal (<3.5%) and factored into calculations.
Growth and Calcification Rates
Shell length was measured weekly from a random sub-sample of 10 individuals per tank. Five animals from each tank were removed at week 0, 4, and 8 and stored at −80°C for tissue and shell mass analyses. For this, individual animals (shell and tissue) were placed in pre-weighed tin foil boats and dried at 60°C for 12 h. Samples were then weighed to determine the total dry mass of shell and tissue (DM, mg). A second sub-sample was defrosted and microwaved at 400 watts for 30 s to enable the removal of all soft tissue from the inside of the shell under a stereomicroscope. Empty shells were then placed in pre-weighed foil boats and dried at 60°C for 12 h and weighed to determine the shell mass (SM, mg). These shells were then ashed at 450°C for 4 h and weighed again to determine the ash mass (AM, mg) which is the weight of the inorganic material of the shell. This was used as a proxy for CaCO3 mass. The ash-free dry mass was used as a proxy for the shell organic mass (SOM, mg):
M. edulis soft tissue also contains approximately 13% inorganic material (Dare and Edwards, 1975). However, this only constitutes ~2% of total mass and was therefore excluded from our calculations. For each salinity and temperature, total dry mass (Figure S4), shell mass (Figure S5), and ash mass (proxy for CaCO3 mass) were plotted against shell length with power functions showing the highest R2 values (Table S3). Continuous experimental measurements of shell length were converted to mass values using these relationships. Soft tissue dry mass (TM, mg) was calculated using the following equation:
Growth rates were calculated as the difference between initial and final mass (soft tissue and CaCO3) divided by the experimental period expressed in μg day−1. Calcification rates are expressed as deposition rate of inorganic shell material in μg CaCO3 day−1 excluding the mass of shell organic material.
Oxygen Consumption
O2 consumption rates were measured every 2 weeks at progressively larger shell lengths (week 0: 4 mm, week 2: 5 mm, week 4: 6 mm, and week 6: 7 mm). O2 consumption was quantified by measuring O2 depletion within sealed chambers using a 24 channel SDR SensorDish Reader (PreSens, Germany). Prior to measurements mussels were starved for 18–24 h to ensure measurements during basal metabolism and reduce the effects of feeding on metabolism. Respiration water was prepared 2 h before measurements using freshly filtered (0.22 μm) seawater (FSW) from Kiel Fjord adjusted to the correct salinity, total alkalinity (AT) and temperature and oxygenated appropriately to ensure 100% air saturation. Mussels were placed individually in custom made (Eydam, Germany) 700 μl, airtight glass vessels. Lids were sealed without air bubbles and mussels were left for 30 min before measurements commenced to ensure opening of valves and active aerobic metabolism. Runs during which mussels closed their valves for more than 10% of the time were excluded. Depletion of oxygen within the vessels over time was measured in dark temperature-controlled climate chambers at respective experimental temperatures (8 and 18°C) and measurements were terminated when air saturation reached < 70%. Empty vessels were used as controls for background seawater O2 flux and subtracted from experimental vessels. Individual O2 consumption rates per hour were plotted against soft tissue mass with O2 consumption expressed as nmol O2 individual−1 hr−1.
Energetics, Calcification Cost and Energy Allocation
All following energy fluxes are expressed per animal as total values over the 8-weeks experiment with tanks as replicates. Scope for Growth (SfG, J), which is the energy available for growth, was calculated using the following equation:
Where A is the energy intake (J), AE is the absorption efficiency (ratio: 0–1) and M is the metabolic energy loss (J). A was calculated as the total dry weight of algae material added to each tank multiplied by an energetic conversion factor of 19 μJ ng−1 microalgae based on the organic content of the 3 cultured microalgae species (Renaud et al., 2002; Seixas et al., 2009; Further details in Supplementary Methodologies). Clearance was measured to ensure sufficient feeding rates to allow complete clearance of algae cells between feeding events (Figure S3). Due to measurement constraints in juvenile mussels, absorption efficiency was not quantified in this study and a mean value for absorption efficiency of 0.61 was used based on average literature values for Mytilus edulis, Mytilus trossulus and Baltic Mytilus across a wide range of food levels using the Conover ratio (Conover, 1966; Table S4). A sensitivity analysis was also conducted on the final estimates for calcification costs across a range of absorption efficiencies (0.4–0.8) to illustrate the impact of absorption efficiency on final calculation cost estimates (Figures S6,S7). For metabolic energy loss, oxygen consumption rates were converted to energy using the conversion factor 1 μmol O2 = 450 mJ (Gnaiger and Bitterlich, 1984). Ammonia excretion was excluded from our calculations as energy lost through this process contributes <3% to energy budgets in M. edulis (Sanders et al., 2014). Final Scope for Growth was expressed in Joules per individual over the entire experiment (8 weeks).
The energy available for calcification termed Scope for Shell Growth (SfSG, J) was calculated by subtracting the energy allocated to shell organic mass growth (GSOM, J) and soft tissue mass growth (GTM, J) from the Scope for Growth:
GSOM was calculated using an energetic conversion value of 23.64 J mg−1 protein as SOM is >95% protein (Gnaiger and Bitterlich, 1984; Weiner and Traub, 1984). GTM was calculated with an energetic conversion value of 23.96 J mg−1 based on published values of soft tissue biochemical composition in bivalves during the non-reproductive season when gonad mass is minimal (10.0% lipid; 53.8% protein; 19.5% carbohydrate) with energetic conversions of 39.54 J mg−1 (lipid), 23.64 J mg−1 (protein) and 17.15 J mg−1 (carbohydrate) (Gnaiger and Bitterlich, 1984; Celik et al., 2014). At the end of the experiment, total values of SfSG were plotted against total calcification for each tank with all food treatments pooled to allow regressions across a wide range of calcification rates and SfSG values (Figure 3A). The slopes of linear regressions represent the cost of calcification in J mg−1.
Available assimilated energy (A * AE) termed E, was divided into allocation to metabolism, calcification (Gcalcification, J), shell organic mass growth and soft tissue mass growth with excess energy termed unaccounted energy (X, J):
These values were calculated as a proportion of total assimilated energy (E) per tank but exclusively for the high food treatments. High food treatments induced high growth rates, thus enabling accurate determination of energy partitioning to growth processes. The low food treatment was designed to support little more than energy needed for maintenance of body mass.
Statistics
All statistical analysis was conducted using R Software (v.3.4.3). All data was tested for normality using Shapiro-Wilk tests and for homogeneity of variances using Levene's test. If data deviated from normality or homogeneity of variances it was transformed using a log transformation. Soft tissue mass growth rates and calcification rates (μg day−1) were analyzed parametrically using 3-way ANOVA with temperature, salinity and food as factors (with tanks as replicates). Food was only included as a factor when analyzing growth rates to ensure the food levels were sufficiently different to induce a wide range of growth rates. Energy allocation to calcification was analyzed using a 2-way ANOVA with temperature and salinity as factors. For ANCOVA, food levels were pooled and body mass (soft tissue and CaCO3; an indirect result of different feeding regimes) was used as a co-variate. Feeding regimes were not included in ANCOVA as they were exclusively used to induce a wide range of calcification and soft body tissue growth rates for more accurate ANCOVA. Oxygen consumption rates were analyzed using 2-way ANCOVA with soft tissue mass as a co-variable and temperature and salinity as factors. Costs of calcification (SfSG vs. calcification) were analyzed statistically using 2-way ANCOVA with total calcification as a co-variable and temperature and salinity as factors. For ANCOVA analyses, all food treatments were pooled within each salinity and temperature treatment to allow a wide range of masses for more accurate regression analyses. All statistical results are summarized in Table S5 (ANCOVAs) and Table S6 (ANOVAs).
Results
Calcification and Soft Tissue Growth
Calcification rate was significantly impacted by salinity [ANOVA, F(2, 54) = 13.3, p < 0.001: Figure 1A] being lower at 6 psu with an average of 43 μg day−1 compared to an average of 76 μg day−1 at 11 and 16 psu (Tukey post-hoc, p < 0.001). The absence of differences in calcification rates between 11 and 16 psu suggests a non-linear relationship between salinity and calcification rate. Interestingly, temperature had no effect on calcification rate but did significantly reduce soft tissue growth at 8°C [ANOVA, F(1, 54) = 29.2, p < 0.001; Figure 1B]. Calcification rate (μg CaCO3 day−1) was significantly different between all feeding regimes [ANOVA, F(2, 54) = 194.8, p < 0.001; Figure 1A]. Food also had the same effect on soft tissue growth [ANOVA, F(2, 54) = 240, p < 0.001, Figure 1B] indicating there were sufficient differences in growth rates between feeding regimes for subsequent regression analyses to calculate calcification costs. There was a significant interaction effect between food and salinity and temperature and salinity on calcification rate (Table S6, Figure S8). Regarding soft tissue growth there was a significant interaction effect between food and salinity, salinity and temperature and, food and temperature (Table S6, Figure S9).
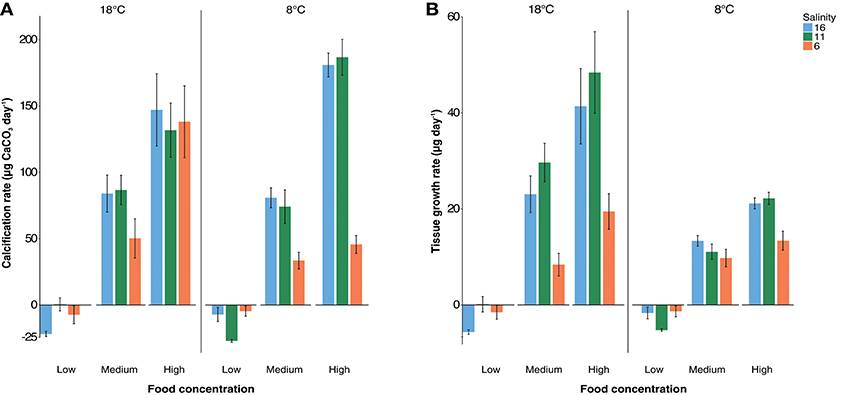
Figure 1. Mean calcification rate (A) and growth of soft tissue (B) in μg per day +/− standard error. Salinity treatments are represented with red (6 psu), green (11 psu), and blue (16 psu) colors and “low,” “med,” and “high” labels represent food levels described in the methodology section. 18°C treatments are shown on the left and 8°C are shown on the right of each graph. Interaction plots for significant interaction effects are presented in Figures S8, S9.
Oxygen Consumption and Energetics
Each of experimental population showed high levels of variation in O2 consumption with R2 values of linear regressions between 0.49 and 0.80 (Figure 2). O2 consumption correlated significantly with tissue mass (Table S3) and was lower at 8°C compared to 18°C [ANCOVA, F(1, 268) = 323, p < 0.001]. Oxygen consumption rates were not different between salinities [ANCOVA, F(1, 268) = 1.7, p = 0.177].
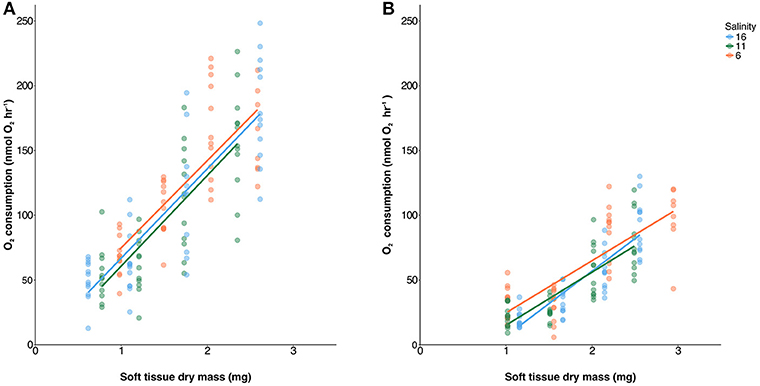
Figure 2. Oxygen consumption plotted against soft tissue dry mass at 18°C (A) and 8°C (B) measured across a range of mussel sizes. Linear regressions were calculated across all food levels and salinities are represented by red (6 psu), green (11 psu), and blue (16 psu). There were no significant differences between salinities.
Scope for shell growth (SfSG) correlated with calcification rate with R2 values being between 0.59 and 0.93 with Ahrenshoop 11 psu 18°C showing a weaker relationship with an R2 of 0.40 (Table S3, Figure 3A). As single factors, temperature [ANCOVA, F(1, 60) = 0.99, p = 0.323] and salinity [ANCOVA, F (2, 60) = 2.83, p = 0.067] did not significantly impact the cost of calcification. However, at 8°C and 6 psu, calcification costs were significantly higher than all other treatments [ANCOVA interaction, F(2, 60) = 6.82, p = 0.002; Figure 3B] suggesting a combination of low salinity and low temperature induces significantly higher costs of calcification. Energy allocation to calcification as a percentage of the total energy budget ranged between 31 and 60% (Figure 4). Low temperature invoked an increase in allocation of energy to calcification compared to higher temperature [ANOVA, F(1, 18) = 7.15, p = 0.015] however, salinity had no impact on the relative allocation of energy to calcification [ANOVA, F(2, 18) = 2.56, p = 0. 105].
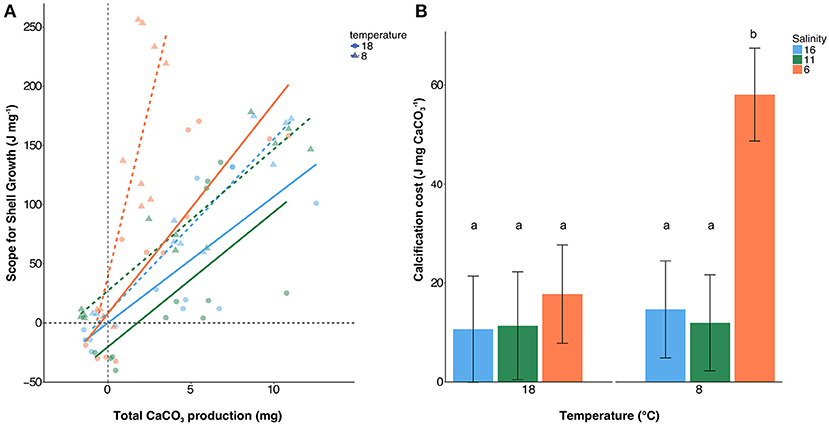
Figure 3. Linear regressions across all food treatments between total Scope for Shell Growth (SfSG) and total calcification (A) and the corresponding costs of calcification (B). Salinities are represented by red (6 psu), green (11 psu), and blue (16 psu) with triangles and dashed regressions lines depicting 8°C and circles with solid regression lines representing 18°C. Slopes of the linear regressions +/− standard error are shown in panel B which represent the cost of calcification. Letters represent statistically significant groups.
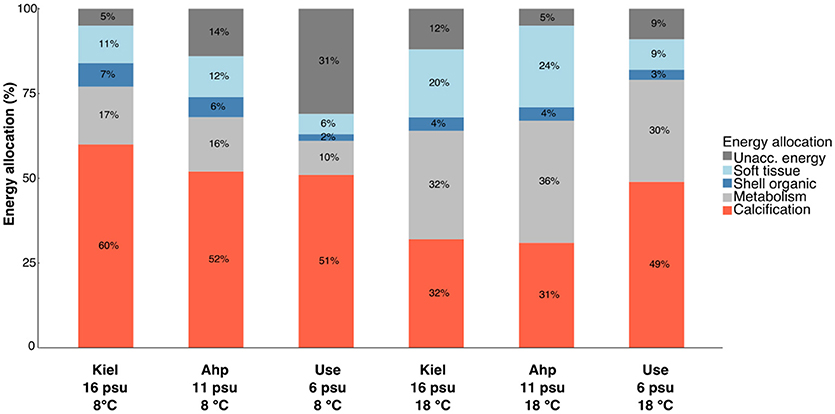
Figure 4. Stacked bar charts representing the relative energy partitioning (%) to different processes. Processes shown are: calcification (red), metabolism (light gray), shell organic (dark blue), soft tissue (light blue), and unaccounted-for energy (dark gray) in all temperature and salinity treatments for the high food treatments only. Unaccounted energy refers to leftover available energy not used for the above processes. This can include processes such as feeding, digestion and protein synthesis.
Discussion
The findings in this study indicate that reduced growth of Baltic mytilids at 6 psu likely results from reduced calcification rates and increased costs of calcification, rather than costs associated with osmotic stress. We also reveal that calcification (CaCO3 production) encompasses a significant proportion of the energy budget in Baltic Mytilus constituting 31–60% of total energy allocation.
Growth and Physiological Energetics
The reduced calcification rates in our study are in accordance with previous findings in M. edulis where calcification rate starts to rapidly decline below salinities of ~10 psu when compared to 25 psu (Kossak, 2006; Riisgård et al., 2014; Maar et al., 2015). These vastly reduced growth rates have been suggested to result from lower soft tissue growth rates due to increased protein metabolism at low salinities (Tedengren and Kautsky, 1986). However, previous work on Baltic M. trossulus-like individuals has recorded stable growth rates of soft body tissue between high salinities (24–33 psu) and low salinities (6–7 psu) (Kautsky et al., 1990; Riisgård et al., 2014). This suggests low salinity limits calcification rather than body tissue growth in Baltic Mytilus.
A Dynamic Energy Budget (DEB) based growth model found that slow growth rates of Baltic Mytilus at salinities below 11 psu were modeled most accurately when the model assumed increased costs of osmoregulation at low salinity (Maar et al., 2015). These costs were suggested to result from decreased protein turnover efficiency and lower O:N ratios as suggested by (Tedengren and Kautsky, 1986). However, energetic costs of calcification were excluded from the DEB model in Maar et al. (2015) and as our findings show, calcification demands up to 60% of the available assimilated energy in Baltic Mytilus. Bivalve shells also contain ~5% organic material composed mostly of protein and if the energetic cost of this organic is also considered (Palmer, 1983), we show that total shell production can demand up to 67% of total assimilated energy. Previous work has estimated shell production demands < 10% of available assimilated energy in marine gastropods and bivalves at fully marine salinities (33 psu), substantially lower than the estimates in our study (Watson et al., 2017). However, calcification costs were not directly calculated in Watson et al. (2017) and values for calcification costs were taken from published literature values on marine gastropods (1–2 J mg−1 CaCO3: Palmer, 1992). As our findings demonstrate, salinity and temperature can impact the energetic cost of calcification and subsequently the proportion of energy allocated to calcification.
Changes in food absorption efficiency may also impact our estimates of calcification costs in this study. It has been previously shown that absorption efficiency decreases at low salinity in the marine bivalve Perna viridis (Wang et al., 2011). However, it is not yet known how local adaptation to low salinity across multiple generations may impact absorption efficiencies. Sensitivity analysis revealed that our estimates of calcification costs decrease linearly with lower absorption efficiency (Figure S6). However, at absorption efficiencies between 0.4 and 0.8, calcification costs remain higher at 8°C and 6 psu compared to all other treatments. Energy allocation to calcification also decreased with decreasing absorption efficiency (Figure S7) however, energy allocation to calcification remains higher at low temperature between absorption efficiencies of 0.4 to 0.8. We stress here that although the absolute values of calcification costs and energy allocation to calcification are impacted by changing absorption efficiencies, the relative impacts of salinity and temperature remain unchanged. Further work should aim to quantify potential changes in food absorption efficiency in low salinity adapted populations to better understand how salinity impacts energy budgets and growth.
Although Mytilus spp. are osmoconformers and favor adjusting intracellular organic osmolyte concentrations rather than inorganic ions to remain iso-osmotic to seawater (Silva and Wright, 1994), reduced intracellular ion concentrations (particularly K+) at salininites < 8 psu have been recorded (Willmer, 1978a; Berger and Kharazova, 1997). This may be a result of depletion of intracellular organic osmolyte concentrations to a critical level, below which intracellular K+ and Na+ must be extruded in order to prevent a detrimental increase in cell volume (Podbielski et al., 2016). Increased trans-membrane ion transport activity via the Na+/K+-ATPase has also been recorded at 8 psu in mussel neuronal and gill tissue (Willmer, 1978b; Rola et al., 2017) suggesting a source of increased energy demand for osmoregulation at very low salinities. Decreased [K+] and [Na+] below a certain threshold have been proven to severely reduce glutamate oxidation and electron transport in bivalve mitochondria due to reduced enzymatic activities (Ballantyne and Moyes, 1987). These potential intracellular changes in cation concentrations at salinities < 8 psu may be responsible for reduced efficiencies of key biochemical processes involved in growth and metabolism and subsequently reduced growth rates at 6 psu but not at 11 and 16 psu.
Costs of Calcification
The cost of calcification calculated in our study ranged from 11 to 58 J mg−1 CaCO3, significantly higher than other estimates of 1–2 J mg−1 for adult gastropods (Palmer, 1992), 1.6 J mg−1 for oyster larvae (Waldbusser et al., 2013; Frieder et al., 2016) and ~0.15 J mg−1 in coral species (Anthony et al., 2002). Our method of estimating calcification costs partially resembles that used by Palmer (1992) in that we used a linear regression of available energy correlated with calcification. The method presented in this study is further optimized by using the SfG model and subtracting the energetic content of soft tissue from available growth energy, thus incorporating variations in tissue growth and metabolism into our estimates. Additionally, large differences in calcification rates between feeding treatments and precise knowledge of food intake resulted in substantially higher R2 values than previous work by Palmer (1992), enabling us to obtain more accurate estimates of calcification costs with less variability and uncertainty.
Costs of calcification arise from several key processes such as Ca2+ and HCO ion uptake, H+ extrusion and enzymatic conversion of CO2 and HCO to CO. Previous estimates of calcification costs in non-feeding ontogenetic stages of larval oysters have been based on metabolic energy loss minus the energetic cost of protein synthesis and Na+/K+-ATPase activity, which were attributed to be processes independent of calcification (Frieder et al., 2016). Similarly, other calcification cost estimates in larval oysters were based on Ca2+-ATPase driven costs of H+ extrusion, a coral calcification model adapted from findings in human erythrocyte membranes (Niggli et al., 1982; Waldbusser et al., 2013). While these ion transport processes contribute considerably to cellular ATP demand, it is not yet clear what proportion of their total activity is involved in calcification as well as how conserved the mechanisms of calcification are between different phyla. In the absence of current understanding of the exact cellular mechanisms and pathways for calcification related ion transport in bivalves, such approaches to estimating calcification costs must remain explorative and associated with a high degree of uncertainty.
At salinities <8 psu, low Ca2+ concentrations (<3 mM) have been found to reduce calcification in Baltic Mytilus larvae (Thomsen et al., 2018). This may be a likely mechanism by which calcification is limited at 6 psu in this study. Calcium uptake via the Ca2+-ATPase is energetically costly and is more expensive at lower calcium ion concentrations (Niggli et al., 1982; McConnaughey and Whelan, 1997) highlighting a potential source of increased calcification costs at 6 psu. Calcification rates are also impacted by the degree of shell dissolution, which depends on shell mineralogy (aragonite vs. calcite) and the seawater saturation state (Ω) of calcium carbonate (Ries et al., 2016). Low salinity and temperature leads to low saturation states (Ω = [Ca2+][CO]/Ksp; where Ksp is the temperature dependent solubility product of CaCO3) due to decreased [Ca2+], [CO] and Ksp with dissolution of CaCO3 structures being thermodynamically favorable when Ω ≤ 1. In our study, seawater Ωarag was < 1 in the 11 and 6 psu treatments at all temperatures suggesting that calcification may be more energetically costly due to kinetic constraints on mineral precipitation at the site of calcification (Waldbusser et al., 2016). Higher costs of epithelial transport of Ca2+ in the 6 psu treatment, coupled with kinetic constraints on calcification (Ωarag < 1), may both act together to induce significantly higher costs of calcification, potentially limiting overall growth rates in low salinity Baltic Mytilus.
This is the first study to estimate the cost of calcification in bivalves using a regression method which encompasses all major energy consuming processes (metabolism and body tissue growth). Our findings show that both low salinity (6 psu) and low temperatures (8°C) invoke higher energetic costs of calcification severely constraining growth and thus fitness in an ecologically and economically important coastal species. We also highlight that calcification demands a considerable amount of energy in Baltic Mytilus at all temperatures and salinities, significantly more than previously suggested in bivalves. With climate projections suggesting many coastal systems to experience desalination and acidification in the coming decades, future work should aim to understand the mechanisms behind these elevated costs in the context of a rapidly changing ocean.
Author Contributions
TS and FM, conceived and designed the study. TS, JN-S, and LS, conducted the experiments and TS analyzed data. TS wrote the manuscript and all authors contributed to revisions.
Conflict of Interest Statement
The authors declare that the research was conducted in the absence of any commercial or financial relationships that could be construed as a potential conflict of interest.
Acknowledgments
The authors thank Ulrike Panknin and Dr. Claas Hiebenthal (KIMOCC) for technical assistance and algae cultures and all members of the CACHE project. This research was supported by the Marie Curie ITN network CACHE (Calcium in a changing environment), European Union Seventh Framework Programme under grant agreement n° 605051. Additional technical funding and support was provided by the Kiel Marine Organism Culture Centre (KIMOCC) of the Kiel Cluster of Excellence FutureOcean.
Supplementary Material
The Supplementary Material for this article can be found online at: https://www.frontiersin.org/articles/10.3389/fmars.2018.00352/full#supplementary-material
References
Anthony, K., Connolly, S., and Willis, B. (2002). Comparative analysis of energy allocation to tissue and skeletal growth in corals. Limnol. Oceanogr. 47, 1417–1429. doi: 10.4319/lo.2002.47.5.1417
Ballantyne, J. S., and Moyes, C. D. (1987). The role of divalent cations and ionic strength in the osmotic sensitivity of glutamate oxidation in oyster gill mitochondria. J. Exp. Biol. 130, 203–217.
Beldowski, J., Löffler, A., Schneider, B., and Joensuu, L. (2010). Distribution and biogeochemical control of the total CO2 and total alkalinity in the Baltic Sea. J. Mar. Syst. 81, 252–259. doi: 10.1016/j.jmarsys.2009.12.020
Berger, V. J., and Kharazova, A. D. (1997). Mechanisms of salinity adaptations in marine molluscs. Hydrobiologia 355, 115–126. doi: 10.1023/A:1003023322263
Brookes, J. I., and Rochette, R. (2007). Mechanism of a plastic phenotypic response: predator-induced shell thickening in the intertidal gastropod Littorina obtusata. J. Evol. Biol. 20, 1015–1027. doi: 10.1111/j.1420-9101.2007.01299.x
Celik, M. Y., Türk Çulha, S., Çulha, M., Yildiz, H., Acarli, S., and Celik, I., Celik, P. (2014). Comparitive study on biochemical composition of some edible marine molluscs at Canakkale coasts, Turkey. Indian J. Geo. Mar. Sci. 43, 601–606.
Conover, R. J. (1966). Assimilation of organic matter by zooplankton. Limnol. Oceanogr. 11, 338–354. doi: 10.4319/lo.1966.11.3.0338
Dare, P. J., and Edwards, D. B. (1975). Seasonal changes in flesh weight and biochemical composition of mussels (Mytilus edulis L.) in the Conwy Estuary, North Wales. J. Exp. Mar. Biol. Ecol. 18, 89–97. doi: 10.1016/0022-0981(75)90066-0
Eklöf, J., Austin, Å., Bergström, U., Donadi, S., Eriksson, B. D., Hansen, J., et al. (2017). Size matters: relationships between body size and body mass of common coastal, aquatic invertebrates in the Baltic Sea. Peer J. 5:e2906. doi: 10.7717/peerj.2906
Frieder, C. A., Applebaum, S. L., Pan, T.-C. F., Hedgecock, D., and Manahan, D. T. (2016). Metabolic cost of calcification in bivalve larvae under experimental ocean acidification. ICES J. Mar. Sci. 5, 119–150. doi: 10.1093/icesjms/fsw213
Gnaiger, E., and Bitterlich, G. (1984). Proximate biochemical composition and caloric content calculated from elemental CHM analysis: a stoichiometric concept. Oecologica 62, 289–298. doi: 10.1007/BF00384259
Gräwe, U., Friedland, R., and Burchard, H. (2013). The future of the western Baltic Sea: two possible scenarios. Ocean. Dynam. 63, 901–921. doi: 10.1007/s10236-013-0634-0
Kautsky, N., Johannesson, K., and Tedengren, M. (1990). Genotypic and phenotypic differences between Baltic and North Sea populations of Mytilus edulis evaluated through reciprocal transplantations. I. Growth and morphology. Mar. Ecol. Prog. Ser. 59, 203–210. doi: 10.3354/meps059203
Kautsky, N., and Wallentinus, I. (1980). Nutrient release from a Baltic Mytilus – red algal community and its role in benthic and pelagic productivity. Ophelia 1, 17–30.
Kossak, U. (2006). How Climate Change Translates Into Ecological Change: Impacts of Warming and Desalination on Prey Properties and Predator-Prey Interactions in the Baltic Sea. Ph.D. thesis, Mathematics and Natural Sciences faculty of Christian Albrechts University, Kiel.
Landes, A., Dolmer, P., Poulsen, L. K., Petersen, J. K., and Vismann, B. (2015). Growth and respiration in blue mussels (Mytilus spp.) from different salinity regimes. J. Shellfish Res. 34, 373–382. doi: 10.2983/035.034.0220
Maar, M., Saurel, C., Landes, A., Dolmer, P., and Petersen, J. K. (2015). Growth potential of blue mussels (M. edulis) exposed to different salinities evaluated by a Dynamic Energy Budget model. J. Mar. Syst. 148, 48–55. doi: 10.1016/j.jmarsys.2015.02.003
McConnaughey, T. A., and Whelan, J. F. (1997). Calcification generates protons for nutrient and bicarbonate uptake. Earth-Sci. Rev. 42, 95–117. doi: 10.1016/S0012-8252(96)00036-0
Meier, H. E. M. (2006). Baltic Sea climate in the late twenty-first century: a dynamical downscaling approach using two global models and two emission scenarios. Clim. Dynam. 27, 39–68. doi: 10.1007/s00382-006-0124-x
Melzner, F., Stange, P., Trübenbach, K., Thomsen, J., Casties, I., Panknin, U., et al. (2011). Food supply and seawater pCO2 impact calcification and internal shell dissolution in the blue mussel Mytilus edulis. PLoS ONE 6:e24223. doi: 10.1371/journal.pone.0024223
Niggli, V., Sigel, E., and Carafoli, E. (1982). The purified Ca2+ pump of human erythrocyte membranes catalyzes an electroneutral Ca2+-H+ exchange in reconstituted liposomal systems. JBC 257, 2350–2356.
Norling, P., and Kautsky, N. (2008). Patches of the mussel Mytilus sp. are islands of high biodiversity in subtidal sediment habitats in the Baltic Sea. Aquat. Biol. 4, 75–87. doi: 10.3354/ab00096
Palmer, A. (1983). Relative cost of producing skeletal organic matrix versus calcification: evidence from marine gastropods. Mar. Biol. 75, 287–292. doi: 10.1007/BF00406014
Palmer, A. R. (1992). Calcification in marine molluscs: how costly is it? Proc. Natl. Acad. Sci. U.S.A. 89, 1379–1382.
Podbielski, I., Bock, C., Lenz, M., and Melzner, F. (2016). Using the critical salinity (Scrit) concept to predict invasion potential of the anemone Diadumene lineata in the Baltic Sea. Mar. Biol. 163, 227. doi: 10.1007/s00227-016-2989-5
Renaud, S. M., Thinh, L. V., Lambrinidis, G., and Parry, D. L. (2002). Effect of temperature on growth, chemical composition and fatty acid composition of tropical Australian microalgae grown in batch cultures. Aquaculture 211, 195–214. doi: 10.1016/S0044-8486(01)00875-4
Ries, J. B., Ghazaleh, M. N., Connolly, B., Westfield, I., and Castillo, K. D. (2016). Impacts of seawater saturation state (ΩA = 0.4-4.6) and temperature (10, 25°C) on the dissolution kinetics of whole-shell biogenic carbonates. Geochim. Cosmochim. Acta 192, 318–337. doi: 10.1016/j.gca.2016.07.001
Riisgård, H. U., Larsen, P. S., Turja, R., and Lundgreen, K. (2014). Dwarfism of blue mussels in the low saline Baltic Sea – growth to the lower salinity limit. Mar. Ecol. Pro. Ser. 517, 181–192. doi: 10.3354/meps11011
Riisgård, H. U., Lüskow, F., Pleissner, D., Lundgreen, K., and López, M. Á. P. (2013). Effect of salinity on filtration rates of mussels Mytilus edulis with special emphasis on dwarfed mussels from the low-saline Central Baltic Sea. Helgoland Mar. Res. 67, 591–598. doi: 10.1007/s10152-013-0347-2
Rola, R. C., Souza, M. M., and Sandrini, J. Z. (2017). Hypoosmotic stress in the mussel Perna perna (Linnaeus, 1758): is ecological history a determinant for organismal responses? Estuar. Coast. Shelf Sci. 189, 216–223. doi: 10.1016/j.ecss.2017.03.020
Sanders, T., Widdicombe, S., Calder-Potts, R., and Spicer, J. I. (2014). Environmental hypoxia but not minor shell damage affects scope for growth and body condition in the blue mussel Mytilus edulis (L.). Mar Environ. Res. 95, 74–80. doi: 10.1016/j.marenvres.2013.12.013
Seixas, P., Coutinho, P., Ferreira, M., and Otero, A. (2009). Nutritional value of the cryptophyte Rhodomonas lens for Artemia sp. J. Exp. Mar. Biol. Ecol. 381, 1–9. doi: 10.1016/j.jembe.2009.09.007
Silva, A. L., and Wright, S. H. (1994). Short-term cell volume regulation in Mytilus californianus gill. J. Exp. Biol. 194, 47–68.
Stuckas, H., Knöbel, L., Schade, H., Breusing, C., Hinrichsen, H. H., Bartel, M., et al. (2017). Combining hydrodynamic modelling with genetics: can passive larval drift shape the genetic structure of Baltic Mytilus populations? Mol. Ecol. 26, 2765–2782. doi: 10.1111/mec.14075
Tedengren, M., Andr,é, C., Johannesson, K., and Kautsky, N. (1990). Genotypic and phenotypic differences between Baltic and North Sea populations of Mytilus edulis evaluated through reciprocal transplantations. III. Physiology. Mar. Ecol. Prog. Ser. 59, 221–227. doi: 10.3354/meps059221
Tedengren, M., and Kautsky, N. (1986). Comparative study of the physiology and its probable effect on size in blue mussels (Mytilus edulis L.) from the North Sea and the Northern Baltic Proper. Ophelia 25, 147–155. doi: 10.1080/00785326.1986.10429746
Thomsen, J., Haynert, K., Wegner, K. M., and Melzner, F. (2015). Impact of seawater carbonate chemistry on the calcification of marine bivalves. Biogeosciences 12, 4209–4220. doi: 10.5194/bg-12-4209-2015
Thomsen, J., Ramesh, K., Sanders, T., Bleich, M., and Melzner, F. (2018). Calcification in a marginal sea – influence of seawater [Ca2+] and carbonate chemistry on bivalve shell formation. Biogesciences 15, 1469–1482. doi: 10.5194/bg-15-1469-2018
Tyrrell, T., Schneider, B., Charalampopoulou, A., and Riebesell, U. (2008). Coccolithophores and calcite saturation state in the Baltic and Black Seas. Biogeosciences 5, 485–494. doi: 10.5194/bg-5-485-2008
Väinölä, R., and Hvilsom, M. M. (1991). Genetic divergence and a hybrid zone between Baltic and North Sea Mytilus populations (Mytilidae: Mollusca). Biol. J. Linnean Soc. 43, 127–148. doi: 10.1111/j.1095-8312.1991.tb00589.x
Waldbusser, G. G., Brunner, E. L., Haley, B. A., Hales, B., Langdon, C. J., and Prahl, F. G. (2013). Developmental and energetic basis linking larval oyster shell formation to acidification sensitivity. Geophys. Res. Lett. 40, 2171–2176. doi: 10.1002/grl.50449
Waldbusser, G. G., Hales, B., and Haley, B. A. (2016). Calcium carbonate saturation state: on myths and this or that stories. ICES J. Mar. Sci. 73, 563–568. doi: 10.1093/icesjms/fsv174
Wang, Y., Hu, M., Wong, W. H., Shin, P. K., and Cheung, S. G. (2011). The combined effects of oxygen availability on physiological responses and scope for growth in the green-lipped mussel Perna viridis. Mar. Poll. Bull. 63, 225–261. doi: 10.1016/j.marpolbul.2011.02.004
Watson, S. A., Morley, S. A., and Peck, L. S. (2017). Latitudinal trends in shell production cost from the tropics to the poles. Sci. Adv. 3:e1701362. doi: 10.1126/sciadv.1701362
Weiner, S., and Traub, W. (1984). Macromolecules in mollusc shells and their functions in biomineralisation. Philos. Trans. R. Soc. Lond. B Biol. Sci. 304, 425–434. doi: 10.1098/rstb.1984.0036
Willmer, P. G. (1978a). Volume regulation and solute balance in the nervous tissue of an osmoconforming bivalve (Mytilus edulis). J. Exp. Biol. 77, 157–179.
Keywords: climate change, energetics, energy budget, metabolism, oxygen consumption, scope for growth
Citation: Sanders T, Schmittmann L, Nascimento-Schulze JC and Melzner F (2018) High Calcification Costs Limit Mussel Growth at Low Salinity. Front. Mar. Sci. 5:352. doi: 10.3389/fmars.2018.00352
Received: 30 May 2018; Accepted: 12 September 2018;
Published: 02 October 2018.
Edited by:
Youji Wang, Shanghai Ocean University, ChinaReviewed by:
Gilles Le Moullac, Institut Français de Recherche pour l'Exploitation de la Mer (IFREMER), FranceHon Jung LIEW, Universiti Malaysia Terengganu, Malaysia
Copyright © 2018 Sanders, Schmittmann, Nascimento-Schulze and Melzner. This is an open-access article distributed under the terms of the Creative Commons Attribution License (CC BY). The use, distribution or reproduction in other forums is permitted, provided the original author(s) and the copyright owner(s) are credited and that the original publication in this journal is cited, in accordance with accepted academic practice. No use, distribution or reproduction is permitted which does not comply with these terms.
*Correspondence: Trystan Sanders, dHNhbmRlcnNAZ2VvbWFyLmRl