 Tim van Emmerik1*
 Thuy-Chung Kieu-Le2,3Michelle Loozen1
 Kees van Oeveren1
 Emilie Strady2,4Xuan-Thanh Bui5
 Matthias Egger1
 Johnny Gasperi6Laurent Lebreton1,7Phuoc-Dan Nguyen2,5Anna Schwarz1Boyan Slat1
 Bruno Tassin6
- 1The Ocean Cleanup, Rotterdam, Netherlands
- 2CARE, Ho Chi Minh City University of Technology, Ho Chi Minh City, Vietnam
- 3Faculty of Geology and Petroleum Engineering, Ho Chi Minh City University of Technology, Ho Chi Minh City, Vietnam
- 4CNRS, IRD, Grenoble INP, IGE, University of Grenoble Alpes, Saint-Martin-d’Hères, France
- 5Faculty of Environment and Natural Resources, Ho Chi Minh City University of Technology, Ho Chi Minh City, Vietnam
- 6Laboratoire Eau, Environnement, Systèmes Urbains (LEESU) - UMR-MA 102 – UPEC-ENPC-AgroParisTech, Université Paris-Est, Créteil, France
- 7The Modelling House Limited, Raglan, New Zealand
Land-based macroplastic is considered one of the major sources of marine plastic debris. However, estimations of plastic emission from rivers into the oceans remain scarce and uncertain, mainly due to a severe lack of standardized observations. To properly assess global plastic fluxes, detailed information on spatiotemporal variation in river plastic quantities and composition are urgently needed. In this paper, we present a new methodology to characterize riverine macroplastic dynamics. The proposed methodology was applied to estimate the plastic emission from the Saigon River, Vietnam. During a 2-week period, hourly cross-sectional profiles of plastic transport were made across the river width. Simultaneously, sub-hourly samples were taken to determine the weight, size and composition of riverine macroplastics (>5 cm). Finally, extrapolation of the observations based on available hydrological data yielded new estimates of daily, monthly and annual macroplastic emission into the ocean. Our results suggest that plastic emissions from the Saigon River are up to four times higher than previously estimated. Importantly, our flexible methodology can be adapted to local hydrological circumstances and data availability, thus enabling a consistent characterization of macroplastic dynamics in rivers worldwide. Such data will provide crucial knowledge for the optimization of future mediation and recycling efforts.
Introduction
Rivers are a major source of ocean plastic pollution. Recent global estimates of riverine plastic emissions into the oceans vary between 0.4–2.75 million tonnes plastic per year (Lebreton et al., 2017; Schmidt et al., 2018). At present, these model-based estimates are still associated with large uncertainties, as a lack of field measurements is hampering the further advancement of our understanding of the dynamics of riverine plastic debris (Eerkes-Medrano et al., 2015; Jambeck et al., 2015; González-Fernández and Hanke, 2017; Lebreton et al., 2017). Accurate measurements to quantify and monitor plastic fluxes in rivers are scarce (Lechner et al., 2014; Lebreton et al., 2017; Lahens et al., 2018). In addition, sampling methods and units are not standardized (Jambeck et al., 2015; Koelmans et al., 2017), which makes the direct comparison between different river systems challenging.
Previous studies that aimed to quantify meso (0.5–5 cm) or macroplastics (>5 cm) in rivers used surface booms (Gasperi et al., 2014; Dris et al., 2015, 2018), manta trawls (Moore et al., 2011; Faure et al., 2015), nets (Lechner et al., 2014; Morritt et al., 2014; Cózar et al., 2015), or sampling of shoreline sediments (Browne et al., 2010). These methods all require additional equipment, such as cranes or boats, and several people to perform the measurements. Therefore, the current assessment of plastic fluxes in rivers remains challenging and expensive. Variations in time (daily and seasonal) and space (over river width and length) therefore remain largely unknown. Most available data solely contain point measurements that are directly upscaled to daily or yearly plastic emission rates (Moore et al., 2011; Lechner et al., 2014; Dris et al., 2018). Thus, the lack of spatiotemporal information is unequivocally the largest uncertainty in global estimations of riverine plastic emissions into the oceans. Note that we use the definition from Lebreton et al. (2018) for macroplastics (>5 mm) for consistency.
Here, we propose a new methodology to characterize (floating) macroplastics in rivers, including a first application in the Saigon River, Vietnam. Our stepwise approach uses a combination of sampling methods and simple models to estimate daily and monthly plastic emission rates. Vietnamese rivers are estimated to have a high plastic loading per capita, partly because of a high share of mismanaged plastic waste (Hoornweg and Bhada-Tata, 2012). The Saigon River traverses the densely populated megacity of Ho Chi Minh City relatively close to the river mouth and is estimated to be the 5th most plastic emitting river in Vietnam and the 45th in the world, respectively (Lebreton et al., 2017).
Based on measurements conducted during a field campaign from February 28 to March 13, 2018, this study provides a first estimation of spatiotemporal variation in quantity and composition of riverine macroplastics. Sub-hourly samples were taken daily, using static bridge-mounted trawls and visual counting of floating plastic debris. Subsequently, the trawled samples were analyzed to determine their mass and composition. Finally, we present new estimation of the total daily, monthly and annual plastic emissions, which were compared to recent estimates for the Saigon River (Lebreton et al., 2017; Lahens et al., 2018). The objectives of this study are (1) to present a comprehensive methodology to characterize macroplastics in rivers, (2) to better understand spatiotemporal variation in plastic transport in rivers, and (3) to provide refined estimates of plastic emissions from rivers into the ocean.
New Methodology to Characterize Riverine Macroplastic Emission Into The Ocean
Global estimates of plastic transport through rivers require a standardized monitoring approach that can be easily applied to any river system. We suggest a new methodology to quantify macroplastic transport in rivers, consisting of the following four steps (see Figure 1).
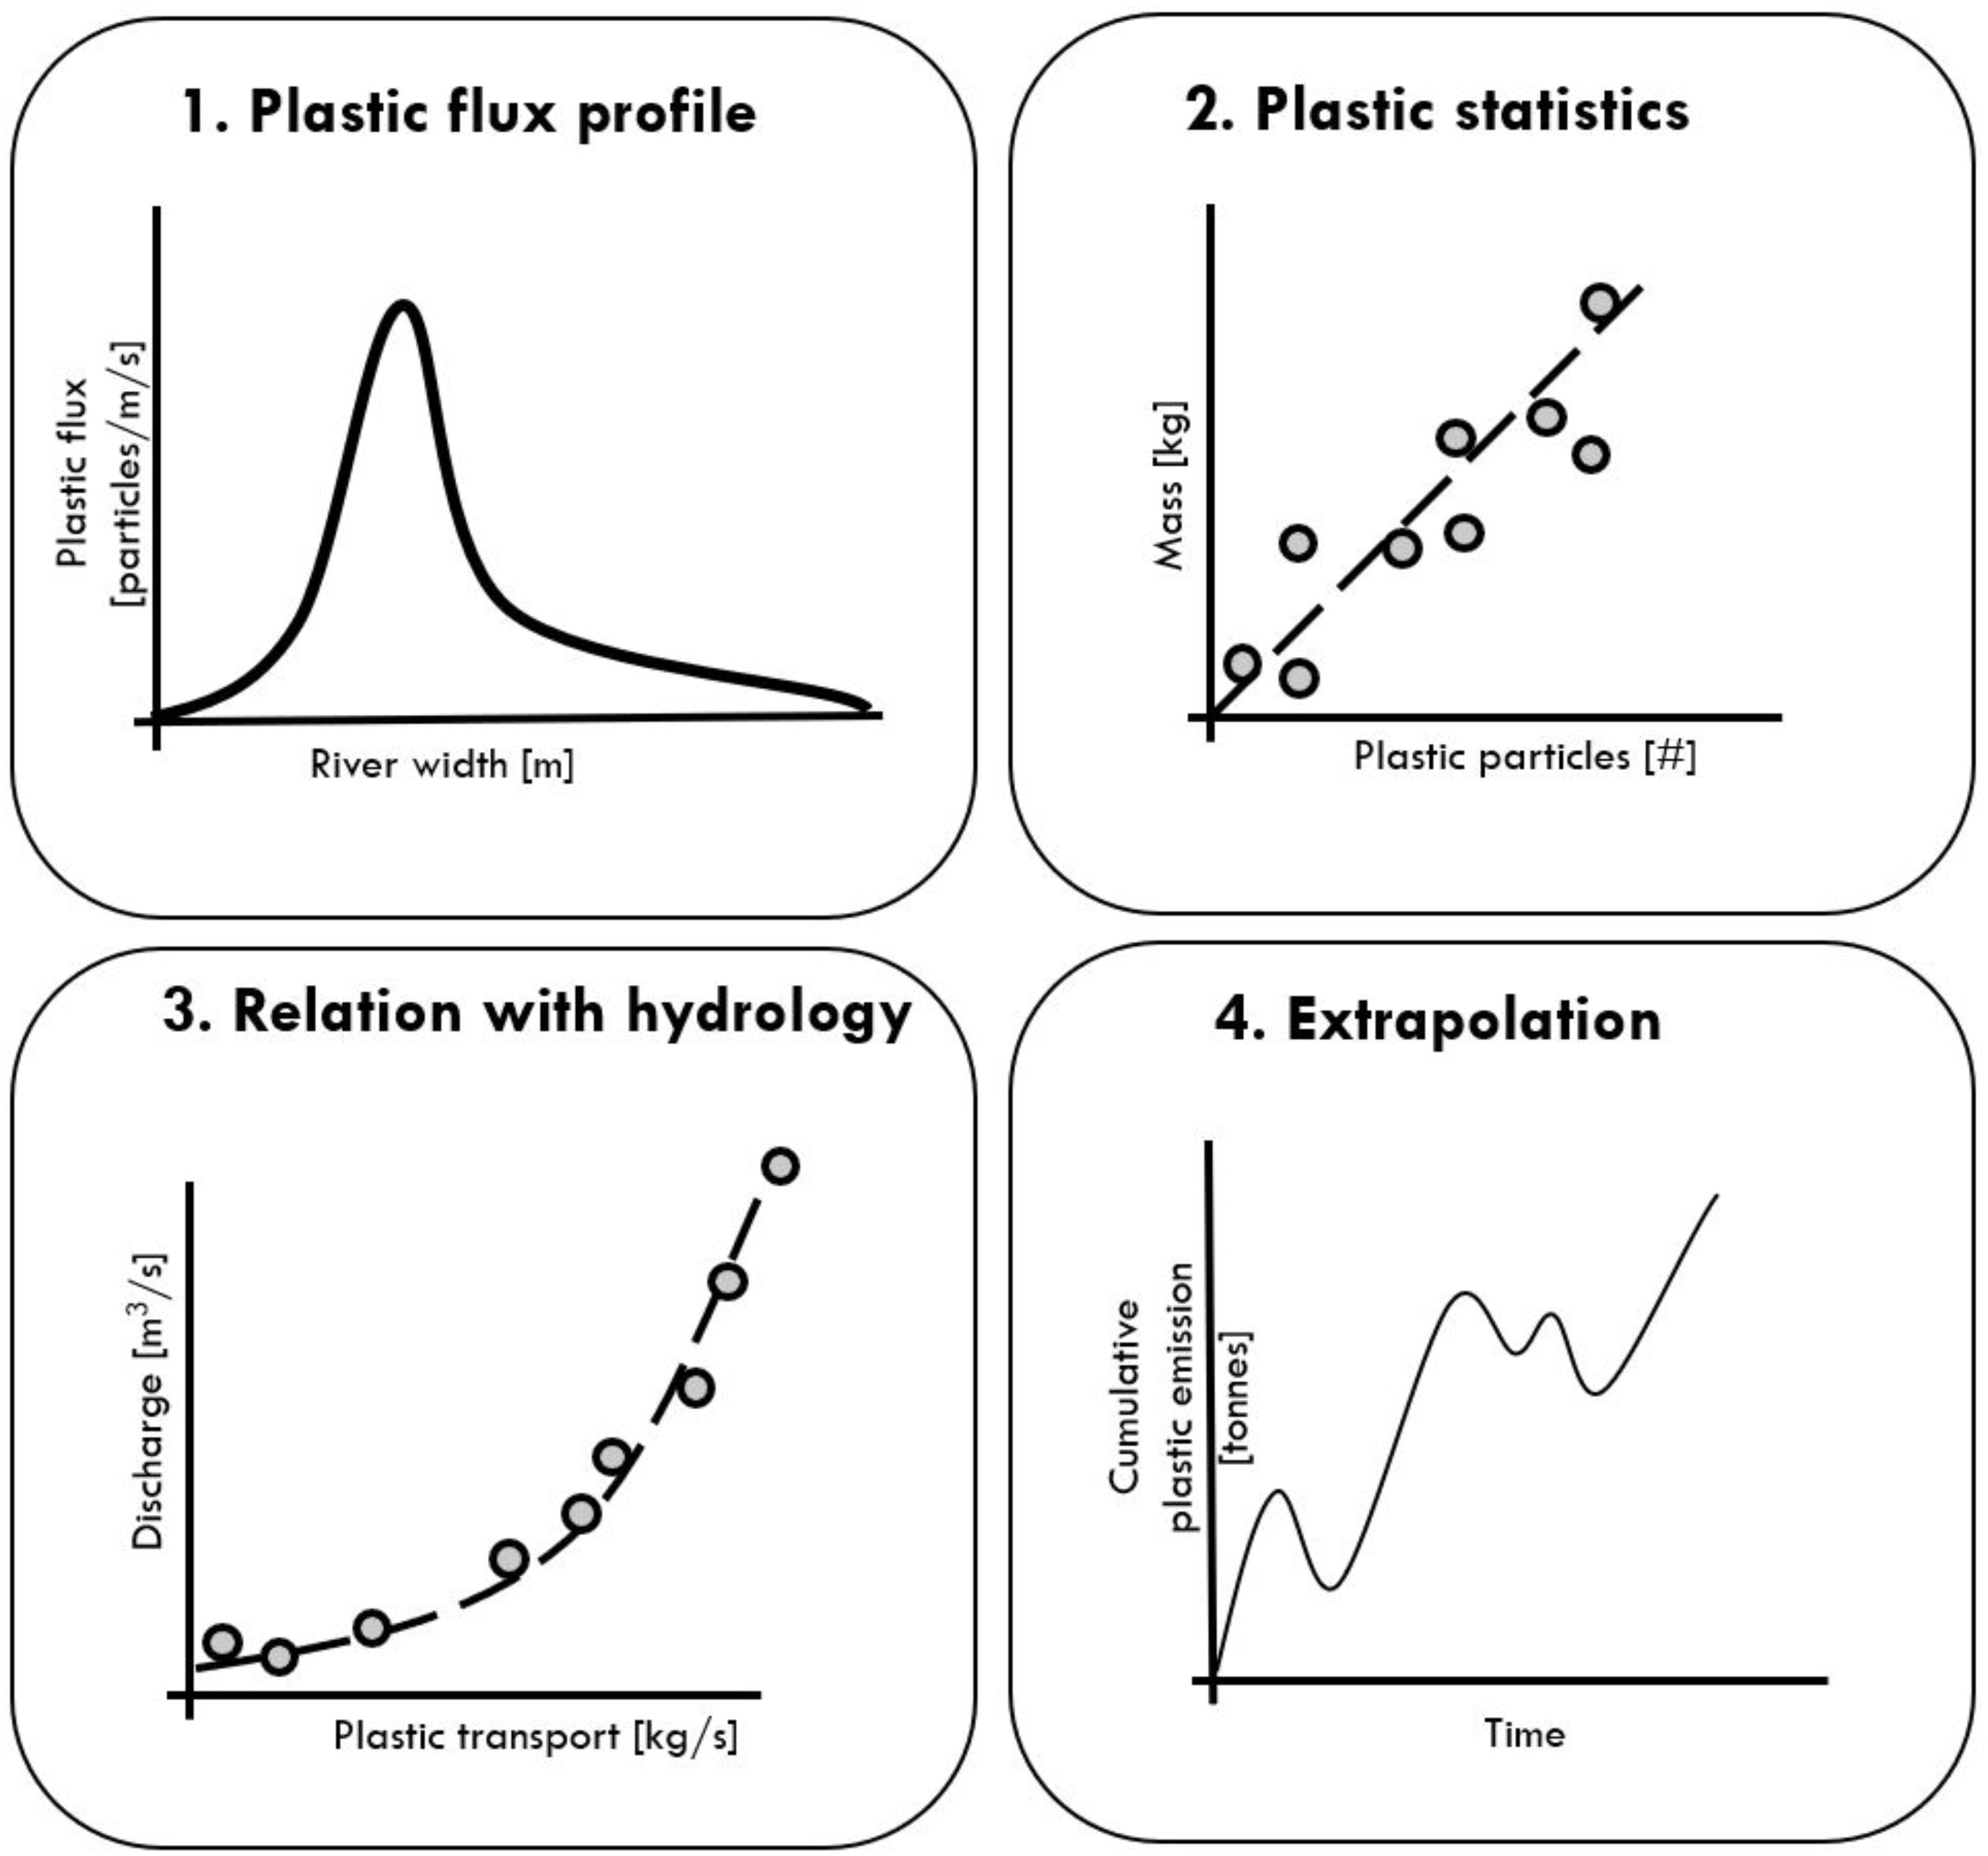
FIGURE 1. Proposed step-wise methodology to characterize macroplastic dynamics from rivers into the ocean.
Determine Cross-Sectional Profiles of the Plastic Flux
As simple point measurements are difficult to extrapolate over the river width and could be influenced by local hydrodynamic conditions, detailed profiles of the plastic flux should be determined across the river width. In this study we used visual plastic piece counting (González-Fernández and Hanke, 2017). However, this can also be done automatically using drones or cameras, for example.
Obtain Plastic Debris Statistics
An average value for mass per plastic piece can be used to translate the cross-sectional profiles, expressed in pieces per unit of time and river width, to plastic mass flow (e.g., mass per unit of time). Here, we determined the mass statistics by (1) coupling visually counted flow of plastic debris to trawled plastic mass, and (2) by weighing a subset of plastic pieces individually. Further statistics on plastic composition, size, volume and identity can give additional insights into the origin and fate of riverine plastic debris.
Couple Plastic Flux to Hydrology
Previous studies have coupled plastic transport to river discharge (Lebreton et al., 2017; Schmidt et al., 2017). Other mechanisms could include transport initiated through rainfall events, wind, or flow velocity patterns. Especially for rivers with strong tidal influence, the relation of plastic transport with hydrology should be explored to derive the net transport of plastic into the ocean. In more ungauged rivers, alternative (soft) data might be used to as proxies for hydrological behavior (van Emmerik et al., 2015).
Extrapolate Observations
To estimate daily, monthly or annual plastic emissions, the observed plastic mass flow can be extrapolated using timeseries of hydrological data. For example, a relation between river discharge and plastic flux can be used to estimate plastic emissions using long-term discharge data.
Our methodology aims to be a first step toward standardized macroplastic monitoring in river systems. It offers a high degree of flexibility and a gradient in complexity, and can be easily updated to other river systems. Depending on local circumstances and available technology, different measurement techniques can be used for each step. Finally, coupling to local hydrology is highly reliant on data availability, but still offers a good first order-of-magnitude approximation of annual riverine plastic transport.
Application of the Methodology to the Saigon River, Vietnam
All measurements were taken in the Saigon River in Ho Chi Minh City (HCMC) from February 28 to March 13, 2018, between 07:00 and 17:00. The Saigon River is about 250 km long and has a catchment area of 4717 km2 (Lahens et al., 2018). The dense urban canal network (700 km) of HCMC drains into the Saigon River. The climate is characterized by a monsoon season from May to October, and a dry season from December to April. Sampling was done from the 300-meter-wide Thu Thiem bridge (10°47′08.3″N 106°43′06.2″E), located 70 km upstream from the river mouth. The sampling location was affected by semidiurnal and asymmetric tidal influences, with a tidal range of up to 3 m. Plastic debris counting was done at 12 locations across the Thu Thiem bridge. Figure 2 indicates the measurement locations of the plastic sampling and counting experiments. The observation sites are numbered from 1 (south) to 12 (north). Plastic samples were primarily taken at locations 2, 3, 10, and 11, as here the highest plastic concentrations were observed.
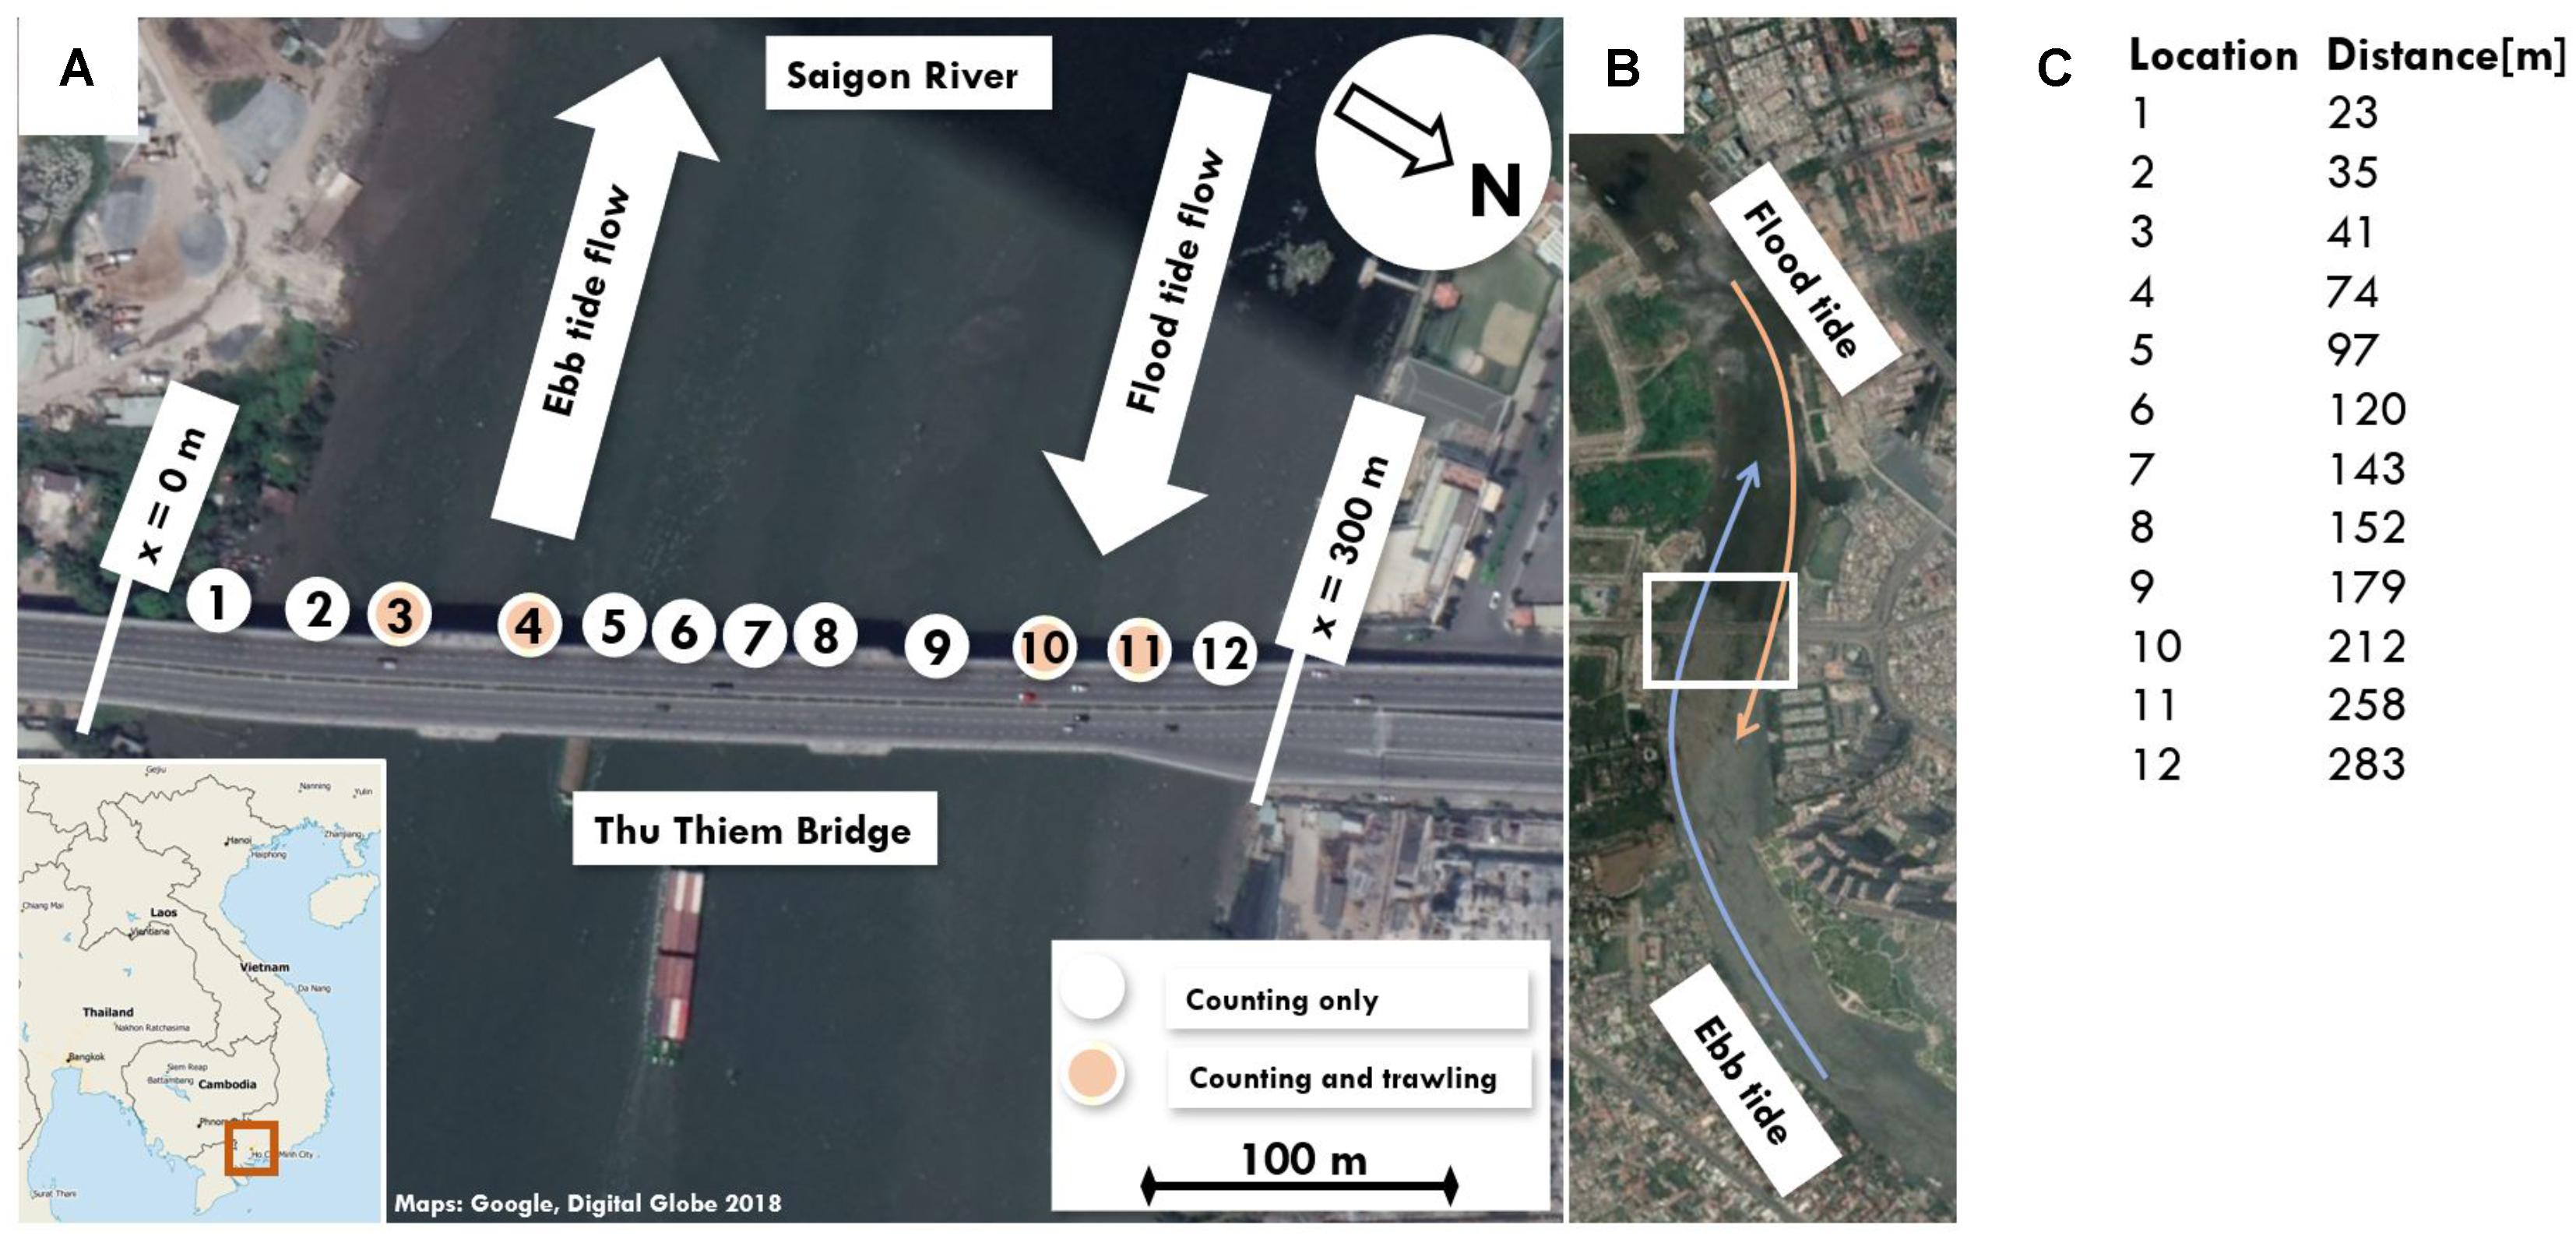
FIGURE 2. (A) Measurement location and observation sites on the Thu Thiem bridge. Note that the observation sites run from 1 (south) to 12 (north). Arrows project the observed influence of tidal dynamics on plastic flux direction. Bridge-mounted trawls were deployed at location 2 and 3 during ebb tide flow and at location 10 and 11 during flood tide flow (Map: Google, Digital Globe, 2018). (B) Overview of the curvature of the river, with an indication of the location of the highest plastic concentration during flood and ebb tides. (C) Location of each observation point.
Plastic Flux Profile: Visual Plastic Debris Counting
Visual counting of plastic debris was based on the approach presented by González-Fernández and Hanke (2017). It was conducted on 10 days between February 28 and March 13 to (1) quantify the spatial variation of plastic debris across the river width, and (2) to extrapolate the plastic sampling results over the river cross-section. During each sampling day, between 5 and 11 h profiles were made between 07:00 and 17:00. At 12 locations across the bridge, the number of plastic pieces that passed through a 15-m-wide section was visually counted for 2 min. All locations were observed sequential, starting at location 1. Hence, a complete profile was measured in 30 min. In total 60% of the cross-section was observed. Counting was done facing downstream, as we could identify plastic pieces more accurately. The distance from the bridge to the water was on average 12 m, with maximum fluctuations of around 3 m. Each floating and superficially submerged plastic piece that was visible was counted, independent of its size. Based on visual inspection, it was estimated that the clearness of the water was stable during the measurement period, and that the first 10 cm of the water column was visible. Although weather conditions such as heavy rainfall, high wind speed, or sun glare, might influence the visibility of plastic, this was not experienced during the measurement period. The average minimum debris size was estimated to be 1 cm. If the debris type was uncertain, it was not counted as plastic. For subsequent analysis, the plastic debris counts were normalized over time and distance and expressed in plastic pieces per meter river width, per minute or second.
Plastic Statistics: Plastic Sampling With Static Trawls
Plastic sampling was done using static bridge-mounted trawls, with a height of 70 cm and width of 100 cm, that were fixed onto the Thu Thiem bridge. Sub-hourly sampling was done on 10 days between 1 and 13 March, between 7:00 and 17:00. During sampling, 40 cm of the net’s height was constantly submerged. A 2-meter long net was attached to the frame, with a square mesh size of 4 cm. The chosen mesh size was an optimization between the desired size fraction of the plastic catch and the controllability of the trawl due to the drag force. To increase buoyancy and stability, horizontal buoys were attached on each side of the frame. Depending on the water flow velocity, trawling deployments lasted between 1 and 10 min. During each trawling experiment, additional 2-min visual plastic debris counting was done for the stretch were the trawl was deployed to estimate the average mass per plastic piece. Also here, a 15-m stretch was visually counted, but normalized to plastic items per meter to link it to the trawl measurements. The trawling location was determined based on the prevailing flow direction and observed largest debris amount. During ebb tide flow trawling was done at location 2 and 3 (Figure 2), and during flood tide flow trawling was done at location 11 and 12 (Figure 2).
The retrieved samples were divided into three categories: (1) organic, (2) plastic, and (3) rest debris. All categorized samples were weighed individually. After separation of the sample, the trawl was deployed again. At the end of each day, all plastic samples were visually subdivided into polyethylene terephthalate (PET), polystyrene (PS), and polyolefin (PO) and weighed. The division guidelines can be found in the Supplementary Table S1. A subset of plastic samples, daily totals of 1 to 3 and 10 March, was further analyzed in the lab at CARE in HCMC. The samples were sun-dried for at least 24 h and up to 7 days, and subsequently the bulk dry mass was determined for each plastic type. Finally, each plastic piece was individually analyzed to determine their mass, size, and plastic type.
Relation With Hydrology
Plastic transport Mp [kg s−1] can be expressed as a function of discharge Q [m3 s−1] and plastic concentration Cp [kg plastic/m3]
With specific Cp,i for each section. The total plastic mass transport was estimated by integrating the cross-sectional plastic profiles over the river width. This yields the total plastic flux in numbers of plastic pieces per unit of time. Subsequently, the plastic flux was multiplied by the estimated average mass per plastic piece (based on trawling and lab measurements) to derive the total plastic mass flux.
River discharge for 2018 was not available and was estimated using discharge measurements and astronomical tide for 2013, as this was the only year with discharge data available. Based on linear regression, discharge for 2018 was estimated for March. Discharge data measured at Phu An station in 2013, 2.5 km downstream of the measurement location at Thu Thiem bridge was made available by the Center for Water Management and Climate Change of the Vietnam National University. Estimated astronomical tide for 2013 and 2018 at Vung Tau, 90 km downstream of The Thiem bridge, was obtained from XTide1.
Extrapolation to Daily, Monthly and Annual Estimations
To estimate daily and monthly plastic emission from the Saigon River, a simple model was formulated that assumes that plastic transport [plastic concentration in a volume of water (kg plastic m−3)] is a function of discharge and can be approximated using:
With concentration at zero flow N0 [kg m−3], parameter β and background concentration C0 [kg m−3]. The model was fitted using all 82 measurements of total plastic mass fluxes. The plastic transport model was used to estimate the total daily and monthly plastic mass flux for March 2018. Subsequently, the seasonal dynamics estimated by Lebreton et al. (2017) were used to scale the monthly estimations to annual predictions. Our estimation of monthly emission for March was linearly scaled to monthly emissions for other months and for annual emission. The results were subsequently compared to previous measurements of canals flowing into the Saigon River (Lahens et al., 2018) and model predictions for the monthly and annual plastic emission of the Saigon River (Lebreton et al., 2017).
Results and Discussion
Plastic Flux Profile
Figure 3 presents the cross-sectional profiles of the plastic flux for March 2, 7, and 9, 2018. These specific are presented to demonstrate the variation of the profile during the day, between days, and the shift of the tidal cycle. The results for the whole measurement period (March 1–13, 2018) can be found in the Supplementary Figures S1, S2. Note that a positive plastic flux means ebb tide flow (e.g., toward the river mouth) and negative plastic flux means flood tide flow (e.g., away from the river mouth). During periods of positive plastic flux, plastic is concentrated on the south side around 50 m, and during negative plastic flux, plastic is concentrated on the north side around 280 m (Figures 3A,C,E). The peak total plastic flux varies considerably between days (Figures 3B,D,F). On 7 March the total flux was more than 1,100 plastic pieces per minute, while on 2 and 9 March the peak flux was between 250 and 400 pieces per minute.
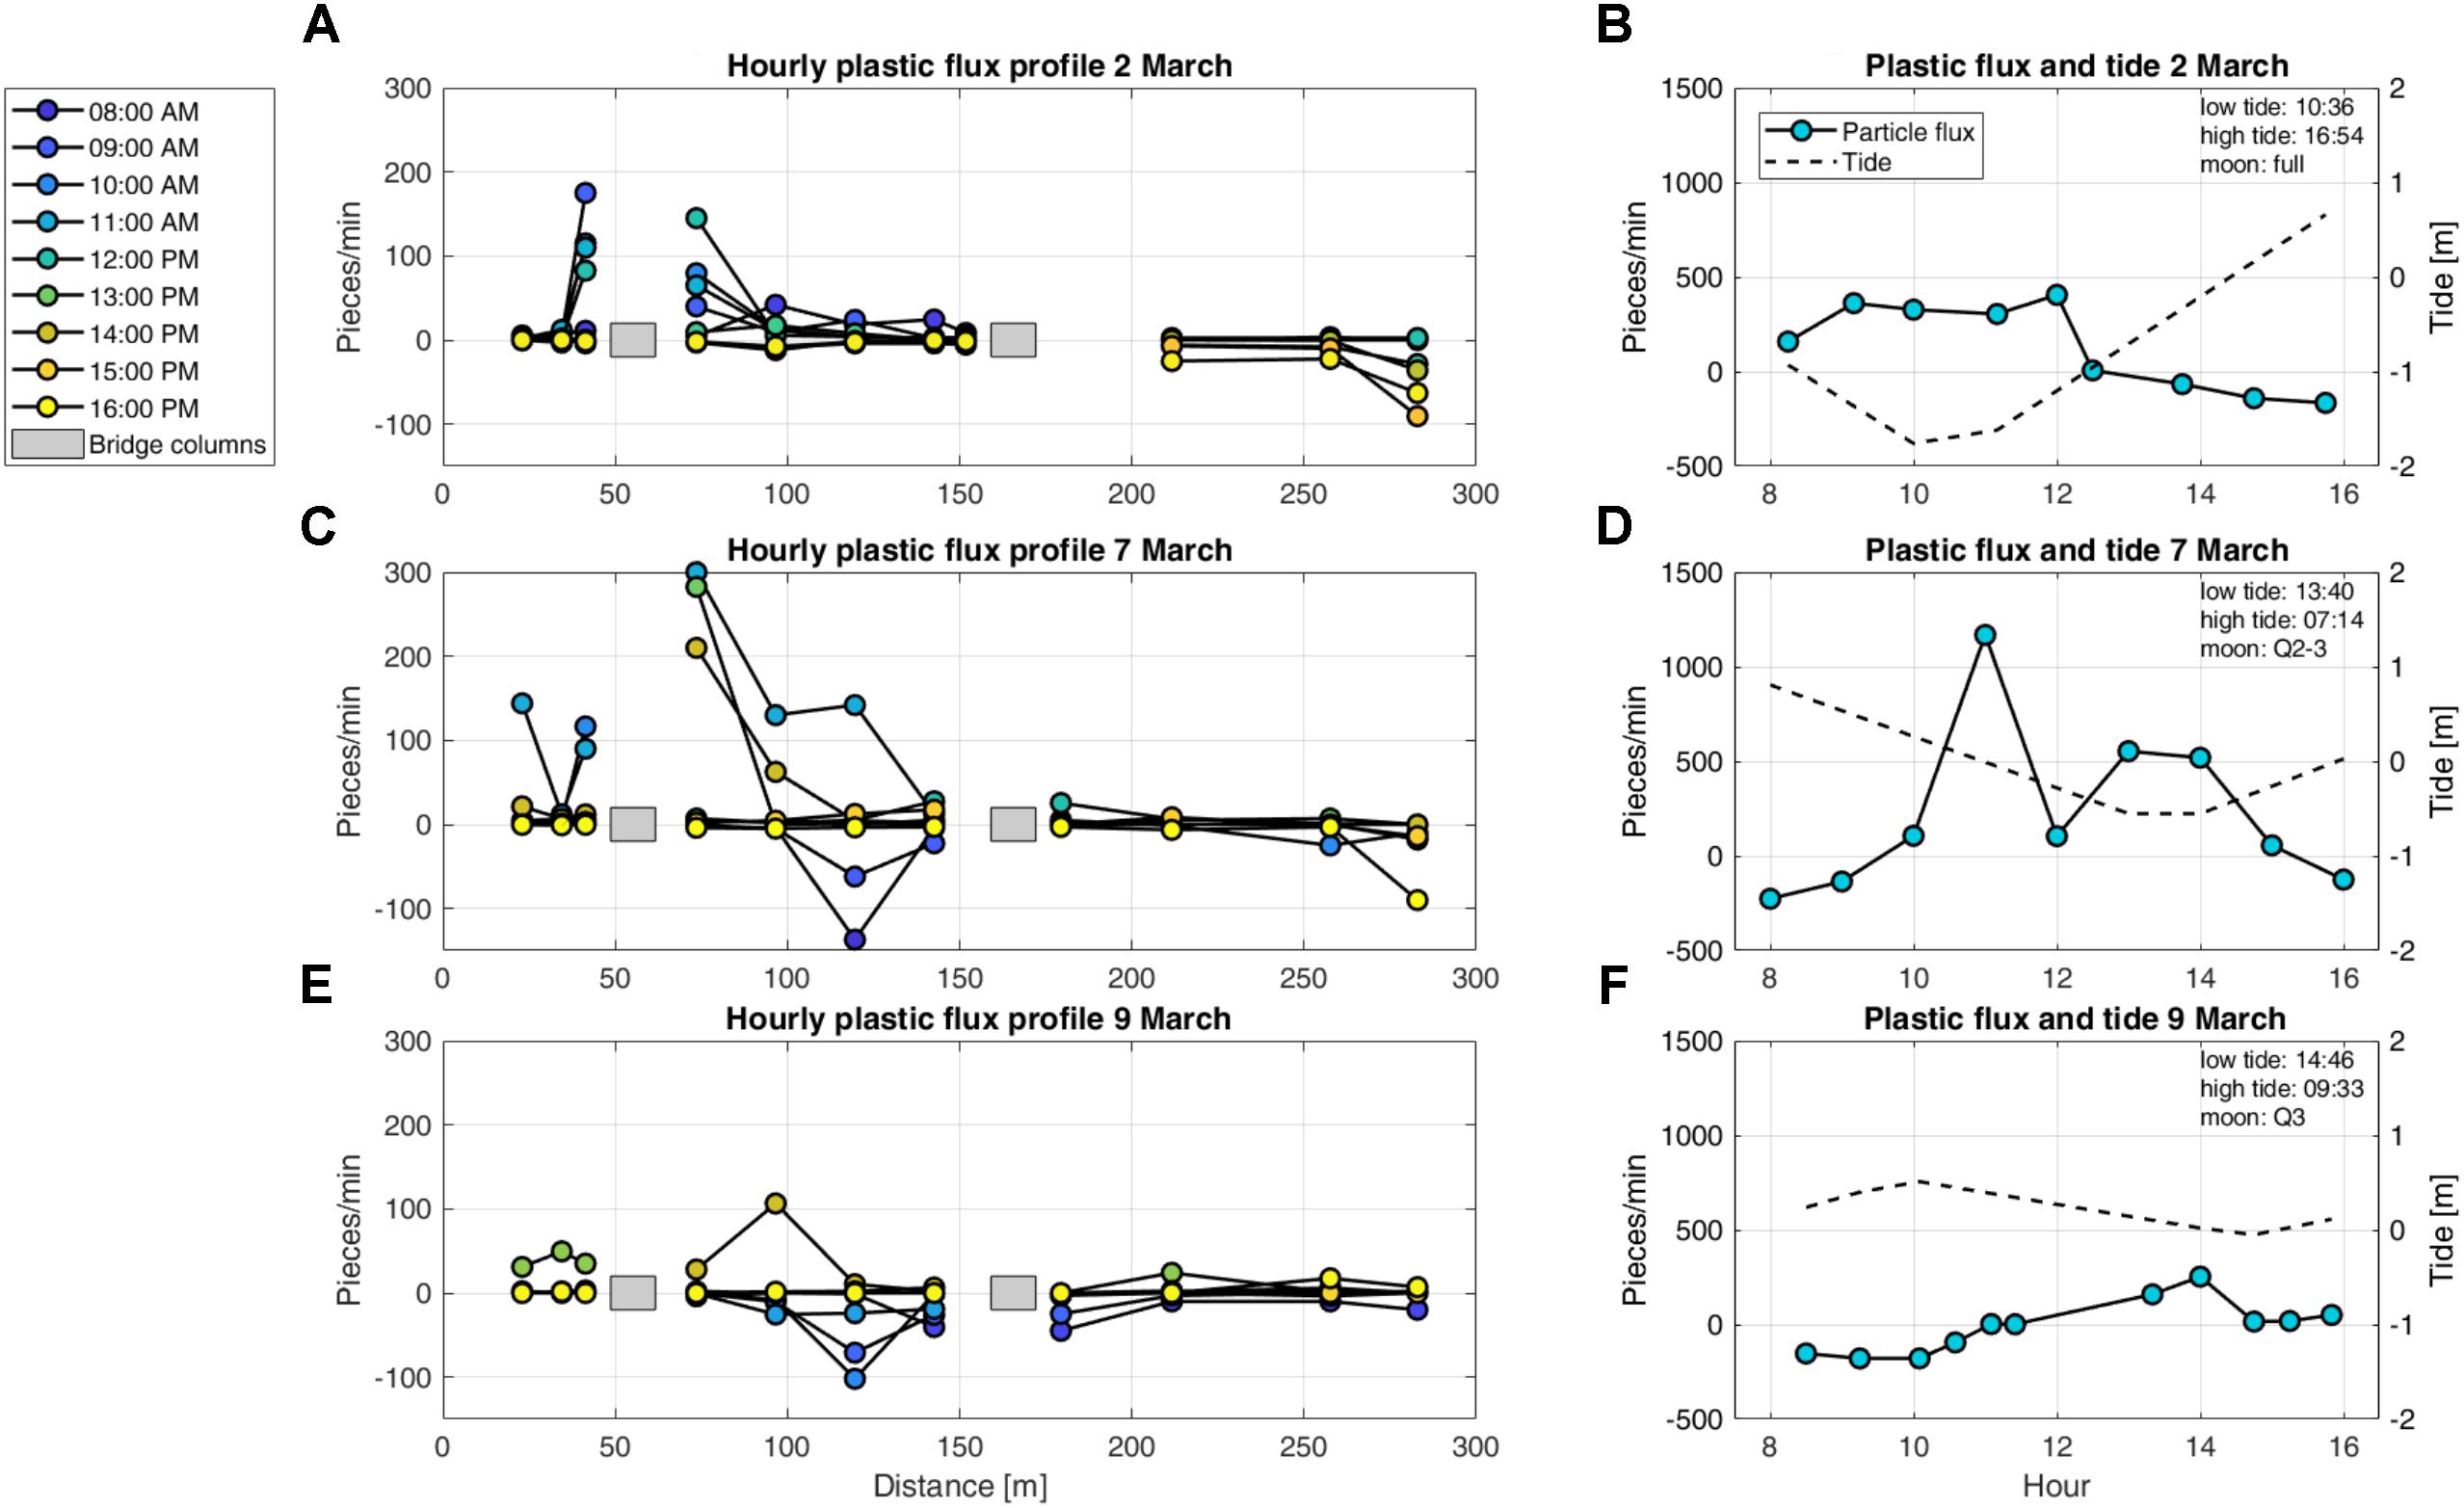
FIGURE 3. Cross sectional profiles of observed plastic pieces per minute over the river width for 2, 7 and 9 March 2018. (A,C,E) present the plastic flux over the river width with each color representing the time of day. (B,D,F) present the total plastic flux after integration over the river width, including information on high and low tide and the moon phase. The distance runs from measurement location 1 (south) to 12 (north; Figure 2), with the southern river bank as reference. Note that a positive plastic flux means ebb tide flow and plastic flux means flood tide flow. The tidal data is expressed as deviation compared to mean water level.
Close to the bridge columns a high plastic concentration was found, presumably caused by the trapping effect of the eddies created by the columns. A concentration of macroplastic fluxes was observed close to the river shores. This observation could be explained by the curvature of the river in combination with the influence of the changing tide. During ingoing tide, the flow velocity (and therefore plastic flux) is expected to be the highest at the north side of the bridge and during outgoing tide the highest flow velocity is expected at the south side of the bridge. Additional reasons for the plastic concentration include wind effects and navigation. In future work, meteorological data (wind speed and direction, rainfall) will give additional insights into the transport of plastic.
Plastic Statistics
In total 660 kg of material was sampled during the measurement campaign, of which 7.6% of the mass was identified as plastic (Supplementary Figure S4), 90.7% as organic, and 1.7% as rest material. A breakdown of all samples into plastic, organic and other debris can be found in the Supplementary Figure S3. From the simultaneous visual counting, a mass per sampled plastic piece of 3.2 g was found (Supplementary Figure S5). The amount of organic material is considerably higher than previously found by Lahens et al. (2018) (7.6 vs. 26%), explained by their focus on a side canal of the Saigon River. Based on visual inspection, it was found that most of the organic material consisted of water hyacinths, an invasive aquatic plant species. It is yet to be studied how the ratio between organic and plastic material changes over time, especially in the wet season. Based on estimations by Lebreton et al. (2017), it is expected that the plastic emission in September might be considerably higher than in March, mainly driven by higher river discharge and rainfall. At the same time, it should be low season for water hyacinth flow in autumn. It is therefore also expected that later in the year, the relative amount of plastic will be significantly higher than measured during our field campaign in March.
In total 614 plastic pieces, collected on 4 days (1 – 3 and 10 March), were analyzed in more detail. The mass and number of pieces per size class is presented in Figure 4. PO had the largest share in terms of mass (76%), and PS in terms of count (55%). Very little PET was found (7% of mass, 2% of count). A clear peak is observed in the 10 – 50 cm size class, both in mass (75% of total) and number (50%) of pieces. Note that the classes are chosen to match the classes used by Lebreton et al. (2018) to characterize the plastics in the Great Pacific Garbage Patch. The mass per plastic piece was 5.9 g, which is higher than the 3.2 g found during the trawling and plastic piece counting measurements. The variation of mass per piece was used for later estimations of total daily, monthly and annual plastic emission. Note that the size distribution is influenced by the selection of mesh size, 4cm in this case. For future research it is recommended to use a smaller mesh size to increase the likelihood of catching pieces from the 1.5 – 5 cm size class. Figure 5 presents the item identity of all 614 sampled plastic pieces. Most of the identified pieces were related to consumables (food and beverages), with a clear peak for PS foam food containers and fragments (224 of 614). For potential interception and recycling purposes, more detailed plastic separation is recommended for future work. Because of limited methods for plastic type identification in the field, we propose a separation method based on usage (e.g., bags/foils) or hardness (e.g., rigid or soft vs hard).

FIGURE 4. Mass and number of pieces per size class for (A) all plastic, (B) PET, (C) PS, and (D) PO.
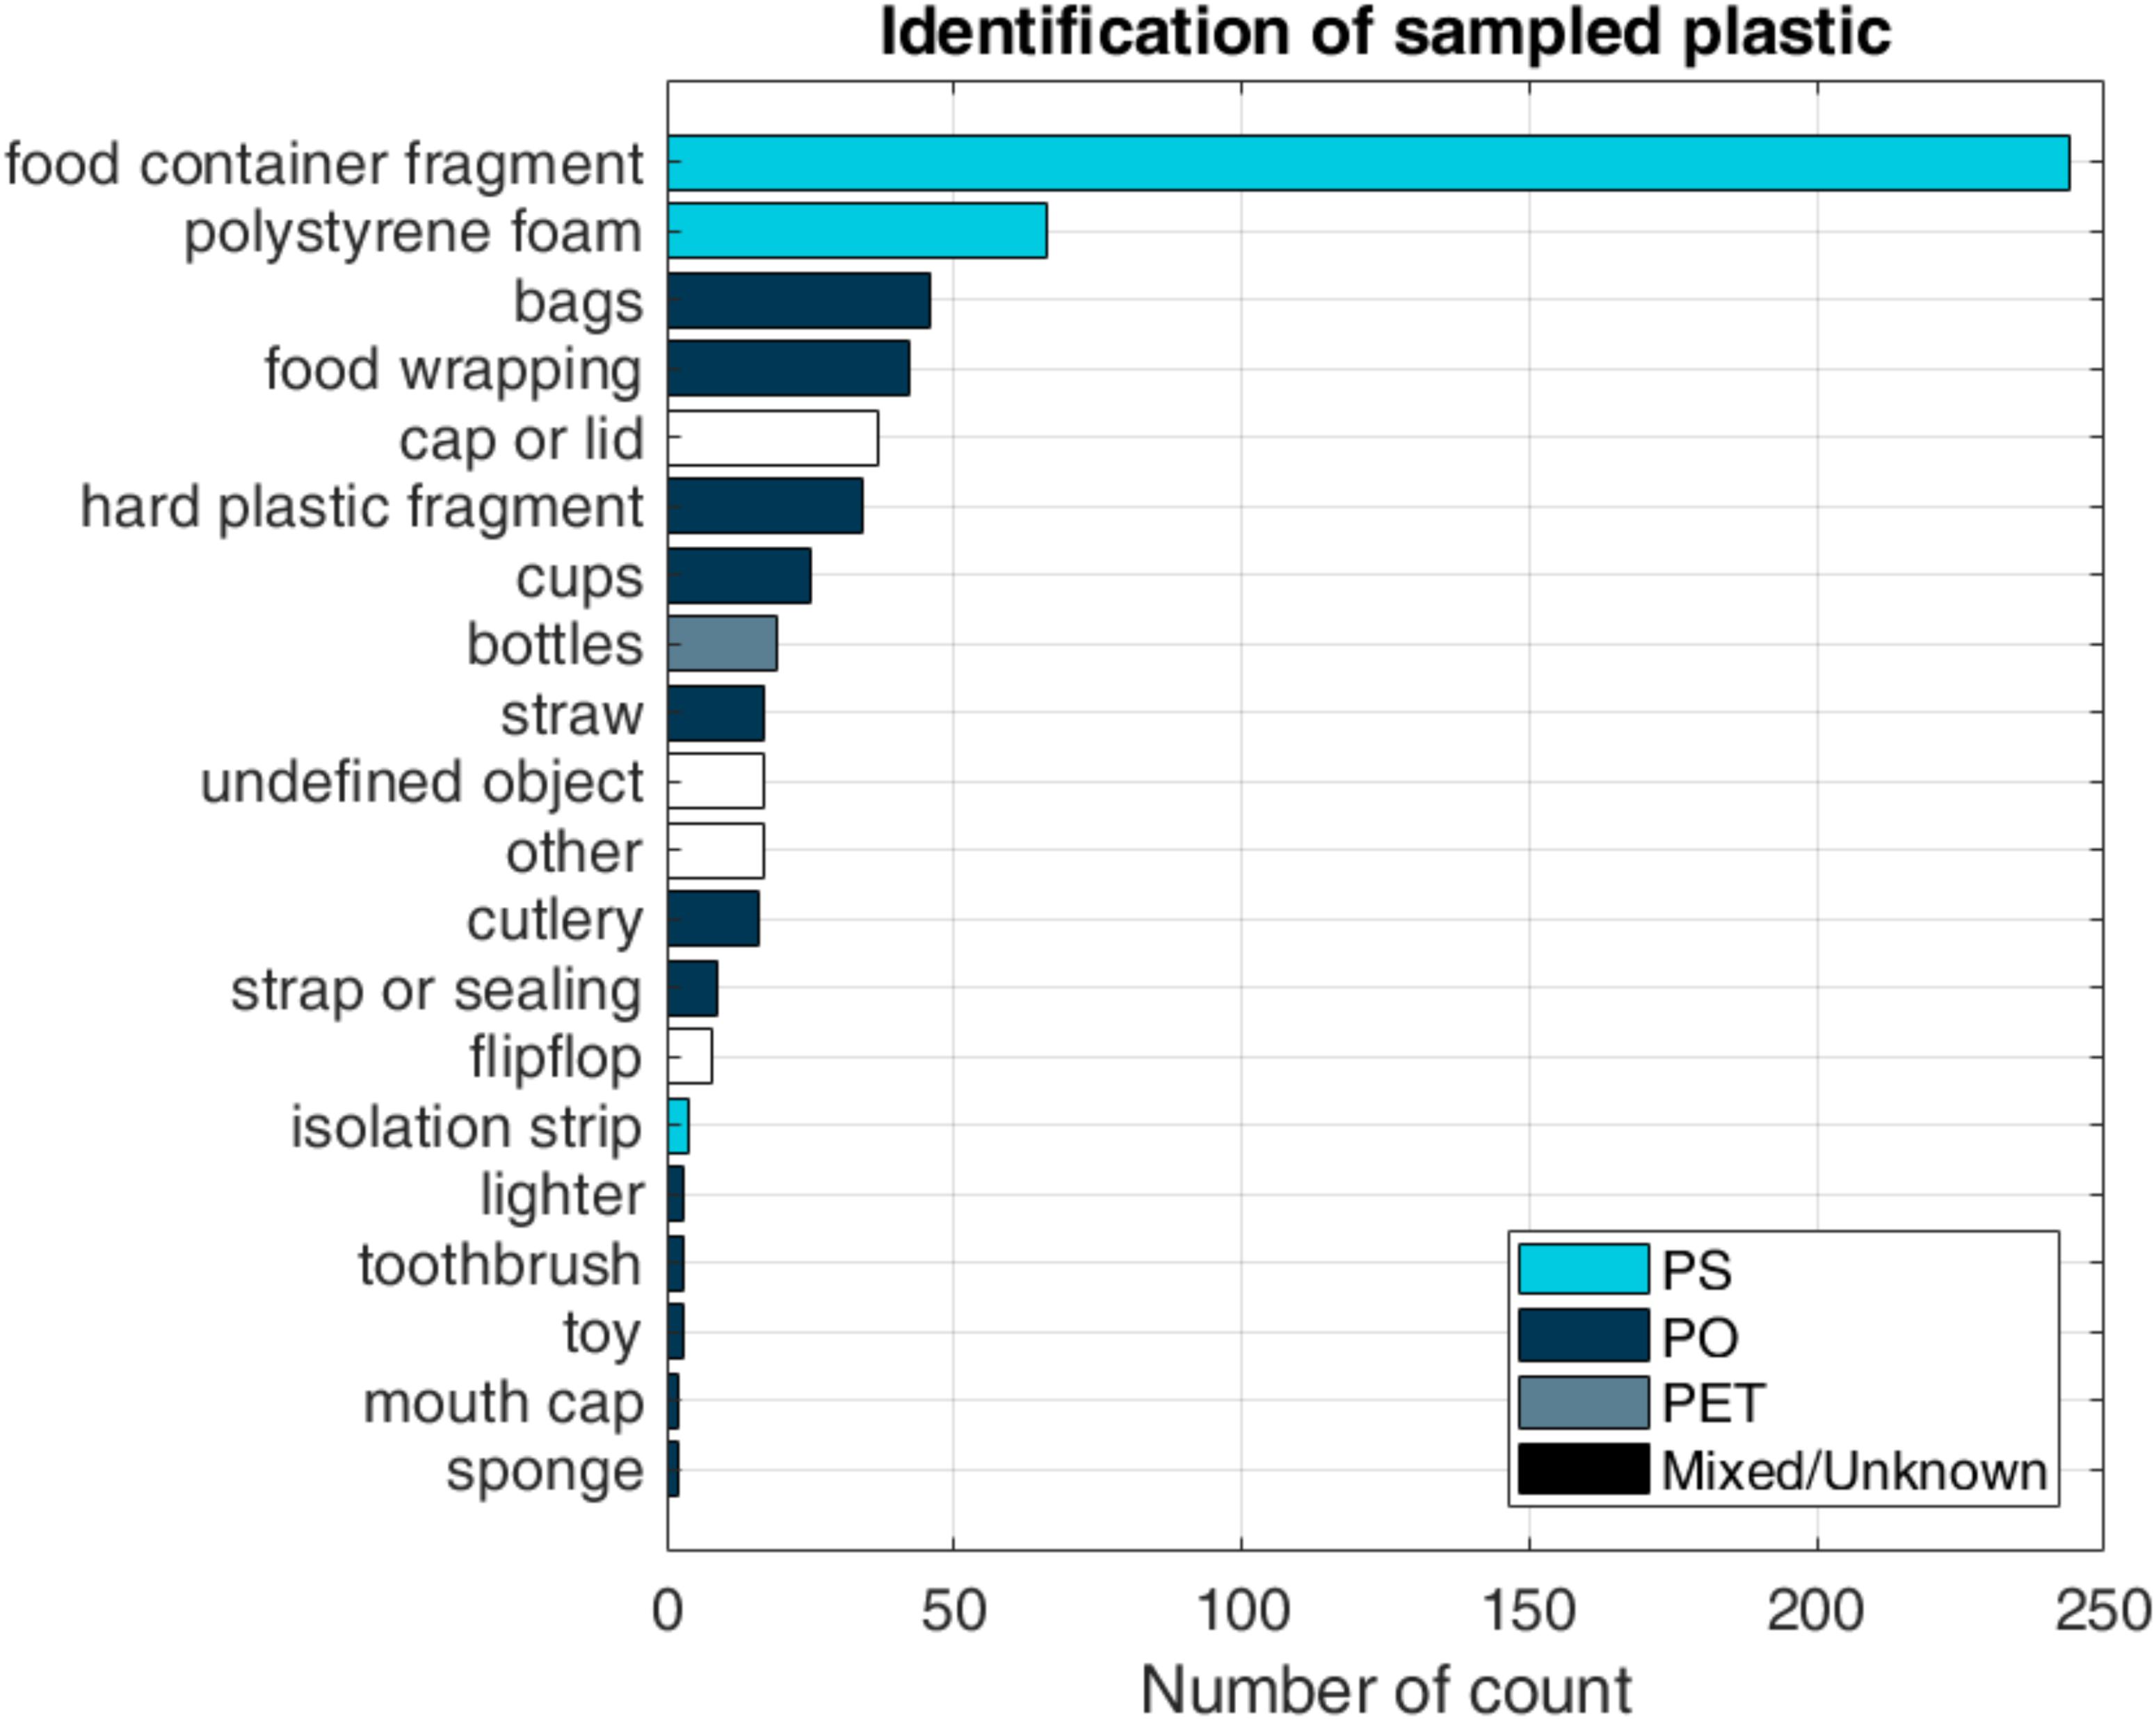
FIGURE 5. Plastic pieces identification of the 614 analyzed plastic pieces, including plastic composition.
Relation With Hydrology
River discharge and total number of plastic pieces are related (Figure 6A). The match between maximum/minimum discharge and plastic flux is consistent for most days, except for 6, 7, and 9 March. Here the direction of the flow does not match, which might be an artifact of the discharge estimation, as discharge is also influenced by an upstream dam and drained rainfall in the basin. Plastic concentration is also related with river discharge (Figure 6B). For higher discharge, the concentration is lower. This suggests that the amount of plastic is relatively constant, and the same plastic mass is distributed over a larger water volume. In turn, a constant plastic mass indicates a limited plastic source, and the same amount of plastic is released into the river every day. An explanation of this relation might be the predominant local plastic input from areas close to the measurement location, rather than upstream riverine plastic input. During tidal slack, when there is no movement in either direction, the concentration of plastic the highest. The modeled plastic flux for the complete measurement period matches the timing and direction of the observed plastic flux, but is generally (Figure 6C) over and underestimating the peaks. When discharge approaches zero, the concentration peaks, and changes direction once the water starts flowing in the other direction. For the days on which the flow direction of the plastic flux and discharge does not match, the model performance is poor. However, on most days the direction and order of magnitude are modeled well. On average, the error between observed and modeled plastic flux was 58% and is largely influenced by the days on which flow direction is not modeled correctly.
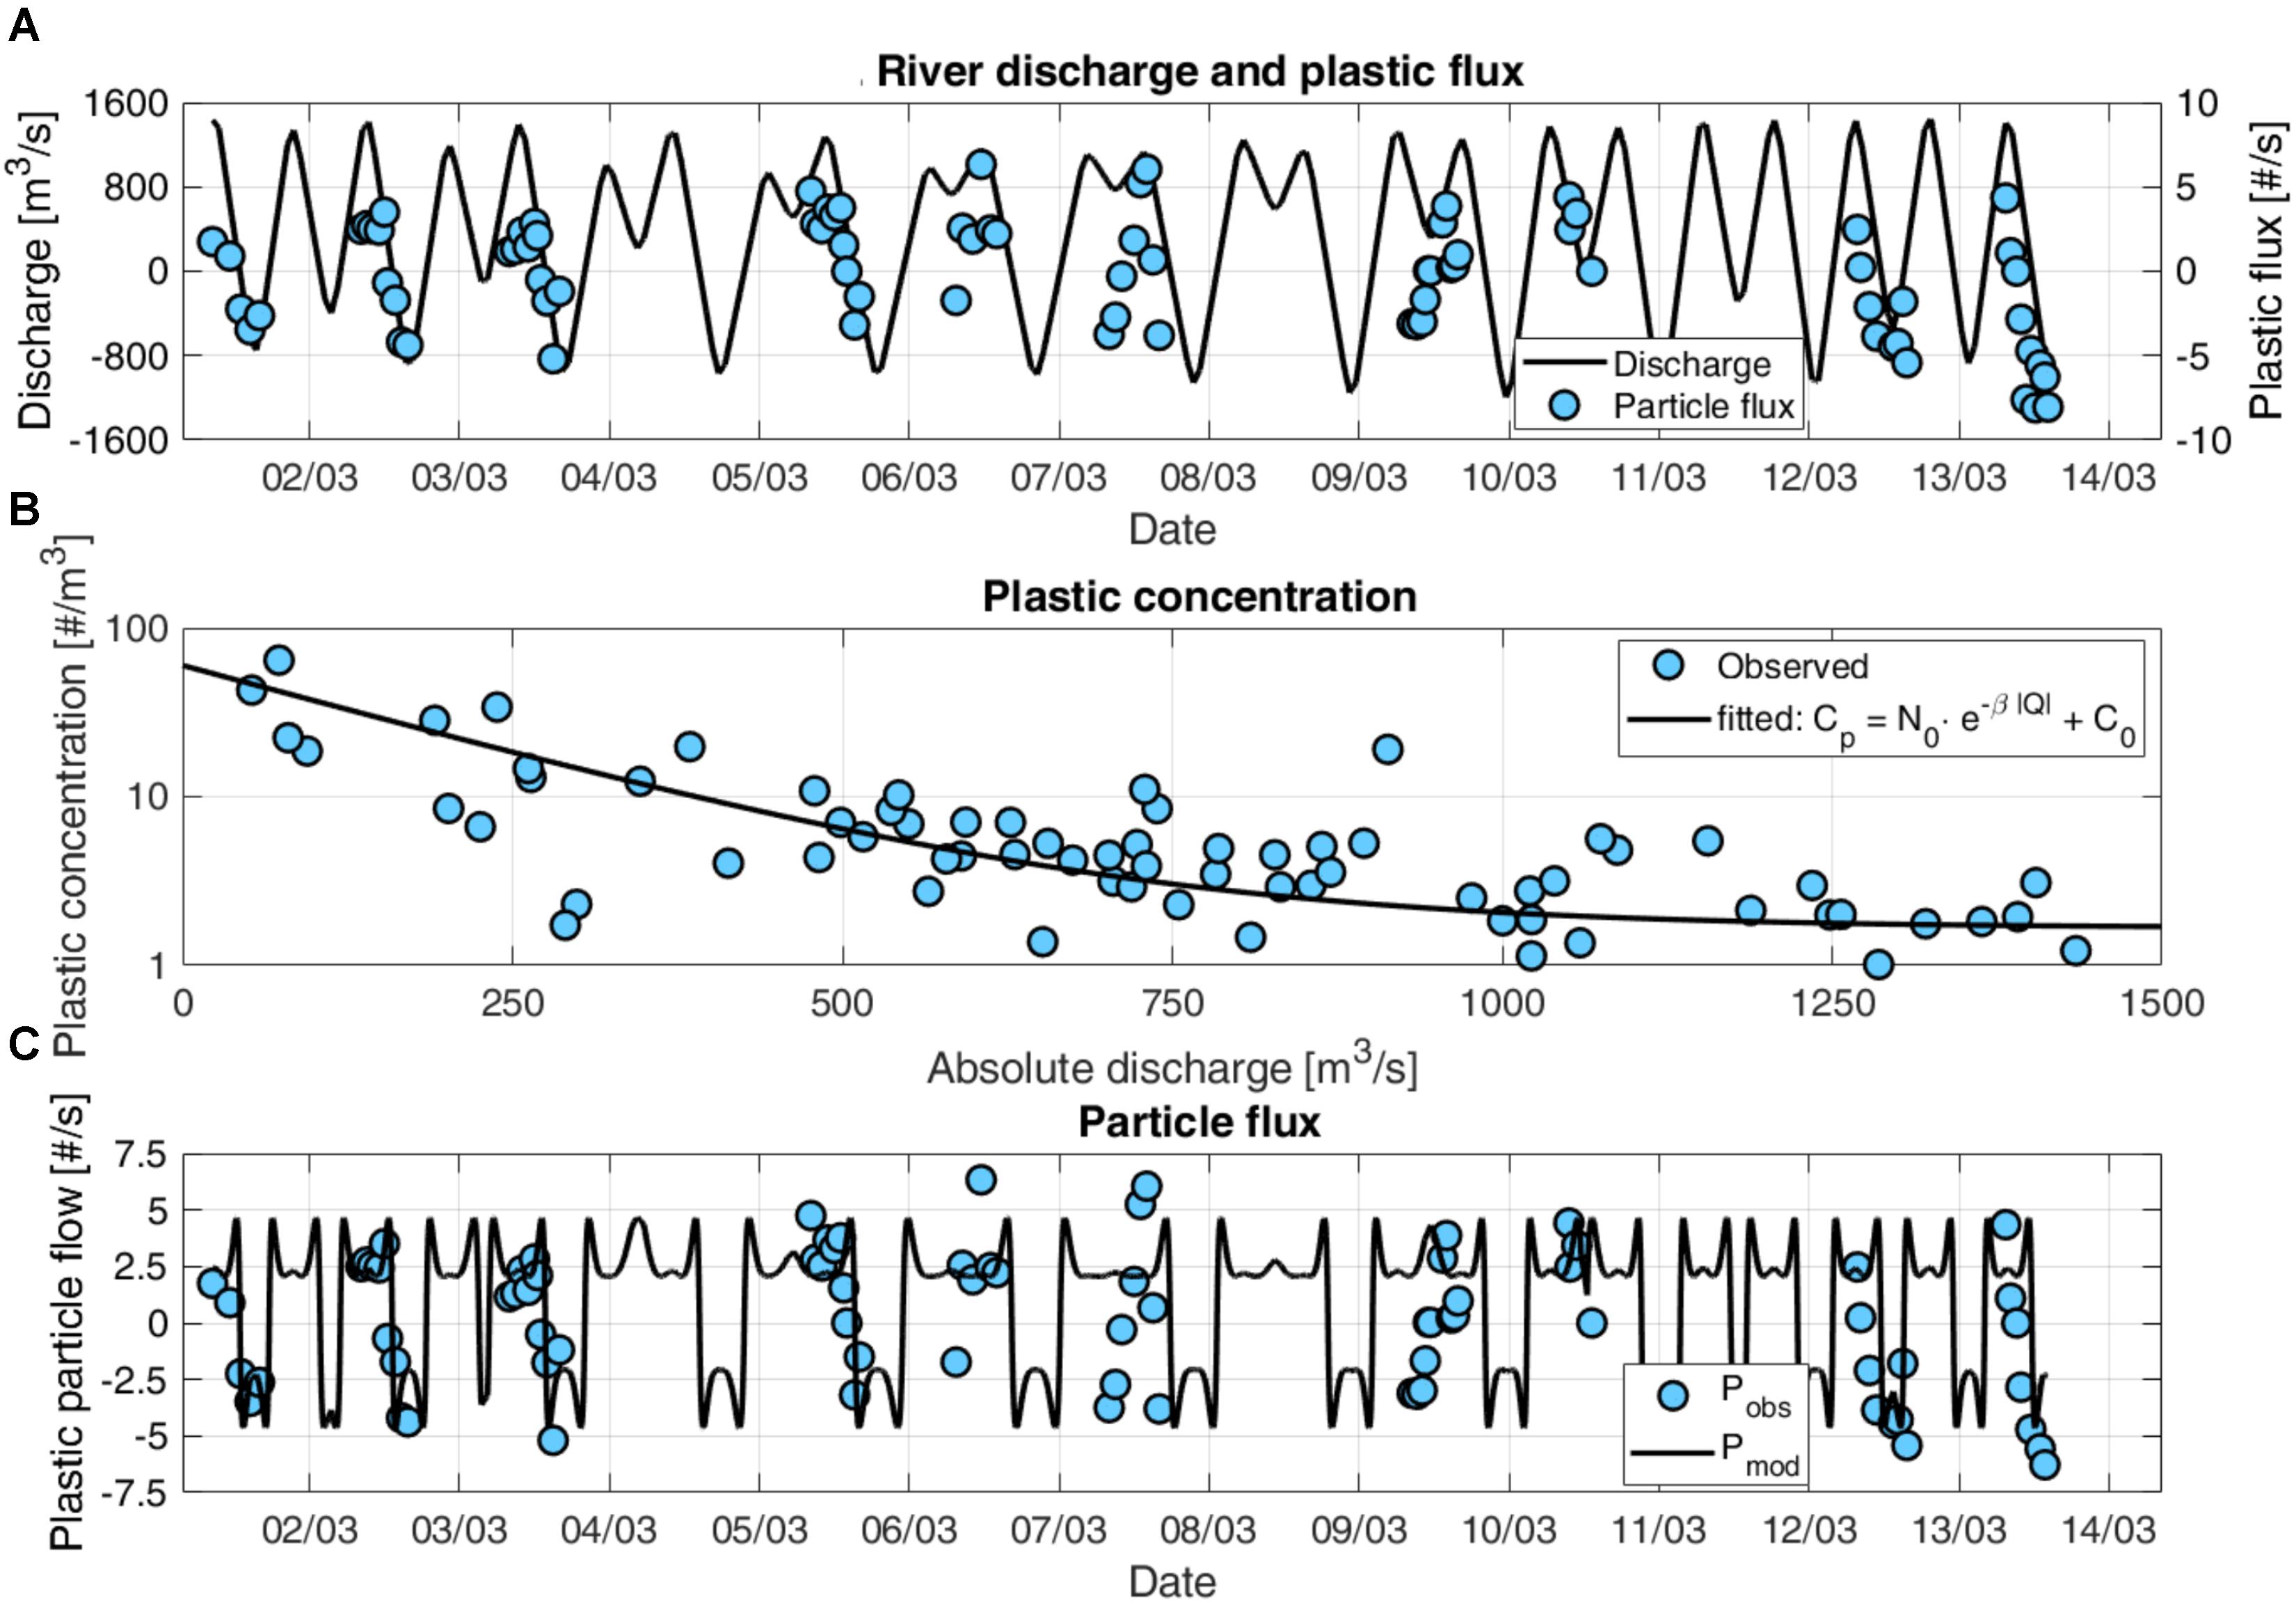
FIGURE 6. (A) Total number of plastic pieces per second, and modeled discharge in the Saigon River, (B) modeled plastic concentration as a function of discharge (N0 = 58, β = 5⋅10−3, and C0 = 1.7) and (C) modeled and measured plastic flux.
Discharge was estimated using a regression-based model based on astronomical tide and discharge data from 2013. It is assumed that a similar accuracy (R2 = 0.88) was obtained for the 2018 discharge estimations. In the Supplementary Figure S6 the results for the discharge estimation for 2018 are discussed. For this study, only discharge data for 2013 was available. Longer discharge time series will allow to test the robustness of the discharge estimations. In the future, two-dimensional hydrodynamic data or model output will give additional insight in the transport mechanisms, and spatiotemporal variation of macroplastics in the Saigon River, which is specifically crucial for complex tidal systems.
Daily, Monthly and Annual Plastic Emission
The dynamics of plastic transport are heavily influenced by the tidal dynamics. During days with high net discharge, plastic emission can be up to twice as large as during days with lower net discharge. The average daily emission was estimated to be 0.2–0.3 tons per day, and 5.6–10.3 tons per month in total for March 2018 (Figure 7). Our March estimates are linearly scaled using the monthly emission estimates from Lebreton et al. (2017), to arrive at an estimation for monthly and annual plastic emission. We estimate the emission from the Saigon River to be 7.5⋅103–13.7⋅103 tons per year, which is 10–20% of the estimated yearly plastic emission of all Vietnamese rivers together (Lebreton et al., 2017). Note that the estimations were made using the range of estimated average mass per plastic pieces (3.2–5.9 g). Around 6 and 20 March the ebb tide plastic flux was significantly lower, which is related to the tidal influence. The highest ebb tide plastic flux was measured during a period of neap tide, resulting in relatively high net discharge. We therefore conclude that in river systems with low net discharge and high tidal influence, plastic emission is strongly governed by tidal dynamics.
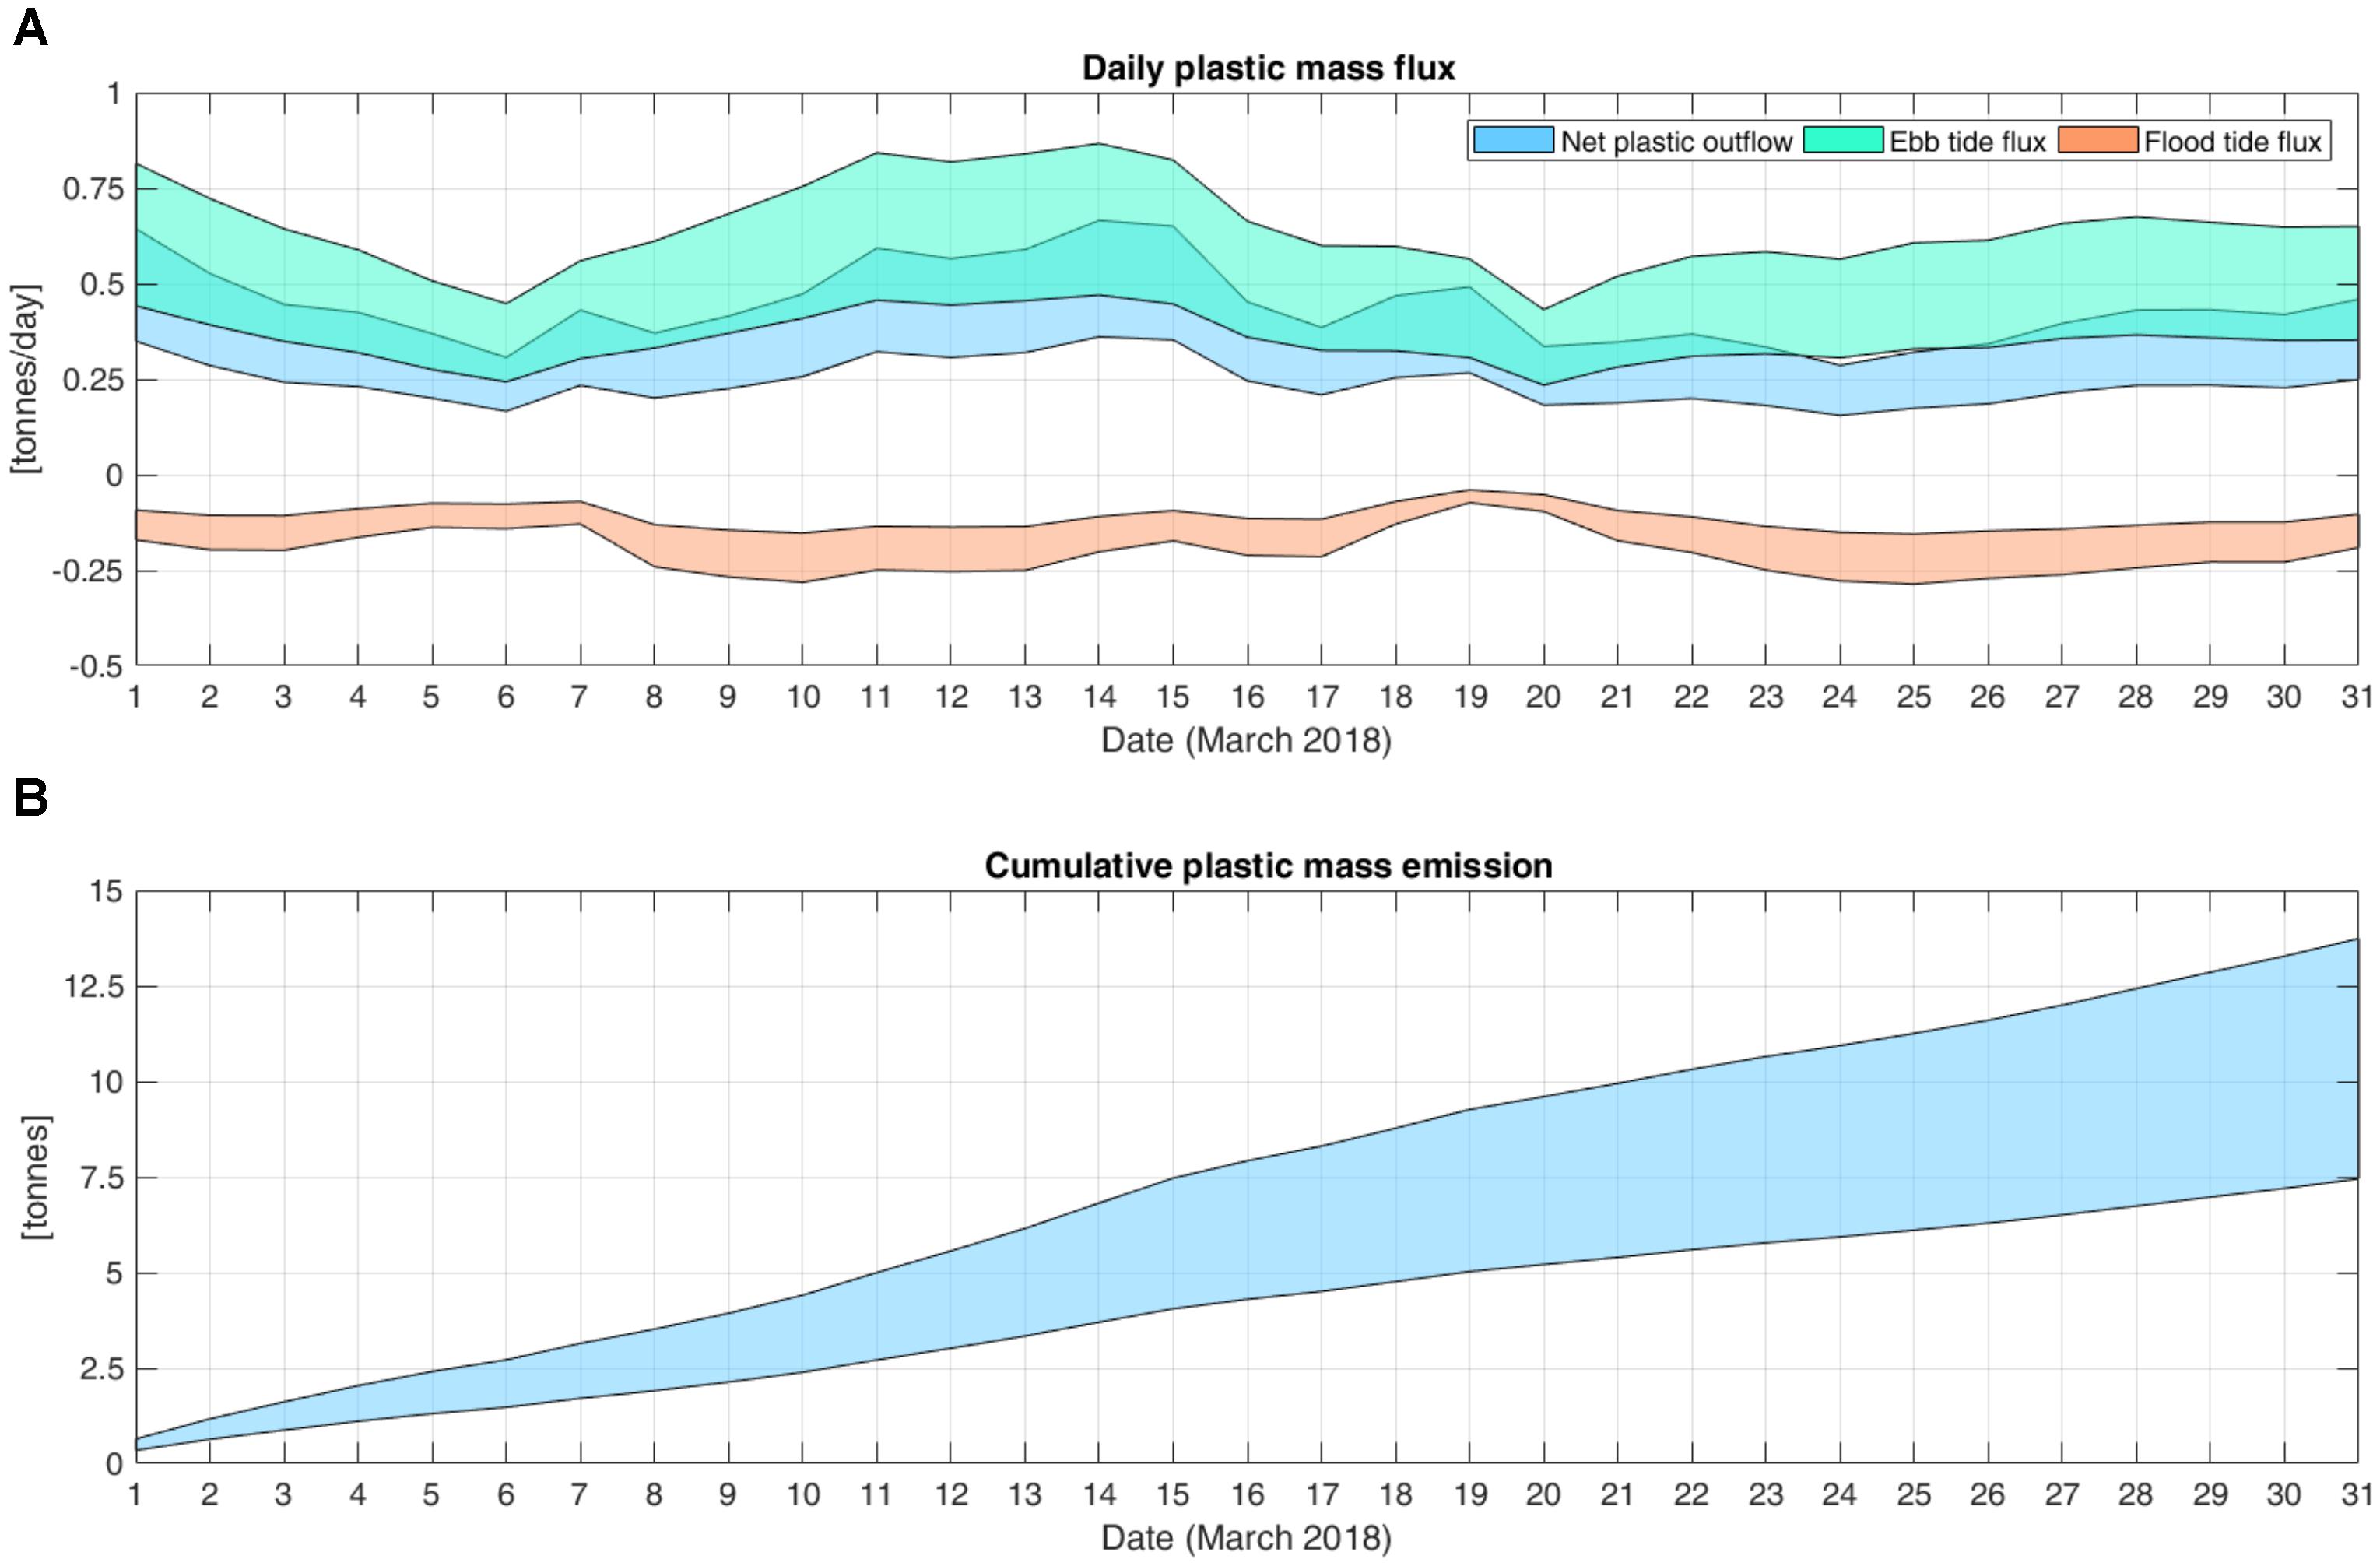
FIGURE 7. (A) Daily plastic flux and (B) cumulative plastic mass flux in the Saigon River for March, 2018. The area represents the upper and lower boundaries based on the estimated range of mass per plastic piece (3.2–5.9 g per piece).
The estimated plastic emissions from the Saigon River for March 2018 are up to 4 times higher (2 times when compared to the lower and upper boundaries) than the estimate by Lebreton et al. (2017) (Table 1). Annually, our estimates are considerably higher than both the model study by Lebreton et al. (2017) and the observations by Lahens et al. (2018). This can be explained by (1) the longer measurement period of our study and therefore obtaining more accurate average plastic flux estimates, as well as (2) a possible underestimation of the global model (Lebreton et al., 2017) due to inaccurate calibration (at global and local scale) or missing physical processes. Note that the model by Lebreton et al. (2017) also includes microplastics, which is not the case for our estimations and those from Lahens et al. (2018). Also, no additional discharge of plastic in areas downstream of Saigon is considered here. This suggests that the total plastic emission of the Saigon River might be even higher than estimated in this study.
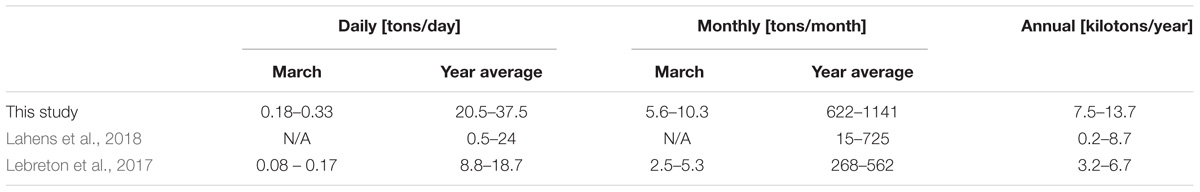
TABLE 1. Comparison of daily, monthly and annual macroplastic emission estimates.
Synthesis
With the proposed new methodology, we present a comprehensive study of macroplastic emission. However, we acknowledge the uncertainty induced through limited available observations. For example, no measurements are available throughout a complete tidal cycle. For systems that experience strong tidal influence, accurate net plastic emission estimates are difficult, emphasizing the importance of accurate hydrological data, such as flow velocity and river discharge. In the first application of our proposed methodology several sources of uncertainty related to specific methods were identified. Despite its uncertainties, this work does present a new holistic approach that hopefully encourages others to (1) start measuring (macro)plastics in other river systems, and (2) develop new measurement techniques for riverine plastic sampling.
The visual counting might suffer from an observer bias. This counting bias is likely to increase during high water velocities, e.g., increased plastic fluxes. The number of counting locations depends heavily on local conditions. In the Saigon River, there is a distinctly higher flux on either side of the river, and the number of observation points might be increased. Homogeneously distributed plastic fluxes over the river width, on the other hand, might require less observation sites. We also observed strong fluctuations of the plastic flux profile on an hourly basis. For other locations, we recommend including measurements with a higher temporal resolution to optimize the measurement frequency. For locations with lower plastic transport, the counting routine should also be adjusted accordingly, e.g., by increasing the counting duration, to obtain representative data. Automated plastic pieces counting, for example by using cameras or drones, are likely to decrease the observation errors. Future developments should also include the use of citizen science for data collection, and collaborative acquisition and sharing of data among research institutes, such as under development in the Riverine and Marine floating litter Monitoring and Modeling of Environmental Loading [RIMMEL, (EC JRC, 2016; González-Fernández and Hanke, 2017)].
The plastic composition obtained from the trawls depends on the location of deployment. Additional measurements with multiple, synchronous trawls might give additional insights in the spatial variation in debris composition and average mass per plastic piece. The chosen mesh size also influences the capability to catch plastic pieces of certain sizes. If smaller plastic pieces are expected, it is recommended to use a net with a smaller mesh size. Mesh size and exact trawl design depend on debris size of the target plastic pollution. Since little is known about the temporal variation in plastic composition, we recommend including sub-hourly trawling measurements to build plastic statistics.
Future efforts will benefit from using more detailed information on the hydrology, especially on the monsoon season. Riverine plastic emission is highly influenced by tidal dynamics. The more accurate the understanding and data of the tidal and discharge dynamics, the better the net transport of plastic into the ocean can be estimated. Future research should also focus on comparing plastic fluxes with tidal constituents. A way forward includes two-dimensional simulations of river flow patterns, to better understand and simulate the spatiotemporal variation of plastic flux. Additional hydrological data would considerably improve the current global and local plastic emission estimates. Because of the strong tidal influence and low net discharge, river discharge could be estimated accurately using astronomical tide predictions. However, for other river systems this might be different, highlighting the importance of high-quality hydrological data.
Future measurements should also focus on characterizing the seasonal variation in macroplastic flux, transport and composition. The relation between macroplastic fluxes and, for example, river discharge and rainfall are still unknown. It is expected that in areas with a strong hydrometeorological division between dry and wet seasons, rainfall at the start of the wet season can cause a “first flush” effect. During early rain events, plastics on land are flushed into the river system, causing a peak load. This hypothesis is yet to be tested in future research. Also, as suggested by González Fernandez et al. (2016), the hysteresis effect (different concentrations for rising and descending phases) of rivers might influence the plastic concentration in rivers and should be assess in more detail. Finally, sampling plastic along the water column will allow a more complete estimation of total plastic emission.
Conclusion
We demonstrate that our step-wise methodology allows for a robust and adaptable assessment of riverine plastic emission into the oceans. For each step different alternatives can be chosen, depending on the research questions and local conditions.
For estuarine rivers, plastic emissions are highly dependent on tidal dynamics. During ingoing tide, plastic can enter the river from the sea. Thus, the highest emissions of plastic occur during periods of high outgoing tide.
Fluxes of macroplastic are likely highest in the outer curves of the river, depending on the flow direction. Future work will shed additional light on the relation between plastic flux concentration and hydrometeorological variables. Most plastic pieces were identified as POs (76%) and only very few as PET (4%). Most of the categorized plastic items are related to consumables. Additional work should explore relations between plastic composition, plastic consumption and management, river discharge and rainfall.
The macroplastic emission from the Saigon River is estimated to be 5.6 – 10.3 tons for March 2018, or 7.5⋅103–13.7⋅103 tons per year, which is up to 4 times higher than the most recent estimate. This illustrates the need for additional observations of plastic flux in the Saigon River and beyond.
Future work should also include measurements along the river length and depth. Especially in meandering rivers with strong tidal influences and frequent shipping activities, not all plastics might reach the ocean. Quantifying the decay rate of macroplastic flux through deposition and fragmentation would therefore significantly improve the global riverine plastic emission estimates.
Data Availability
All data used in this study are available upon request.
Author Contributions
TvE, ML, and KvO designed the study. TvE, T-CK-L, ML, and KvO collected the data. TvE, ML, T-CK-L, ES, and KvO analyzed the data. TvE prepared the initial draft. All authors wrote the final manuscript.
Funding
The authors are grateful to the donors of The Ocean Cleanup for funding this research.
Conflict of Interest Statement
TvE, ML, KvO, ME, LL, AS, and BS are employed by The Ocean Cleanup. LL is employed by The Modeling House.
The remaining authors declare that the research was conducted in the absence of any commercial or financial relationships that could be construed as a potential conflict of interest.
Acknowledgments
We thank the Center for Water Management and Climate Change of the Vietnam National University (WCC) for discharge data, Robin de Vries (The Ocean Cleanup) for providing the maps, Nguyen Nhat Quang, Van Phi Hung, Nguyen Thanh Tai, Tran Hau, Tran Quoc Viet, and Ngo Van Chinh for their assistance and hard work during the fieldwork campaign, Nguyen Thanh Luan for his hard work in the field and the lab analysis, Emma Aalbers (Royal Netherlands Meteorological Institute) for the suggestions on discharge modeling, and Tran Ngoc Khanh An (The Ocean Cleanup) for her dedication and facilitation of the fieldwork. We also thank the three reviewers for their constructive feedback, which significantly improved the quality of the paper.
Supplementary Material
The Supplementary Material for this article can be found online at: https://www.frontiersin.org/articles/10.3389/fmars.2018.00372/full#supplementary-material
Footnotes
References
Browne, M. A., Galloway, T. S., and Thompson, R. C. (2010). Spatial patterns of plastic debris along estuarine shorelines. Environ. Sci. Technol. 44, 3404–3409. doi: 10.1021/es903784e
Cózar, A., Sanz-Martín, M., Martí, E., González-Gordillo, J. I., Ubeda, B., and Gálvezet, J. Á. (2015). Plastic accumulation in the Mediterranean Sea. PLoS One 4:e0121762. doi: 10.1371/journal.pone.0121762
Dris, R., Gasperi, J., Rocher, V., and Tassin, B. (2018). Synthetic and non-synthetic anthropogenic fibers in a river under the impact of Paris Megacity: sampling methodological aspects and flux estimations. Sci. Total Environ. 618, 157–164. doi: 10.1016/j.scitotenv.2017.11.009
Dris, R., Imhof, H., Sanchez, W., Gasperi, J., Galgani, F., Tassin, B., et al. (2015). Beyond the ocean: contamination of freshwater ecosystems with (micro-) plastic particles. Environ. Chem. 12, 539–550.
EC JRC (2016). European Commission, Joint Research Center. Exploratory Research Project: RIMMEL (RIverine and Marine Floating Macro Litter Monitoring and Modeling of Environmental Loading). Available at: http://mcc.jrc.ec.europa.eu/dev.py?N=simple&O=380&titre_page=RIMMEL&titre_chap=JRC%20Projects [accessed May 08, 2018].
Eerkes-Medrano, D., Thompson, R. C., and Aldridge, D. C. (2015). Microplastics in freshwater systems: a review of the emerging threats, identification of knowledge gaps and prioritisation of research needs. Water Res. 75, 63–82. doi: 10.1016/j.watres.2015.02.012
Faure, F., Demars, C., Wieser, O., and de Alencastro, L. F. (2015). Plastic pollution in Swiss surface waters: nature and concentrations, interaction with pollutants. Environ. Chem. 12, 582–591.
Gasperi, J., Dris, R., Bonin, T., Rocher, V., and Tassin, B. (2014). Assessment of floating plastic debris in surface water along the Seine River. Environ. Pollut. 195, 163–166. doi: 10.1016/j.envpol.2014.09.001
González Fernandez, D., Hanke, G., Tweehuysen, G., Bellert, B., Holzhauer, M., Palatinus, A., et al. (2016). Riverine Litter Monitoring – Options and Recommendations. Luxembourg: Publications Office of the European Union. doi: 10.2788/461233
González-Fernández, D., and Hanke, G. (2017). Toward a harmonized approach for monitoring of riverine floating macro litter inputs to the marine environment. Front. Mar. Sci. 4:86.
Hoornweg, D., and Bhada-Tata, P. (2012). What a Waste : A Global Review of Solid Waste Management. Urban Development Series; Knowledge Papers No. 15. Washington, DC: World Bank. Available at: https://openknowledge.worldbank.org/handle/10986/17388
Jambeck, J. R., Andrady, A., Geyer, R., Narayan, R., Perryman, M., Siegler, T., et al. (2015). Plastic waste inputs from land into the ocean. Science 347, 768–771. doi: 10.1126/science.1260352
Koelmans, A. A., Besseling, E., Foekema, E., Kooi, M., Mintenig, S., Ossendorp, B. C., et al. (2017). Risks of plastic debris: unravelling fact, opinion, perception, and belief. Environ. Sci. Technol. 51, 11513–11519. doi: 10.1021/acs.est.7b02219
Lahens, L., Strady, E., Kieu-Le, T. C., Dris, R., Boukerma, K., Rinnert, E., et al. (2018). Macroplastic and microplastic contamination assessment of a tropical river (Saigon River, Vietnam) transversed by a developing megacity. Environ. Pollut. 236, 661–671. doi: 10.1016/j.envpol.2018.02.005
Lebreton, L., Slat, B., Ferrari, F., Sainte-Rose, B., Aitken, J., Marthouse, R., et al. (2018). Evidence that the Great Pacific Garbage Patch is rapidly accumulating plastic. Sci. Rep. 8:4666. doi: 10.1038/s41598-018-22939-w
Lebreton, L., van der Zwet, J., Damsteeg, J. W., Slat, B., Andrady, A., and Reisser, J. (2017). River plastic emissions to the world’s oceans. Nat. Commun. 8:15611. doi: 10.1038/ncomms15611
Lechner, A., Keckeis, H., Lumesberger-Loisl, F., Zens, B., Krusch, R., Tritthart, M., et al. (2014). The Danube so colourful: a potpourri of plastic litter outnumbers fish larvae in Europe’s second largest river. Environ. Pollut. 188, 177–181. doi: 10.1016/j.envpol.2014.02.006
Moore, C. J., Lattin, G. L., and Zellers, A. F. (2011). Quantity and type of plastic debris flowing from two urban rivers to coastal waters and beaches of Southern California. Revista de Gestão Costeira Integrada-Journal of Integrated Coastal Zone Management 11, 65–73.
Morritt, D., Stefanoudis, P. V., Pearce, D., Crimmen, O. A., and Clark, P. F. (2014). Plastic in the Thames: a river runs through it. Mar. Pollut. Bull. 78, 196–200. doi: 10.1016/j.marpolbul.2013.10.035
Schmidt, C., Krauth, T., and Wagner, S. (2017). Export of plastic debris by rivers into the sea. Environ. Sci. Technol. 51, 12246–12253.
Schmidt, C., Krauth, T., and Wagner, S. (2018). Correction to export of plastic debris by rivers into the sea. Environ. Sci. Technol. 52:927. doi: 10.1021/acs.est.7b06377
Keywords: plastic, pollution, hydrology, rivers, macroplastic, Vietnam, Saigon River
Citation: van Emmerik T, Kieu-Le T-C, Loozen M, van Oeveren K, Strady E, Bui X-T, Egger M, Gasperi J, Lebreton L, Nguyen P-D, Schwarz A, Slat B and Tassin B (2018) A Methodology to Characterize Riverine Macroplastic Emission Into the Ocean. Front. Mar. Sci. 5:372. doi: 10.3389/fmars.2018.00372
Received: 25 June 2018; Accepted: 25 September 2018;
Published: 17 October 2018.
Edited by:
Mario Barletta, Universidade Federal de Pernambuco (UFPE), BrazilReviewed by:
Jongmyoung Lee, Our Sea of East Asia Network (OSEAN), South KoreaDaniel González-Fernández, University of Cádiz, Spain
Tommaso Giarrizzo, Federal University of Pará, Brazil
Copyright © 2018 van Emmerik, Kieu-Le, Loozen, van Oeveren, Strady, Bui, Egger, Gasperi, Lebreton, Nguyen, Schwarz, Slat and Tassin. This is an open-access article distributed under the terms of the Creative Commons Attribution License (CC BY). The use, distribution or reproduction in other forums is permitted, provided the original author(s) and the copyright owner(s) are credited and that the original publication in this journal is cited, in accordance with accepted academic practice. No use, distribution or reproduction is permitted which does not comply with these terms.
*Correspondence: Tim van Emmerik, dGltLnZhbmVtbWVyaWtAdGhlb2NlYW5jbGVhbnVwLmNvbQ==