 Filipe R. Ceia
 Yves Cherel
 Vitor H. Paiva
 Jaime A. Ramos
- 1Marine and Environmental Sciences Centre, Department of Life Sciences, Universidade de Coimbra, Coimbra, Portugal
- 2Centre d’Etudes Biologiques de Chizé (CEBC), UMR 7372 du CNRS, Université de La Rochelle, Villiers-en-Bois, France
Intrinsic markers, such as stable isotopes, are a powerful approach to trace wildlife movements because they do not require initial marking of the organism. The main limitation of the isotopic method is the lack of knowledge in spatio-temporal patterns and dynamics of stable isotopes in marine environments, especially at local scales. Here, we combine GPS-tracks and isotopic signatures from Cory’s shearwaters as a model species to define isoscapes in the North Atlantic, and assess δ13C and δ15N dynamics, from local to regional spatial scales. Tracking data and blood samples were collected seasonally (during pre-laying and chick-rearing periods) across 6 years (2010–2015) from a total of 191 birds breeding at both neritic and oceanic environments. Tracked birds encompassed a large latitudinal and longitudinal area of the mid-North Atlantic, from the Eastern to Central North Atlantic. Overall, the δ13C and δ15N values of birds’ plasma over the region ranged from -20.2 to -16.2‰, and from 10.8 to 15.5‰, respectively. As expected, strong biogeographic isotopic patterns were found in δ13C values at a regional scale, mostly driven by an inshore/offshore gradient and chlorophyll a concentration. Although a moderate expression of spatial isotopic gradients on δ15N values (i.e., latitudinal and inshore/offshore) in the whole region, these were primarily influenced by temporal drivers (i.e., annual variability). At a local scale (i.e., in a radius of 100 km around the colony, within the neritic environment), both δ13C and δ15N values were very influenced by temporal drivers, suggesting that wide-ranging top consumers are hard to trace locally. This study shows that the δ13C values of marine top consumers are good indicators of the foraging habitat at a regional scale in the mid-North Atlantic, especially in terms of inshore/offshore gradients and areas of higher productivity.
Introduction
Intrinsic markers, such as stable isotopes, are increasingly used to study spatial ecology of individuals and wildlife movements (Bowen, 2010; Ceriani et al., 2014; Quillfeldt et al., 2015). Potentially, the initial marking of the individual is not necessary, reducing both sampling effort and associated costs, and increasing the number of individuals that can be processed (Hobson et al., 2010; Ramos and González-Solís, 2012). This technique can provide intrinsic tags to study the foraging, migratory and trophic ecology of elusive species, such as marine upper trophic level consumers (e.g., seabirds), but also to track the movements of marine lower trophic level species (e.g., fish), and their juvenile stages, that are not amenable to current electronic tagging devices (Graham et al., 2010; MacKenzie et al., 2011; Magozzi et al., 2017).
A prerequisite for animal isotopic tracking is the identification of isotopic geographic gradients, i.e., isoscapes (Jaeger et al., 2010). Stable isotope markers rely on the principle that individual consumers acquire the isotopic composition of their prey. Since isotopic patterns in food-webs will differ spatially, information on residency and movement patterns of species and populations can be gained by measuring isotopic values in consumer tissues (Hobson, 1999). For instance, in marine systems, stable isotopes of carbon (13C/12C, δ13C) and nitrogen (15N/14N, δ15N), both at the base of the food web and at the consumer level, typically vary with spatial and physical oceanic features, such as the latitude and the proximity to neritic or benthic habitats (Cherel and Hobson, 2007; Graham et al., 2010). There is a natural variation in both δ13C and δ15N values of consumers inhabiting different ecosystems (Navarro et al., 2013) related to spatio-temporal variations at the base of food chains that are, in turn, linked to environmental variables such as depth or temperature (MacKenzie et al., 2011, 2014; Chouvelon et al., 2012). In addition to the typical and strong spatial influence overall, isotopic values are often influenced by environmental and temporal drivers (Laakmann and Auel, 2010; Quillfeldt et al., 2015; Oczkowski et al., 2016). However, in some instances no major biogeographic gradients and temporal variations were found at a consumer level in regional areas of fairly homogeneous isotopic values (Roscales et al., 2011; Ceia et al., 2015b).
In the Atlantic Ocean, gradients of δ13C and δ15N based on plankton values were described at a large spatial scale (Graham et al., 2010). However, the spatial resolution of such maps is of 1000s of kilometers, therefore disregarding the highly variable local and regional spatio-temporal stability of the isoscapes (Ramos and González-Solís, 2012). More recently, Magozzi et al. (2017) developed a model that predicts the spatio-temporal distributions of the carbon isotope composition of phytoplankton across the global ocean at one degree and monthly resolution, highlighting the importance of this issue in global oceanic dynamics. There is also some information regarding the dynamics of stable isotopes only for specific marine environments in the North Atlantic, for the Bay of Biscay (Chouvelon et al., 2012), the North Sea (MacKenzie et al., 2014), the Gulf of Maine (Oczkowski et al., 2016), the Northwest Atlantic (Ceriani et al., 2014), and the oligotrophic North Atlantic waters (Montoya et al., 2002). However, local and regional maps of marine isoscapes in the Atlantic Ocean for high-trophic level organisms such as seabirds are still scarce and mainly limited to the Southern Atlantic (e.g., Jaeger et al., 2010; Quillfeldt et al., 2010, 2015; Ceia et al., 2015b). Marine isoscapes can be a powerful tool to study migrations, wildlife movements and trophic interactions in the region of the North Atlantic (Roscales et al., 2011; Ceriani et al., 2014), but to our knowledge no detailed reference maps are available nor studies focusing in the stable isotope dynamics of high-trophic level organisms at both local (i.e., dozens of km) and regional (i.e., hundreds of km) scales, comprising both oceanic and neritic waters. There is a great deal of interest in the development of marine isoscapes, assessment of their spatio-temporal variability and determination of their potential drivers (Cherel et al., 2008), especially in core foraging areas for top consumers, such as large marine regions worldwide. Once validated, isoscapes can be applied to assist the tracking of many species, focusing both on conservation (e.g., biodiversity hotspots) and commercial (e.g., fish stocks) interests. Although isoscapes cannot reach the fine-spatial scale details obtained with animal tracking using electronic devices, they may be more suitable for investigating animal origins and to answer population-level questions (e.g., population trends, stock discrimination) than tagging technologies or even genetic markers (Graham et al., 2010). Moreover, there is a clear need to develop indicators to follow marine ecosystems’ evolution in space and time (Chouvelon et al., 2012; Magozzi et al., 2017), and this knowledge is essential to understand the function and connectivity of the ocean.
We have selected a set of 15 potential drivers, including spatial (e.g., latitudinal, longitudinal or abrupt changes due to oceanic features), environmental (e.g., chlorophyll a concentration, sea surface temperature) and temporal (e.g., the North Atlantic oscillation – NAO – index, year, season) predictors, to assess spatio-temporal dynamics in stable isotope values. We expect to observe trends in δ13C and δ15N values measured in a top consumer with an unprecedented detail in the region of the North Atlantic by testing the existence of isotopic gradients within the studied area related with any of the selected potential drivers. The main objectives of this study are to: (1) illustrate marine isoscapes (δ13C and δ15N) for Cory’s shearwaters Calonectris borealis in both oceanic and neritic environments for the central and eastern North Atlantic during the study period, and (2) assess the most important drivers promoting stable isotopes dynamics from local (<100 km) to regional (hundreds of km) spatial scales. We expect relationships between δ13C and δ15N values with spatial drivers (especially at a regional scale), such as latitude or distance to coast, and thus mostly influenced by the habitat type (i.e., these relationships are expected to be more pronounced for δ13C values). δ15N values should be more influenced by dynamic environmental and/or temporal drivers due to potential variation in the diet of consumers across years, since δ15N values are more influenced by prey type (i.e., trophic level) than δ13C values.
Materials and Methods
With the purpose of characterizing and defining the δ13C and δ15N values for top consumers in the North Atlantic in both neritic and oceanic environments, we analyzed a 6 years data set using a strictly marine and wide-distributed species within the target region, the Cory’s shearwater Calonectris borealis (Magalhães et al., 2008; Ceia et al., 2014, 2015a). Following Jaeger et al. (2010), we intend to link isotopic information to specific geographic areas (by using electronic devices to track the movements of the individuals during approximately 2 weeks and analyzing the stable isotopes of the appropriate tissue, i.e., plasma due to its high turnover rate), and reveal biogeographic isotopic patterns in the North Atlantic, with records from both oceanic and neritic environments. This allowed to model extensive reference maps of the isotopic landscape in the North Atlantic, and investigating any temporal changes (i.e., annual and seasonal fluctuations) of biogeographic stable isotopes values.
Study Area and Sampling Sites
Fieldwork was carried out on Cory’s shearwaters breeding in two colonies (Berlenga and Corvo Islands, Portugal), distanced by ca. 1850 km and located in distinct environments of the North Atlantic (Figure 1). Berlenga (39°24′N, 009°30′W) is a small neritic island of ca. 78.8 ha, about 11 km off the western Portugal coast, and Corvo (39°40′N, 031°06′W) is an oceanic island located in the North Atlantic in-between continental Europe (about 1850 km from western Portugal) and continental America (about 2500 km from eastern Canada). Berlenga Island is situated within the large Portuguese continental shelf system characterized by shallow waters (<200 m) and high marine productivity due to the coastal upwelling that lasts from April to September (Sousa et al., 2008). Corvo is the smallest out of nine islands of the Azores archipelago (ca. 17 km2), which are aggregated into three groups (western, central and eastern) straddling the mid-Atlantic ridge over a distance of about 600 km. The islands of the Azores have relatively narrow peri-insular shelves and are surrounded by deep, oceanic waters (>200 m).
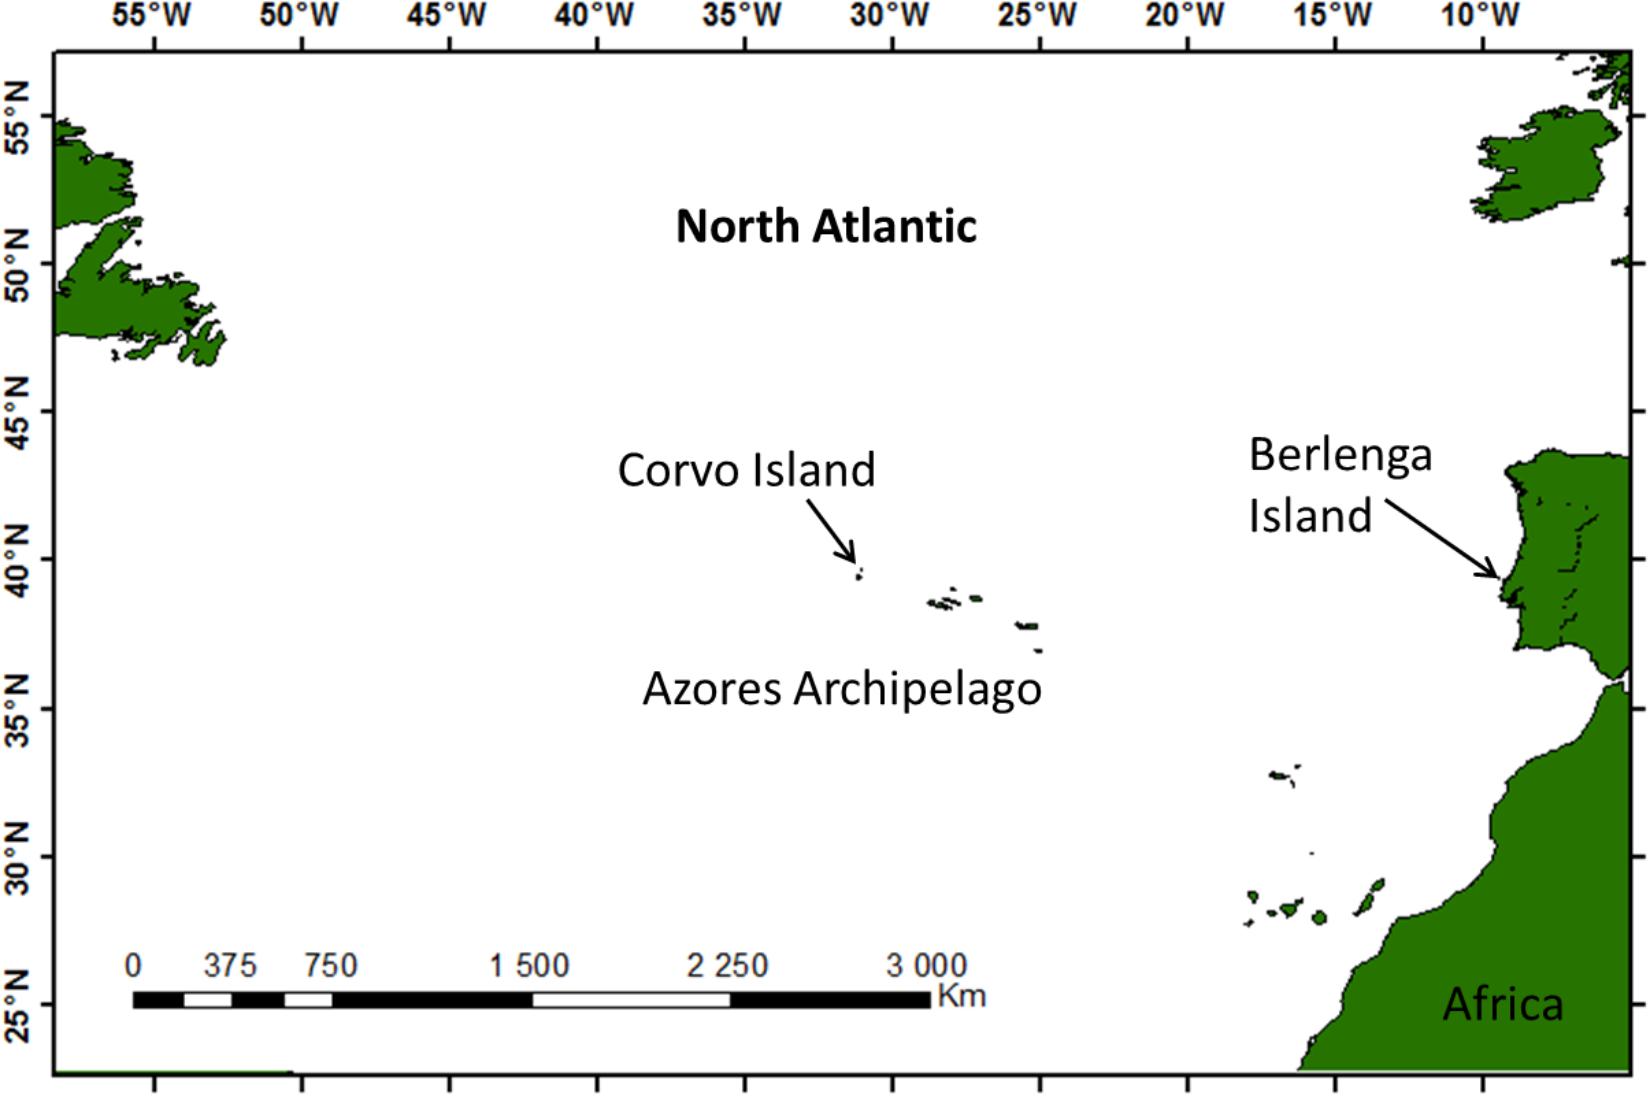
FIGURE 1. Map of the North Atlantic showing the location of Berlenga and Corvo islands.
This study was carried out in accordance with the recommendations of the ICNF – Institute for Nature Conservation in Portugal who also approved the study protocol. The regional permits required to develop this study at Corvo Island were obtained by the ‘Direção Regional do Ambiente - Azores Regional Government.’
Field Procedures
Between 2010 and 2015, a total of 191 birds were sampled in Berlenga and Corvo Islands. This study was conducted on Berlenga Island, each pre-laying (April–May) and chick-rearing (August–September) periods between 2010 and 2015, and on Corvo Island during the chick-rearing (August) period in 2010 and 2015. Two birds were also sampled during the early 2014 incubation period (June) in Berlenga Island.
Each bird was fitted with a GPS logger (IgotU GT-120; Mobile Action Technology Inc., Taiwan), which weighted 15 g after removing the plastic case. The GPS device plus the tape to make it waterproof summed up to 17 g deployed on each bird. This corresponded to 1.6–2.7% of individuals’ body mass (620–1060 g), which is below the recommended 3% threshold reported to have no deleterious effects on seabirds during short-term deployments (Phillips et al., 2003), including Cory’s shearwaters (Igual et al., 2005). Each GPS logger was attached to feathers in the mantle region with Tesa® tape, and set to record bird’s GPS coordinate (median error of <10 m) every 5 min.
Birds were ringed, and body mass was measured both at capture and recapture (to the nearest 10 g). Blood samples (about 0.5 ml from the tarsal vein) were collected from each bird on recapture using 1 ml syringes, and within 2–3 h separated into plasma and blood cells using a centrifuge (15 min at 2,910 g) and then stored frozen (-20°C) until preparation for stable isotope analyses. Deployment or retrieval of devices and collection of blood samples took 10–15 min, and birds were returned immediately to their nest.
Stable Isotope Analysis (SIA)
For each bird, δ13C and δ15N values were measured in the blood plasma fraction collected during recapture. The complete turnover rate of plasma in birds is high (ca. 20 days), with a half-life of components of around 3 days (Hobson and Clark, 1993). During this study, only birds with more than 3 days tracking record were used (n = 191) both in Berlenga (n = 142) and Corvo (n = 49) Islands. All birds were tracked continuously from 3.6 to 20.5 days (mean ± SD: 11.4 ± 3.9 days). Hence, the isotopic signature of plasma on recapture was largely representative of diet and feeding locations during the trips in which each bird was tracked (Jaeger et al., 2010).
Because high lipid concentrations in plasma can result in depleted 13C values, lipids were removed using successive rinses in a 2:1 chloroform–methanol solution (Cherel et al., 2005b). We did not control for possible changes in plasma δ15N values after lipid extraction; however, lipid extraction generally does not affect plasma δ15N values (Cherel et al., 2005b), although some studies reported slight differences (both increased and decreased values) after lipid removal in whole blood (Bearhop et al., 2000; Cherel et al., 2005a). The mean ± SD C:N mass ratios of the delipidated plasma was 3.5 ± 0.1. Carbon and nitrogen isotope values were determined via Finnigan conflo II interface to a Thermo Delta V S mass spectrometer (Thermo Scientific, Bremen, Germany) coupled to a Flash EA1112 Series elemental analyser. Approximately 0.3 mg of each sample was combusted in a tin cup for the simultaneous determination of carbon and nitrogen isotope values. Stable isotope values are present in the usual δ notation based on the Vienna Pee-Dee Belemnite (V-PDB) for carbon and atmospheric N2 (Air) for nitrogen and expressed as: δ13C (‰) or δ15N (‰) = [(Rsample/Rstandard) - 1], where R = 13C/12C or 15N/14N, respectively. Replicate measurements of secondary isotopic reference material (acetanilide STD, Thermo scientific-PN 338 36700) in every batch, indicating precision < 0.2‰ for both δ13C and δ15N values.
Data Analysis
GPS data were separated into individual foraging trips. GPS locations at the colony were excluded from analyses by calculating the time from when the birds departed the colony until their return. Then, only the relocations (between consecutive tracking points) corresponding to an active feeding were selected according to flight speed (i.e., by separating active feeding from traveling, search flights, and resting); according with Louzao et al. (2009), we only used GPS relocations, which exclusively represented the areas where Cory’s shearwaters were in active feeding (2–10 km h-1). Given the impossibility of using several feeding positions in the model due to the mobile characteristic of birds, we assume the mean location of feeding activity for each bird as representative of the average stable isotopic values measured in plasma of Cory’s shearwaters during their tracking period (Jaeger et al., 2010). Although there is an inherent bias associated with the exploitation of different foraging patches and locations during the tracking period, these birds typically demonstrate short-term consistency in their diet and foraging habitats (see Ceia et al., 2014, 2015a). Finally, a distance-to-colony filter of 2 km was applied, to remove relocations before landing or after leaving the colony.
A set of 15 predictor variables (Table 1), including seven spatial (latitude, longitude, distance to Iberian coast, distance to coast, distance to colony, distance to Nazaré canyon and distance to main river), three environmental (chlorophyll a concentration, sea surface temperature and depth) and five temporal variables [year, month, stage, monthly NAO index (NAO; for each tracking month) and extended winter NAO index (wNAO; December – March; for each winter prior to the tracking period)], were chosen to assess spatio-temporal dynamics in stable isotope values (δ13C and δ15N) within the studied area. Monthly composites of remote sensing data (i.e., chlorophyll a concentration and sea surface temperature), from the corresponding tracking months (i.e., April, May, June, August, and September) between 2010 and 2015, were used in the model. The effect of the island (i.e., Berlenga or Corvo) was also tested (see Table 1 for detailed specifications on these variables). We used these variables together in the models (random forests) although some were obviously correlated (see Supplementary Tables 1–4). Random forest models handle quite well correlated/redundant variables. Thus, we were able to assess their interconnectivity and show which variables should be more prone to drive isotopic values. Some of these (or related) variables have been applied in other studies on stable isotope patterns in the marine environment both spatially and temporally (e.g., Chouvelon et al., 2012; Ceia et al., 2015b; Quillfeldt et al., 2015; Oczkowski et al., 2016). Due to the peculiarity of the existence of a large canyon very close to the colony of Berlenga (Nazaré canyon), the distance to this feature was considered as a potential explanatory variable. In addition, the distance to the closest main river within the continental neritic area was also considered (i.e., rivers Landro in Spain, and Minho, Mondego, Tejo and Sado in Portugal).
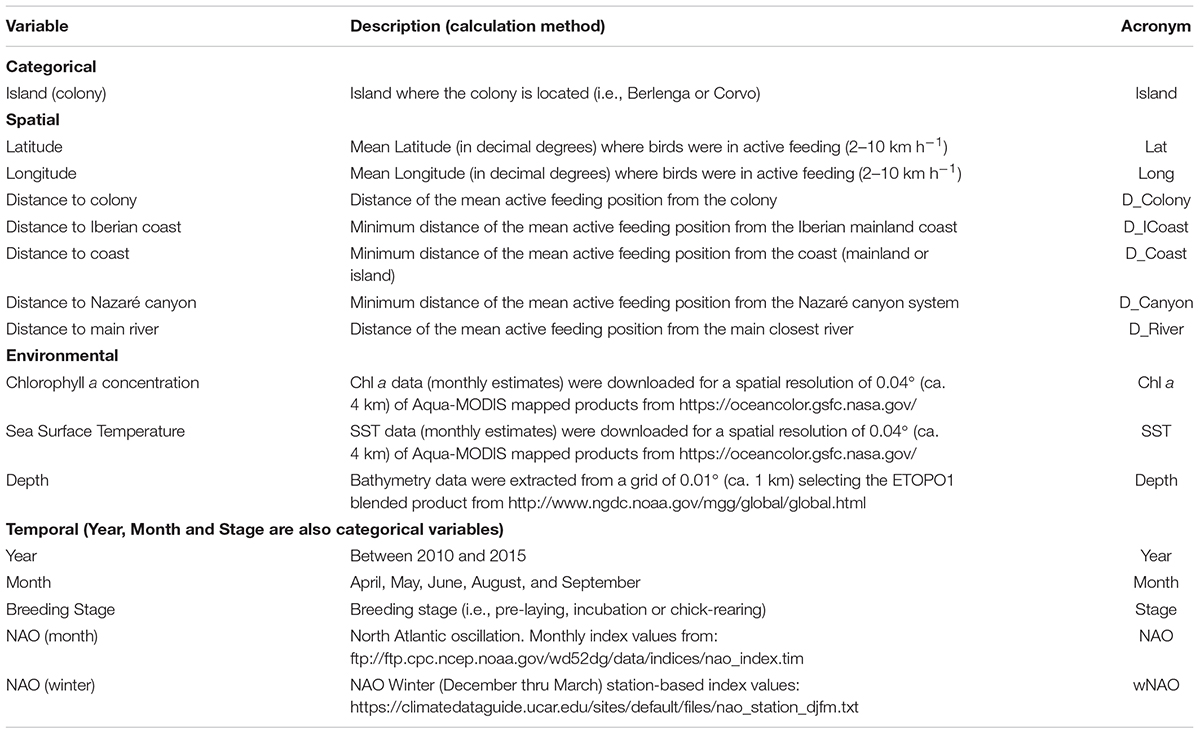
TABLE 1. Predictor variables used for modeling spatio-temporal dynamics in stable isotope values (δ13C and δ15N) measured in the plasma of tracked Cory’s shearwaters (Calonectris borealis) in the North Atlantic.
A random forest modeling was used to explore the spatio-temporal dynamics in the stable isotopes values (δ13C and δ15N), considering the 15 above nominated explanatory variables. Random forest is a classification technique based on regression trees, which is able to model and obtain a consensus prediction of the response variable from a number of explanatory variables (see Breiman, 2001 for specific details on this method). The number of trees needs to be sufficiently high, thus, we created 5000 trees for each model. As a result, this method accounts a rank importance of each explanatory variable for each model performed, having the flexibility in capturing non-linear relationships. After identifying the most relevant variables, complementary approaches to the outcome of the random forest were performed. We examine the effects of explanatory variables in δ13C and δ15N values using mixed-effects ANOVA models, and the relationship between the response variable and each explanatory variable using a Spearman’s correlation.
Analyses were performed for the pooled data, and for birds nesting in Berlenga and Corvo Islands independently, due to the distinct characteristics of these two areas. Therefore, to check for overall spatio-temporal patterns in stable isotopes, and for neritic and oceanic areas specifically, only appropriate explanatory variables were included in each model. Moreover, we had multiple birds feeding around Berlenga Island and therefore appropriate data to assess possible temporal variations in δ13C and δ15N values within a small area in the neritic environment. For this local scale, a random forest modeling was conducted using birds with a mean active feeding at less than 100 km from the colony of Berlenga (n = 90; 37.0 ± 25.5 km), which encompassed data from every year and breeding stage, with the only exception of the pre-laying in 2015 (where all birds engaged in trips with an average feeding activity > 100 km).
All data were tested for normality (Shapiro–Wilk test) and homogenous variances (Levene’s test) and non-parametric tests were used when appropriate. Values are presented as mean ± SD. All statistical tests were performed with Statistica 10.0.
Data Visualization
To create a visualization of geographic gradients in isotopic values, we used ArcGIS v.10.1 (ESRI, Redlands, CA, United States) to plot the distribution of the mean location of feeding activity by each tracked bird for each island separately. We used a kriging interpolation in the Spatial Analyst Tool to model and visualize continuous δ13C values within the study area across 2010–2015 in Berlenga and during 2010 and 2015 in Corvo (Figure 2). Only δ13C values are represented because random forest analyses indicated that temporal variables (year, month and stage) were not the main drivers of the observed patterns in δ13C values, in opposition to δ15N values, where temporal variables showed a large influence at the regional scales.
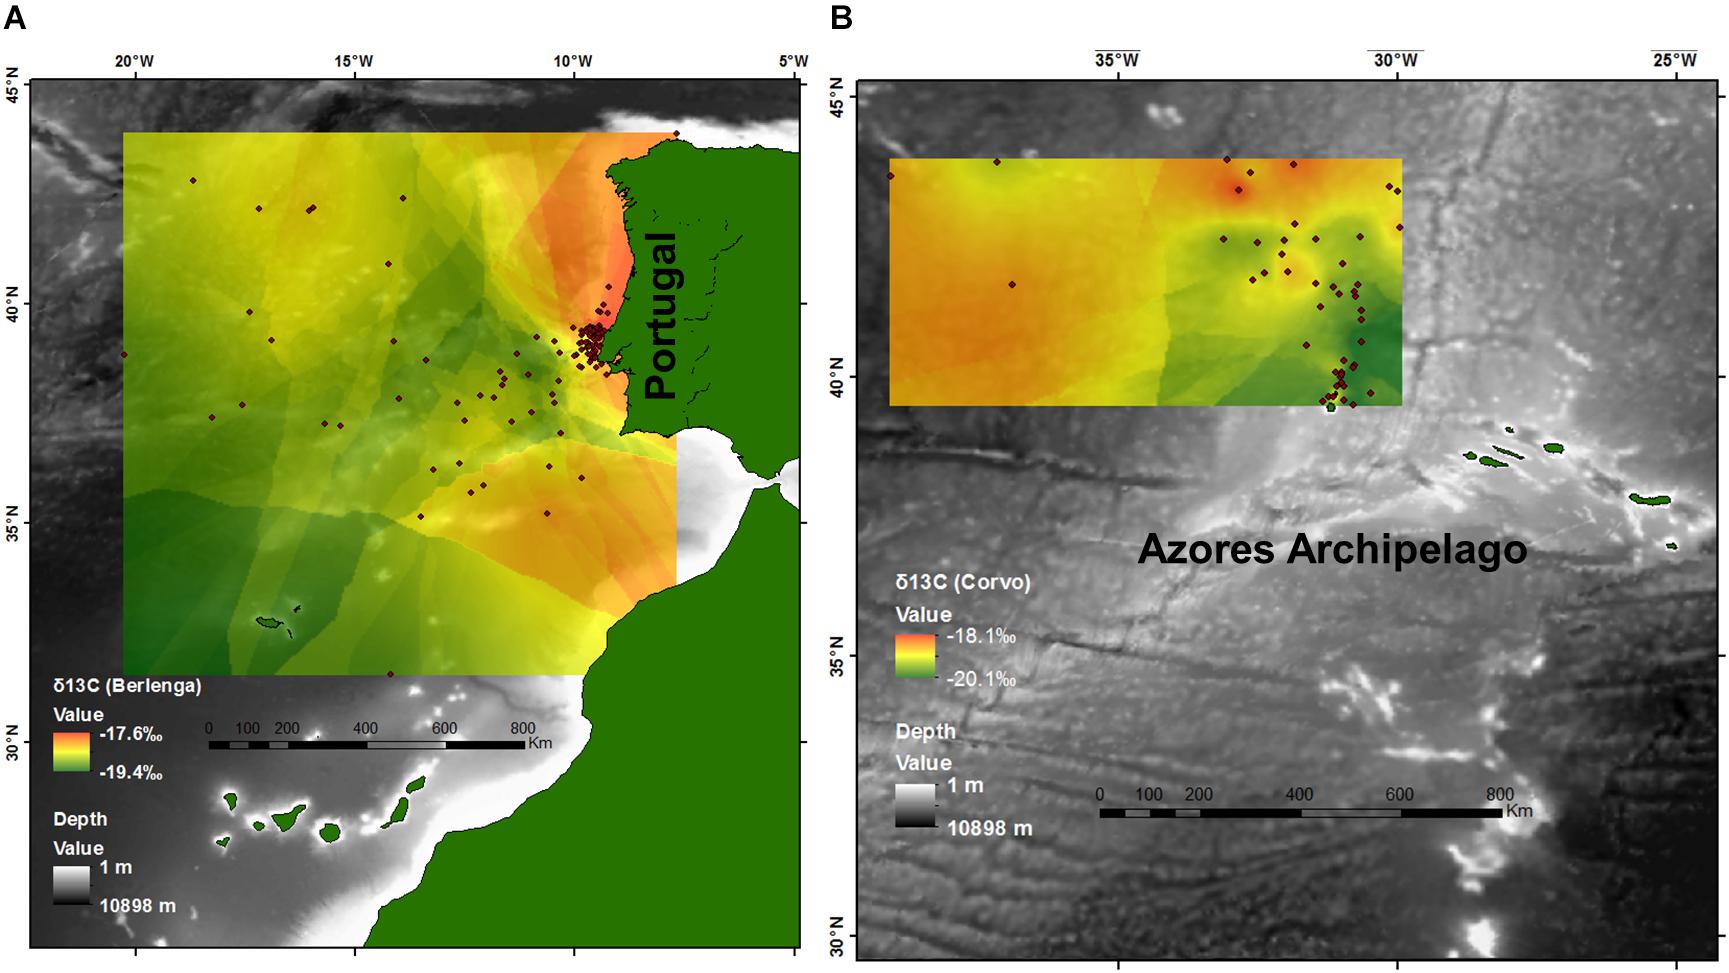
FIGURE 2. Estimated isoscapes after kriging interpolation for the North Atlantic from (A) plasma δ13C values of the 142 Cory’s shearwaters (Calonectris borealis) tracked with GPS between 2010 and 2015 in Berlenga Island (neritic environment), and (B) plasma δ13C values of the 42 Cory’s shearwaters tracked with GPS in 2010 and 2015 in Corvo Island (oceanic environment). Points represent the mean latitude and longitude of feeding activity.
Results
The GPS tracking record for the 191 Cory’s shearwaters sampled in Berlenga and Corvo Islands, from 2010 to 2015, encompassed a large latitudinal and longitudinal area of the North Atlantic, from the Eastern to Central North Atlantic, including representatively both neritic and oceanic environments. Overall, the latitude and longitude of mean feeding activity were distributed from 31.6°N to 43.9°N and 7.7°W to 39.1°W, respectively (Figure 2). The δ13C and δ15N values of delipidated plasma of all birds varied between -20.2 and -16.2‰ (-18.8 ± 0.7‰), and between 10.8 and 15.5‰ (12.9 ± 0.9‰), respectively (Tables 2, 3). The δ13C and δ15N values were positively and linearly correlated (Pearson’s correlation: r = 0.44, F1,189 = 146.2, p < 0.001). For specific information on the effect of explanatory variables in δ13C and δ15N values using mixed-effects ANOVA, see Figure 3 and Supplementary Tables 5–8; relationships between both isotopic values and explanatory variables are shown in Supplementary Figures 1–4.
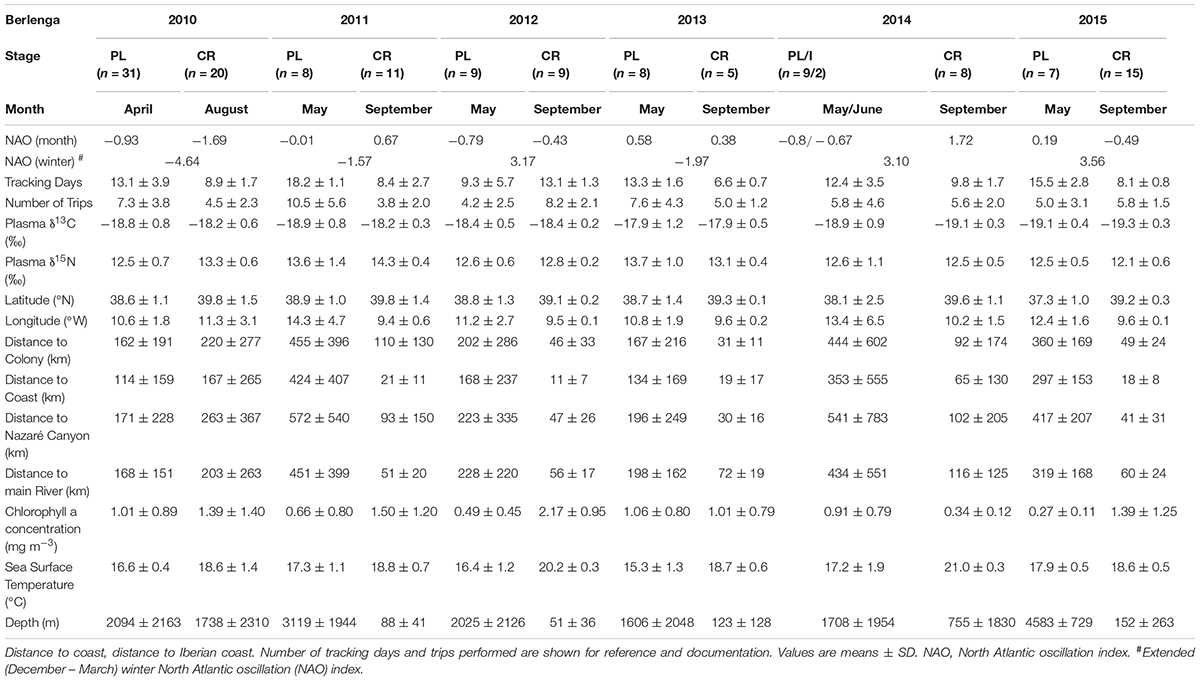
TABLE 2. Predictor variables for the neritic environment and plasma δ13C and δ15N values of Cory’s shearwaters (Calonectris borealis) breeding in Berlenga Island during the pre-laying (PL), incubation (I) and chick-rearing (CR) periods in 2010–2015.
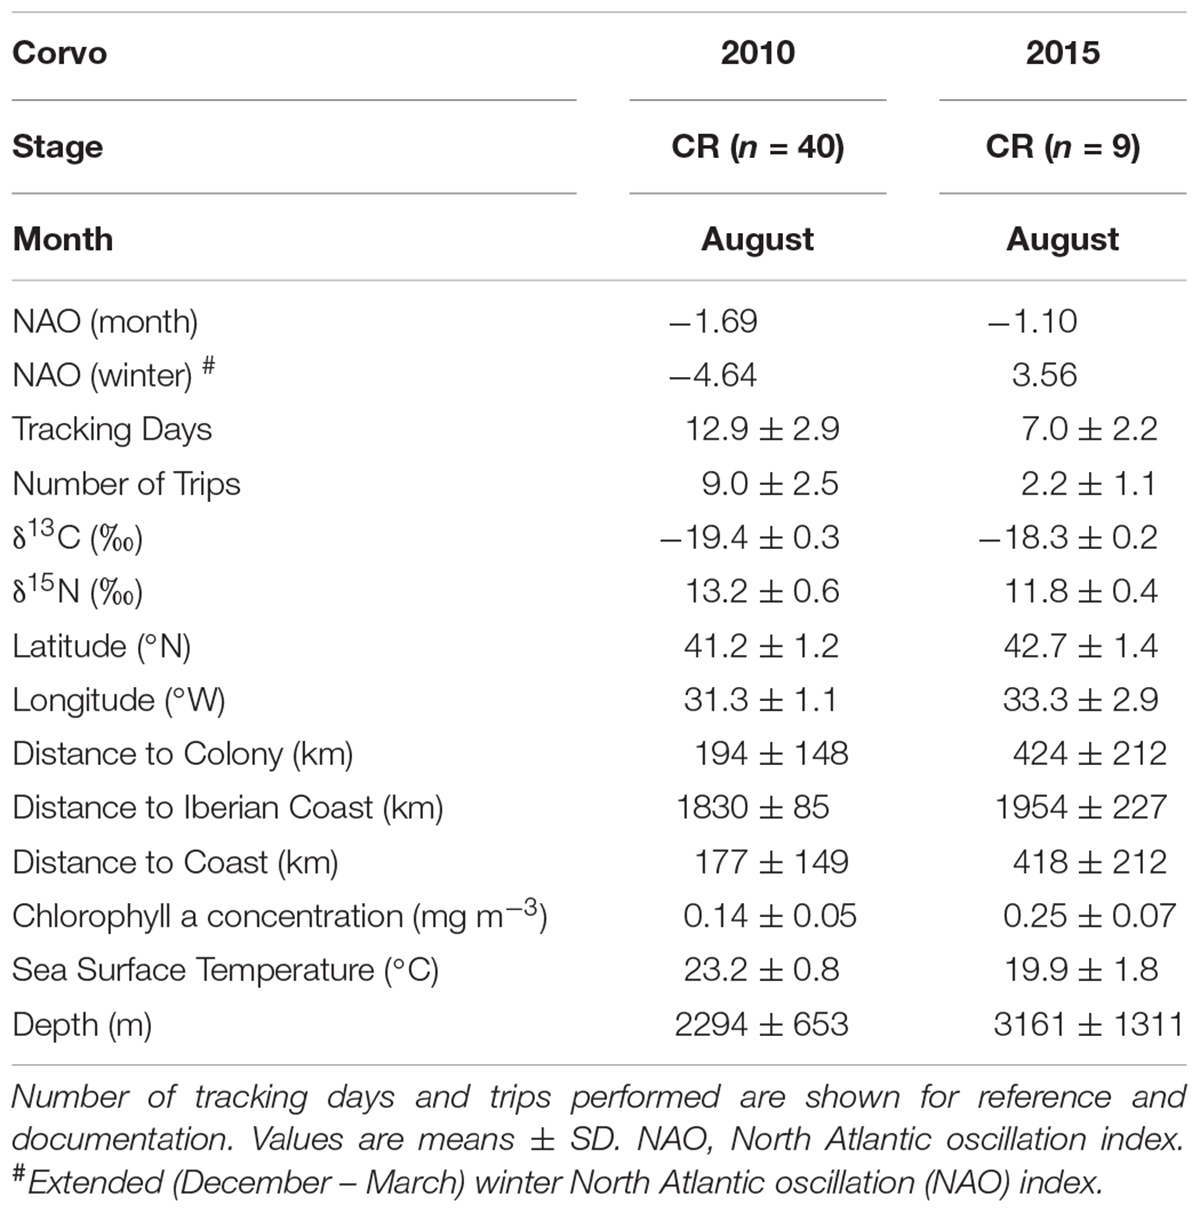
TABLE 3. Predictor variables for the oceanic environment and plasma δ13C and δ15N values of Cory’s shearwaters (Calonectris borealis) breeding in Corvo Island during the chick-rearing (CR) period in 2010 and 2015.
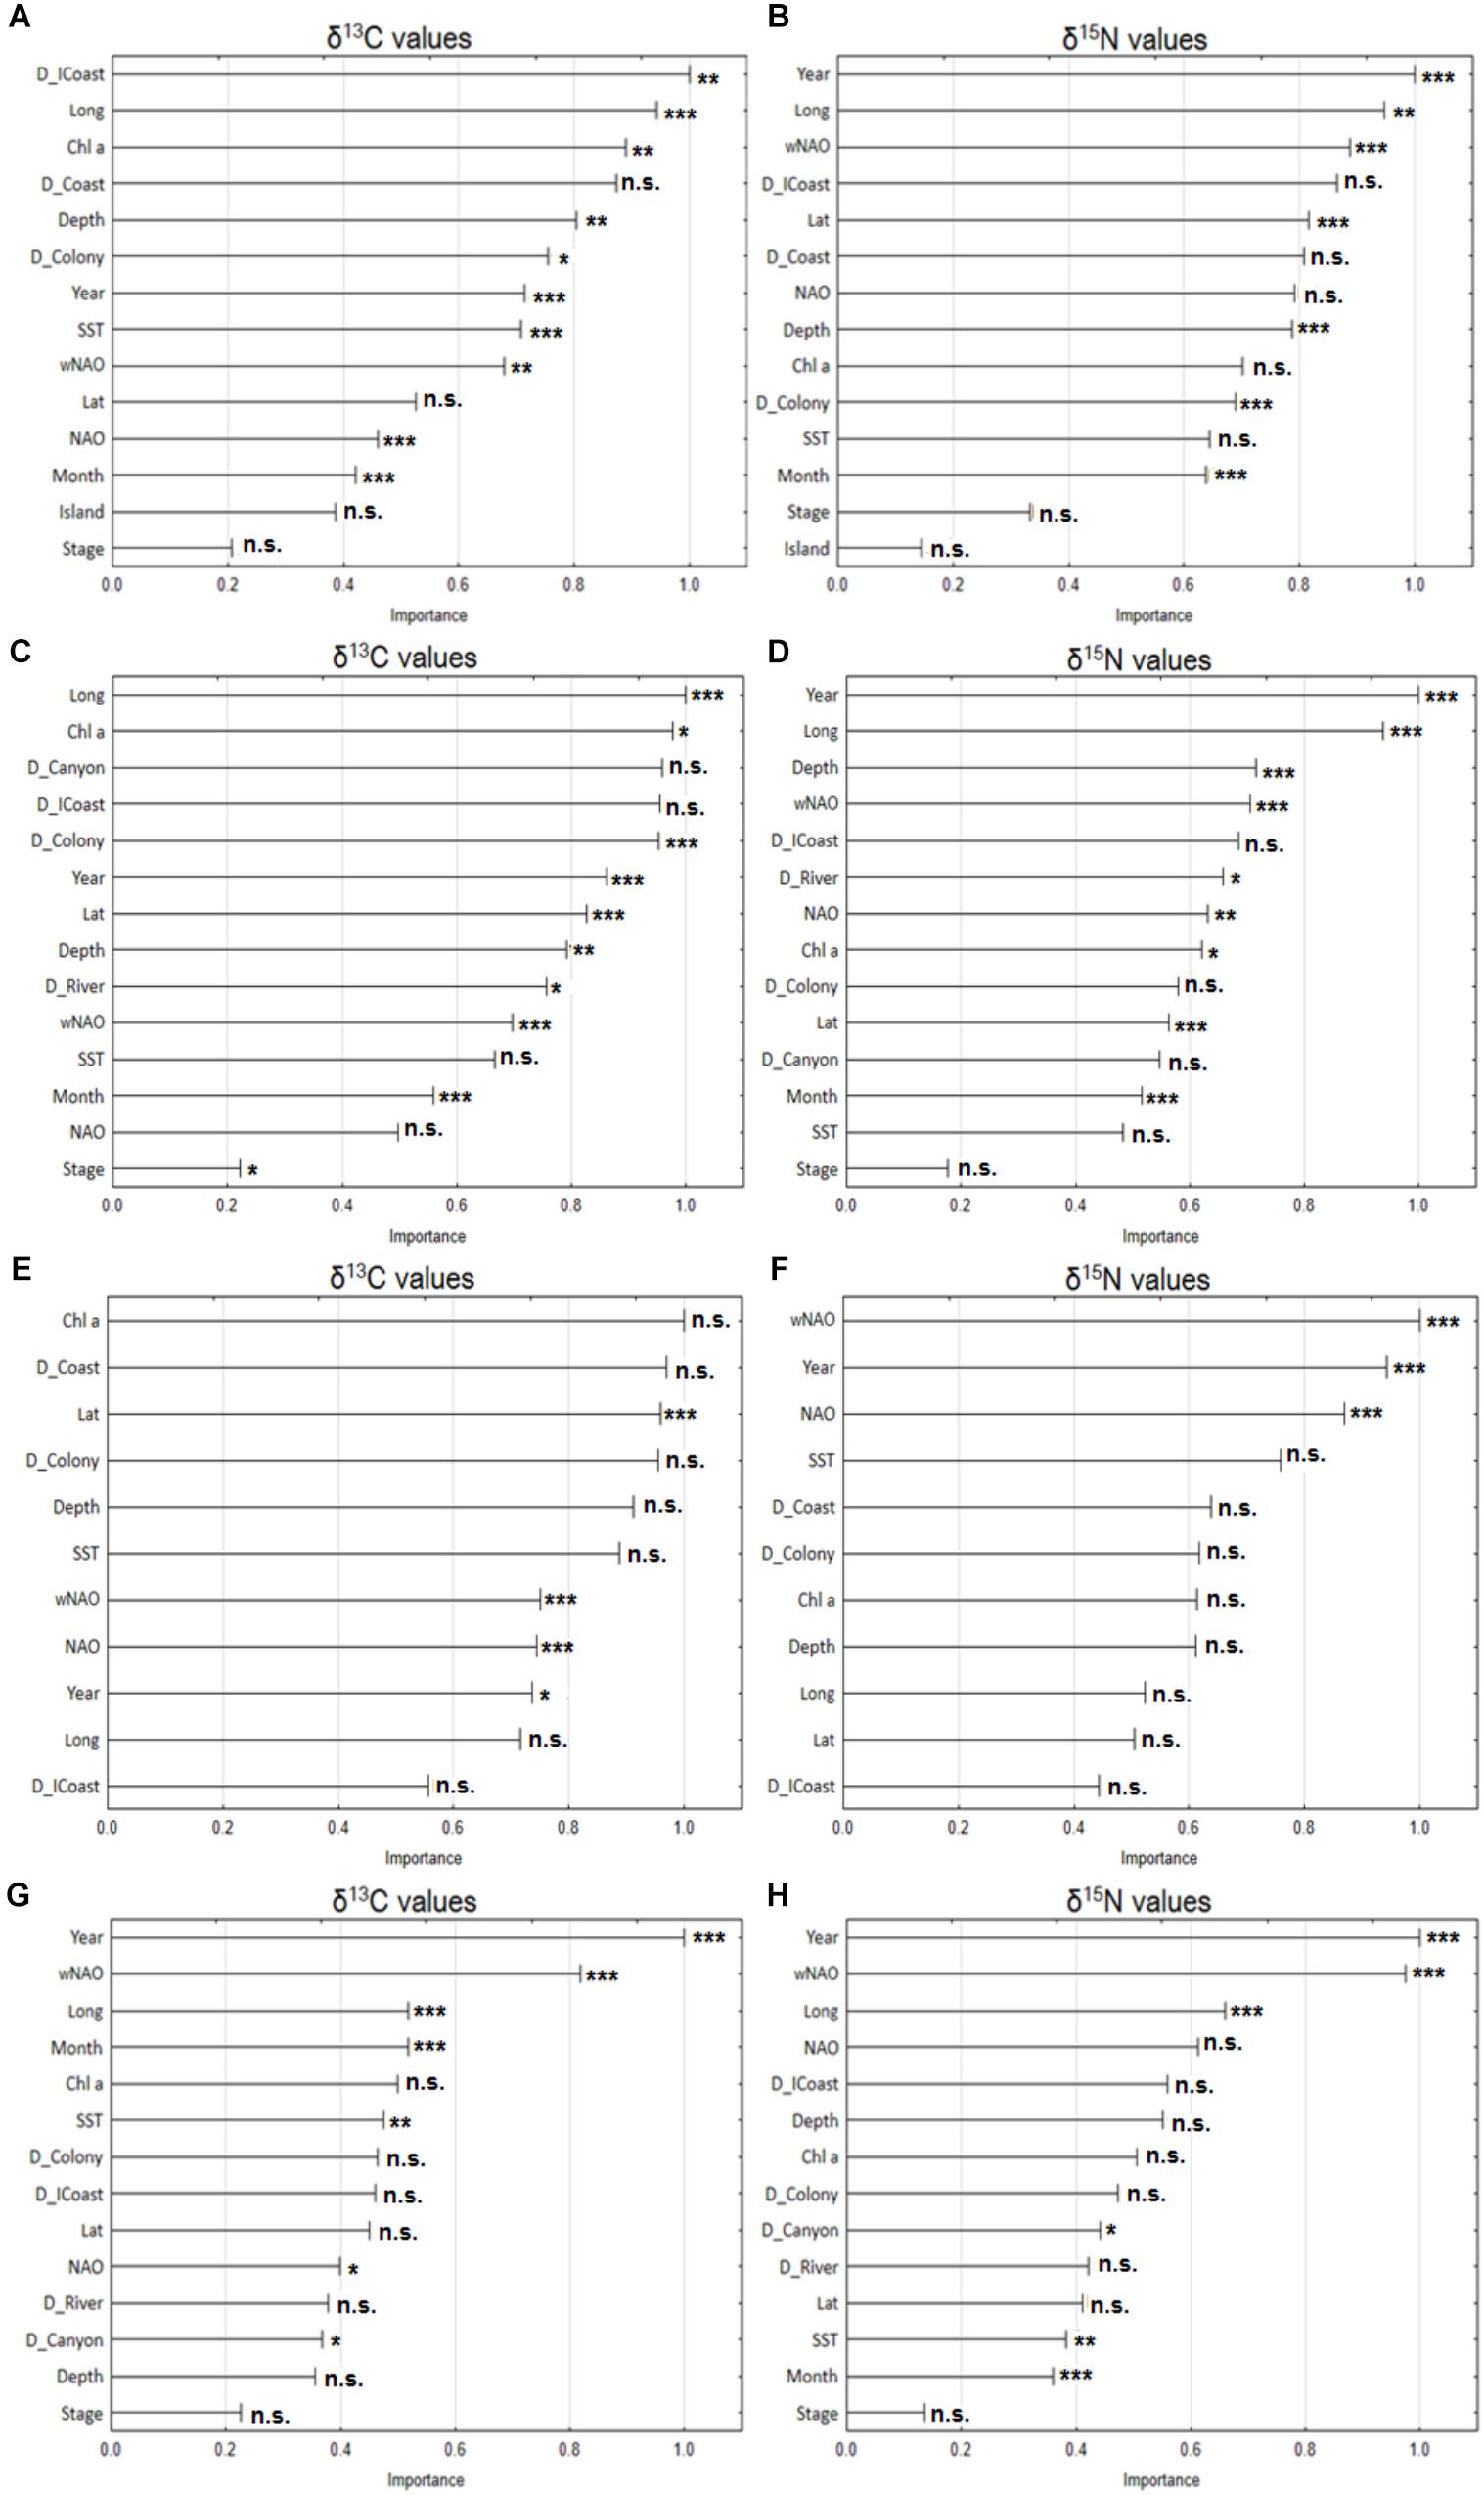
FIGURE 3. Variable importance plot of the explanatory variables used in the random forest models for plasma δ13C (left panels) and δ15N (right panels) values from Cory’s shearwaters (Calonectris borealis) sampled during this study. (A,B) Correspond to the pooled data (191 individuals from Berlenga and Corvo Islands, between 2010 and 2015); (C,D) correspond to the 142 individuals from Berlenga Island between 2010 and 2015; (E,F) correspond to the 49 individuals from Corvo Island in 2010 and 2015; and (G,H) correspond to the 90 individuals from Berlenga Island that actively fed within 100 km from the colony between 2010 and 2015. Significant results resulted from mixed-effects ANOVA for the effect of explanatory variables in δ13C and δ15N values (with year, stage, month and island treated as fixed effects) are also shown (∗∗∗p < 0.001; ∗∗p < 0.01; ∗p < 0.05; n.s. non-significant). See Table 1 for a description of each explanatory variable.
For the pooled data (hence for full regional scale within the studied area), the most important predictors of plasma δ13C values were, in descending order, distance to Iberian coast (D_ICoast), longitude (Long), chlorophyll a concentration (Chl a), distance to coast (D_Coast), and Depth (Figure 3A). Temporal variables had little importance, according to the same model. On the other hand, temporal variables (Year and wNAO) assumed great importance in the prediction of δ15N values. Random forest model indicate that plasma δ15N values were driven by Year, Long, wNAO, D_ICoast and Lat (Figure 3B).
Considering only birds from Berlenga Island (neritic environment), the random forest model indicates that the stronger predictors of plasma δ13C values were, in descending order, Long, Chl a, distance to Nazaré canyon (D_Canyon), D_ICoast and D_Colony (Figure 3C). Year was the most important predictor of plasma δ15N values, followed by Long, Depth, wNAO and D_ICoast (Figure 3D).
Random forest identified that plasma δ13C values of birds sampled in Corvo Island (oceanic environment), were mostly driven by Chl a, D_Coast, Lat, D_Colony and Depth (Figure 3E). On the other hand, plasma δ15N values were mostly driven by wNAO, Year, NAO, SST and D_Coast (Figure 3F).
Contrary to analyses performed at regional spatial scales (i.e., 100s of km), random forest identified strong temporal predictors for both plasma δ13C and δ15N values at a local scale, within a small area around Berlenga Island (i.e., <100 km). Moreover, the model behaved in a similar way in the prediction of both isotopes, for the three major drivers. The major drivers of local plasma δ13C values were, respectively, Year, wNAO, Long, Month and Chl a (Figure 3G). Similarly, Year, wNAO and Long were the stronger predictors of plasma δ15N values, followed by NAO and D_ICoast (Figure 3H).
Discussion
This study highlights the relevance of δ13C values for tracing the movements of top consumers, and potentially general marine life, in the mid-North Atlantic at regional spatial scales in both neritic and oceanic environments. However, these results and particularly Figure 2 should be interpreted cautiously because: (1) although gradients of δ13C may be potentially inferred to support studies on other species within the study area, and particularly other top predator species, the isotopic values obtained during this study are species- and tissue-specific, (2) results may be of little value outside the breeding season of Cory’s shearwaters (i.e., during winter), (3) averaging several feeding locations (for every individual) may blur any potential isotopic gradient, and (4) the effect of temporal drivers were overall significant and found to have a major influence on δ13C values at a local spatial scale. Thus, Figure 2 should be only used as a reference for the potential spatial gradients existing in the area and not to the resulted specific δ13C values. Notwithstanding, this study reflects the high complexity in the North Atlantic waters showing that the stable isotope dynamics (δ13C and δ15N) is driven by distinct variables according with different spatio-temporal scales, and these variations are transferred up food webs. This is most evident because all non-categorical explanatory variables tested had a significant relationship with both δ13C and δ15N values in some of the models built (i.e., regional, including both neritic and oceanic environments, and local scales).
This is the first study to assess the spatial and temporal variability of δ13C and δ15N values on top consumers in the North Atlantic, using a combination of GPS loggers and isotopic signatures of plasma from a wide-ranging seabird, i.e., the Cory’s shearwater. According with Phillips et al. (2009) and Jaeger et al. (2010) the tracking of wide-ranging seabirds provide us an excellent opportunity to assess stable isotope dynamics at various spatio-temporal scales, recommending this approach to increase our knowledge of the marine environment. Moreover, the best way to interpret isotopic signatures of top consumers is to describe isoscapes using their own isotopic values (Jaeger et al., 2010). The amount of data collected was sufficiently robust to test which drivers promote stable isotope dynamics, both overall and on neritic and oceanic environments. Due to the high number of birds sampled in Berlenga Island, across several consecutive years and seasons, it was also possible to examine in detail local temporal variations in stable isotopes for the neritic environment. However, our data set prevented us from investigating isotopic temporal variability considering the winter.
Spatial drivers greatly influenced δ13C values within the study area although related environmental variables, and particularly chlorophyll a concentration, also had a high influence. On the other hand, δ15N values were not spatially consistent, in both neritic and oceanic environments, due to annual variability. It should be noticed that temporal drivers had a general significant effect in both δ13C and δ15N values. In particular, both isotopes were very influenced by temporal drivers at a local spatial scale (i.e., <100 km), suggesting that top consumers such as seabirds should be difficult to trace locally. Overall, spatial drivers (presumably in association with environmental drivers such as chlorophyll a concentration) have greatly influenced δ13C values (and moderately δ15N values) at regional spatial scales.
The δ13C and δ15N Dynamics in Neritic and Oceanic Environments
There are general patterns in spatial trends of both δ13C and δ15N values in pelagic marine environments. These are more evident for δ13C, where higher values are typically observed at lower latitudes and closer to the shore (Newsome et al., 2007; Graham et al., 2010; Magozzi et al., 2017). The isotopic patterns of δ15N are not so clear, especially for use in animal tracing because 15N can be highly influenced by the trophic level of the organisms and consequent transmission trough foodwebs (Hobson et al., 2010). In addition, processes occurring in the marine environments influencing baseline isotopic values are complex making difficult to drawn patterns in marine isoscapes for specific regions deprived of a local focus (but see Magozzi et al., 2017).
Although the trophic niche and its association with geographical structure in the North Atlantic have already been depicted in a study by Roscales et al. (2011) using 11 seabird species, they use less accurate tracking devices (i.e., GLS) and isotopic composition of feathers during migration. They suggest that both δ13C and δ15N values in consumers are primarily influenced by the feeding ecology of each species rather than by local values or biogeographic trends in the baseline isotope levels. In fact, the diet of seabirds can vary significantly among species, and that will have a high influence in the resulted isotopic values. This study shows that within the same species, spatial patterns have a significant influence on isotopic values of top consumers (especially in δ13C values) at large spatial scales. However, temporal drivers (presumably associated with differences on birds’ diet or baseline isotopic levels) might influence significantly both isotopic values, although with a much larger influence in δ15N values.
According to our expectations, spatial drivers assumed great importance in the patterns of δ13C values in both neritic and oceanic environments. This supports the general assumption that δ13C can be used as a spatial (or habitat) tracer (Newsome et al., 2007; Magozzi et al., 2017), and particularly in the North Atlantic pelagic environments (e.g., Ceriani et al., 2014; MacKenzie et al., 2014). According to our models, higher δ13C values are present within the continental shelf and toward the Iberian coast, in line with the general inshore vs. offshore pattern (Cherel and Hobson, 2007), but also at higher latitudes. Significant positive relationships between δ13C values and latitude were found independently for both neritic and oceanic models, contrasting with the general latitudinal pattern (i.e., negative relationship) in other pelagic areas (e.g., Jaeger et al., 2010; Quillfeldt et al., 2010). This was particularly evident in the oceanic environment (Figure 2B), where increasing latitude was an important spatial driver of higher δ13C values toward the Canadian coast. In fact, according to patterns in δ13C values described by Graham et al. (2010) for zooplankton and modeled by Magozzi et al. (2017) for phytoplankton, higher δ13C values were found in direction to the American continent at higher latitudes. In accordance with the same studies, higher δ13C values were also found within and along the neritic area – from the Southwest of Portugal, closer to the Strait of Gibraltar and the African coast, up to the Northwest of Iberian Peninsula, Figure 2A). Thus, δ13C values obtained in this study fit well with the overall spatial pattern obtained for lower trophic levels within the study area, and the relative importance of latitude was lower than the inshore vs. offshore pattern. Therefore, our results suggest that δ13C values can be proper used to trace inshore vs. offshore movements of top predators within the continental platform and adjacent areas within the study area. On the other hand, in the North Atlantic oceanic environment δ13C values could be valuable to estimate the latitudinal foraging locations of top consumers.
Our study region is characterized by both physical and environmental features, especially in the neritic environment where enhanced primary productivity is supported by nutrients from continental runoff and upwelling events (Sousa et al., 2008). Although spatial drivers had a high influence in the distribution of δ13C values, its dynamics seem to be somehow related with environmental drivers. For instance, laboratory experiments conducted by Barnes et al. (2007) showed an effect of water temperature on both δ13C and δ15N values measured in a marine predator the European sea bass Dicentrarchus labrax, particularly in the trophic fractionation between diet and consumer. Also, MacKenzie et al. (2014) found that, although indirect, temperature is a good predictor of spatial variations in baseline isotopic values in the North Sea. Thus, although our study only found a weak effect of temperature in the dynamics of isotopic values measured in top consumers (particularly in δ15N), this variable can affect potential isotopic gradients that could exist at lower trophic levels and/or in isotopic pathways between prey and consumers (i.e., discriminant factors). However, as suggested by Magozzi et al. (2017), temperature supposedly play a higher influence on baseline isotopic compositions at higher latitudes such as polar regions, where δ13C values strongly reflect SST gradients. This means that δ13C values in phytoplankton are increasingly decoupled from SST at lower latitudes, where smaller and seasonal changes in phytoplankton physiology may have greater influences than the relatively homogenous temperature (Magozzi et al., 2017). Our study region is located in a temperate environment in the North Atlantic and chlorophyll a concentration (Chl a) had a high influence in the distribution of δ13C values for the whole region, including both neritic and oceanic environments. High concentration of Chl a is a proxy for higher productivity and, as suggested by this study, greater δ13C values in the studied area (see also MacKenzie et al., 2011). Indeed, Chl a is typically higher in the Portuguese neritic coast and North of the Azores Islands where Cory’s shearwaters often forage (Paiva et al., 2010). Although dynamic, Chl a is predictable in space and time due to fixed oceanographic features associated with specific currents, leading for instance to local upwelling events. It is important to note the relevance of the Nazaré Canyon in such dynamics within the neritic environment, as it favors upwelling events close to the shore. These results suggest that environmental variables should be taken into account in the dynamics of isotopic values for all marine organisms from different habitats.
In general, our study showed a moderate influence of spatial drivers on the distribution patterns of δ15N values, decreasing considerably from inshore to offshore and increasing discreetly with latitude. Accordingly, other studies reported similar spatial patterns in δ15N values of zooplankton (Graham et al., 2010), fish and squid (Chouvelon et al., 2012), sea turtles (Ceriani et al., 2014) and seabirds (Roscales et al., 2011) in the North Atlantic. However, our study highlights the higher importance of temporal drivers in the distribution patterns of δ15N values in top consumers for the whole study area, corroborated independently for both neritic and oceanic environments. Temporal variability in δ15N values of consumers may be a consequence of changes in the baseline δ15N levels (Graham et al., 2010). Annual variations presumably associated with NAO values (and particularly winter NAO) triggered temporal variability in δ15N values detected during this study. However, we can argue that differences in prey consumed by Cory’s shearwaters between years and/or seasons may alter significantly δ15N values measured in plasma. As δ15N values are much more sensitive to diet variation (i.e., prey type) than δ13C values (Newsome et al., 2007), this is the most plausible explanation for temporal variability in δ15N values. Although we do not have yearly data on diet, it is known that Cory’s shearwaters may vary their foraging behavior and diet (based on fish and squid) among years (Alonso et al., 2014), and that NAO index is known to be related with prey availability in the North Atlantic (Paiva et al., 2013, 2017).
The δ13C and δ15N Dynamics at a Local Scale in the Neritic Environment
Analyses performed at a local scale, specifically a small area around Berlenga Island within the neritic environment (i.e., <100 km), showed that both δ13C and δ15N values measured in plasma of Cory’s shearwaters were essentially driven by the same variables, mainly temporal drivers. The year and the winter NAO index were the two most important predictors of both δ13C and δ15N values followed by longitude (and month showed similar results to longitude for δ13C values). This suggests that differences in diet should have influenced stable isotope dynamics at a local scale among years (Paiva et al., 2013; Ceia et al., 2014). This is expected in top consumers because at a local scale even slight δ13C differences in prey type (i.e., supposedly all pelagic in this case) should overflow small spatial variations based on specific habitat isotopic signatures. Mobile prey species such as fish and temporal changes in the environment might alter the ability of the consumer to find, acquire, and consume its prey, influencing δ13C and δ15N dynamics at the level of consumers (Yeakel et al., 2016). Moreover, local episodic events such as spring blooms, eddies, currents, river flows, warm core rings among others, may have dramatic, although ephemeral, effects on δ15N and δ13C values at baseline levels (Oczkowski et al., 2016); however, such effects could be not conspicuous in high-trophic level organisms. According with Magozzi et al. (2017) the transfer of temporal variations in baseline levels to consumer tissues decreases with increasing trophic level, potentially leading to the averaging of temporal baseline variations in high-trophic level organisms. In general, seabirds such as the Cory’s shearwater are top consumers that feed on mid-trophic level prey that integrate (and then buffer) spatio-temporal isotopic variations (especially at a local scale) that could weak the seasonal effect effectively present in prey (Ceia et al., 2015b).
Conclusion
This study identify relevant relationships between δ13C values and spatial drivers at regional spatial scales, for both neritic and oceanic pelagic environments, emphasizing the relevance of δ13C values for tracing marine life in the North Atlantic. On the other hand, δ15N values in plasma of Cory’s shearwaters were highly influenced by annual variability supposedly associated with variation in diet and/or baseline isotopic levels. δ13C spatial gradients depicted during this study were not marked as, for instance, in areas of the Southern Atlantic (e.g., Cherel and Hobson, 2007; Jaeger et al., 2010; Quillfeldt et al., 2015) for seabirds, especially concerning latitudinal gradients. However, an inshore vs. offshore pattern in the neritic area and adjacent waters was evident, and δ13C values were generally lower within the oceanic environment. This study also highlights the relevance of chlorophyll a concentration as an important environmental driver of δ13C values in the central and eastern North Atlantic. This suggests that local oceanographic events should have a significant effect on the distribution of δ13C values by altering environmental dynamic variables such as the SST or Chl a. Moreover, this study shows that within the neritic environment, at a local spatial scale (<100 km), both isotopes were very influenced by temporal drivers, suggesting that top consumers such as pelagic seabirds are very difficult to trace locally.
In summary this study shows that spatial drivers (presumably associated with environmental drivers) are efficient predictors of δ13C values in both neritic and oceanic environments at regional spatial scales (i.e., central and eastern North Atlantic). However, both isotopes were strongly influenced by temporal drivers at a local spatial scale (i.e., a radius of 100 km within the neritic area). Thus, this study highlights that biogeographic δ13C gradients could help to assist the study of wildlife movements (of 100s of km) of top consumers in the North Atlantic. However, the use of δ15N values should be used cautiously due to high temporal variability.
Author Contributions
FC, YC, and JR conceived and formulated the idea, and developed methodology. FC, VP, and JR conducted the fieldwork and laboratory analyses. All authors analyzed the data, read and commented on the manuscript, and approved the submitted version.
Funding
FC and VP acknowledge their postdoctoral grants (SFRH/BPD/95372/2013 and SFRH/BPD/85024/2012, respectively) attributed by the Foundation for Science and Technology (FCT; Portugal) and the European Social Fund (POPH, EU). This study benefited from the strategic program of MARE, financed by FCT (MARE - UID/ MAR/04292/2013).
Conflict of Interest Statement
The authors declare that the research was conducted in the absence of any commercial or financial relationships that could be construed as a potential conflict of interest.
Acknowledgments
The authors would like to thank the Instituto da Conservação da Natureza e Florestas (ICNF) and Berlengas Nature Reserve for permissions to work on Berlenga Island, and the Governo Regional dos Açores for permissions to work on Corvo Island. Special thanks to wardens Paulo Crisóstomo, Eduardo Mourato, and Tiago Menino. We thank the support given by the EU INTERREG project FAME (The Future of the Atlantic Marine Environment; Project n∘ 2009-1/089) and by LIFE + Berlenga (LIFE13 NAT/PT/000458) at Berlenga Island, and by the LIFE project “Safe Islands for Seabirds” (LIFE07 NAT/P/000649) at Corvo Island.
Supplementary Material
The Supplementary Material for this article can be found online at: https://www.frontiersin.org/articles/10.3389/fmars.2018.00377/full#supplementary-material
References
Alonso, H., Granadeiro, J. P., Waap, S., Xavier, J., Symondson, W. O. C., Ramos, J. A., et al. (2014). An holistic ecological analysis of the diet of Cory’s shearwaters using prey morphological characters and DNA barcoding. Mol. Ecol. 23,3719–3733. doi: 10.1111/mec.12785
Barnes, C., Sweeting, C. J., Jennings, S., Barry, J. T., and Polunin, N. V. C. (2007). Effect of temperature and ration size on carbon and nitrogen stable isotope trophic fractionation. Funct. Ecol. 21, 356–362. doi: 10.1111/j.1365-2435.2006.01224.x
Bearhop, S., Teece, M. A., Waldron, S., and Furness, R. W. (2000). Influence of lipid and uric acid on d13C and d15N values of avian blood: implications for trophic studies. Auk 117, 504–507.
Bowen, G. J. (2010). Isoscapes: spatial pattern in isotopic biogeochemistry. Annu. Rev. Earth Planet. Sci. 38, 161–187. doi: 10.1146/annurev-earth-040809-152429
Ceia, F. R., Paiva, V. H., Ceia, R. S., Hervías, S., Garthe, S., Marques, J. C., et al. (2015a). Spatial foraging segregation by close neighbours in a wide-ranging seabird. Oecologia 177, 431–440. doi: 10.1007/s00442-014-3109-1
Ceia, F. R., Ramos, J. A., Phillips, R. A., Cherel, Y., Jones, D. C., Vieira, R. P., et al. (2015b). Analysis of stable isotope ratios in blood of tracked wandering albatrosses fails to distinguish a δ13C gradient within their winter foraging areas in the southwest Atlantic Ocean. Rapid Commun. Mass Spectrom. 29, 2328–2336. doi: 10.1002/rcm.7401
Ceia, F. R., Paiva, V. H., Garthe, S., Marques, J. C., and Ramos, J. A. (2014). Can variations in the spatial distribution at sea and isotopic niche width be associated with consistency in the isotopic niche of a pelagic seabird species? Mar. Biol. 161, 1861–1872. doi: 10.1007/s00227-014-2468-9
Ceriani, S. A., Roth, J. D., Sasso, C. R., McClellan, C. M., James, M. C., Haas, H. L., et al. (2014). Modeling and mapping isotopic patterns in the Northwest Atlantic derived from loggerhead sea turtles. Ecosphere 5, 1–24. doi: 10.1890/ES14-00230.1
Cherel, Y., and Hobson, K. (2007). Geographical variation in carbon stable isotope signatures of marine predators: a tool to investigate their foraging areas in the Southern Ocean. Mar. Ecol. Prog. Ser. 329, 281–287. doi: 10.3354/meps329281
Cherel, Y., Hobson, K. A., and Hassani, S. (2005a). Isotopic discrimination between food and blood and feathers of captive penguins: implications for dietary studies in the wild. Physiol. Biochem. Zool. 78, 106–115. doi: 10.1086/425202
Cherel, Y., Hobson, K. A., and Weimerskirch, H. (2005b). Using stable isotopes to study resource acquisition and allocation in procellariiform seabirds. Oecologia 145, 533–540. doi: 10.1007/s00442-005-0156-7
Cherel, Y., Le Corre, M., Jaquemet, S., Ménard, F., Richard, P., and Weimerskirch, H. (2008). Resource partitioning within a tropical seabird community: new information from stable isotopes. Mar. Ecol. Prog. Ser. 366, 281–291. doi: 10.3354/meps07587
Chouvelon, T., Spitz, J., Caurant, F., Mèndez-Fernandez, P., Chappuis, A., Laugier, F., et al. (2012). Revisiting the use of δ15N in meso-scale studies of marine food webs by considering spatio-temporal variations in stable isotopic signatures – The case of an open ecosystem: the Bay of Biscay (North-East Atlantic). Prog. Oceanogr. 101, 92–105. doi: 10.1016/j.pocean.2012.01.004
Graham, B. S., Koch, P. L., Newsome, S. D., Mcmahon, K. W., and Aurioles, D. (2010). “Using isoscapes to trace the movements and foraging behavior of top predators in oceanic ecosystems,” in Isoscapes: Understanding Movement, Pattern, and Process on Earth Through Isotope Mapping, eds J. B. West, G. J. Bowen, T. E. Dawson, and K. P. Tu (Dordrecht: Springer), 299–318.
Hobson, K. A. (1999). Tracing origins and migration of wildlife using stable isotopes: a review. Oecologia 120, 314–326. doi: 10.1007/s004420050865
Hobson, K. A., Barnett-johnson, R., and Cerling, T. (2010). “Using isoscapes to track animal migration,” in Isoscapes: Understanding Movement, Pattern, and Process on Earth Through Isotope Mapping, eds J. B. West, G. J. Bowen, T. E. Dawson, and K. P. Tu (Dordrecht: Springer), 273–298.
Hobson, K. A., and Clark, R. G. (1993). Turnover of 13C in cellular and plasma fractions of blood: implications for nondestructive sampling in avian dietary studies. Auk 110, 638–641.
Igual, J. M., Forero, M. G., Tavecchia, G., González-Solis, J., Martínez-Abraín, A., Hobson, K. A., et al. (2005). Short-term effects of data-loggers on Cory’s shearwater (Calonectris diomedea). Mar. Biol. 146, 619–624. doi: 10.1007/s00227-004-1461-0
Jaeger, A., Lecomte, V. J., Weimerskirch, H., Richard, P., and Cherel, Y. (2010). Seabird satellite tracking validates the use of latitudinal isoscapes to depict predators’ foraging areas in the Southern Ocean. Rapid Commun. Mass Spectrom. 24, 3456–3460. doi: 10.1002/rcm
Laakmann, S., and Auel, H. (2010). Longitudinal and vertical trends in stable isotope signatures (δ13C and δ15N) of omnivorous and carnivorous copepods across the South Atlantic Ocean. Mar. Biol. 157, 463–471. doi: 10.1007/s00227-009-1332-9
Louzao, M., Bécares, J., Rodríguez, B., Hyrenbach, K., Ruiz, A., and Arcos, J. (2009). Combining vessel-based surveys and tracking data to identify key marine areas for seabirds. Mar. Ecol. Prog. Ser. 391, 183–197. doi: 10.3354/meps08124
MacKenzie, K. M., Longmore, C., Preece, C., Lucas, C. H., and Trueman, C. N. (2014). Testing the long-term stability of marine isoscapes in shelf seas using jellyfish tissues. Biogeochemistry 121, 441–454. doi: 10.1007/s10533-014-0011-1
MacKenzie, K. M., Palmer, M. R., Moore, A., Ibbotson, A. T., Beaumont, W. R. C., Poulter, D. J. S., et al. (2011). Locations of marine animals revealed by carbon isotopes. Sci. Rep. 1:21. doi: 10.1038/srep00021
Magalhães, M., Santos, R., and Hamer, K. (2008). Dual-foraging of Cory’s shearwaters in the Azores: feeding locations, behaviour at sea and implications for food provisioning of chicks. Mar. Ecol. Prog. Ser. 359, 283–293. doi: 10.3354/meps07340
Magozzi, S., Yool, A., Vander Zanden, H., Wunder, M., and Trueman, C. N. (2017). Using ocean models to predict spatial and temporal variation in marine carbon isotopes. Ecosphere 8:e01763. doi: 10.1002/ecs2.1763
Montoya, J., Carpenter, E., and Capone, D. (2002). Nitrogen fixation and nitrogen isotope abundances in zooplankton of the oligotrophic North Atlantic. Limnol. Oceanogr. 47, 1617–1628. doi: 10.1371/journal.pone.0131258
Navarro, J., Coll, M., Somes, C. J., and Olson, R. J. (2013). Trophic niche of squids: insights from isotopic data in marine systems worldwide. Deep. Res. Part II Top. 95, 93–102. doi: 10.1016/j.dsr2.2013.01.031
Newsome, S. D., Rio, C. M., Bearhop, S., and Phillips, D. L. (2007). A niche for isotopic ecology. Front. Ecol. Environ. 5, 429–436. doi: 10.1890/060150.01
Oczkowski, A., Kreakie, B., Mckinney, R. A., and Prezioso, J. (2016). Patterns in stable isotope values of nitrogen and carbon in particulate matter from the Northwest Atlantic continental shelf, from the gulf of maine to cape hatteras. Front. Mar. Sci. 3:252. doi: 10.3389/fmars.2016.00252
Paiva, V., Geraldes, P., Marques, V., Rodríguez, R., Garthe, S., and Ramos, J. (2013). Effects of environmental variability on different trophic levels of the North Atlantic food web. Mar. Ecol. Prog. Ser. 477, 15–28. doi: 10.3354/meps10180
Paiva, V. H., Geraldes, P., Ramírez, I., Meirinho, A., Garthe, S., and Ramos, J. A. (2010). Oceanographic characteristics of areas used by Cory’s shearwaters during short and long foraging trips in the North Atlantic. Mar. Biol. 157, 1385–1399. doi: 10.1007/s00227-010-1417-5
Paiva, V. H., Pereira, J., Ceia, F. R., and Ramos, J. A. (2017). Environmentally driven sexual segregation in a marine top predator. Sci. Rep. 7:2590. doi: 10.1038/s41598-017-02854-2
Phillips, R. A., Bearhop, S., McGill, R. A. R., and Dawson, D. A. (2009). Stable isotopes reveal individual variation in migration strategies and habitat preferences in a suite of seabirds during the nonbreeding period. Oecologia 160, 795–806. doi: 10.1007/s00442-009-1342-9
Phillips, R. A., Xavier, J. C., and Croxall, J. P. (2003). Effects of satellite transmitters on albatrosses and petrels. Auk 120, 1082–1090. doi: 10.1642/0004-8038
Quillfeldt, P., Ekschmitt, K., Brickle, P., Mcgill, R. A. R., Wolters, V., Dehnhard, N., et al. (2015). Variability of higher trophic level stable isotope data in space and time – a case study in a marine ecosystem. Rapid Commun. Mass Spectrom. 29, 667–674. doi: 10.1002/rcm.7145
Quillfeldt, P., Masello, J. F., McGill, R. A., Adams, M., and Furness, R. W. (2010). Moving polewards in winter: a recent change in the migratory strategy of a pelagic seabird? Front. Zool. 7:15. doi: 10.1186/1742-9994-7-15
Ramos, R., and González-Solís, J. (2012). Trace me if you can: the use of intrinsic biogeochemical markers in marine top predators. Front. Ecol. Environ. 10, 258–266. doi: 10.1890/110140
Roscales, J. L., Gómez-Díaz, E., Neves, V., and González-Solís, J. (2011). Trophic versus geographic structure in stable isotope signatures of pelagic seabirds breeding in the northeast Atlantic. Mar. Ecol. Prog. Ser. 434, 1–13. doi: 10.3354/meps09211
Sousa, F. M., Nascimento, S., Casimiro, H., and Boutov, D. (2008). Identification of upwelling areas on sea surface temperature images using fuzzy clustering. Remote Sens. Environ. 112, 2817–2823. doi: 10.1016/j.rse.2008.01.014
Keywords: Atlantic Ocean, bio-logging, isoscapes, isotopic patterns, plasma, random forest, seabird, top predators
Citation: Ceia FR, Cherel Y, Paiva VH and Ramos JA (2018) Stable Isotope Dynamics (δ13C and δ15N) in Neritic and Oceanic Waters of the North Atlantic Inferred From GPS-Tracked Cory’s Shearwaters. Front. Mar. Sci. 5:377. doi: 10.3389/fmars.2018.00377
Received: 22 January 2018; Accepted: 27 September 2018;
Published: 17 October 2018.
Edited by:
Christos Dimitrios Arvanitidis, Hellenic Centre for Marine Research, GreeceReviewed by:
David Costalago, Stockholm University, SwedenDavid March, Instituto Mediterráneo de Estudios Avanzados (IMEDEA), Spain
Copyright © 2018 Ceia, Cherel, Paiva and Ramos. This is an open-access article distributed under the terms of the Creative Commons Attribution License (CC BY). The use, distribution or reproduction in other forums is permitted, provided the original author(s) and the copyright owner(s) are credited and that the original publication in this journal is cited, in accordance with accepted academic practice. No use, distribution or reproduction is permitted which does not comply with these terms.
*Correspondence: Filipe R. Ceia, Y2VpYWZpbGlwZUB6b28udWMucHQ=