 Konrad Karlsson
 Monika Winder
- Department of Ecology Environment and Plant Sciences, Stockholm University, Stockholm, Sweden
Little is known about the ecosystem effects of locally adapted populations. The filter feeding copepod Eurytemora affinis is an abundant and important zooplankton in coastal waters that consist of a cryptic species complex with locally adapted populations. We used a mesocosm setup to investigate population and ecosystem interactions of two populations from the Baltic Sea with different morphology and life history traits. One population is laterally wider, larger-sized, more fecund, and have higher growth rate than the other. The experimental ecosystems varied in algae community (pelagic algae, and pelagic algae + benthic diatoms) with two resource supply scenarios. Results showed that the large-sized population is a more effective grazer. In low resource supply the small-sized population starved, whereas the large-sized population was unaffected, resulting in a larger population increase of both nauplii and copepodites than for the small-sized population. Addition of benthic diatoms to the pelagic algae community had much more negative effects on the reproduction of the large-sized population. This suggests that the large-sized population feeds near benthic to a greater extent than the small-sized population, and that filamentous benthic diatoms interfere with the grazing process. Despite the negative effects of benthic diatoms, the large-sized population could maintain similar or higher reproduction than the small-sized population. In addition, the high grazing efficiency of the large-sized population resulted in a different community composition of algae. Specifically, flagellated species and small sized benthic diatoms were more grazed upon by the large-sized population. Our results show that morphologically divergent, yet phylogenetically closely related zooplankton populations can have different ecosystem functions, and in turn have different population increase in response to resource supply and algae community.
1. Introduction
The number of species in an ecosystem and their traits affect diverse ecosystem processes (Hooper et al., 2005). A key question is whether the species or their traits are the best predictor of ecosystem functions because variation within species, such as differences in resource specialization and life history traits (e.g., growth and fecundity) can affect ecosystem processes (Harmon et al., 2009; Bassar et al., 2010; Walsh et al., 2012). Consequently, variation in ecosystem processes can be larger within species than between species (Gianuca et al., 2016) and not all conspecifics can be regarded as ecologically equal (Bolnick et al., 2002). Furthermore, interactions of species and ecosystems are bilateral so that species may diverge depending on the type of habitat (Marklund et al., 2018).
Many species exhibits adaptations dependent on attributes in their local habitat. Differences between locally adapted populations can be quantified by rearing populations in a common garden where the environments are identical for all individuals (Falconer and Mackay, 1996), thereby the environmental source of phenotypic variance between populations can be eliminated. Hence the phenotypic variance of a quantified trait is caused by genetic variance when the environment is identical. In addition, locally adapted populations may have different ecological effects (Schoener, 2011), which can be estimated by common gardening experiments. The difference between a common garden and a common gardening experiment is the switch of focal point. In the former the focus is on the environmental effects on phenotypes. In the latter the focus is on the effect of phenotypes on the environment. Therefore, there are two focal points for delineating evolutionary diversification: the effect of ecology on phenotypes, and the effect of phenotypes on ecology. By constructing common gardening experiments, where one put specific phenotypes (e.g., populations) in replicated ecosystems, it is possible to quantify both of these effects (Matthews et al., 2011b, 2014).
Overlooking divergence within species results in loss of information about how organisms interact with and shape their ecosystems. A common procedure when conceptualizing ecosystems is to use a trait-based approach (Litchman et al., 2013; Colina et al., 2016). However, to describe trait diversity correctly one has to acknowledge that traits diverge also within species. For instance, in a fish species when averaging consumption of benthic and pelagic resources it seems as if fish are connectors of the pelagic and benthic food webs (Schindler and Scheuerell, 2002; Vander Zanden and Vadeboncoeur, 2002). However, when accounting for that fish can specialize for either benthic or pelagic resources it seems as if they disconnect these two food webs (Quevedo et al., 2009). In fish, there are many examples of how adaptive radiations and plastic specializations in resource use have caused intra-specific morphological variation, which results in different ecosystem effects by the different morphotypes (Harmon et al., 2009; Palkovacs and Post, 2009; Post and Palkovacs, 2009; Lundsgaard-Hansen et al., 2014). In addition to morphological traits, life history traits such as divergence in populations' growth rates and fecundity can affect ecosystem processes differently (Bassar et al., 2010; Walsh et al., 2012). Furthermore, traits that diverge under artificial selection can have different effects in experimental ecosystems (Becks et al., 2010; Pantel et al., 2015), giving a direct link from adaptation to ecosystem effects.
The focal species in the present study is the calanoid copepod Eurytemora affinis (Poppe, 1880), a dominant zooplankton species in estuaries in the northern hemisphere and an important grazer and prey for fish (Hernroth and Ackefors, 1979; Diekmann et al., 2012; Rajasilta et al., 2014). It consists of a cryptic species complex (Lee and Frost, 2002) and inter-population crosses have shown that certain populations cannot reproduce further than two generations (Lee, 2000). Specifically, in the Baltic Sea the great morphological variation in E. affinis have led to past taxonomic confusion and classification into invalid species (Lee and Frost, 2002; Sukhikh et al., 2016) because the females of some populations can be larger, laterally wider, and carry more eggs than others do (Gurney, 1931).
Revisions of the E. affinis species complex have been ongoing since it was first described by Poppe (1880) and Gurney (1931). Recently, a new species within the complex, Eurytemora carolleeae, was described (Alekseev and Souissi, 2011). This species originate from the North American east coast and is listed as an invasive species in the Baltic Sea, with occurrences in the Gulf of Finland and the Gulf of Riga (Alekseev and Souissi, 2011; Sukhikh et al., 2013). The morphological traits used to discriminate between E. affinis and E. carolleeae are non-adaptive (Alekseev and Souissi, 2011; Sukhikh et al., 2013; Lajus et al., 2015), and thus unlikely to have any ecosystem effects (Matthews et al., 2011a). Furthermore, taxonomic classification based on morphology alone is not distinct because some key traits overlap between the two species (Sukhikh et al., 2013; Vasquez et al., 2016) and differentiate between E. affinis populations (Sukhikh et al., 2016). Therefore, we use the E. affinis species name throughout and refer to the E. affinis species complex in the present study.
A previous common garden experiment revealed differences in development time as a response to temperature between Baltic Sea E. affinis populations, where a population from the Gulf of Riga (Pärnu Bay) had similar (12 and 17°C) or shorter (22.5°C) development time than a population from the Swedish coast (Stockholm Archipelago) (Karlsson and Winder, unpublished data). Females from the Gulf of Riga population also appeared to have a larger body size than the Swedish coast population, which was however not quantified. For copepods in general, development time increase with species size and fecundity (Allan, 1976; Gillooly, 2000), thus this large-sized population breaks this norm. The trait differences between the two populations' may affect ecosystem processes, such as differences in prey size spectra, prey selection, and grazing efficiency (Bassar et al., 2010; Walsh et al., 2012; Gianuca et al., 2016).
The aim of this study is to (i) describe and quantify morphology and fecundity in a common garden experiment and (ii) quantify ecosystem responses and reciprocal effects in a common gardening experiment (mesocosms) of these two E. affinis populations from the Baltic Sea. We constructed mesocosm environments with two types of algae (prey) community and two types of resource supplies. To investigate if the described trait differences affect feeding efficiency and algae community, and the reciprocal effects of algae community and resource supply on population growth, female prosome length, and clutch size. Algae community included two treatments one with pelagic species and one with pelagic species plus benthic diatoms, resource supply included two levels of nutrients. The mesocosm experiment lasted for 14 days, which corresponds to approximately one generation time for both populations at the experimental temperature of 17°C (Karlsson and Winder, unpublished data). We hypothesized that populations would differentiate over the algae treatment if they diverged in their feeding behavior and resource specialization, and differentiate over the resource supply treatment if they diverge in their demand for food and feeding efficiency.
2. Materials and Methods
2.1. Sampling and Rearing of Cultures
No specific ethical permits were needed for research on invertebrate crustaceans. This study does not include vulnerable populations and endangered animal species. Populations were sampled in spring 2014 in the Stockholm archipelago at Askö monitoring station B1 (hereafter referred to as STHLM) 58°48.19′,17°37.52′ (latitude, longitude) and in summer 2014 in the Pärnu Bay a shallow inner part of Gulf of Riga (hereafter referred to as GOR) 58°21.67′, 24°30.83' by vertical tow nets. More than 300 adult copepods were taken from the samples and used to start stock cultures. Before measurements of morphology and clutch size (number of eggs), stock cultures were kept for a minimum of three generations to reduce imprints of maternal effects (Sanford and Kelly, 2010) in 3 L (Exo TerraTM) aquariums at 17°C and 7 PSU and fed with the cryptophyte Rhodomonas salina. Aquariums were aeriated by gently stirring the water once a day. Before the mesocosm experiment, cultures were kept for at least three generations in 45 L plastic tubs at 15°C and 7 PSU and fed with the cryptophyte Rhinomonas nottbecki. The two experiments were separated in time by 2 years, from 2014 to 2016 and during this time we predict that approximately 42 generations have past, given a generation time of 17 days at 15°C (Karlsson and Winder, unpublished data).
The zooplankton were at all times kept in tap water that had been circulated for about a week in an aquarium with gravel from a freshwater stream to condition the water for aquatic organisms (reduce chlorine and excessive gas); to adjust the right salinity we used Instant OceanTM sea salt.
2.2. Common Garden Experiment: Measurements of Morphology and Clutch Size
In autumn 2014 we started up 5 cultures per population by taking 10 egg carrying females from our stock cultures into 3 L aquariums with GF/F WhatmanTM filtered aquarium water of 2 PSU. The copepods were fed ad libitum of the cryptophyte Rhodomonas salina (100,000–200,000 cells ml−1). More than 27,000 cells ml−1 did not increase egg production (a proxy for growth in adult female copepods) in Acartia tonsa (Kiørboe et al., 1985) a copepod of similar size as E. affinis. As soon as the daughters of the inoculated females had developed egg sacks they were picked out to be photographed dorsal or ventral side, measured (prosome length), and the number of eggs in each female clutch were counted. We sampled 50 females per population, 10 from each culture.
We measured shape and size of the females' prosomen with 14 landmark data points from the digitized images. To visualize shape of the two populations we ran a principal component analysis with the landmark data (14 x and 14 y coordinates, in pixel units), made by R package geomorph (Adams and Otarola-Castillo, 2013), and depicted the individuals of each population that had minimum and maximum values on principal component 1 (Figures 1, 2). We computed landmarks with the software packages tpsUtil and tpsDig2 (Rohlf, 2011b, 2013). We computed partial warps, uniform variables, and centroids with tpsRegr (Rohlf, 2011a). To test if shape differed between populations we used a MANCOVA with partial warps (11 x and 11 y) and uniform variables (1 x and 1 y) as response, size (centroid of each specimen) was included as covariate, and population as explanatory variable. The centroid size is calculated in pixel units as the square root of the sum of squared landmark distances to the centroid, which is a two-dimensional measure of size (1 pixel correspond to ca 0.89 μm). The interaction of population and size was not significant, thereby we concluded that the size and shape slopes of both populations do not differ, and therefore removed the interaction and use size as covariate (Engqvist, 2005). We used a two-way ANOVA to test the interaction of prosome length and population on clutch size. Furthermore, we followed up this analysis with a one-way ANOVA to test for differences in prosome length between populations.
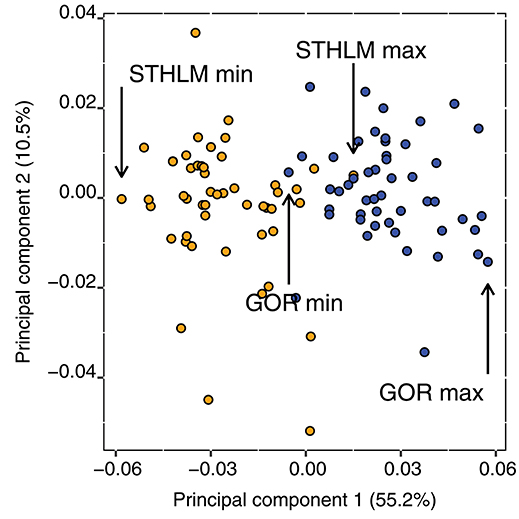
Figure 1. Principal component axes 1 and 2 of shape variation of Procrustes aligned specimens for the STHLM (orange) and GOR (blue) E. affinis populations, individuals with minimum and maximum value on principal component 1 from the respective population are marked out. These individuals are depicted in Figure 2.
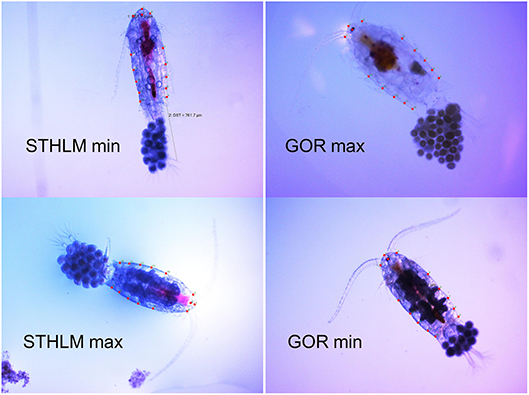
Figure 2. Pictures of E. affinis individuals with minimum and maximum value on principal component 1 from the respective population, these individuals are marked out in Figure 1. Pictures include locations of the 14 landmarks used in the principal component analysis. The prosome lengths of the individuals depicted are 833 and 776 μm for STHLM min and max, and 833 and 923 μm for GOR min and max, respectively. Note that the pictures are meant to show variation in shape and not in size and length. The scale of the pictures are 2,300 μm wide and 1,725 μm high.
2.3. Common Gardening Experiment: Set Up and Treatments
For the common gardening experiment, we used three types of factors each with two levels of treatment: two zooplankton populations (STHLM and GOR), two nutrient treatments (low and high), and two types of algae community (pelagic and pelagic + benthic diatoms). We replicated each factor combination 10 times, summing up to 80 mesocosms (2 × 2 × 2 × 10). For control treatments we used factor combinations of nutrient levels and algae community without zooplankton, replicated 5 times, summing up to 20 control mesocosms (2 × 2 × 5).
The mesocosms were 3 L plastic aquariums (Exo TerraTM) filled with GF/F WhatmanTM filtered aquarium water, placed in a rooftop greenhouse at the Department of Ecology, Environment and Plant Sciences at Stockholm University. The mesocosms received natural light as well as light from metal halide lamps in 12:12 h night:day cycle, with an average 55.8 (range 16.7, 202.1) μmol m−2 s−1 on the bottom of the mesocoms. Average temperature during the experiment was 17.0°C, but oscillated during the night day cycle and was highest just before lamps turned off (average 18.8°C, range 16.8–20.6°C) and lowest just before lights turned on (average 14.9°C, range 13.6–15.9°C). We added nutrients and Instant OceanTM sea salt while the water was separated into two containers one for low and one for high resource supply treatment, water was later portioned out to the mesocosm after thorough mixing. We added 57.6 μmol L−1 SiO4, 28.4 μmol L−1 of NO3, and 2.4 μmoles L−1 PO4 to the high resource supply treatment, for the low nutrient treatment the respective concentrations were 30.6, 12.9, and 1.1 μmol L−1. Ratios of Si:N:P were similar for the high and low resource supply treatment with 24:12:1 and 28:12:1, respectively. We further added micronutrients, B vitamins, and peat extract (Table S1). Concentrations of NO2 + NO3 and SiO4 (Figure S1) were higher than deliberately, suggesting that additional nutrients came into the mesocosm from either the algae or zooplankton cultures. Either way, the contrasts of resource supply treatments were clearly visible and quantifiable. We added salt to reach a salinity of 10 PSU, which was a salinity where both zooplankton and algae could coexist.
The two communities of algae consisted of either five pelagic species or the same pelagic species plus an addition of three benthic species (Table S2). The pelagic species were: the pooled sample of R. nottbecki and R. salina referred to as cryptophytes, Heterocapsa triquetra, Pseudoscourfeldia marina, Skeletonema marinoi, and Isochrysis sp. The benthic species where the pooled sample of Nitzschia aurariae and Navicula perminuta, Melosira sp., and Fragilaria sp. We selected algae species that belonged to some of the commonly found taxonomic classes in the Baltic Sea, with the compromise that they should be readily cultured in lab conditions on the same growth media (Table S1) and at the same salinity (10 PSU). We added the pelagic species in equal amounts to all mesocosms and the benthic species in equal amounts to half of the mesocosms. Therefore, at the beginning of the experiment the benthic treatment contained more food than the pelagic, but over time the amount of food was constrained to the concentration of nutrients. We inoculated the mesocosms by adding 1 ml from the same homogenized culture to each mesocosm for each species of algae. The inoculation concentrations were measured on the start day (October 4th) from Lugol-preserved samples diluted 10 times and placed in a tubular plankton chamber. We then took pictures by inverted light microscopy at specific locations in the chamber and calculated the number of cells per picture by EBImage R package (Pau et al., 2010), these numbers were calculated back to cells ml−1 algae ml−1 algae culture (Table S2).
One day after mesocosm setup, we added zooplankton from the stock cultures that consisted of similar ratios of nauplii, copepodites, and adults for both populations. Zooplankton were added by taking aliquots of the thoroughly mixed stock cultures to each mesocosm. We added slightly less individuals from the GOR population since these individuals are larger to get similar zooplankton bio-volumes for both populations. Aliquots (n =10) of the starting concentrations for each population were put in 4% formalin to be counted and measured. For these samples we counted the number of nauplii in stage 1–3 and 4–6 and copepodites in stage 1–3 and 4–6 (where stage 6 are the adults), and made measurements of length, width, and depth of the prosome body for all individual life stages. We then calculated the average bio-volume for an individual within one of these four groups by using the volume of an ellipse and multiplied the bio-volume with the number of individuals in the corresponding life-stage interval. Subsequently, we used the bio-volume sum in each sample to test if initial volumes were different for the two populations by a t-test.
2.4. Common Gardening Experiment: Sampling and Sample Analysis
We took two types of algae samples, one to measure relative fluorescence units (RFU) and one to count and identify the algae. We took samples directly after the mesocosms were gently stirred. RFU samples were measured in a TrilogyTM fluorometer (Turner design), samples for counts were preserved in acidic Lugol, and were counted with an inverted light microscope.
We counted cryptophytes, H. triquetra, Fragilaria sp., and Melosira sp. in continuous transects (field of view) over the full diameter of the chamber at 100 times magnification. We counted N. aurariae and N. perminuta in a continuous transect in 400 times magnification, and the smallest species P. marina, Isochrysis sp., and S. marinoi in 20 fields of view in a transect at 1,000 times magnification. We took samples of both RFU and Lugol on day 2, 6, 10, and 14. For RFU we measured all 100 mesocoms at each sampling occasion. Samples for counts of the pelagic species were 5, 2, 5, and 2 samples per treatment combination (including controls) and respective day. Samples for counts of the benthic species were 5, 2, 5, and 2 per treatment combination of the controls; and 5, 4, 7, and 2 per treatment combination with zooplankton.
At the same days as algae sampling we took two samples per treatment combination of free phosphate (PO4), nitrite + nitrate (NO2 + NO3), ammonia (NH4), and silicate (SiO4) by filtering 10 ml water through a 0.45 μm filter and then analyzing the filtrate in a segmented flow analysis (Figure S1).
At the end of the experiment on day 15 (14 days after copepod innoculation), which corresponds to the development time for one generation (given ad libitum food conditions and 17°C, Karlsson and Winder, unpublished data), the mesocosms were poured through a 45 μm net and all inhabiting zooplankton were filtered out and put in 4% formalin. From these samples we counted the number of nauplii and the pooled number of copepodites and adults. Two egg-carrying females from each sample (mesocosm) were picked at random and their prosome lengths were measured and clutch size counted. We expected the nauplii to have been born in the mesocosm during the experiment, and that the copepodites and adults mainly to be part of the individuals inoculated at the beginning.
2.5. Statistical Analyses of the Common Gardening Experiment
We used R for all analyzes (R Core Team, 2017). The response variables: counts of nauplii (N1-N6) and copepodites + adults (C1-C6), prosome length of females, and female clutch size, were fitted as Gaussian response models by functions lme or gls from the nlme (Pinheiro et al., 2017) package. When there was more than one observation per mesocosm we used mesocosm ID as random effect in the linear mixed effect models (lme), and when variances in the different treatments were unequal we fitted extended linear models with power covariates in the linear models (gls). Models were evaluated by starting with a full model containing all treatment interactions (population, algae, and nutrients) and subsequently removing non-significant interactions, based on AIC. We only included the highest order of significant interactions or main effects in the running text, full model outputs can be found in the Supplementary Material.
RFU and species counts were analyzed by extended linear mixed models (function lme), with power covariates to control for the increasing residual variation due to algal growth. For both RFU and species counts we omitted the control to test for the difference between populations. The pelagic species occurred both with and without benthic diatoms, whereas the benthic diatoms only occurred with pelagic species, and hence the main effect of the addition of benthic diatoms was only estimated for the pelagic species. The RFU analysis was split up between pelagic and pelagic + benthic algae treatments as we expected the emitted fluorescence to differ between pelagic flagellates and benthic diatoms, and therefore a direct comparison could be spurious. The effects of resource supply were estimated for both RFU and species counts. We included a third degree polynomial of time as an interaction with the treatments (population, algae, resource supply) in both the RFU and the species counts models. This tests if the polynomial relationship with time differs between treatment contrasts. However, we did not include the estimates of the treatment main effects (i.e., time = 0), and the main effect of time in the results as it is not the focus of this study.
3. Results
3.1. Common Garden Experiment: Morphology and Clutch Size
The shape of the females prosomen differed significantly between the populations [MANCOVA, F(24, 74) = 5.19, p < 0.001] the GOR population was wider and rounder than the more laterally compressed STHLM population (Figures 1, 2) and the size of the prosomen had no significant effect on shape [MANCOVA, F(24, 74) = 1.51, p = 0.090].
We found a significant interaction of population and prosome length on clutch size [two-way ANOVA, F(1, 96) = 6.68, p = 0.011]. Hence, the relationship between prosome length and clutch size differs between the two populations (Figure 3), and a 1 μm increase in length increased clutch size with 0.25 and 0.09 eggs for the GOR and STHLM populations respectively. Furthermore, the main effects of population [two-way ANOVA, F(1, 96) = 48.06, p < 0.001] and prosome length [two-way ANOVA, F(1, 96) = 25.64, p < 0.001] were significant, the average clutch sizes were 34.6 (28.1, 41.0; 95% CI) for the STHLM population and 54.4 (49.8, 58.9) eggs female−1 for the GOR population. Furthermore, the females' prosome length differed between populations [one-way ANOVA, F(1, 98) = 124, p < 0.001] and was on average 762.1 (743.1, 781.1; 95% CI) for the STHLM population and 869.8 (856.4, 883.3) μm for the GOR population.
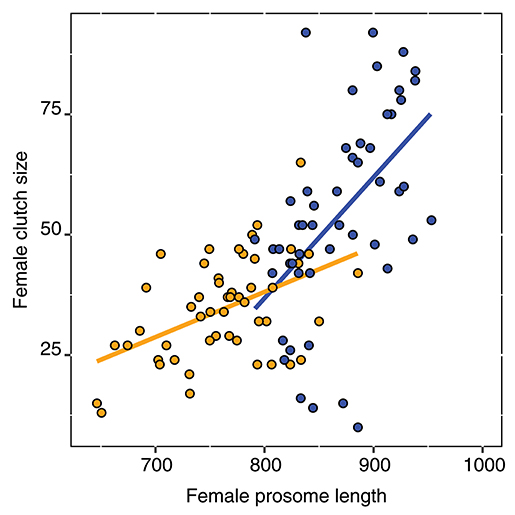
Figure 3. Relationship of female clutch sizes and prosome lengths for the STHLM (orange) and GOR (blue) E. affinis populations. Points are observed values and lines are fitted values from a two-way analysis of variance.
3.2. Common Gardening Experiment
The averages of zooplankton bio-volumes at the start of the experiment were not significantly different between the populations [t-test, t(18) = -0.541, p = 0.595] and was 3.08 (± 0.24, SE) for the STHLM population and 2.91 (± 0.22) mm-3 for the GOR population. Number of individuals per stage at the start of the experiment (averages rounded to whole numbers) were for the STHLM population, N1-N3: 105 (86–116, range), N4-N6: 10 (3–22), C1-C3: 9 (1–17), C4-C6: 30 (18–49). Respective numbers for the GOR population were, N1-N3: 69 (51–92), N4-N6: 28 (15–38), C1-C3: 14 (5–20) and C4-C6: 17 (10–27).
Algae concentrations measured as RFU were significantly lower with the GOR population than with the STHLM population. The lower values for the GOR population were consistent over both resource supply and algae treatments, suggesting that this population is a more efficient grazer than the STHLM population (Figure 4, Table 1).
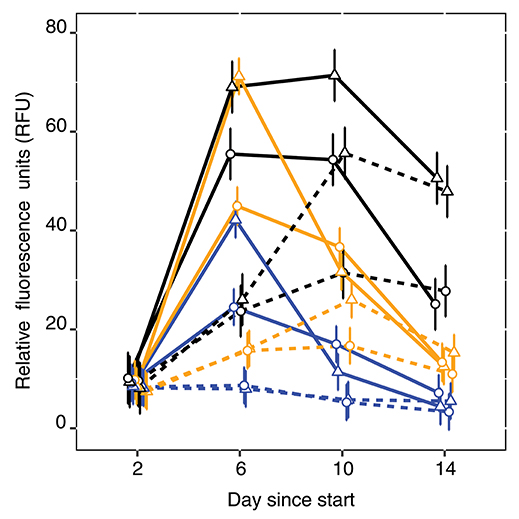
Figure 4. Relative fluorescence units as proxy for algal biomass for the control (black), STHLM (orange) and GOR (blue) E. affinis populations. Solid and dotted lines are respective high and low nutrient treatments, triangles and circles are respective pelagic and benthic treatments. Estimates and 95% CI are fitted by restricted maximum likelihood.
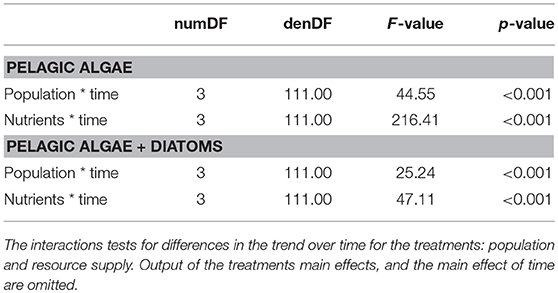
Table 1. ANOVA output from the mixed models on the relative fluorescence units.
Concentrations of all the pelagic species (cryptophytes, H. triquetra, Isochrysis sp., and P. marina) were significantly lower with the GOR population than the STHLM population, whereas for S. marinoi there was no difference between the populations (Figure 5, Table 2). Concentrations of the large filamentous benthic diatoms Fragilaria sp. and Melosira sp. did not differ between the populations, while the smaller single celled benthic diatoms N. aurariae + N. perminuta were significantly lower with the GOR population than the STHLM population (Figure 5, Table 3).
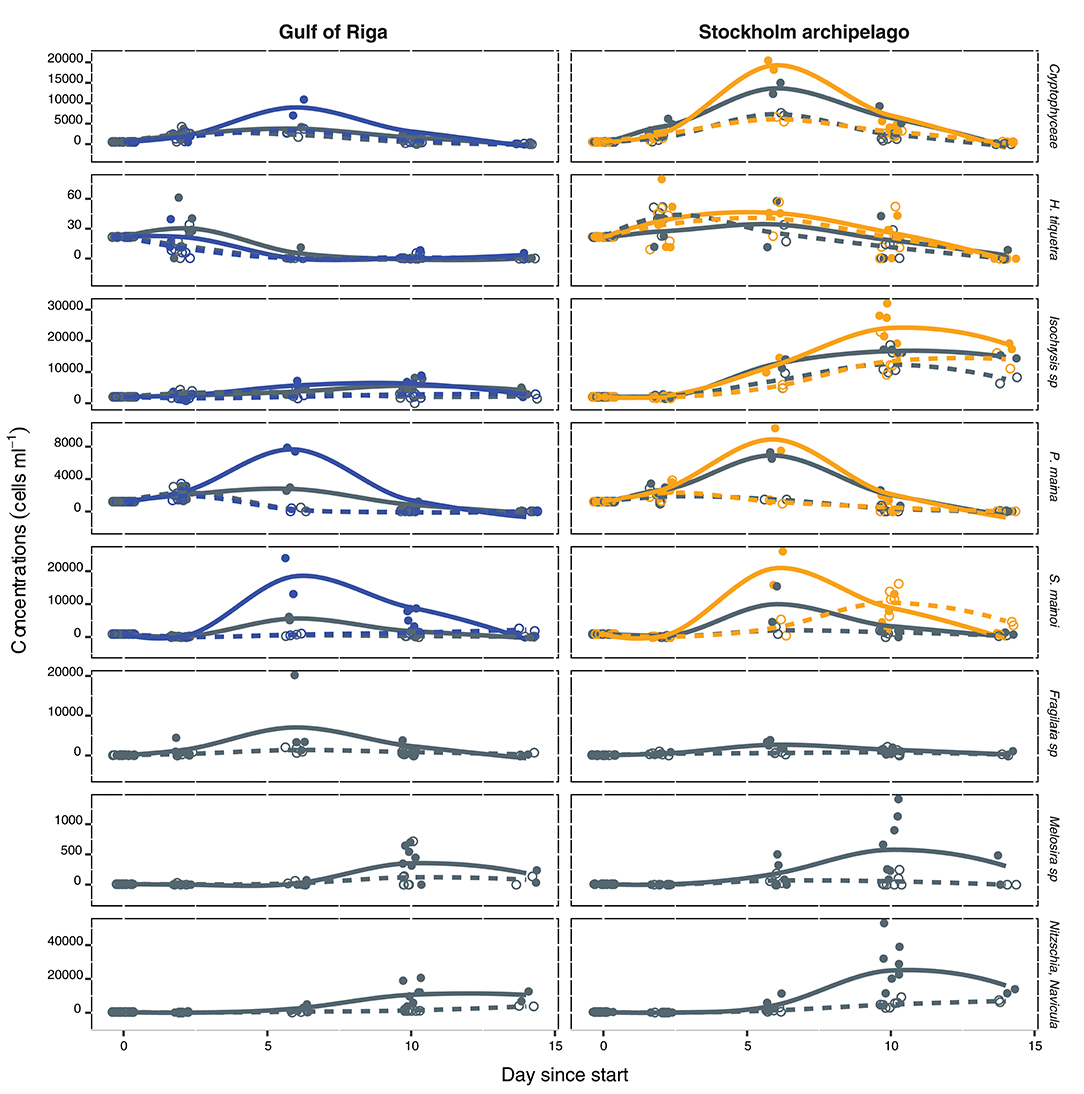
Figure 5. Concentrations in cells ml−1 of the different algae species over time (days) in the common gardening experiment, for the treatments: algae community, nutrient level, and zooplankton population, figure head shows the E. affinis populations. Color, line-type, and point shape codes are: blue and orange are respective GOR and STHLM population in the pelagic algae treatment, gray is the pelagic + benthic diatom treatment (same for both populations), solid and dashed lines are respective high and low nutrient treatment, filled and open circles are respective high and low nutrient treatment. Lines are fitted by local regression by the R package ggplot2 (Wickham, 2009), points are observed values.
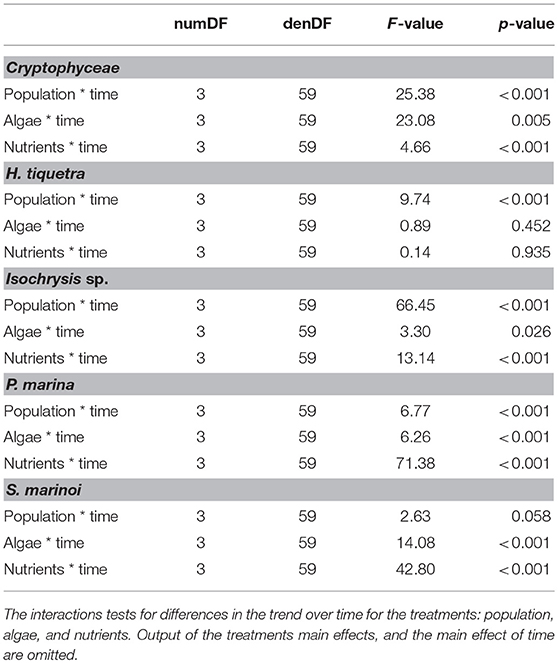
Table 2. ANOVA output from the mixed models on the pelagic algae.
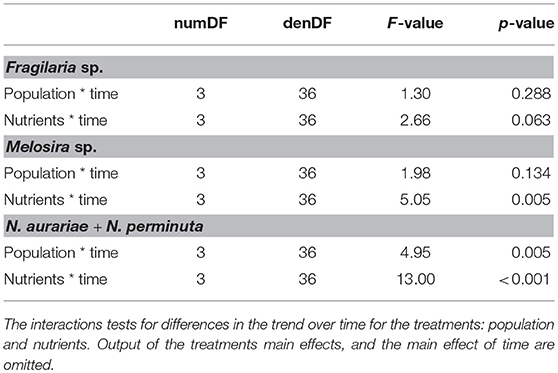
Table 3. ANOVA output from the mixed models on the benthic algae.
The addition of benthic diatoms had a negative effects on the concentrations of all the pelagic species except H. triquetra (Figure 5, Table 2). Addition of nutrients had positive effects on the concentrations of all species except H. triquetra and Fragilaria sp. (Figure 5, Tables 2, 3).
The numbers of nauplii at the end of the experiment depended on the interaction of algae treatment and population [t(5, 72) = 3.15, p = 0.002] and on the interaction of population and resource supply [t(5, 72) = 2.66, p = 0.001]. The GOR population was more negatively affected by benthic algae than the STHLM population, and the STHLM population was more negatively affected by low resource supplies (Figure 6A, Table S3).
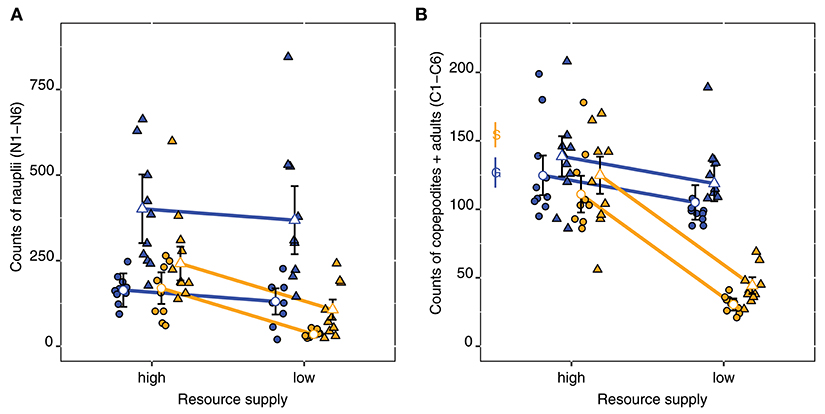
Figure 6. Nauplii (A) and copepodites + adults (B) counts for the STHLM (orange) and GOR (blue) E. affinis populations at the end of the experiment. Triangles and circles are respective pelagic and benthic treatments, the resource supply treatment is shown on the x-axis. Estimates and 95% CI are from generalized least square models fitted with a power covariate to control for unequal variances. Observations are included as points. In (B) average number of individuals at start are shown with 95% CI for the STHLM and GOR populations, denoted by the letters S and G.
For copepodites + adults we found a significant interaction of population origin and resource supply [t(4, 73) = 5.24, p < 0.001], where low resources led to a striking decrease in numbers for the STHLM population, but not for the GOR population. Furthermore, we found a significant main effect of algae treatment [t(4, 73) = 3.88, p < 0.001] indicating that the addition of benthic diatoms had weak negative effects for both populations (Figure 6B, Table S4).
The females clutch sizes depended on the three-way interaction of population x resource supply x algae [t(69) = 3.02, p = 0.004]. For the STHLM population, clutch sizes were unaffected by algae treatment but smaller in low resource supply. For the GOR population, clutch sizes differed between algae treatments in low resource supplies (Figure 7A, Table S5). For female prosome length (Figure 7B) we found no interactive effects, but both the main effects of population [t(74) = 14.45, p < 0.001] and resource supply were significant [t(74) = 3.87, p < 0.001], whereas the effect of algae was not [t(74) = 0.19 p = 0.848]. Females were generally smaller in the STHLM population compared to the GOR population, and in low resource supply compared to high resource supply.
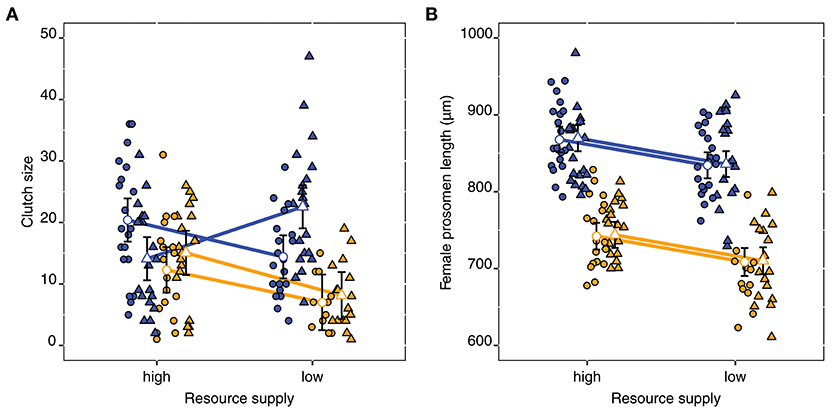
Figure 7. Clutch sizes (A) and females prosome lengths (B) for the STHLM (orange) and the GOR (blue) E. affinis populations at the end of the experiment. Triangles and circles are respective pelagic and benthic treatments, the resource supply treatment is shown on the x-axis. Observations are included as points. Estimates and 95% CI are fitted by restricted maximum likelihood.
4. Discussion
In the common garden experiment we could show that the two E. affinis populations from the Baltic Sea differentiate genetically in female morphology and clutch size. These trait differences further affect how the populations interact with various experimental ecosystems. In general, the small-sized STHLM population was more sensitive to resource supply, whereas the large-sized GOR population was more sensitive to the type of algal community.
4.1. Common Garden Experiment: Morphology and Clutch Size
The two populations clearly differentiated in females' average shape, length, and clutch size. The differences in average length persisted from the first common garden experiment and throughout the mesocosm experiment made 2 years and ca 42 generations later. Thus, there should be little doubt that these differences are due to genetic differentiation. A previous study by Winkler et al. (2011) found neutral (mitochondrial DNA) genetic differentiation between populations from the Gulf of Riga and the Swedish Baltic coast. Our study confirms this by showing genetic differentiation in quantitative traits. There were however large individual variation within populations and individuals from the two populations overlap in shape, length and clutch size. This large morphological variation implies that whenever these two morphotypes coexists complete discrimination of the two will be difficult. The morphological variation in E. affinis has led to previous confusion in species classification. In Northern European estuaries two species of Eurytemora were described in the nineteenth century, E. affinis (Poppe, 1880) and E. hirundoides (Nordqvist, 1888). According to the taxonomic key provided by Gurney (1931) the small-sized population from the Stockholm Archipelago (STHLM) corresponds to a morphotype that was described as E. hirundoides. Our study shows that classification of Eurytemora by prosome length and fecundity can be spurious. Because these traits overlap between individuals even in genetically distinct populations in a controlled environment. Furthermore, prosome length and egg production in zooplankton are highly plastic traits that can be affected by both food conditions and temperature (Ban, 1994), which can further impede discrimination of the two populations unless they are reared under common conditions (Falconer and Mackay, 1996; Sanford and Kelly, 2010).
4.2. Common Gardening Experiment
Based on the populations different effect on RFU we concluded that the GOR population were more efficient grazers than the STHLM population, which was expected because of their larger size. We found that the pelagic flagellates and the benthic diatoms N. aurariae + N. perminuta were in lower concentrations with the GOR population than with the STHLM population. Whereas there was no difference in the concentration of the pelagic diatom S. marinoi between populations. Perhaps this is due to that motile flagellates can escape the copepods feeding current (Jakobsen, 2002) whereas non-motile diatoms probably cannot. In general, larger copepods have a stronger feeding current (Peters and Downing, 1984) which could be harder for flagellates to evade and explain why the GOR population is more efficient in feeding on flagellates. Given that N. aurariae + N. perminuta settle on the bottom, their lower concentrations with the GOR population suggest that this population occupy the bottom of the mesocosms to a greater extent than the STHLM population. Furthermore, the concentrations of the two largest filamentous diatoms Melosira sp. and Fragilaria sp. did not differ between the populations. Our results suggest that there is no difference in the size spectrum of resource use between the populations, despite the populations' difference in size.
We found contrasting effects on the amount of nauplii and copepodites + adults for the two populations at the end of the experiment, which depended on resource supply and algae treatment. The large-sized GOR population was a more efficient grazer and could therefore acquire the amount of resources needed even in low resource concentrations, which allowed them to maintain a similar population size in both high and low resource supply (Figure 4). In contrast, for the small-sized STHLM population, less resources resulted in a notable decrease in nauplii and copepodites + adults (Figures 6A,B). Larger animals are in general more efficient in resource acquisition and can feed on a wider size range of resources than smaller ones (Wilson, 1975; Gianuca et al., 2016), therefore the GOR population have a competitive advantage over the STHLM population. The STHLM population starved in the low nutrient treatment, probably because metabolic demand relative to body size is higher for smaller-sized zooplankton (Hansen et al., 1997), while both filtration and feeding rates of zooplankton increase with increasing size (Peters and Downing, 1984; Gianuca et al., 2016). Thus, the STHLM population acquires fewer resources while needing relatively more, and hence performs poorly at low resource concentrations. Our results suggest that a larger body size enables copepods to graze more efficiently and mitigate starvation at low resource concentrations.
The addition of benthic diatoms had a greater effect on the number of nauplii than on the number of copepodites + adults, with a stronger negative effect in the presence of benthic diatoms for the GOR population than for the STHLM population. For calanoid copepods feeding on large aggregates is difficult compared to smaller particled food and can result in starvation (Koski et al., 2017). Thus, large filamentous diatoms may have disturbed the feeding process and reduced the copepods feeding efficiency. Because the GOR population was more negatively affected by benthic diatoms than the STHLM population, it suggests that females of the GOR population feed more from the bottom of the mesocosm where the filaments settled.
Differences in habitat use of E. affinis populations have been reported in the past and according to Gurney (1931) the GOR morphotype corresponds to “Buchtenplankton" (bay plankton) while the STHLM morphotype corresponds to “Kustenplankton" (coastal plankton). This is in agreement with the habitats where the populations were sampled. Similarly, two clades of E. affinis are reported from the St. Lawrence estuary. One clade mainly inhabits the inner reaches of the estuary and has invaded the Great Lakes (Winkler et al., 2008; Favier and Winkler, 2014), and has been reported as epi-benthic in the lakes (Torke, 2001). The clade in the Great Lakes have been classified as E. carolleeae by Vasquez et al. (2016). The other clade in St. Lawrence is mainly found in the middle parts of the estuary, suggesting that it occupies the pelagic habitat (Winkler et al., 2008; Favier and Winkler, 2014). Furthermore, epi-benthic zooplankton are often larger than pelagic zooplankton because a large size in a pelagic habitat increases the risk of predation by planktivorous fish (Brooks and Dodson, 1965). For the GOR population the larger sized females are likely prevented to enter the pelagic because of their conspicuousness, while nauplii and copepodites in the low stages likely stay closer to the surface, which is the general pattern for copepods (Irigoien et al., 2004; Casper and Thorp, 2007). This suggests that apart from morphological differences, the populations' behavior also differ.
Comparisons showed considerably smaller female clutch sizes of a European E. affinis population from the Seine than of two North American east coast populations assumed to be E. carolleeae from the St. Lawrence and the Chesapeake Bay (Beyrend-Dur et al., 2009; Devreker et al., 2012). Hence, the larger clutch size and epi-benthic behavior of the GOR population, similar to what has been reported in North American clades, suggest that this population could be the invasive E. carolleeae. In contrast, similar trait differences as observed in the present study have been reported between European E. affinis populations since the beginning of the 20th century (Gurney, 1931 and references therein, Sukhikh et al., 2016). The species name E. carolleeae has not been fully applied by researchers in the field. Regardless, if one categorize the E. affinis complex into clades (e.g., Favier and Winkler, 2014; Lee, 2016) or species (e.g., Sukhikh et al., 2013), it is important to focus on the contrasting ecological effects (e.g., freshwater invasions, habitat preferences) of adaptive variation within the E. affinis species complex.
Competition for nutrients between benthic diatoms and flagellates led to lower concentrations of flagellated species. However, we do not believe the lower concentrations of flagellates in the benthic algae treatment is the cause for the decline in nauplii for the GOR population. Because the resource supply treatment had no effect even in the treatments without benthic diatoms (Figure 6A). In contrast, the STHLM population was sensitive to resource supply, and for this population a reduction in flagellates caused by competition with benthic diatoms could explain why the nauplii count is lower when benthic diatoms were added.
4.3. Conclusion
Our study indicates that the large-sized GOR population of E. affinis is a superior competitor in low resource supply mainly because they can feed more efficiently on motile flagellates, than the small-sized population. However, when the resource supply is high and benthic diatoms are present, their competitive advantage disappears. We suggest that the benthic diatoms used in our study interfere in the feeding process and reduce their filtration efficiency. These results suggest that the GOR population exhibits a close relation to benthic habitats and that this morphotype is mainly found in shallow bay areas of the Baltic Sea. Apart from the morphological differences, the populations diverge in habitat choice rather than in resource specialization. We suggest that adaptive radiation in resource use is not the driver of morphological variation in E. affinis, but rather the trade-off between size-efficiency and vulnerability to predators. Perhaps the GOR population can afford to have a larger size because the adults stay close to the bottom. An important question for further research is to address the effects of planktivorous fish on zooplankton of different size and behavior, in pelagic vs. benthic habitats. This would highlight if the shallow littoral zone acts as a refugium for large epi-benthic morphotypes of E. affinis, whereas smaller morphotypes inhabit the coastal pelagic waters.
The past and current eutrophic state of the Baltic Sea (Andersen et al., 2017) may have been more advantageous for the small-sized STHLM population than the large-sized GOR population because the small-sized population has a positive response to increased resource supply. In addition eutrophication has reduced the extent of the littoral zone (Ojaveer et al., 2010) and thus the habitat for the larger-sized population. Given the area of suitable habitats, we assume that the small-sized population is by far the most common in the Baltic Sea. For example, we have only found the small-sized morphotype (i.e., none of the large extremes indicates a large-size morphotype) in samples from the central parts of Bothnian Bay, Bothnian Sea, Gulf of Finland, Gulf of Riga and the Baltic Proper (Karlsson, personal observation). We speculate that the large-sized morphotype is not unique to the Pärnu Bay in the Gulf of Riga, but can probably be found in similar shallow bays with outlets of freshwater along the eastern and southern Baltic Proper.
Our results show that morphologically divergent, yet phylogenetically closely related zooplankton populations can have different effects on ecosystem functions, and in turn have different population increase in response to resource supply and algae community. These results underline that the two E. affinis morphotypes cannot be regarded as ecologically equal in their interaction with algae communities. Furthermore, their different habitat choice implies that the pelagic morphotype are more important for pelagic feeding fish such as herring and sprat, whereas the benthic morphotype is more important for fish species that feed in more complex littoral habitats such as perch and sticklebacks. This highlights the large morphological and life history variation in the E. affinis species complex and that populations affect ecosystem properties in different ways.
Data Availability Statement
The raw data supporting the conclusions of this manuscript will be made available by the authors, without undue reservation, to any qualified researcher.
Author Contributions
KK performed the experiments, analyzed the data, and wrote a first draft of the manuscript. KK and MW wrote the manuscript.
Funding
This is a contribution to the BONUS BIO-C3 project and was supported by BONUS (Art 185), funded jointly by the EU and the Swedish Research Council FORMAS.
Conflict of Interest Statement
The authors declare that the research was conducted in the absence of any commercial or financial relationships that could be construed as a potential conflict of interest.
Acknowledgments
We thank Marilyn Kalaus and Henn Ojaveer for field collection of zooplankton, and Erika Hedlund for taking mesocosm samples. We thank the two reviewers for their comments, which improved an earlier version of this manuscript.
Supplementary Material
The Supplementary Material for this article can be found online at: https://www.frontiersin.org/articles/10.3389/fmars.2018.00408/full#supplementary-material
References
Adams, D., and Otarola-Castillo, E. (2013). geomorph: an r package for the collection and analysis of geometric morphometric shape data. Methods Ecol. Evol. 4, 393–399. doi: 10.1111/2041-210X.12035
Alekseev, V. R., and Souissi, A. (2011). A new species within the eurytemora affinis complex (copepoda: Calanoida) from the atlantic coast of usa, with observations on eight morphologically different european populations. Zootaxa 2767, 41–56.
Allan, J. D. (1976). Life history patterns in zooplankton. Am. Nat. 110, 165–180. doi: 10.1086/283056
Andersen, J. H., Carstensen, J., Conley, D. J., Dromph, K., Fleming-Lehtinen, V., Gustafsson, B. G., et al. (2017). Long-term temporal and spatial trends in eutrophication status of the baltic sea. Biol. Rev. 92, 135–149. doi: 10.1111/brv.12221
Ban, S. (1994). Effect of temperature and food concentration on post-embryonic development, egg production and adult body size of calanoid copepod eurytemora affinis. J. Plankton Res. 16, 721–735. doi: 10.1093/plankt/16.6.721
Bassar, R. D., Marshall, M. C., López-Sepulcre, A., Zandonà, E., Auer, S. K., Travis, J., et al. (2010). Local adaptation in trinidadian guppies alters ecosystem processes. Proc. Natl. Acad. Sci. U.S.A. 107, 3616–3621. doi: 10.1073/pnas.0908023107
Becks, L., Ellner, S. P., Jones, L. E., and Hairston Jr, N. G. (2010). Reduction of adaptive genetic diversity radically alters eco-evolutionary community dynamics. Ecol. Lett. 13, 989–997. doi: 10.1111/j.1461-0248.2010.01490.x
Beyrend-Dur, D., Souissi, S., Devreker, D., Winkler, G., and Hwang, J -S. (2009). Life cycle traits of two transatlantic populations of eurytemora affinis (copepoda: Calanoida): salinity effects. J. Plankton Res. 31, 713–728. doi: 10.1093/plankt/fbp020
Bolnick, D. I., Svanbäck, R., Fordyce, J. A., Yang, L. H., Davis, J. M., Hulsey, C. D., et al. (2002). The ecology of individuals: incidence and implications of individual specialization. Am. Nat. 161, 1–28. doi: 10.1086/343878
Brooks, J. L., and Dodson, S. I. (1965). Predation, body size, and composition of plankton. Science 150, 28–35. doi: 10.1126/science.150.3692.28
Casper, A. F., and Thorp, J. H. (2007). Diel and lateral patterns of zooplankton distribution in the st. lawrence river. River Res. Appl. 23, 73–85. doi: 10.1002/rra.966
Colina, M., Calliari, D., Carballo, C., and Kruk, C. (2016). A trait-based approach to summarize zooplankton–phytoplankton interactions in freshwaters. Hydrobiologia 767, 221–233. doi: 10.1007/s10750-015-2503-y
Devreker, D., Pierson, J. J., Souissi, S., Kimmel, D. G., and Roman, M. R. (2012). An experimental approach to estimate egg production and development rate of the calanoid copepod eurytemora affinis in chesapeake bay, usa. J. Exp. Mar. Biol. Ecol. 416, 72–83. doi: 10.1016/j.jembe.2012.02.010
Diekmann, A. B. S., Clemmesen, C., John, M. A. S., Paulsen, M., and Peck, M. A. (2012). Environmental cues and constraints affecting the seasonality of dominant calanoid copepods in brackish, coastal waters: a case study of acartia, temora and eurytemora species in the south-west baltic. Mar. Biol. 159, 2399–2414. doi: 10.1007/s00227-012-1955-0
Engqvist, L. (2005). The mistreatment of covariate interaction terms in linear model analyses of behavioural and evolutionary ecology studies. Anim. Behav. 70, 967–971. doi: 10.1016/j.anbehav.2005.01.016
Falconer, D. S., and Mackay, T. F. C. (1996). Introduction to Quantitative Genetics, 4th Edn. Harlow: Longman.
Favier, J -B., and Winkler, G. (2014). Coexistence, distribution patterns and habitat utilization of the sibling species complex eurytemora affinis in the st lawrence estuarine transition zone. J. Plankton Res. 36, 1247–1261. doi: 10.1093/plankt/fbu063
Gianuca, A. T., Pantel, J. H., and De Meester, L. (2016). Disentangling the effect of body size and phylogenetic distances on zooplankton top-down control of algae. Proc. R. Soc. B 283:20160487. doi: 10.1098/rspb.2016.0487
Gillooly, J. F. (2000). Effect of body size and temperature on generation time in zooplankton. J. Plankton Res. 22, 241–251. doi: 10.1093/plankt/22.2.241
Hansen, P. J., Bjørnsen, P. K., and Hansen, B. W. (1997). Zooplankton grazing and growth: scaling within the 2-2,-μm body size range. Limnol. Oceanogr. 42, 687–704. doi: 10.4319/lo.1997.42.4.0687
Harmon, L. J., Matthews, B., Des Roches, S., Chase, J. M., Shurin, J. B., and Schluter, D. (2009). Evolutionary diversification in stickleback affects ecosystem functioning. Nature 458, 1167–1170. doi: 10.1038/nature07974
Hernroth, L., and Ackefors, H. (1979). The zooplankton of the baltic proper: a long-term investigation of the fauna, its biology and ecology. Swed. Board Fish. Inst. Mar. Res. 20:60.
Hooper, D. U., Chapin, F., Ewel, J., Hector, A., Inchausti, P., Lavorel, S., et al. (2005). Effects of biodiversity on ecosystem functioning: a consensus of current knowledge. Ecol. Monogr. 75, 3–35. doi: 10.1890/04-0922
Irigoien, X., Conway, D. V., and Harris, R. P. (2004). Flexible diel vertical migration behaviour of zooplankton in the irish sea. Mar. Ecol. Progr. Ser. 267, 85–97. doi: 10.3354/meps267085
Jakobsen, H. H. (2002). Escape of protists in predator-generated feeding currents. Aquat. Microb. Ecol. 26, 271–281. doi: 10.3354/ame026271
Kiørboe, T., Møhlenberg, F., and Hamburger, K. (1985). Bioenergetics of the planktonic copepod acartia tonsa: relation between feeding, egg production and respiration, and composition of specific dynamic action. Mar. Ecol. Progr. Ser. 26, 85–97. doi: 10.3354/meps026085
Koski, M., Boutorh, J., and de la Rocha, C. (2017). Feeding on dispersed vs. aggregated particles: the effect of zooplankton feeding behavior on vertical flux. PLoS ONE 12:e0177958. doi: 10.1371/journal.pone.0177958
Lajus, D., Sukhikh, N., and Alekseev, V. (2015). Cryptic or pseudocryptic: can morphological methods inform copepod taxonomy? An analysis of publications and a case study of the eurytemora affinis species complex. Ecol. Evol. 5, 2374–2385. doi: 10.1002/ece3.1521
Lee, C. E. (2000). Global phylogeography of a cryptic copepod species complex and reproductive isolation between genetically proximate “populations”. Evolution 54, 2014–2027. doi: 10.1111/j.0014-3820.2000.tb01245.x
Lee, C. E. (2016). Evolutionary mechanisms of habitat invasions, using the copepod eurytemora affinis as a model system. Evol. Appl. 9, 248–270. doi: 10.1111/eva.12334
Lee, C. E., and Frost, B. W. (2002). Morphological stasis in the eurytemora affinis species complex (copepoda: Temoridae). Hydrobiologia 480, 111–128. doi: 10.1023/A:1021293203512
Litchman, E., Ohman, M. D., and Kiørboe, T. (2013). Trait-based approaches to zooplankton communities. J. Plankton Res. 35, 473–484. doi: 10.1093/plankt/fbt019
Lundsgaard-Hansen, B., Matthews, B., and Seehausen, O. (2014). Ecological speciation and phenotypic plasticity affect ecosystems. Ecology 95, 2723–2735. doi: 10.1890/13-2338.1
Marklund, M. H., Svanbäck, R., Zha, Y., Scharnweber, K., and Eklöv, P. (2018). The influence of habitat accessibility on the dietary and morphological specialisation of an aquatic predator. Oikos 127, 160–169. doi: 10.1111/oik.04094
Matthews, B., De Meester, L., Jones, C. G., Ibelings, B. W., Bouma, T. J., Nuutinen, V., et al. (2014). Under niche construction: an operational bridge between ecology, evolution, and ecosystem science. Ecol. Monogr. 84, 245–263. doi: 10.1890/13-0953.1
Matthews, B., Hausch, S., Winter, C., Suttle, C. A., and Shurin, J. B. (2011a). Contrasting ecosystem-effects of morphologically similar copepods. PLoS ONE 6:e26700. doi: 10.1371/journal.pone.0026700
Matthews, B., Narwani, A., Hausch, S., Nonaka, E., Peter, H., Yamamichi, M., et al. (2011b). Toward an integration of evolutionary biology and ecosystem science. Ecol. Lett. 14, 690–701. doi: 10.1111/j.1461-0248.2011.01627.x
Nordqvist, O. (1888). Die Calaniden Finlands, Vol. 47. Helsingfors: Druckerei der Finnischen Litteratur-Gesellschaft.
Ojaveer, H., Jaanus, A., MacKenzie, B. R., Martin, G., Olenin, S., Radziejewska, T., et al. (2010). Status of biodiversity in the baltic sea. PLoS ONE 5:e12467. doi: 10.1371/journal.pone.0012467
Palkovacs, E. P., and Post, D. M. (2009). Experimental evidence that phenotypic divergence in predators drives community divergence in prey. Ecology 90, 300–305. doi: 10.1890/08-1673.1
Pantel, J. H., Duvivier, C., and Meester, L. D. (2015). Rapid local adaptation mediates zooplankton community assembly in experimental mesocosms. Ecol. Lett. 18, 992–1000. doi: 10.1111/ele.12480
Pau, G., Fuchs, F., Sklyar, O., Boutros, M., and Huber, W. (2010). Ebimage—an R package for image processing with applications to cellular phenotypes. Bioinformatics 26, 979–981. doi: 10.1093/bioinformatics/btq046
Peters, R. H., and Downing, J. A. (1984). Empirical analysis of zooplankton filtering and feeding rates. Limnol. Oceanogr. 29, 763–784. doi: 10.4319/lo.1984.29.4.0763
Pinheiro, J., Bates, D., DebRoy, S., Sarkar, D., and R Core Team (2017). nlme: Linear and Nonlinear Mixed Effects Models. R package version 3.1-131.
Poppe, S. A. (1880). Über eine neue art der calaniden-gattung Temora, Baird. Abhandlungen-Naturwissenschaftlichen Verein zu Bremen. 7, 55–60.
Post, D. M., and Palkovacs, E. P. (2009). Eco-evolutionary feedbacks in community and ecosystem ecology: interactions between the ecological theatre and the evolutionary play. Proc. R. Soc. B 364, 1629–1640. doi: 10.1098/rstb.2009.0012
Quevedo, M., Svanbäck, R., and Eklöv, P. (2009). Intrapopulation niche partitioning in a generalist predator limits food web connectivity. Ecology 90, 2263–2274. doi: 10.1890/07-1580.1
R Core Team (2017). R: A Language and Environment for Statistical Computing. Vienna: R Foundation for Statistical Computing.
Rajasilta, M., Hänninen, J., and Vuorinen, I. (2014). Decreasing salinity improves the feeding conditions of the baltic herring (clupea harengus membras) during spring in the bothnian sea, northern baltic. ICES J. Mar. Sci. 71, 1148–1152. doi: 10.1093/icesjms/fsu047
Rohlf, J. (2011a). tpsRegr, Shape Regression, version 1.40. New York, NY: Department of Ecology and Evolution, State University of New York at Stony Brook.
Rohlf, J. (2011b). tpsUtil, File Utility Program. version 1.58. New York, NY: Department of Ecology and Evolution, State University of New York at Stony Brook.
Rohlf, J. (2013). tpsDig, Digitize Landmarks and Outlines, version 2.12. New York, NY: Department of Ecology and Evolution, State University of New York at Stony Brook.
Sanford, E., and Kelly, M. W. (2010). Local adaptation in marine invertebrates. Annu. Rev. Mar. Sci. 3, 509–535. doi: 10.1146/annurev-marine-120709-142756
Schindler, D. E., and Scheuerell, M. D. (2002). Habitat coupling in lake ecosystems. Oikos 98, 177–189. doi: 10.1034/j.1600-0706.2002.980201.x
Schoener, T. W. (2011). The newest synthesis: understanding the interplay of evolutionary and ecological dynamics. Science 331, 426–429. doi: 10.1126/science.1193954
Sukhikh, N., Souissi, A., Souissi, S., and Alekseev, V. (2013). Invasion of eurytemora sibling species (copepoda: Temoridae) from north america into the baltic sea and european atlantic coast estuaries. J. Nat. Hist. 47, 753–767. doi: 10.1080/00222933.2012.716865
Sukhikh, N., Souissi, A., Souissi, S., Winkler, G., Castric, V., Holl, A. C., et al. (2016). Genetic and morphological heterogeneity among populations of eurytemora affinis (crustacea: Copepoda: Temoridae) in european waters. C. R. Biol. 339, 197–206. doi: 10.1016/j.crvi.2016.03.004
Torke, B. (2001). The distribution of calanoid copepods in the plankton of wisconsin lakes. Hydrobiologia 453, 351–365. doi: 10.1023/A:1013185916287
Vander Zanden, M. J., and Vadeboncoeur, Y. (2002). Fishes as integrators of benthic and pelagic food webs in lakes. Ecology 83, 2152–2161. doi: 10.2307/3072047
Vasquez, A. A., Hudson, P. L., Fujimoto, M., Keeler, K., Armenio, P. M., and Ram, J. L. (2016). Eurytemora carolleeae in the laurentian great lakes revealed by phylogenetic and morphological analysis. J. Great Lakes Res. 42:802. doi: 10.1016/j.jglr.2016.04.001
Walsh, M. R., DeLong, J. P., Hanley, T. C., and Post, D. M. (2012). A cascade of evolutionary change alters consumer-resource dynamics and ecosystem function. Proc. R. Soc. B 279, 3184–3192. doi: 10.1098/rspb.2012.0496
Wilson, D. S. (1975). The adequacy of body size as a niche difference. Am. Nat. 109, 769–784. doi: 10.1086/283042
Winkler, G., Dodson, J. J., and Lee, C. E. (2008). Heterogeneity within the native range: population genetic analyses of sympatric invasive and noninvasive clades of the freshwater invading copepod eurytemora affinis. Mol. Ecol. 17, 415–430. doi: 10.1111/j.1365-294X.2007.03480.x
Keywords: local adaptation, common gardening experiment, intraspecific variation, ecological-evolutionary dynamics, resource specialization, morphological divergence, niche partitioning, size efficiency
Citation: Karlsson K and Winder M (2018) Ecosystem Effects of Morphological and Life History Traits in Two Divergent Zooplankton Populations. Front. Mar. Sci. 5:408. doi: 10.3389/fmars.2018.00408
Received: 29 April 2018; Accepted: 15 October 2018;
Published: 13 November 2018.
Edited by:
Riina Klais, University of Tartu, EstoniaReviewed by:
Sami Souissi, Lille University of Science and Technology, FranceAna Marta Gonçalves, University of Coimbra, Portugal
Copyright © 2018 Karlsson and Winder. This is an open-access article distributed under the terms of the Creative Commons Attribution License (CC BY). The use, distribution or reproduction in other forums is permitted, provided the original author(s) and the copyright owner(s) are credited and that the original publication in this journal is cited, in accordance with accepted academic practice. No use, distribution or reproduction is permitted which does not comply with these terms.
*Correspondence: Konrad Karlsson, a29ucmFkLmthcmxzc29uQHN1LnNl