 Eduard Fadeev1,2*
 Ian Salter1,3
 Vibe Schourup-Kristensen1
 Eva-Maria Nöthig1
 Katja Metfies1,4
 Anja Engel5
 Judith Piontek5
 Antje Boetius1,2
 Christina Bienhold1,2*
- 1Alfred Wegener Institute, Helmholtz Centre for Polar and Marine Research, Bremerhaven, Germany
- 2Max Planck Institute for Marine Microbiology, Bremen, Germany
- 3Faroe Marine Research Institute, Tórshavn, Faroe Islands
- 4Helmholtz Institute for Functional Marine Biodiversity, Oldenburg, Germany
- 5GEOMAR Helmholtz Centre for Ocean Research, Kiel, Germany
Climate models project that the Arctic Ocean may experience ice-free summers by the second half of this century. This may have severe repercussions on phytoplankton bloom dynamics and the associated cycling of carbon in surface waters. We currently lack baseline knowledge of the seasonal dynamics of Arctic microbial communities, which is needed in order to better estimate the effects of such changes on ecosystem functioning. Here we present a comparative study of polar summer microbial communities in the ice-free (eastern) and ice-covered (western) hydrographic regimes at the LTER HAUSGARTEN in Fram Strait, the main gateway between the Arctic and North Atlantic Oceans. Based on measured and modeled biogeochemical parameters, we tentatively identified two different ecosystem states (i.e., different phytoplankton bloom stages) in the distinct regions. Using Illumina tag-sequencing, we determined the community composition of both free-living and particle-associated bacteria as well as microbial eukaryotes in the photic layer. Despite substantial horizontal mixing by eddies in Fram Strait, pelagic microbial communities showed distinct differences between the two regimes, with a proposed early spring (pre-bloom) community in the ice-covered western regime (with higher representation of SAR11, SAR202, SAR406 and eukaryotic MALVs) and a community indicative of late summer conditions (post-bloom) in the ice-free eastern regime (with higher representation of Flavobacteria, Gammaproteobacteria and eukaryotic heterotrophs). Co-occurrence networks revealed specific taxon-taxon associations between bacterial and eukaryotic taxa in the two regions. Our results suggest that the predicted changes in sea ice cover and phytoplankton bloom dynamics will have a strong impact on bacterial community dynamics and potentially on biogeochemical cycles in this region.
Introduction
In recent decades, Arctic warming has resulted in remarkable environmental changes in the Arctic Ocean, and the region is warming much faster than the global mean rate (Dobricic et al., 2016; Sun et al., 2016). Arctic sea ice has declined by approximately 50% since the late 1950s, and its extent is shrinking at approximately 10% per decade since the late 1990s (Kwok and Rothrock, 2009; Peng and Meier, 2017). Current predictions indicate that the Arctic Ocean may experience ice-free summers by the second half of this century (Polyakov et al., 2017). In addition, recent observations suggest increasing temperatures of the Atlantic water inflow (Walczowski et al., 2017). The combination of these environmental changes results in weakened stratification of the water column and increased vertical mixing of the deep Atlantic core water, a process also termed ‘Atlantification’ (Polyakov et al., 2017). Based on these observations, the general agreement is that the Arctic Ocean is currently in a transitional phase toward warmer conditions (Polyakov et al., 2005, 2017; Dmitrenko et al., 2008).
The 450 km wide Fram Strait is the only deep gateway to the Arctic Ocean, and has two distinct hydrographic regimes. In the eastern part of Fram Strait, the northward flowing West Spitsbergen Current (WSC), transports relatively warm and saline Atlantic water into the Arctic Ocean (Beszczynska-Moller et al., 2012; von Appen et al., 2015). The East Greenland Current (EGC) flows southward along the Greenland shelf, transporting cold polar water and exporting approximately 90% of the Arctic sea ice to the North Atlantic (de Steur et al., 2009). These distinct water masses are separated by the East Greenland Polar Front system (Paquette et al., 1985). However, recent ocean simulation analyses show substantial horizontal mixing and exchange by eddies (Wekerle et al., 2017). Repeated summer sampling in the water column and at the seafloor of the Fram Strait, as part of the Long Term Ecological Research (LTER) site HAUSGARTEN, have revealed major ecological variations associated with anomalies of the Atlantic Water inflow (Soltwedel et al., 2016). Examples for such variations are a slow increase in phytoplankton biomass and shifts species composition which followed the Atlantic Water warming event in 2005–2007 (Nöthig et al., 2015). This included a transition from diatom to flagellate (e.g., Phaeocystis) dominated communities during the summer months (Nöthig et al., 2015; Engel et al., 2017). Recent model predictions showed substantial differences in carbon export following diatom- or flagellate- dominated phytoplankton blooms (Vernet et al., 2017; Wollenburg et al., 2018). Depending on timing, flagellate dominated blooms may result in increasing abundance of microzooplankton (e.g., ciliates) and a more active microbial loop, or a more rapid export in connection with ice-formed mineral precipitation. Furthermore, a year round study of physical and biogeochemical hydrography in the WSC suggested that the ongoing ‘Atlantification’ in the region is leading to increased pelagic primary productivity (Randelhoff et al., 2018).
However, the harsh climatic conditions in the open Arctic Ocean during winter typically limit sampling opportunities to the Arctic summer season, so that seasonal dynamics within the pelagic ecosystem, especially in ice-covered parts of the Arctic, remain understudied (Soltwedel et al., 2013; Nöthig et al., 2015). Phytoplankton bloom dynamics may, to some extent, be monitored using remote sensing of chlorophyll a (chl a) by satellites in ice-free ocean areas, with substantial limits due to Arctic fog and the dark season (Perrette et al., 2011). However, monitoring the dynamics of heterotrophic microorganisms requires physical sampling. Wilson et al. (2017) were the first to describe changes of bacterial community composition in the eastern Fram Strait throughout a polar year. In accordance with observations from other polar regions (Alonso-Sáez et al., 2008; Iversen and Seuthe, 2011; Ghiglione and Murray, 2012; Williams et al., 2012), their results showed that the extreme seasonality of polar marine ecosystems, with ice-covered dark winter conditions and extended irradiance in summer, leads to pronounced seasonal differences in heterotrophic bacterial communities. Winter-time bacterial communities in the upper water column showed higher phylogenetic and functional diversity compared to the summertime, with increased importance of chemolithotrophic processes (e.g., Alonso-Sáez et al., 2014; Müller et al., 2018). During late spring, the increasing irradiance and decreasing sea ice cover initiate large phytoplankton blooms, which can lead to major shifts in heterotrophic bacterial community composition.
Biological interactions among microbes are important drivers of the dynamics in pelagic microbial communities (Fuhrman et al., 2015). Specific interactions between phytoplankton and heterotrophic bacteria have been documented, many of which are based on the exchange of energy sources and metabolites, including various forms of chemical signaling (Cole, 1982; Grossart et al., 2006; Grossart and Simon, 2007; Ramanan et al., 2016). Analyses of bacterial communities co-occurring with diatoms, using advanced molecular approaches, revealed complex interspecies signaling (Amin et al., 2012). While a full characterization of such interactions requires targeted experiments under laboratory conditions, molecular methods in combination with network analyses allow us to identify potential interactions directly from environmental samples (e.g., Gilbert et al., 2012; Lima-Mendez et al., 2015; Peura et al., 2015; Milici et al., 2016; Chafee et al., 2018).
One such interaction with relevance to the proportion of pelagic recycling versus carbon export is the physical association of bacteria with plankton detritus. Pelagic bacteria have different strategies to tap into the detritus pool, free-living in the water column or associated with particulate matter (Stocker, 2012). Previous studies have revealed strong differences between potential associations of free-living (FL) and particle-associated (PA) bacteria with microbial eukaryotes (Lima-Mendez et al., 2015; Milici et al., 2016). While the FL fraction is often dominated by cosmopolitan oligotrophic bacteria that rely on the availability of organic matter in the dissolved fraction (Morris et al., 2012; Giovannoni et al., 2014), the PA fraction is usually represented by copiotrophic motile bacteria which colonize living or decaying microbial eukaryotes, fecal pellets, gel-like particles or other forms of particulate organic matter (Simon et al., 2002; Herndl and Reinthaler, 2013; Busch et al., 2017).
Microbial studies of the photic layer of Fram Strait have so far focused on eukaryotic plankton (Kilias et al., 2013; Nöthig et al., 2015; Metfies et al., 2016), and biogeochemical recycling of detritus by bacteria (Piontek et al., 2014, 2015). Although bacteria are key players in the biogeochemical cycling of carbon and nutrients in the water column (Azam and Malfatti, 2007; Falkowski et al., 2008), very little is known about the composition and the dynamics of their communities in this region. In order to understand the impact of projected environmental changes on these communities, it is necessary to establish a fundamental knowledge about the biogeography and variability of microbial communities in the Fram Strait. Using a set of measured and modeled environmental parameters and sequence-based assessments of microbial community composition, the objectives of the study were: (1) to identify differences in bacterial community composition in the two hydrographic regimes of Fram Strait in relation to hydrographical and biogeochemical parameters; (2) to test whether these differences are related to specific productivity phases of the Arctic pelagic ecosystem; (3) to assess whether and to what extent these differences are reflected in specific taxon–taxon associations between bacterial and eukaryotic community members.
Results
Phytoplankton Bloom Dynamics Across the Fram Strait
Based on previously defined physical characteristics of the two main currents of Fram Strait (Rudels et al., 2013), we identified two origins of our sample sets: (1) the eastern Fram Strait with warmer and more saline Atlantic Water of the WSC; (2) the western Fram Strait with colder and less saline Polar Water of the EGC (Figure 1). The two regions had distinct sea ice conditions at the time of sampling, with an ice-covered regime in EGC and an ice-free regime in WSC (Figure 1). Furthermore, measured chl a concentrations showed higher concentrations in the WSC, and chl a was present down to water depths of more than 100 m in this region (Figure 1B).
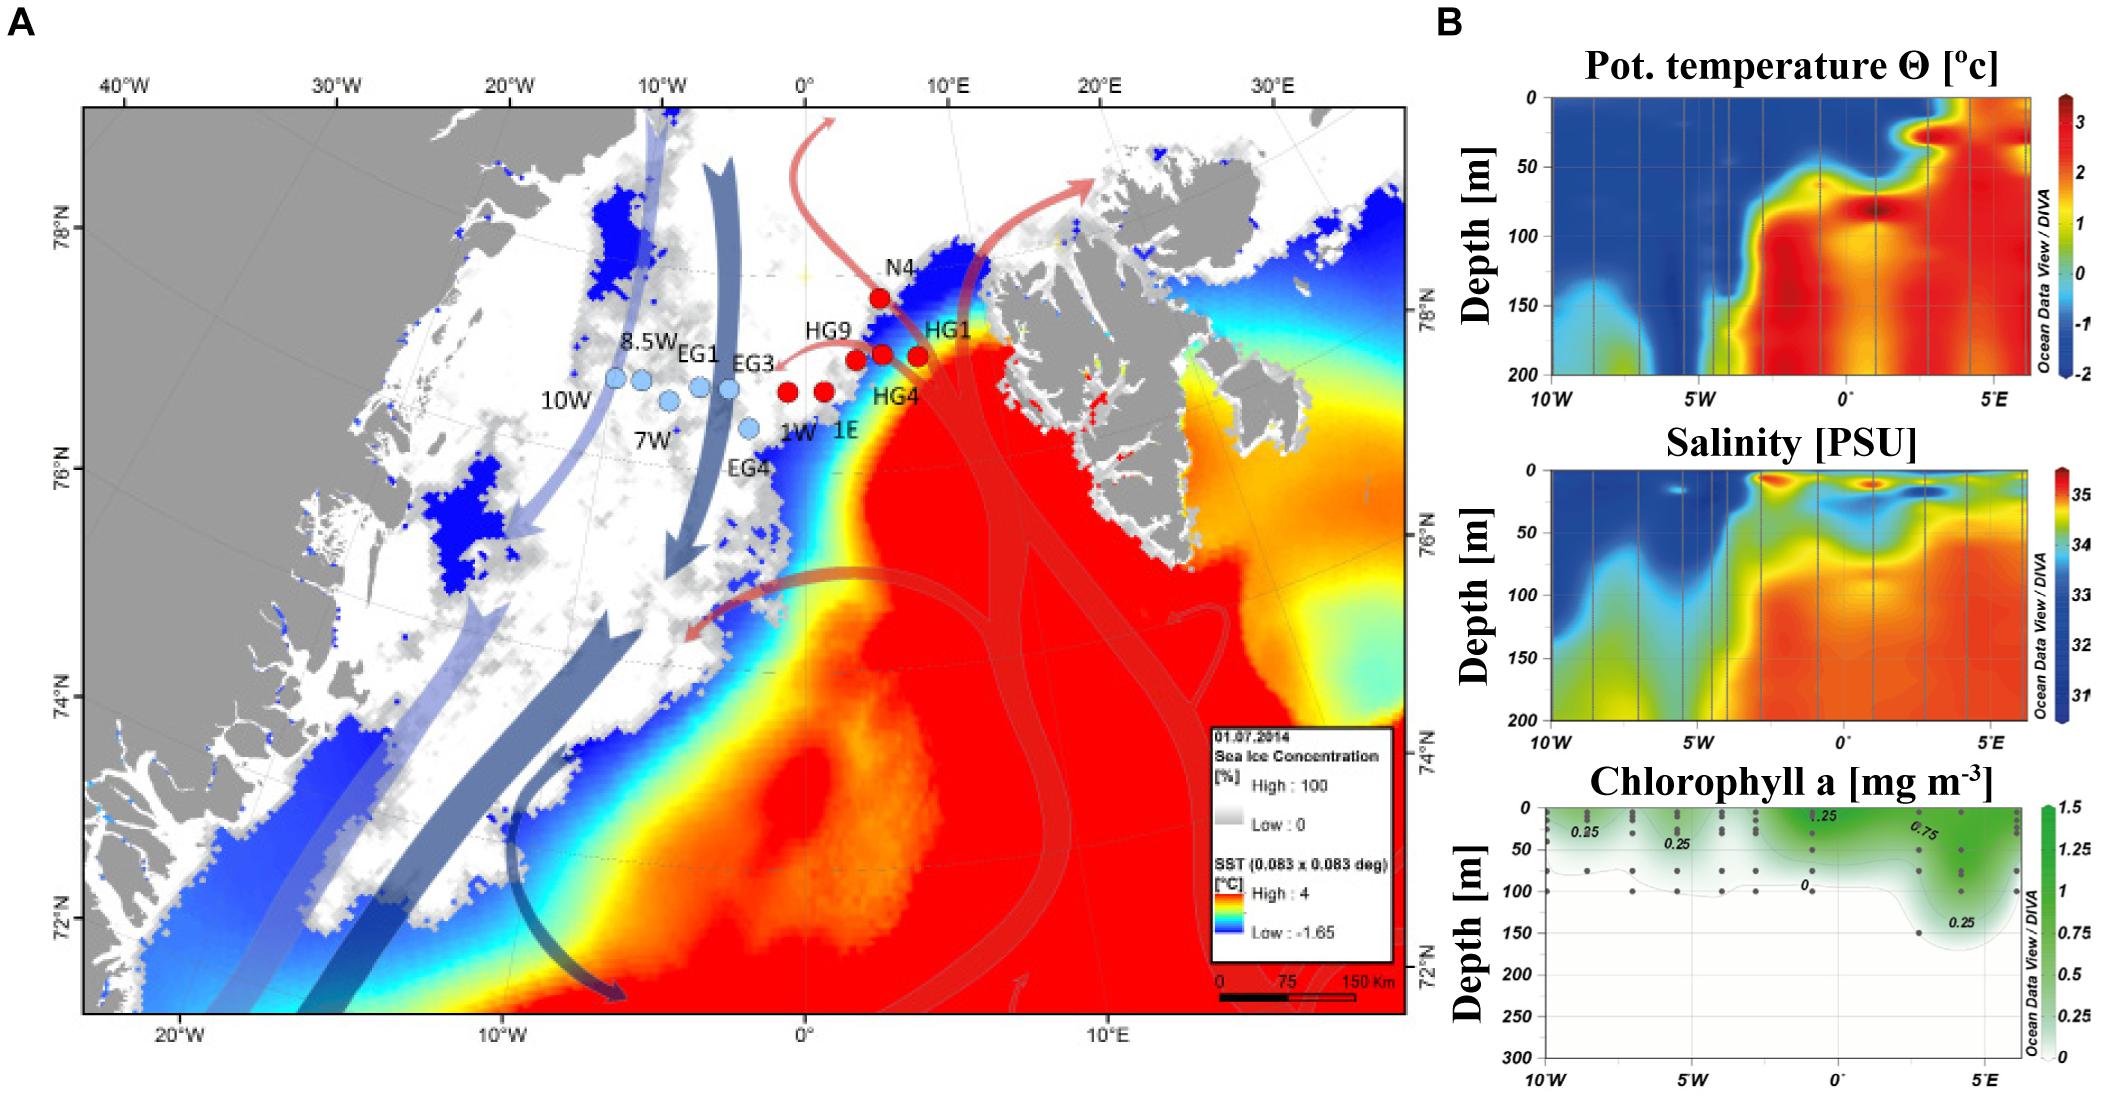
FIGURE 1. Regional separation of Fram Strait. The longitudinal coordinates of the EGC region are 10W-1W, and for the WSC region 1W-6E. (A) Monthly average of sea ice coverage and sea surface temperature during June 2014. The satellite remote sensing sea ice concentration data were obtained from http://www.meereisportal.de (Spreen et al., 2008). The ice concentration is represented by inverted grayscale (gray-low, white-high). Sea surface temperature was obtained from NOAA NCEP real-time analysis (http://polar.ncep.noaa.gov/sst/rtg_high_res/). The arrows represent general directions of the WSC (in red) and the EGC (in blue). Map: AWI/Laura Hehemann. The map was produced using ArcMap (ver. 10.5.) with Esri world countries dataset (www.esri.com) in a WGS 1984 Arctic Polar Stereographic map projection. (B) Physical characteristics of the water column from CTD (Conductivity-Temperature-Depth) sensors and chl a measured in situ. The plot was generated using Ocean Data View (v4.7.10; Schlitzer, 2015).
In WSC all measured inorganic nutrients (silicate – SiO3, nitrate – NO3, and phosphate – PO4) showed lower concentrations near the surface compared to deeper water layers below the pycnocline (roughly below 50 m). Contrary, in EGC there were only small differences in nutrient concentrations throughout all measured depths. In addition, while measurements of SiO3 and PO4 concentrations in deeper water layers were similar between the regions, NO3 concentrations were lower in EGC (Supplementary Figure 1). The depth of the water column pycnocline represents the mixed layer depth during the last winter (Rudels et al., 1996). Generally only the nutrients above the pycnocline within the photic zone (upper ∼50 m) are consumed by phytoplankton. Therefore, the calculated differences in nutrient concentrations (Δ) below and above the seasonal pycnocline provide a proxy estimation for phytoplankton productivity in the different regions, since the beginning of the seasonal bloom (Table 1). The estimated productivity based on the stoichiometry of consumed nutrients (see Material and Methods), as well as the integrated chl a and phytoplankton carbon biomass all showed higher values in WSC. Furthermore, based on a ratio 1:1 of NO3:SiO3 we estimated that the contribution of diatoms to the total productivity was roughly 30% in both regions. However, biomass estimates of diatoms showed a much larger fraction of the total phytoplankton biomass in EGC at the time of sampling (Table 1).
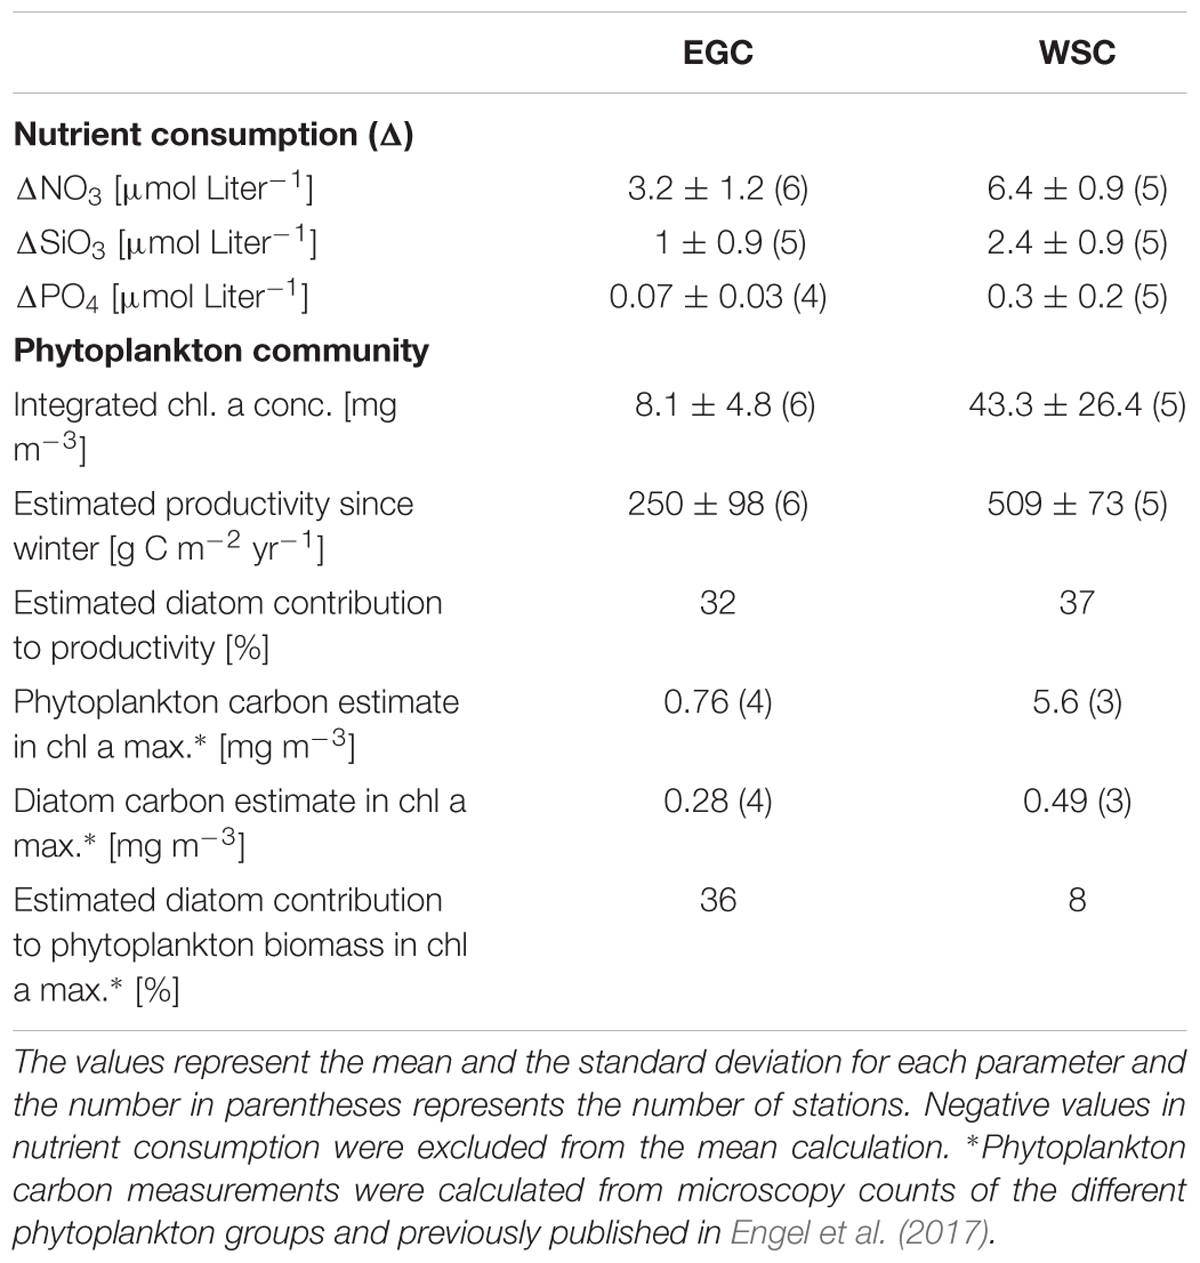
TABLE 1. Comparison of nutrient consumption, phytoplankton biomass and productivity between the EGC and WSC regions.
To verify that these differences in biogeochemical parameters represent different ecosystem states, we used surface chl a dynamics of the biogeochemical model FESOM-REcoM2, set to the studied dates, to estimate the phytoplankton bloom stages in the two regions. Because of the lack of chl a remote sensing measurements for the ice-covered regions, we could only use the ice-free region for calibration (Supplementary Figure 9). In the model, a strong relationship between the estimates of chl a and the shifting sea ice edge was observed (Figure 2). In the beginning of June, surface chl a concentrations were elevated in the whole ice-free area of WSC, while remaining very low in the ice-covered EGC (Figures 2A–C). In the second half of June 2014, with the ice thinning and the sea ice edge shifting westward, an increase in surface chl a concentrations was observed also in EGC (Figures 2D–F).
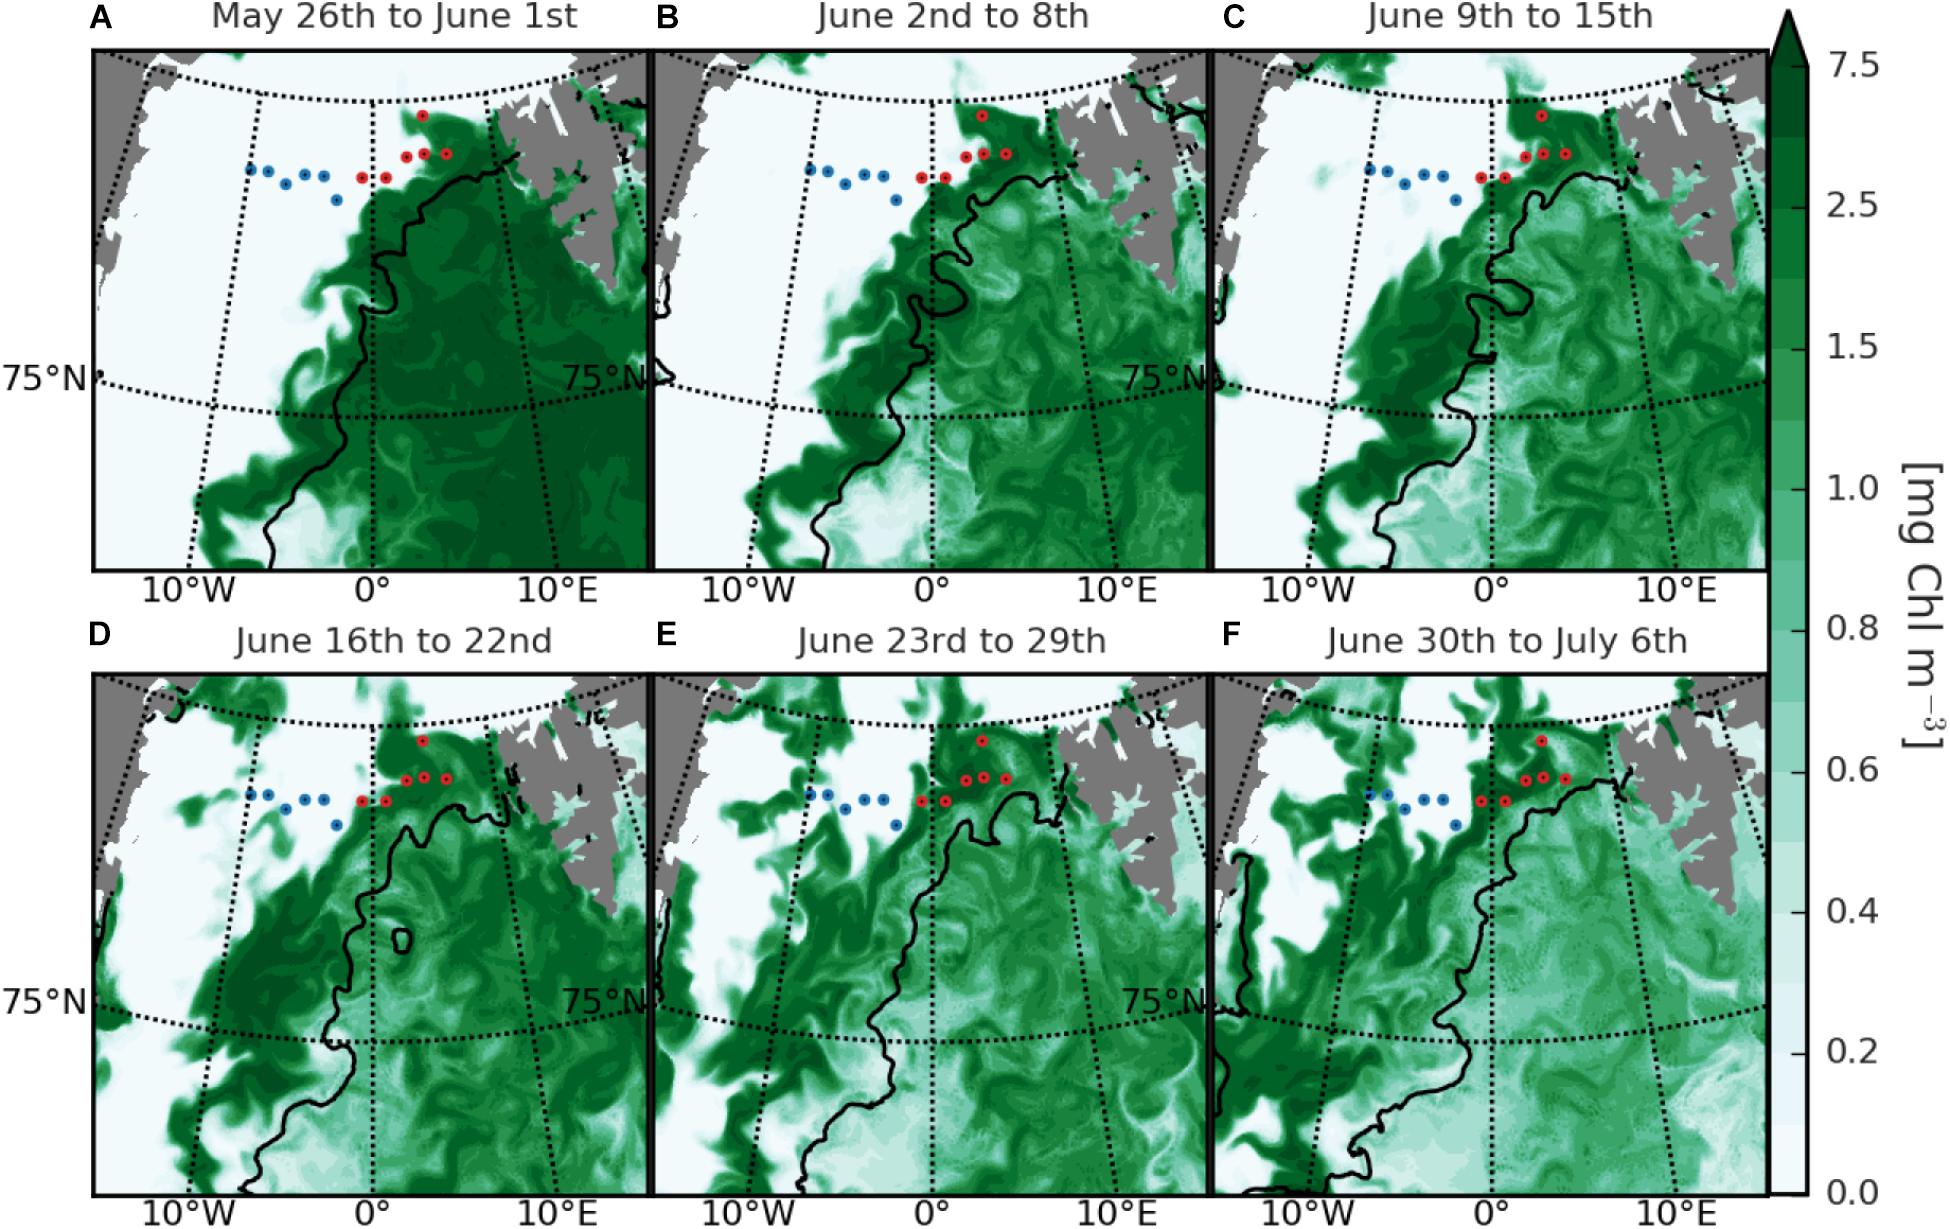
FIGURE 2. Modeled weekly surface chl a concentration in the Fram Strait during June 2014. The panels (A–F) represent the weekly mean concentrations according to the stated dates. Red and blue dots mark the location of sampling stations in the WSC and EGC regions, respectively, based on the observed characteristics in this study. For comparison between the modeled chl a with remote sensing and in situ measurements, please refer to the Supplementary Material.
Differences in Microbial Community Composition Between the Eastern and Western Regions of the Fram Strait
Using Illumina 16S rRNA amplicon sequencing of the V3-V4 hypervariable region, we obtained a final dataset of 2,462,994 reads (amplicons) in 63 samples, which were assigned to 7,167 OTUs associated with 406 bacterial taxonomic lineages. The OTUs which were taxonomically assigned to chloroplasts or mitochondria were excluded from further analysis. The rarefaction curves did not reach a plateau in any of the samples, and on overage the samples covered 60% of the bacterial community richness (Supplementary Table 1 and Supplementary Figure 2A). However, coverage-based rarefaction estimations (i.e., Good’s estimator), revealed a sample completeness higher than 98% in all samples (Supplementary Figure 2B; Chao and Jost, 2012; Chao et al., 2014). This suggests that although additional OTUs could be expected with additional sequencing, our sequencing depth was satisfactory to represent most of the diversity within the bacterial communities.
Comparison of bacterial community composition between the different regions and fractions was conducted based on the presence/absence of an OTU (Figure 3). A total of 974 OTUs (13% of the total OTUs) were shared throughout the entire dataset, and represented more than 75% of all sequences. Especially the FL communities of both regions were similar (Figure 4). Hence, differences between the bacterial communities mainly resulted from variations in the proportional abundance of these taxa.
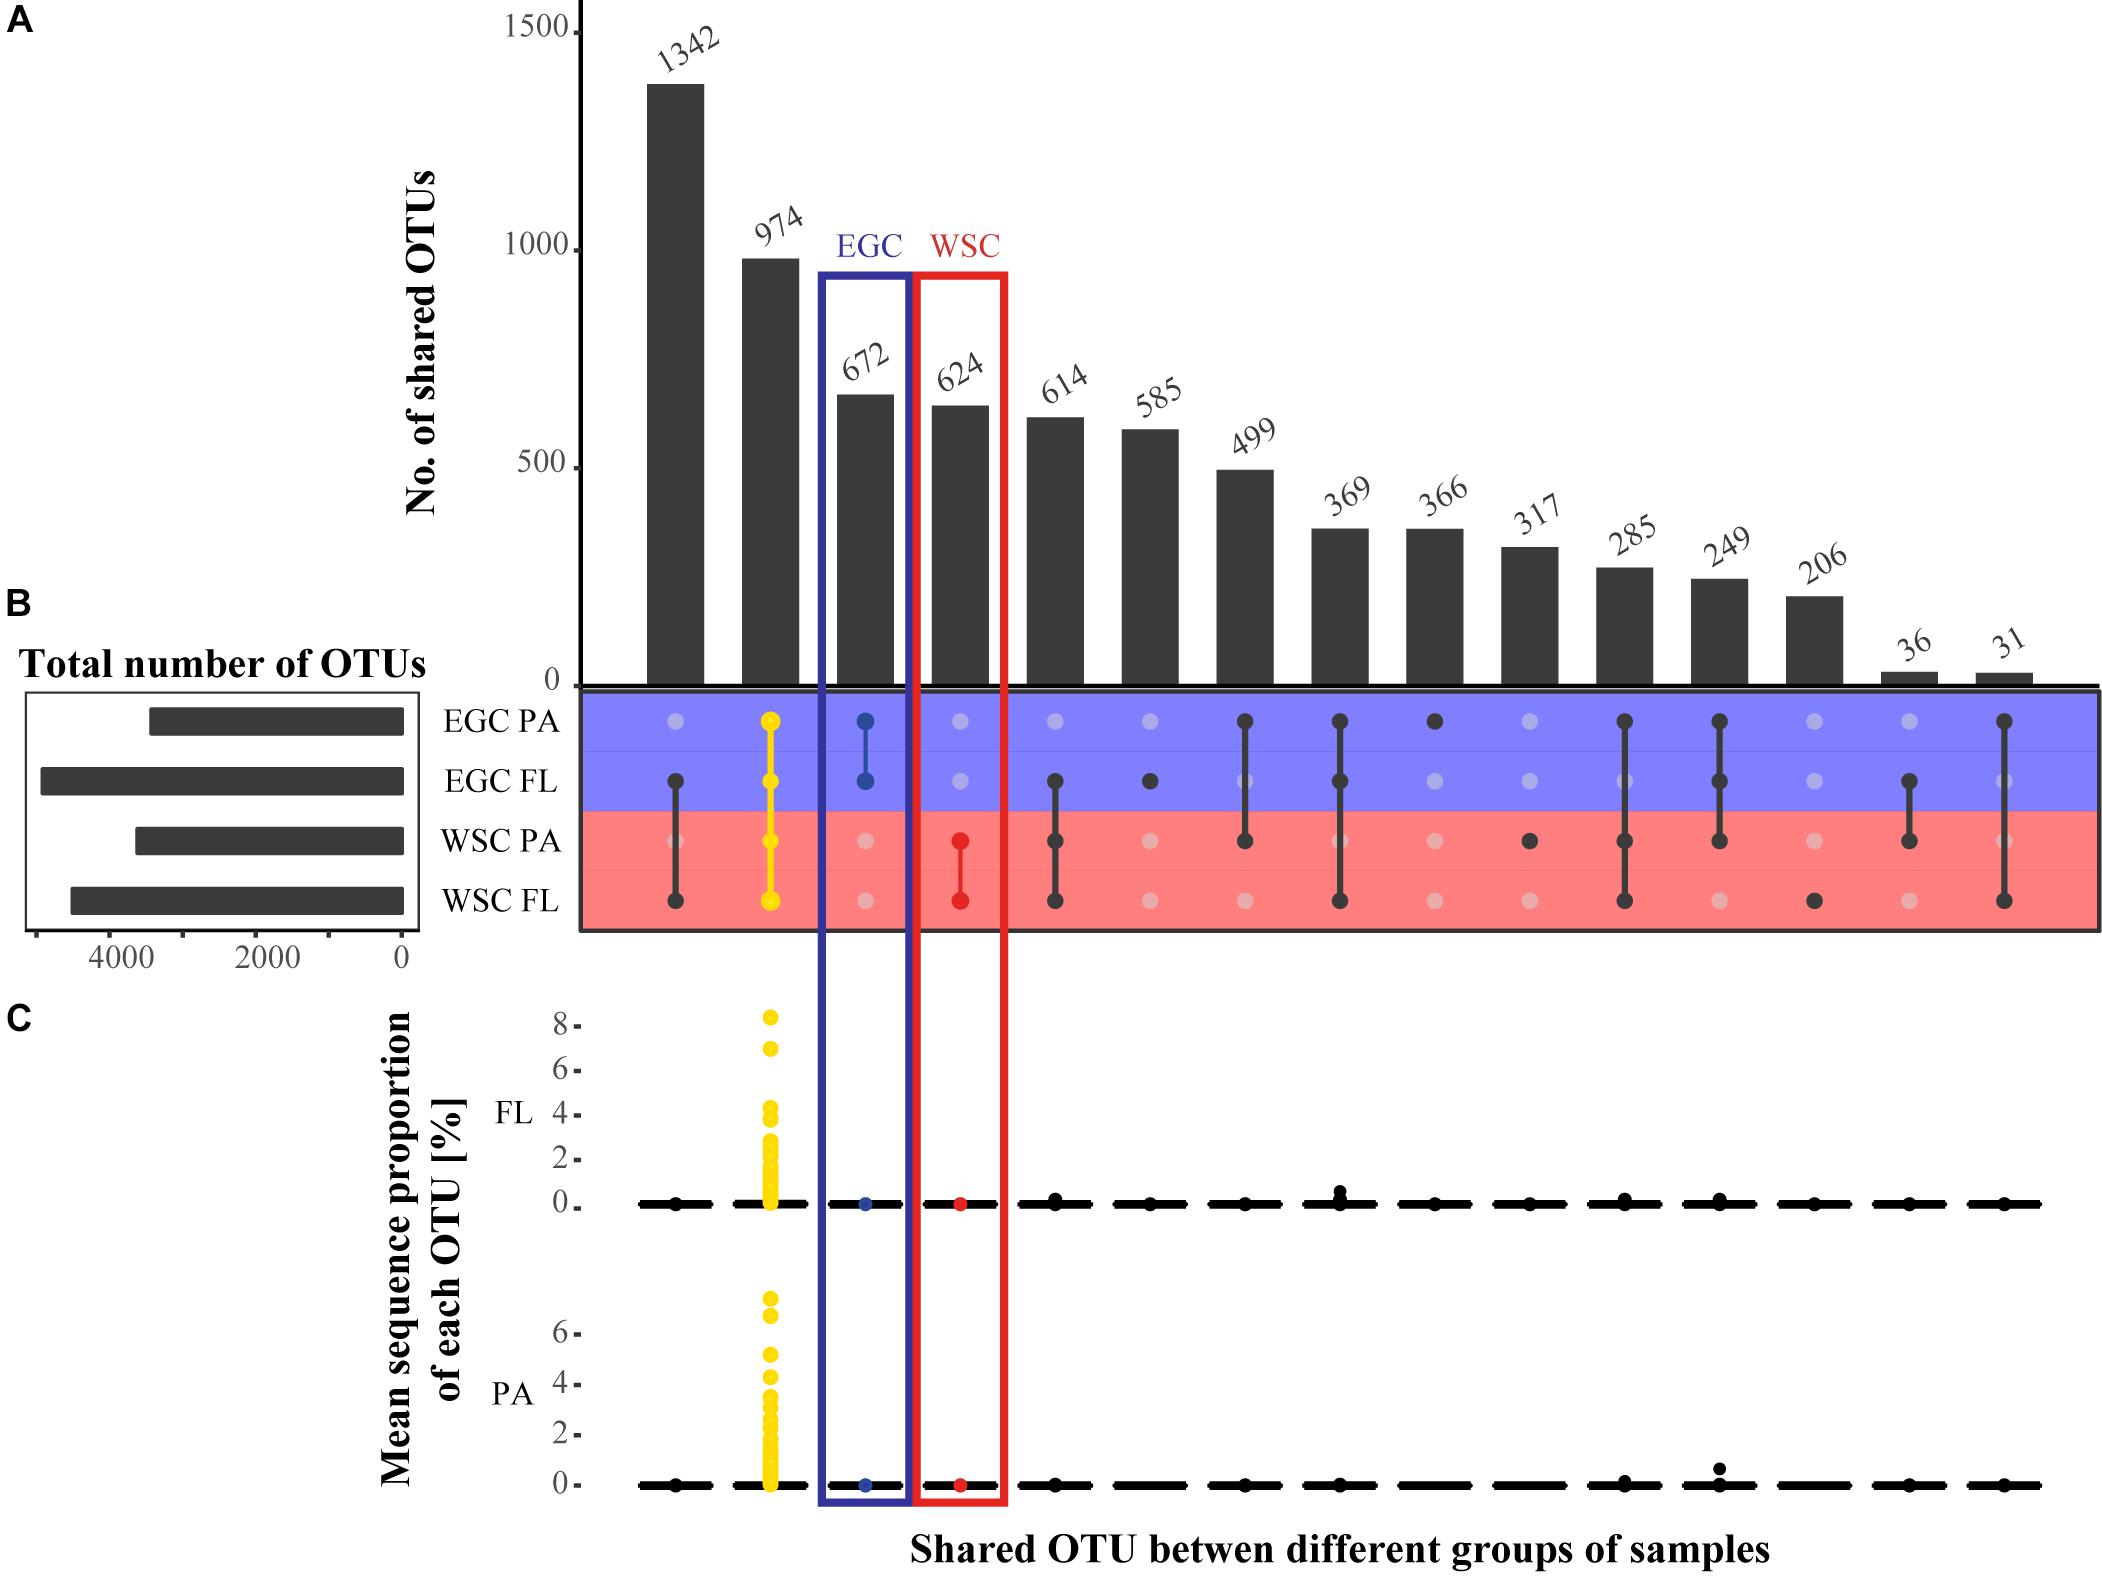
FIGURE 3. Comparison of bacterial community composition between the different regions and fractions. (A) Number of shared OTUs between the different regions and fractions. (B) Total number of OTUs in each category. (C) Mean sequence proportion of each OTU in each overlap group, separated by fractions. The yellow color marks the shared OTUs in the entire dataset, the red color the shared OTUs between fractions in WSC and the blue color the shared OTUs between fractions in EGC.
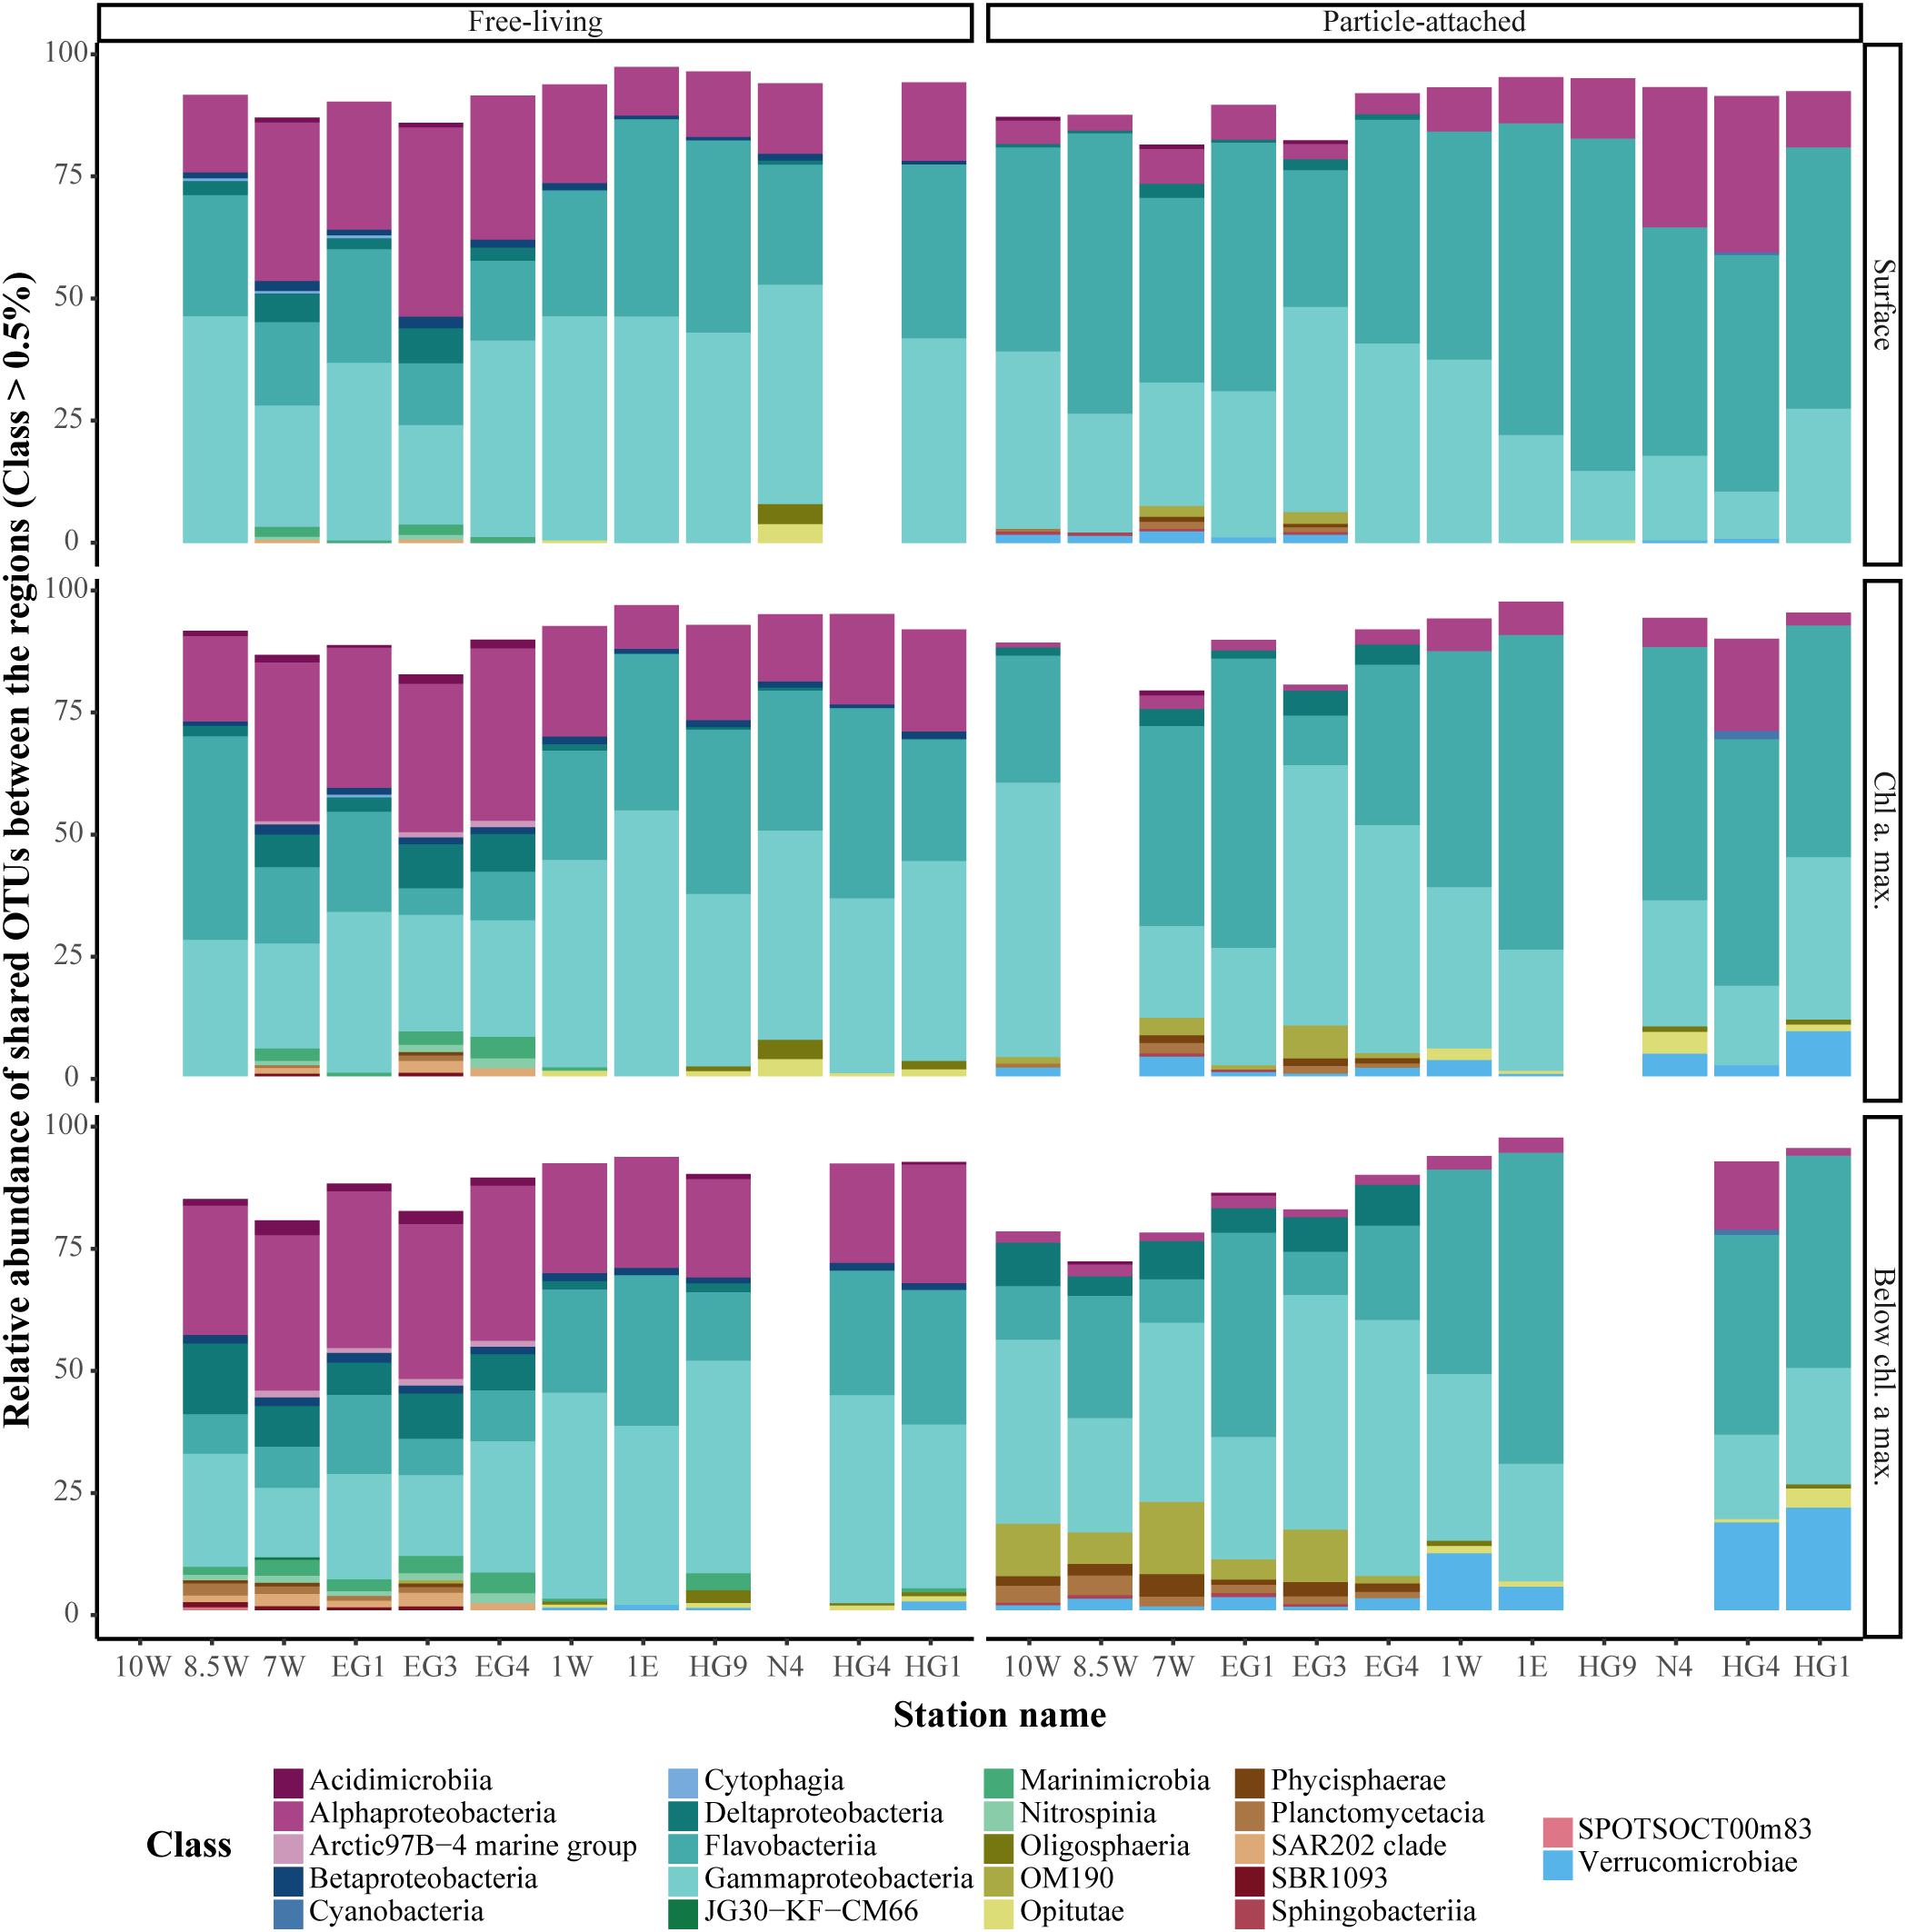
FIGURE 4. Sequence proportion overview of overlapping bacterial OTUs, between the regions in each fraction. The color code represents taxonomic classes. Only classes with sequence abundance higher than 0.5% were included in the figure.
In order to further investigate the differences in community composition between the different regions, we performed differential abundance tests for all shared OTUs from both the FL and PA fractions using ‘DESeq2’. The OTU which had a fold change of absolute value higher than 1 and an adjusted p-value < 0.05 was defined as ‘differentially abundant OTU’ – daOTU. Furthermore, using ‘GAGE’ we tested for the enrichment of bacterial groups at a lower taxonomic resolution, i.e., that of bacterial families. Only bacterial families in which all OTUs were enriched in only one region and showed statistical significance (adjusted p-value < 0.05), were considered to be enriched.
A total of 757 (10% of all OTUs) and 869 (12% of all OTUs) daOTU were identified in the FL and PA fractions, respectively (Supplementary Figure 3). For both fractions, the EGC region was represented by a higher proportion of daOTU compared to the WSC (60 and 65% for FL and PA, respectively), as well as by a higher number of sequence-enriched bacterial families (Figure 5). The WSC was characterized, in both fractions, by few significantly enriched families in various taxonomic groups, such as Alphaproteobacteria (Rhodobacteraceae) and Gammaproteobacteria (Piscirickettsiaceae, Porticoccaceae). Furthermore, Flavobacteria (Cryomorphaceae) and Gammaproteobacteria (OM182 clade) were significantly enriched in the FL fraction of WSC. Enriched taxa in the EGC were distributed across a broader taxonomic range, with large differences also between the fractions. In the FL fraction the significantly enriched families were associated with the poorly classified Chloroflexi (SAR202), Marinimicrobia (SAR406) and Deltaproteobacteria (SAR324, Bdellovibrionaceae), as well as members of Alphaproteobacteria (SAR11, Rhodospirillaceae) and Gammaproteobacteria (Colwelliaceae, Pseudoalteromonadaceae and JTB255). In the PA fraction significantly enriched families were associated mainly with Deltaproteobacteria (Bdellovibrionaceae, Bradymonadales, Oligoflexaceae, NB1-j) and Gammaproteobacteria (Pseudoalteromonadaceae, Shewanellaceae and JTB255).
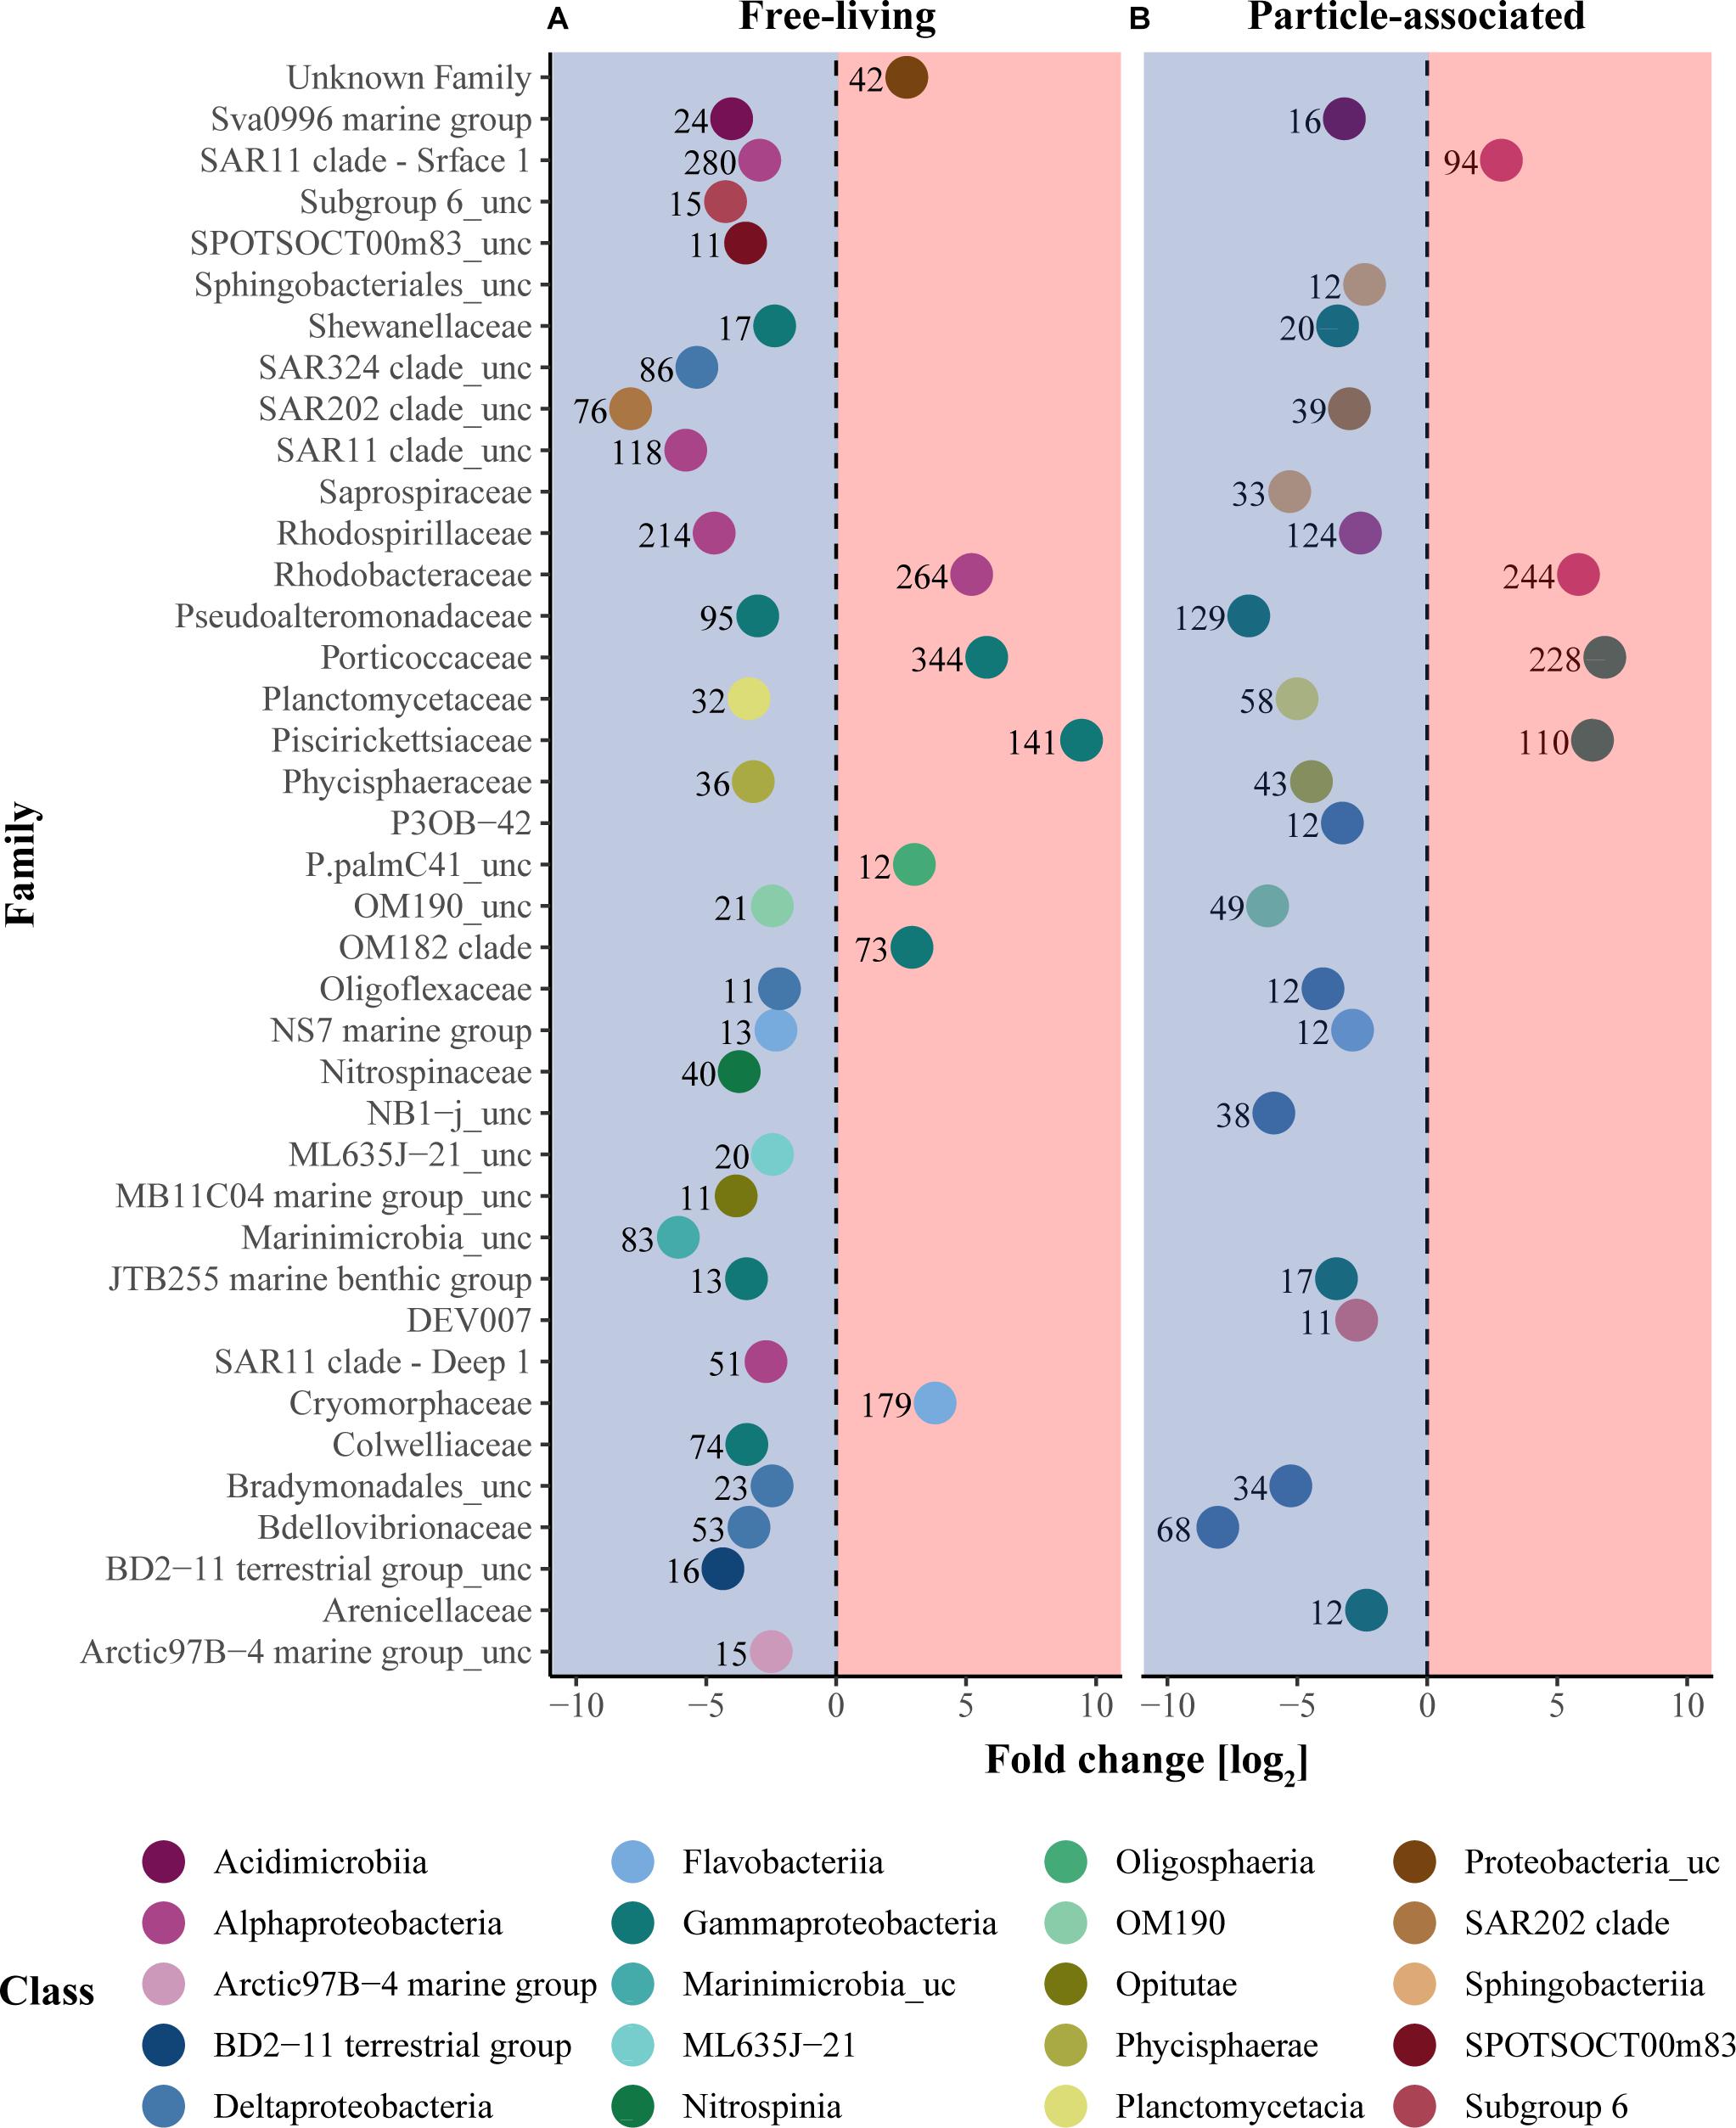
FIGURE 5. Enriched bacterial families between the regions. Taxonomic enrichment analysis was performed separately on the FL (A) and the PA (B) fractions, and only statistically significant taxa were included in data representation (adjusted p-value < 0.05). The x-axis represents the log2 fold change in sequence abundance. Enrichment in the EGC region is represented in the blue area while enrichment in the WSC region is represented in the red area. The color code represents taxonomic classes and each point represents the log2 fold change of each taxonomic family. The number associated with each symbol represents the number of OTUs in the family.
A similar workflow was applied to investigate microbial eukaryotic communities. Using Illumina 18S rRNA amplicon sequencing of the V4 hypervariable region, we obtained a final dataset of 2,396,433 reads (amplicons) in 33 samples, which were assigned to 4,419 OTUs associated with 173 eukaryotic taxonomic lineages. The eukaryotic OTUs which were taxonomically assigned to metazoa were excluded from further analysis. Rarefaction curves did not reach a plateau in any of the samples, and on overage the samples covered 75% of the eukaryotic community richness (Supplementary Table 1 and Supplementary Figure 2C). Nevertheless, coverage-based rarefaction estimations (i.e., Good’s estimator), revealed a sample completeness higher than 98% in all samples (Supplementary Figure 2D; Chao and Jost, 2012; Chao et al., 2014). This suggests that although additional OTUs could be expected with additional sequencing, our sequencing depth was satisfactory to represent most of the diversity within the eukaryotic communities.
A corresponding OTU presence/absence analysis between eukaryotic communities in each region revealed that 2,502 OTUs (56% of the total OTUs) were shared between the regions (Supplementary Figure 4), comprising more than 80% of the sequences in all eukaryotic samples (Figure 6). Hence, the relatively high proportion of region-specific OTUs showed very low relative sequence abundances. Furthermore, the taxonomic groups Syndiniales, Dinophyceae (dinoflagellates) and Diatomea showed larger number of daOTU in EGC (Supplementary Figure 5). In the WSC on the other hand, the largest taxonomic group (in terms of number of daOTU) was the heterotrophic Thecofilosea (Cercozoa).
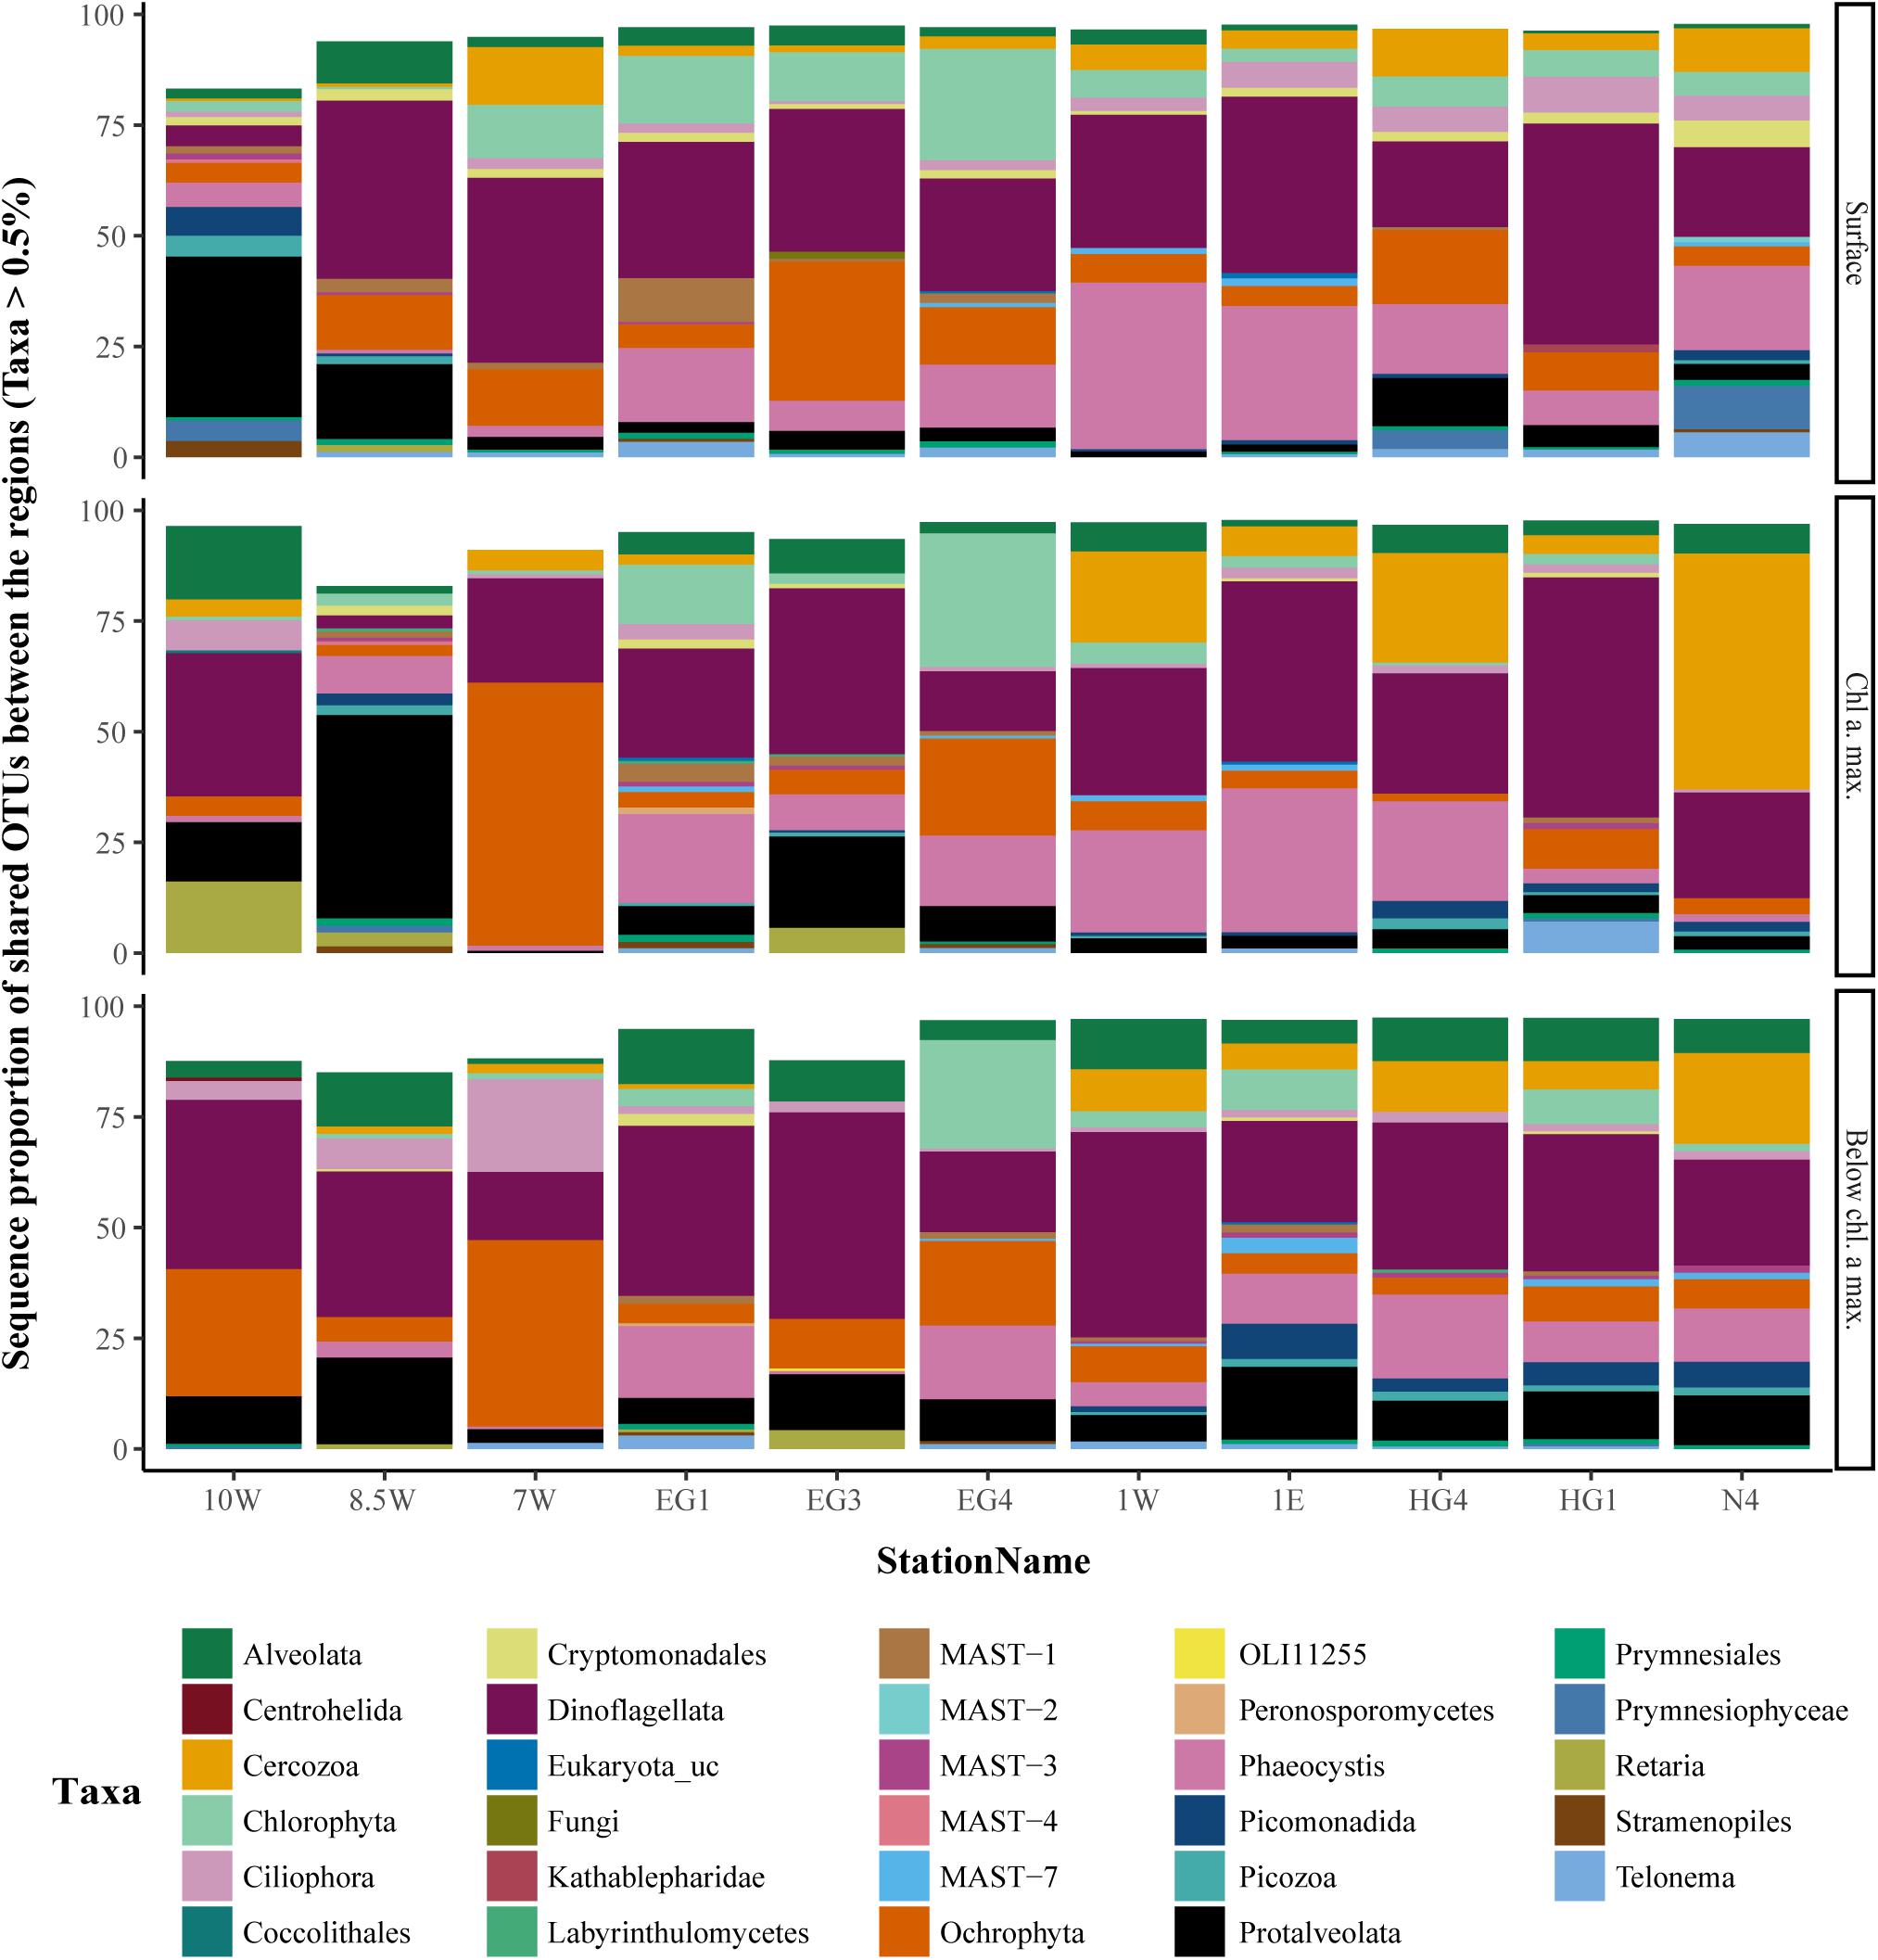
FIGURE 6. Sequence proportion overview of overlapping microbial eukaryote OTUs, between the regions. The color code represents taxonomic lineages. Only taxa with sequence abundance higher than 0.5% were included in the figure.
Environmental Drivers of Microbial Communities in the Fram Strait
Bacterial cell densities and production estimates based on leucine incorporation showed statistically significant differences between the two regions (t-test, p < 0.001; Figures 7A,B and Supplementary Table 2). The results showed almost one order of magnitude higher bacterial cell densities in WSC compared to EGC, as well as higher ratios between high nucleic acid (HNA) and low nucleic acid (LNA) cells. Total bacterial productivity was higher in the WSC compared to the EGC region, while cell specific productivity (total productivity divided by cell concentration) did not show significant difference between the regions. Moreover, a principal coordinate analysis (PCoA) of bacterial community composition revealed significant differences between samples according to their geographic origin, in addition to clear differences in the community structure of FL and PA fractions (Figures 7C,D). Samples from different depths showed no clear clustering. The separation of samples according to their bacterial community structure was confirmed using a permutational multivariate analysis of variance. Similar differences between the regions were observed for the microbial eukaryotic community, with higher phytoplankton estimated biomass in the WSC (Table 1), and community composition clustering according to regions, although to a lesser extent than bacterial communities (Supplementary Figures 6A,B).
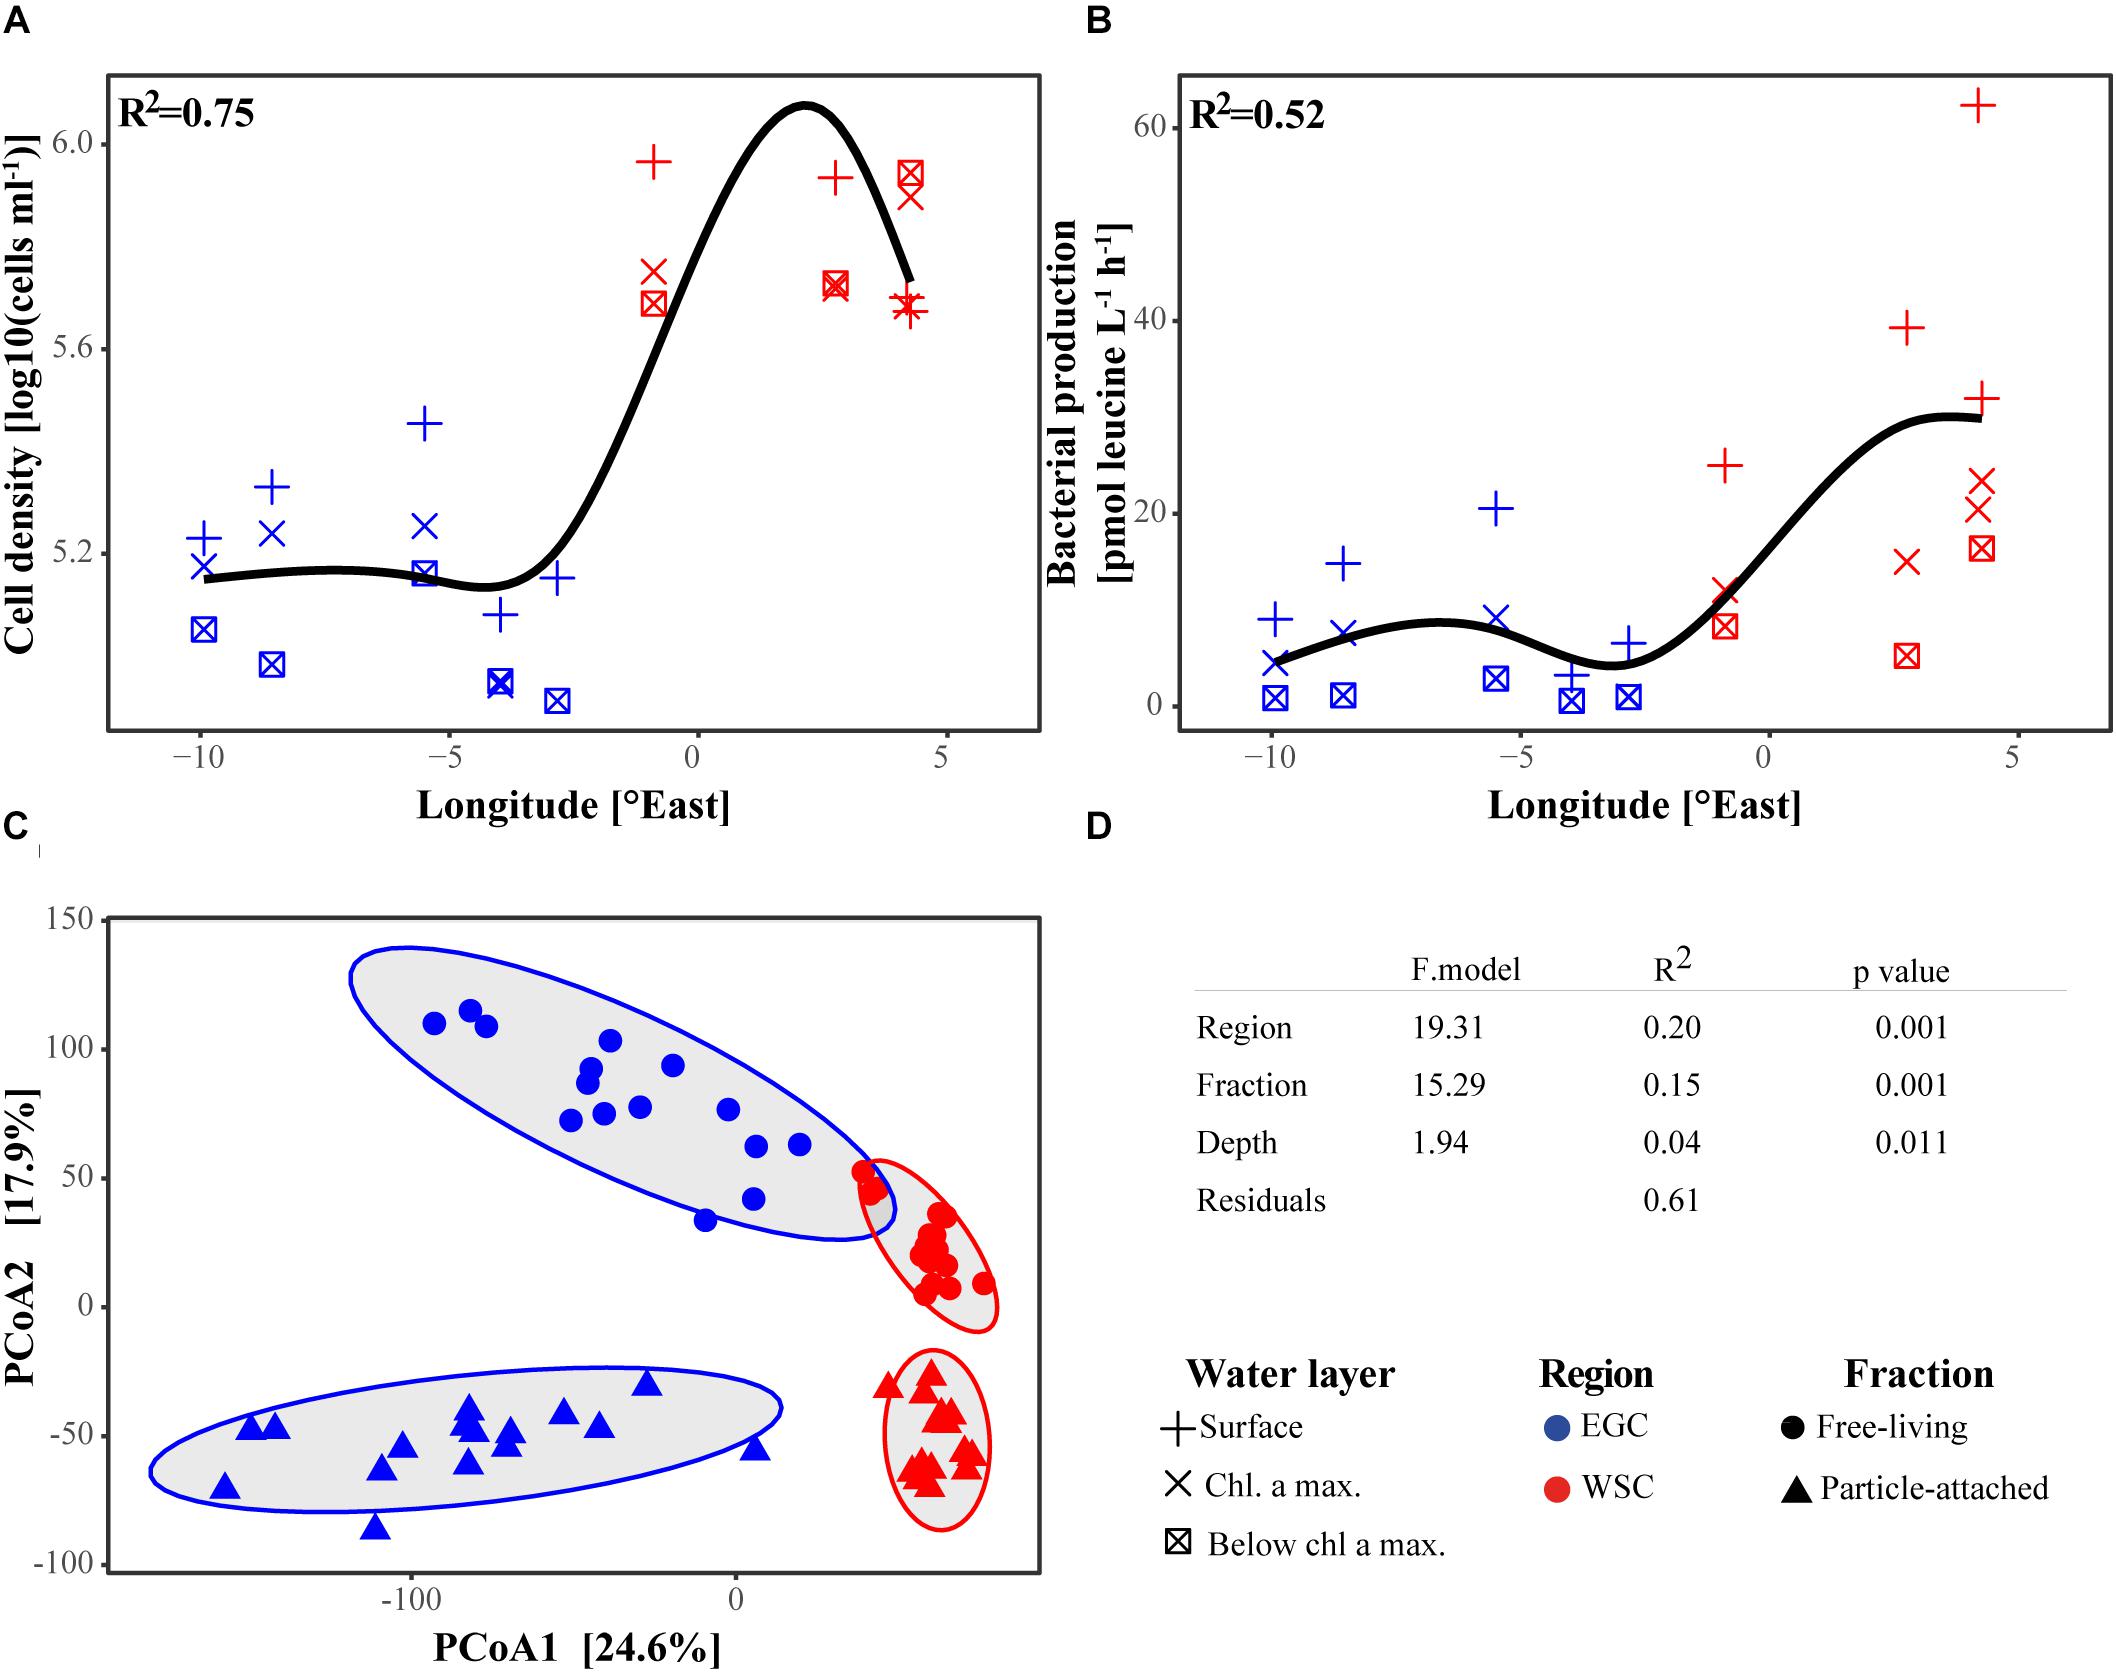
FIGURE 7. Bacterial community characteristics across the Fram Strait. (A,B) Bacterial cell density and production in three water layers: surface (5–10 m), chl a maximum (10–30 m) and below chl a maximum (30–60 m). By applying a generalized additive model with cubic spline we observed a longitudinal trend between the different regions (p-value < 0.05, adjusted r2 > 0.75). (C) PCoA of bacterial community composition in FL and PA fractions in all three water layers based on a Euclidean similarity matrix. The ellipses encompass each of the groups with normal confidence of 0.95. The percentages on both axes represent the explained variance of the axis. (D) Permutational multivariate analysis of variance between the groups of samples (‘ADONIS’ in R package ‘vegan’).
To compare the explanatory power of a range of environmental variables in structuring bacterial communities, we performed redundancy analysis (RDA) and constrained the ordination by the following environmental parameters: temperature, salinity, chl a, and consumed nutrients (ΔNO3, ΔSiO3 and ΔPO4). Due to the different environmental conditions in EGC and WSC regions, we selected these parameters to account for the combined effect of the different water masses (temperature and salinity) and different ecosystem states (chl a and nutrients). The analysis was performed separately for FL and PA bacterial communities, as the fractions may be influenced by different environmental factors (Figures 8A,B). In accordance with the PCoA ordination (Figure 7C), both FL and PA fractions exhibited a strong separation of bacterial communities between EGC and WSC (mainly along RDA axis 1, which explained roughly 80% of the variance). Using a stepwise model selection test (‘ordistep’ algorithm in ‘vegan’ package), we identified that temperature, salinity and chl a were the strongest explanatory variables in the FL fraction, explaining 66% of the total variance. Community variation in the PA fraction was mainly explained by temperature, salinity, chl a and consumed nitrate (ΔNO3), which explained 63% of the total variance. A similar stepwise model selection test for the microbial eukaryotic community revealed that community variation was mainly explained by temperature, salinity, consumed silicate (ΔSiO3) and nitrate (ΔNO3), adding up to 38% of the total explained variance (Supplementary Figure 6C).
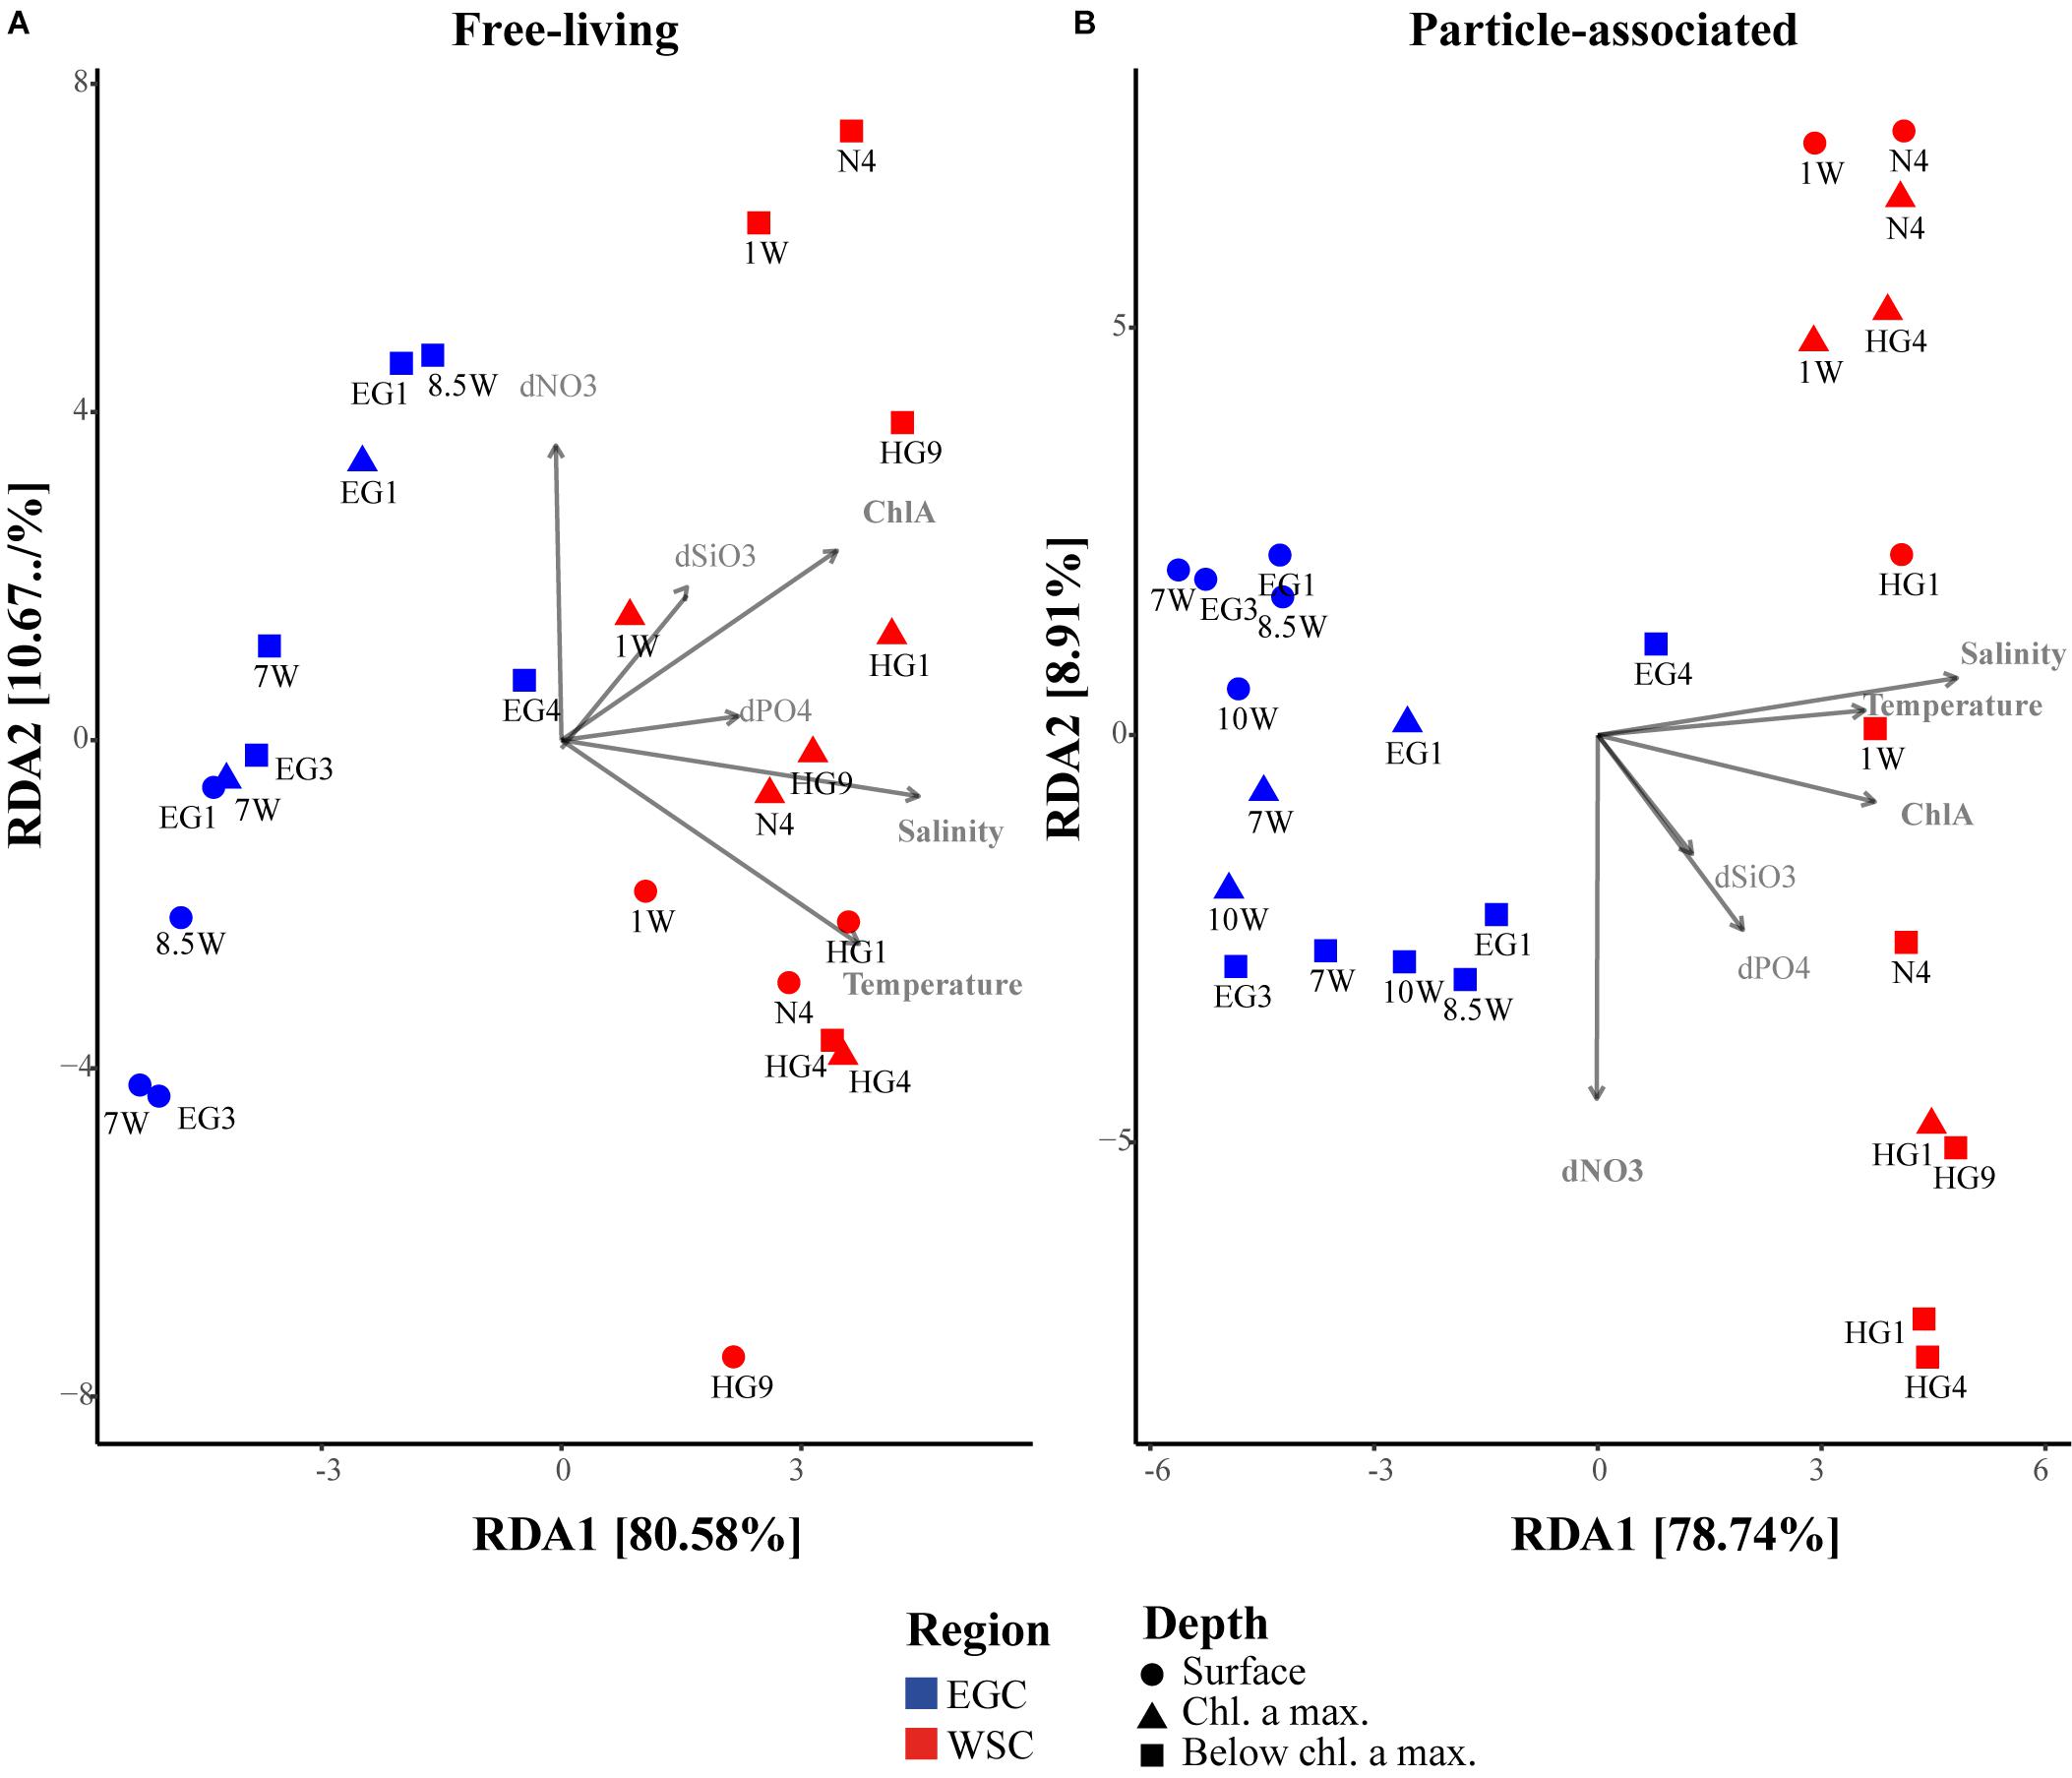
FIGURE 8. RDA ordination of bacterial community composition constrained by environmental variables. (A) Free-living bacteria, (B) particle-associated bacteria. The environmental variables are: Temperature, Salinity, ChlA – chlorophyll a, dSiO3 – ΔSiO3, dPO4 – ΔPO4 and dNO3 – ΔNO3.
Associations Between Bacteria and Eukaryotic Microbes – Based on Co-occurrence Networks
Two separate co-occurrence networks were constructed to examine potential associations between free-living bacteria and microbial eukaryotes (‘FL network’) and between particle-associated bacteria and microbial eukaryotes (‘PA network’) at the chl a max. depth. In the FL network 85% of potential associations were positive, in the sense that sequence-richer taxa of bacteria were associated with sequence-richer taxa of eukaryotes. The PA network consisted of a larger number of total potential associations, but only 71% of them were positive (Supplementary Table 3). An overview of both positive and negative associations (Figure 9) revealed two taxonomic groups that showed highest numbers of associations in both fractions together, the eukaryotic order Syndiniales (Alveolata) and the bacterial order Flavobacteriales (Flavobacteriia). In addition, high number of potential associations was associated with Gammaproteobacteria, such as Alteromonadales, and Oceanospirillales (Figures 9A,C). Among the microbial eukaryotes, two groups showed relatively high numbers of associations: Diatomea and Dinophyceae (Dinoflagellata; Figures 9B,D).
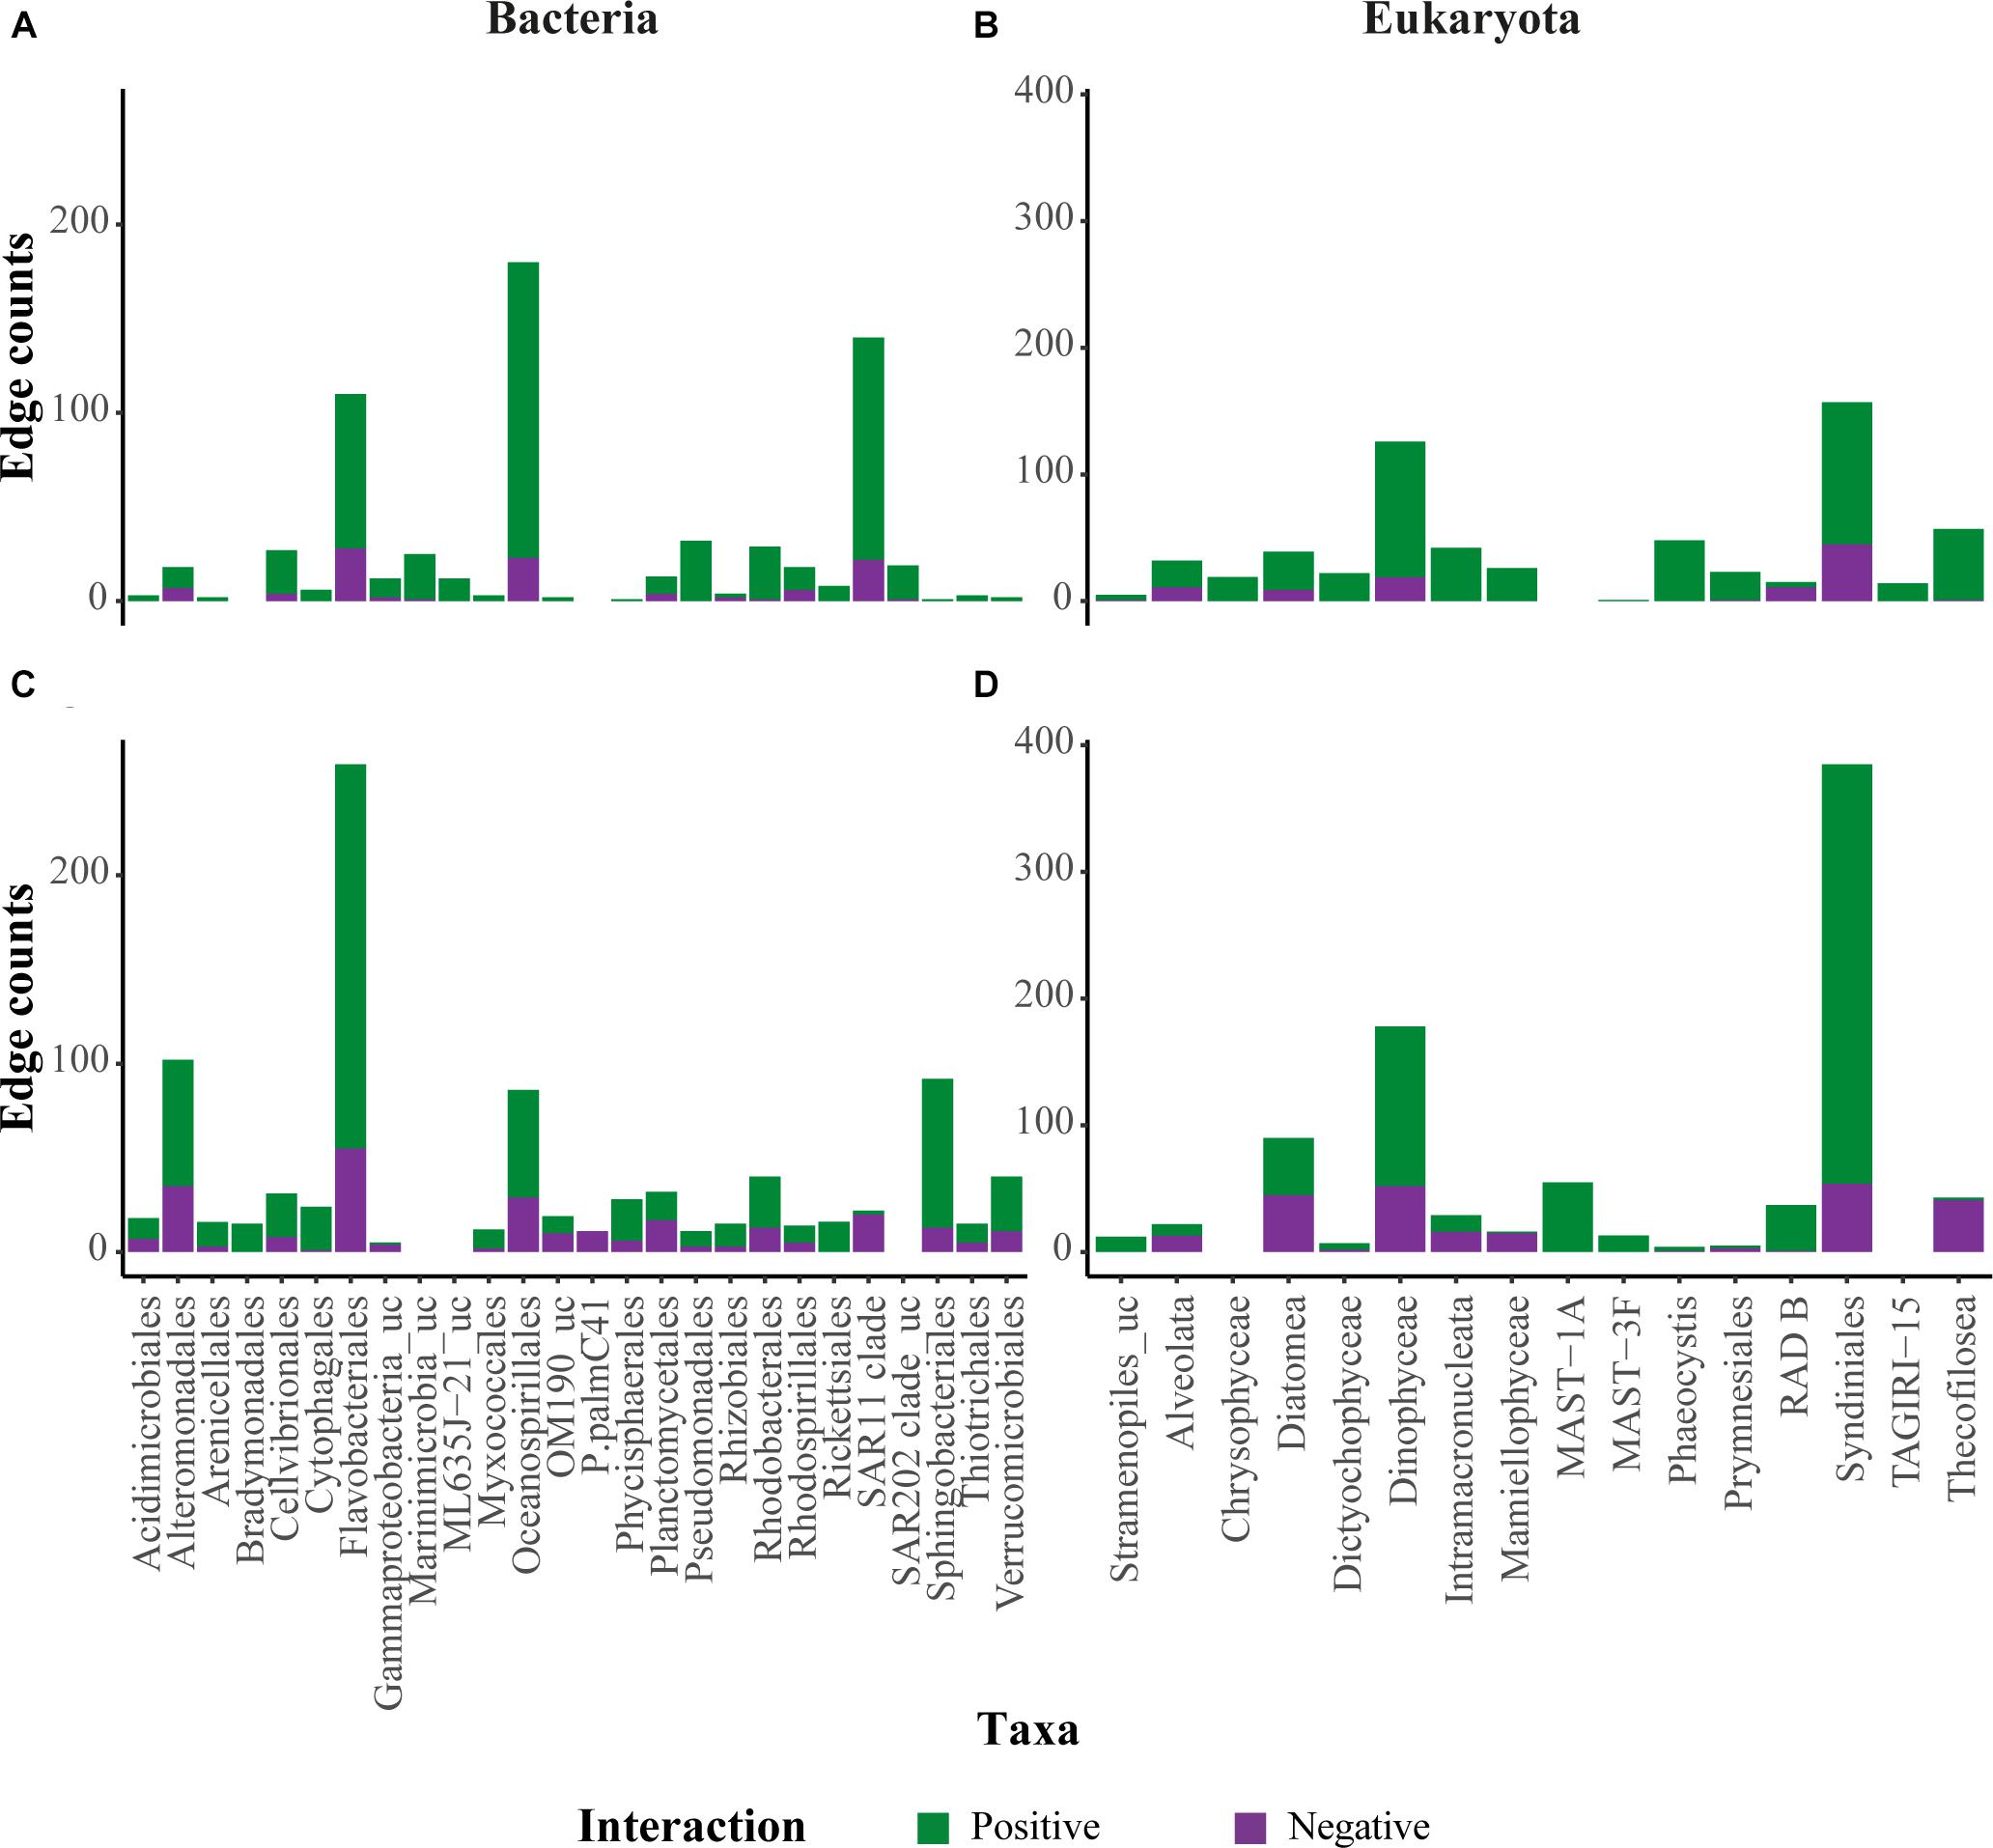
FIGURE 9. Overview of edge counts for selected taxonomic groups in each network. (A,C) Associations between bacteria and eukaryotes in the FL network. (B,D) Associations between bacteria and eukaryotes in the PA network. The y-axis represents the number of edges associated with the different taxa. Positive associations are represented in green, negative associations in purple. Only taxa with more than 3 edges were included in the figure.
In order to identify regionally specific associations of microbial eukaryotes with bacterial taxa, we generated for each fraction a sub-network of positive associations between eukaryotic OTUs and previously identified bacterial daOTU for the EGC and WSC, respectively (Supplementary Figure 3). The sub-network topologies showed different patterns in the FL and the PA networks. Overall, the FL network consisted of 159 nodes of daOTU, out of a total 363 bacterial OTUs in the network (81 daOTU in EGC and 78 in WSC). In the PA network there were 226 nodes of daOTU, out of a total 363 bacterial OTUs in the network (197 daOTU in EGC and 30 daOTU in WSC). Subsequently, the sub-networks were clustered into metanodes, each incorporating OTUs of a specific taxonomic group (Figure 10). The clustered sub-networks of both fractions revealed strong differences between the regions, with larger number of taxon-taxon associations in the EGC. The strongest associations, based on the number of connecting edges, in all sub-networks, were related to co-occurrences of Syndiniales (Alveolata) with various bacterial orders such as Flavobacteriales and Oceanospirillales.
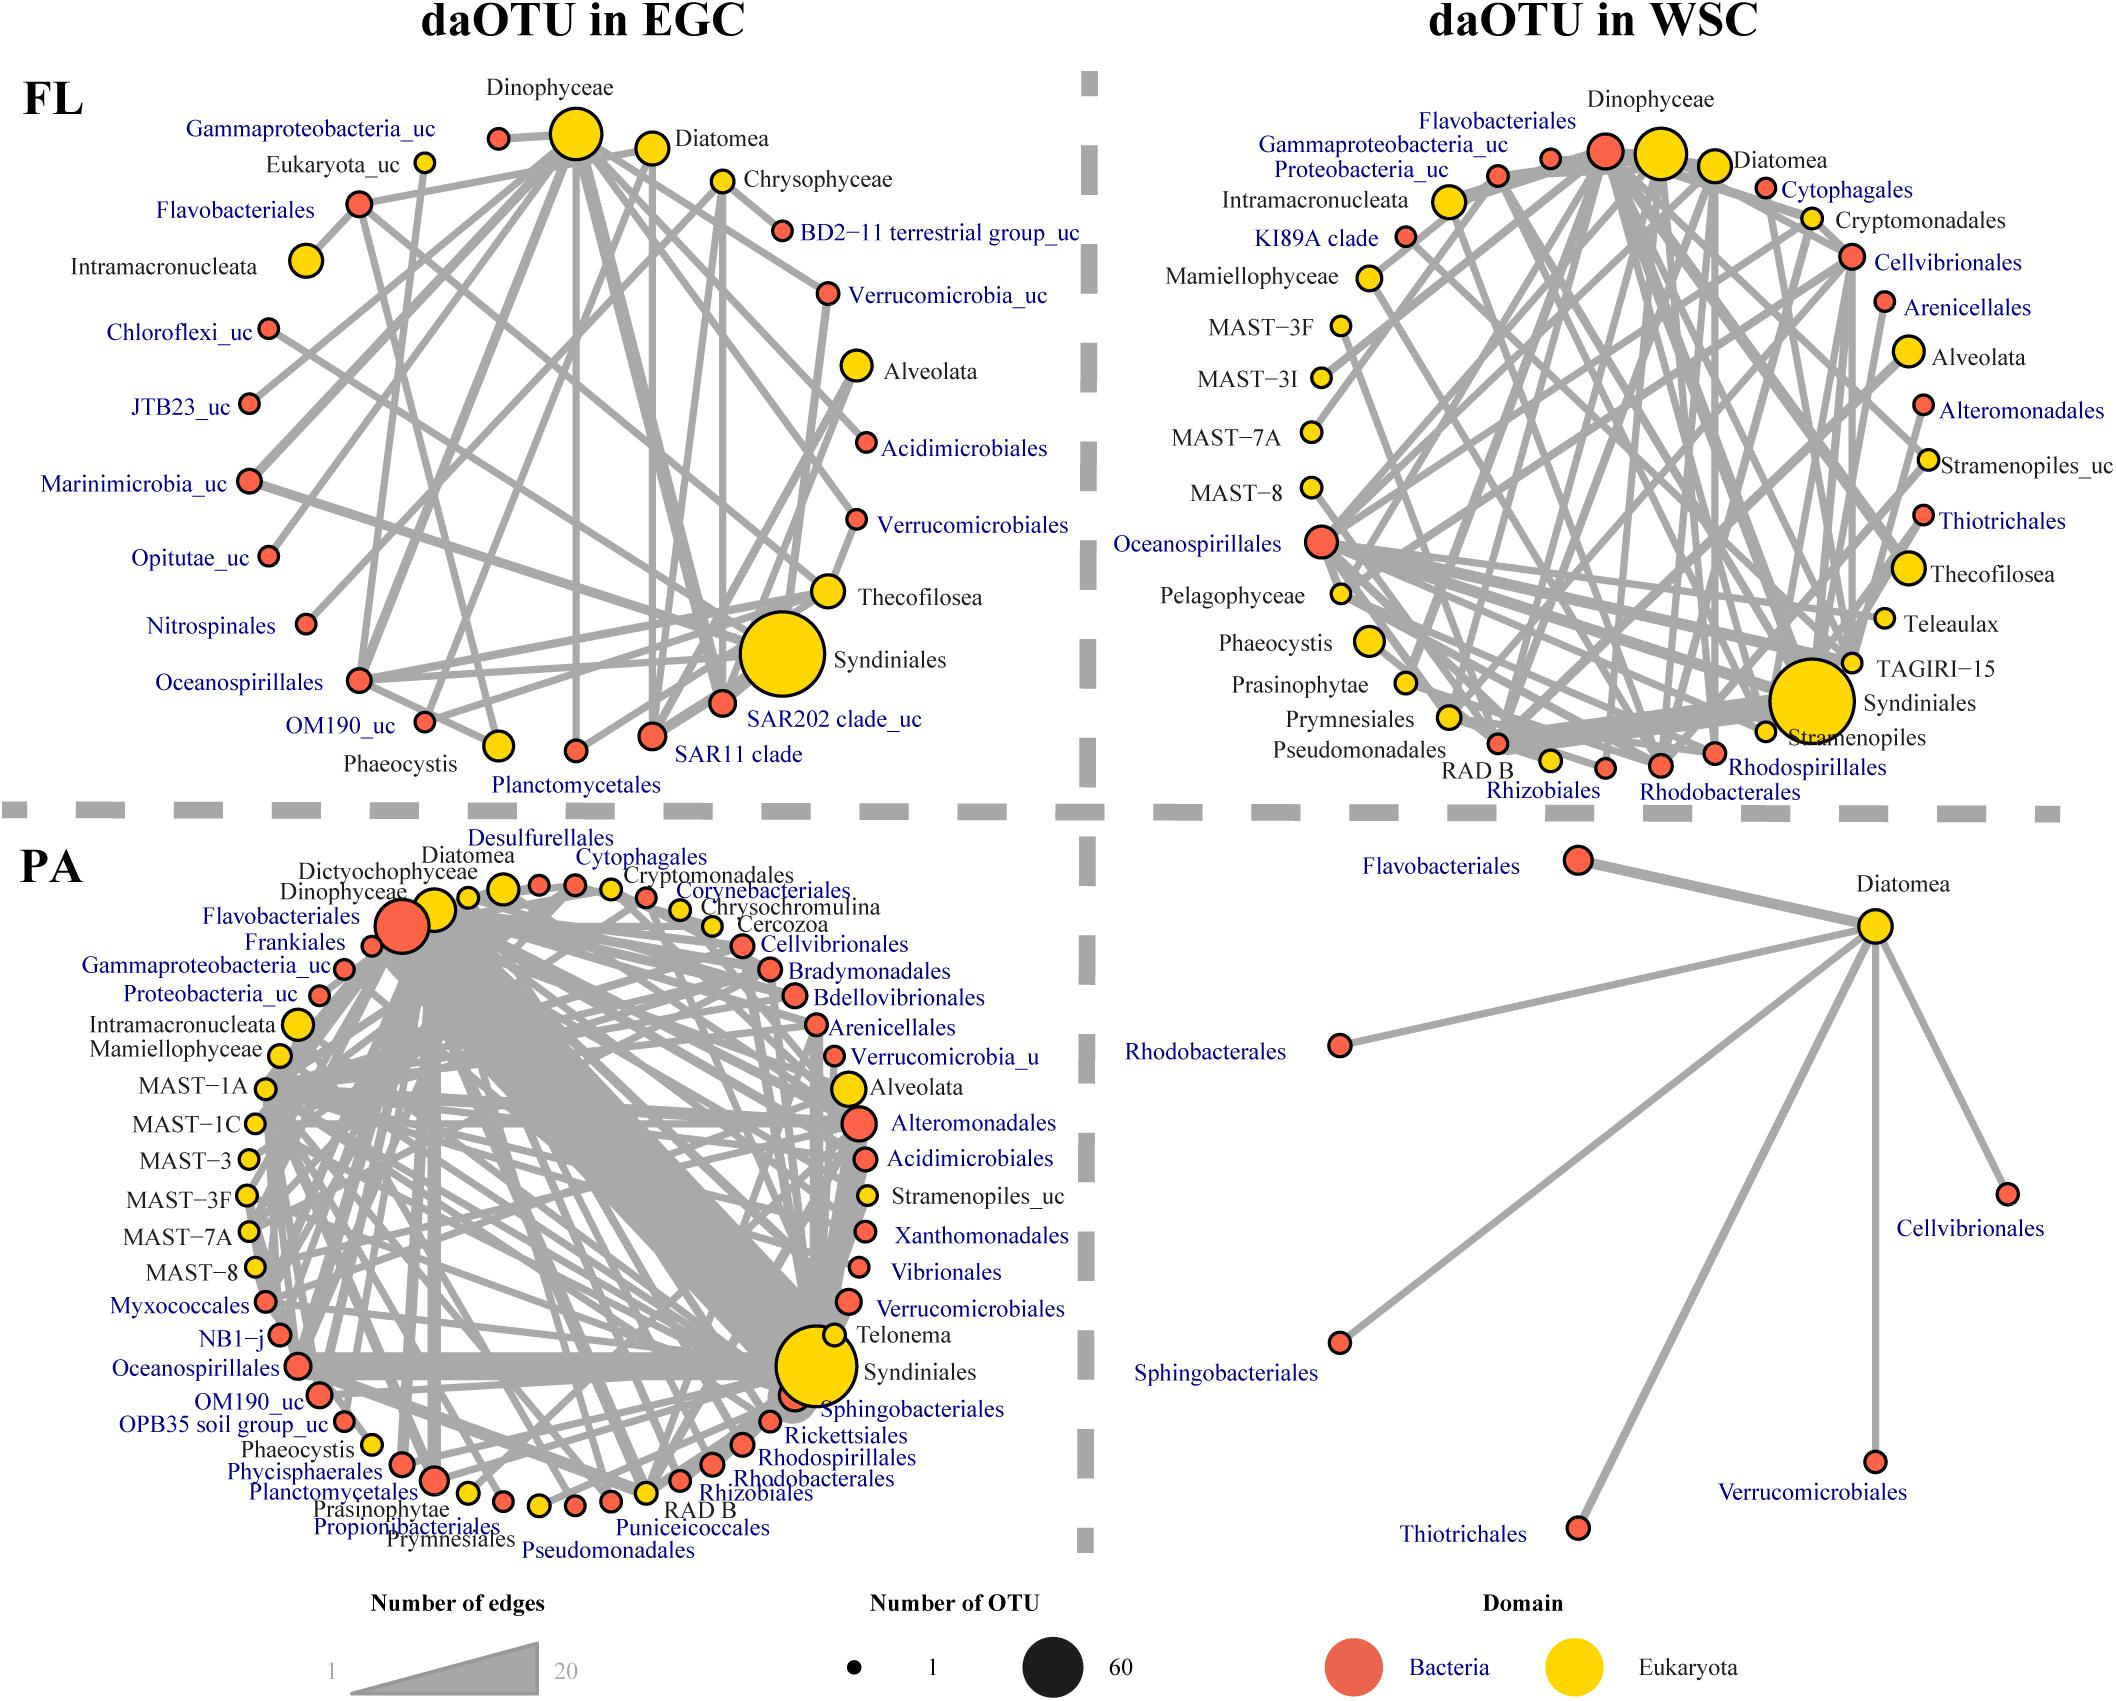
FIGURE 10. Sub-networks of the FL and PA fractions in the chl. a max. of EGC and WSC regions. Taxonomic groups were clustered into metanodes. Colors of the nodes represent the different taxonomic domains, while the size is proportional to the number of OTUs grouped together in the metanode. The edges represent taxon-taxon positive (co-occurrence) associations, and the width of the edges represents the number of associations between the metanodes.
Discussion
Pelagic Ecosystem State – in situ and in silico Observations
In our study we investigated the summer dynamics of pelagic bacterial communities from the photic zone of Fram Strait (top 60 m). Using measurements of physical and biogeochemical parameters, combined with sea ice coverage, we separated the Strait into two main pelagic ecosystem regions (Figure 1). These different regions were directly related to the distinct current systems in the Strait; one transporting Atlantic Water to the Arctic Ocean (WSC) and the other one exporting Polar Water and sea ice (EGC; Beszczynska-Möller et al., 2011). These distinct current systems differed not only in physical characteristics of the water (temperature and salinity) but also in their nutrient concentrations (Table 1 and Supplementary Figure 1). The different geochemical and sea ice conditions potentially affect biological processes in these distinct regions (e.g., nutrient and light limitation of the phytoplankton bloom). We thus used a combination of measured and modeled biogeochemical variables to further investigate the ecosystem states in the two regions.
The high phytoplankton biomass and production estimates (Table 1), as well as elevated bacterial cell densities in the WSC compared to the EGC (Figures 7A,B), are likely related to the decaying phytoplankton bloom (Pinhassi and Hagström, 2000; Riemann et al., 2000; Alonso-Sáez et al., 2008; Buchan et al., 2014). Further evidence for such a relationship has been detected by a previous study in Fram Strait, which showed correlations of bacterial activity with concentrations of amino acids and carbohydrates in the water (Piontek et al., 2014). In the WSC region maximum integrated chl a values during seasonal blooms reach up to 100 mg/m3 (Nöthig et al., 2015). Thus based on the chl a concentrations, the fully depleted nutrients above the pycnocline and the low pCO2 (Table 1 and Supplementary Figure 7), we conclude that we had sampled a post-phytoplankton bloom situation. In the EGC, the low nutrient depletion in surface waters, the low chl a concentration and the high pCO2 rather suggest a pre-phytoplankton bloom stage. Moreover, the stoichiometry-based estimate of new production in both regions was in a comparable range to previous estimates of Nöthig et al. (2015) in Fram Strait as well as to estimates in other regions of the Arctic Ocean (Arrigo et al., 2008; Wassmann et al., 2010; Boetius et al., 2013). The generally high ratio between NO3 and PO4 concentrations in the EGC indicate a Pacific origin of the sampled Polar Water (Wilson and Wallace, 1990), and PO4 may be one of the limiting factors for the development of a phytoplankton bloom in this region, at the time of the sampling (Taylor et al., 1992).
In order to test whether the biogeochemical differences between the sampled regimes represent different ecosystem states, or simply represent hydrographical differences between Polar Water and Atlantic Water, we used surface chlorophyll a dynamics obtained from the coupled FESOM-REcoM2 model (Figure 2 and Supplementary Material; Schourup-Kristensen et al., 2014). In June 2014, when the sea ice cover, hydrographical and nutrient conditions fit well with observations (Supplementary Figures 8, 9), the annual dynamics produced by the model showed an increase in surface chl a concentration in EGC in the second half of June, associated with the seasonal thinning of the sea ice in the region (Leu et al., 2011; Nöthig et al., 2015). Moreover, in the WSC the model showed a decline in surface chl a concentration throughout the month. In summary, our observations and the model results support the hypothesis that during the time of sampling early phytoplankton bloom conditions prevailed in the ice-covered EGC (first half of June), and that the phytoplankton bloom of the ice-free WSC was already in decline (second half of June).
Functional and Regional Differences in Microbial Communities Across the Fram Strait
Both WSC and EGC regions exhibited a large number of OTUs, which were unique to one of the regions (Figure 3). However, these OTUs represented only a small proportion of the total sequence abundance of the bacterial community, and consisted of taxa, which were previously identified as rare bacterial community members in the Arctic Ocean (Galand et al., 2009). The vast majority of the sequence proportion was related to OTUs which were shared between the regions and fractions (Figure 4). Moreover, bacterial community variations in the FL and PA fractions were explained by the same environmental parameters, suggesting that both fractions are subject to similar environmental drivers (Hanson et al., 2012). Hence, we hypothesized that community variation was mostly driven by environmental factors such as bloom stage, selecting for different sequence proportions of shared OTUs. It is important to note that size-fractionated filtration may lead to different observations compared to bulk filtration (Padilla et al., 2015). In this study we did not observe a clogging of filters, but cannot exclude effects on FL and PA fractions.
In order to investigate differences in the relative contributions of the shared OTUs to the communities in WSC and EGC, we identified differentially abundant OTUs (daOTU) in both the FL and PA fractions (Supplementary Figure 3). Flavobacteria and Gammaproteobacteria were the two main heterotrophic bacterial taxa which showed high numbers of daOTU and numerous enriched taxa in both fractions (Figure 5 and Supplementary Figure 3). For both fractions combined, the WSC consisted of almost twice the number of flavobacterial daOTU compared to EGC (176 and 107 daOTU, respectively), suggesting an enrichment of this taxonomic group by post-bloom conditions in this region. Flavobacteria specialize on targeting complex organic biopolymers and were previously described to respond to phytoplankton blooms in high latitudes (Simon et al., 1999; Teeling et al., 2012; Williams et al., 2013; Chafee et al., 2018). Moreover, Cryomorphaceae, a significantly enriched flavobacterial family in the FL fraction of WSC (Figure 5), was previously identified as one of the main taxa responding to a flagellate bloom in mesocosm experiments (Pinhassi et al., 2004).
Additionally, in both fractions, there was a large number of daOTU and several significantly enriched families related to Gammaproteobacteria (Figure 5 and Supplementary Figure 3). These opportunistic copiotrophs, which have previously been described from both FL and PA fractions, are highly diverse and specialized in adapting to a wide range of carbon sources, also responding to different stages of phytoplankton blooms (Alonso-Sáez et al., 2008; Teeling et al., 2012; Nikrad et al., 2014). Interestingly, the genus Balneatrix (Oceanospirillales) which was previously identified to strongly correlate with phytoplankton bloom presence in the North Sea (Wemheuer et al., 2014), accounted for 30 daOTU in the WSC and only 5 daOTU in the EGC, which may be linked to the different phytoplankton bloom conditions in the region. Furthermore, the order Pseudoalteromonadales which consisted of several significantly enriched families in both fractions in EGC (Figure 5), contains several psychrophilic genera which were previously found in sea ice (Bowman et al., 1997; Brown, 2001; Brinkmeyer et al., 2003; Eric Collins et al., 2010; Yu et al., 2015), and their enrichment in the EGC may thus be partly a result of their release from ice-associated communities. An interesting observation was provided by two outlier samples. Although they originated from the WSC, the proximity of station 1W and HG9 to the sea ice edge (Figure 1), potentially resulted in bacterial communities more similar to stations from the EGC (Figure 7C). This may indicate that the effect of the seasonal phytoplankton bloom extends into the zone where both water masses mix, e.g., by eddies (Wekerle et al., 2017).
Several cryptic taxonomic groups, such as Chloroflexi (SAR202), Marinimicrobia (SAR406) and various members of Deltaproteobacteria, were significantly enriched in EGC (Figure 5), and also consisted of a large number of unique OTUs in this region. These enriched taxonomic groups in the ice-covered EGC were previously reported from surface waters in the western Svalbard region (WSC) during the Arctic winter (Wilson et al., 2017). Therefore, our results support and strengthen the hypothesis of Wilson et al. (2017) that bacterial community dynamics in Fram Strait are to a large extent affected by seasonal variability (e.g., availability of light under changing sea ice conditions), rather than hydrographic differences between water masses.
Enriched eukaryotic taxa differed strongly between the EGC and WSC regions (Supplementary Figure 5), with the taxonomic groups being consistent with previously reported seasonal dynamics in the Arctic Ocean (Lovejoy, 2014). In the EGC region all enriched taxa were related to previously identified, dominant members of pelagic Arctic winter communities (e.g., Syndiniales; Guillou et al., 2008; Jephcott et al., 2016; Marquardt et al., 2016). Two different taxonomic groups of phytoplankton were enriched in the WSC: the class of green algae Prasinophytae abundant photosynthetic organisms in late summer-autumn seasons in the Arctic (Lovejoy et al., 2007; Vader et al., 2015; Marquardt et al., 2016; Metfies et al., 2016; Joli et al., 2017). Furthermore, several heterotrophic eukaryotic taxa (e.g., Thecofilosea) were enriched in the WSC. These organisms are mainly grazers and depend on the presence of phytoplankton and bacteria (Monier et al., 2013); their higher representation may thus be linked to the declining phytoplankton bloom in the WSC. Microbial eukaryotic community composition clearly differed between the two regions (Supplementary Figure 6C). Interestingly, stations 10 and 8.5 W showed some similarity to the WSC region, which may be related to a coastal phytoplankton bloom east of Greenland (Supplementary Figure 8). However, overall our observations of the microbial eukaryotic community further support our classification of early bloom conditions in the EGC and late bloom conditions in WSC.
Co-occurrence Networks Reveal Potential Candidates for Cross-Domain Interactions
Numerous studies have described shifts in bacterial community composition during phytoplankton blooms (Teeling et al., 2012; Wemheuer et al., 2014; Chafee et al., 2018), but very little is known about specific biotic interactions between bacteria and phytoplankton during blooms (Töpper et al., 2010; Amin et al., 2012; Hartmann et al., 2013; Lima-Mendez et al., 2015). Our results revealed an enrichment of specific bacterial taxa in the different regions, which we suggest to be related to the seasonal development of the phytoplankton bloom. Using network co-occurrence analyses (Faust and Raes, 2012), we therefore tested whether these enriched taxa exhibit potential associations with eukaryotic microbes in the chl a max. communities.
Both FL and PA networks consisted of a large number of edges (Figure 9 and Supplementary Table 3), which may indicate potential ecological interactions between taxa. Among the bacterial taxa in the FL network, a large number of associations was related to the typically free-living SAR11 clade (Giovannoni, 2017). In the PA network, on the other hand, large number of associations were related to typical particle-associated Gammaproteobacteria, such as Alteromonadales (Crespo et al., 2013; Fontanez et al., 2015). In both fractions, Flavobacteria and Syndiniales outnumbered all other taxonomic orders in terms of the number of associations. These observations are in line with a previous report from the global plankton interactome study conducted as part of the global Tara Oceans expedition (Lima-Mendez et al., 2015), which did, however, not cover the Arctic Ocean.
Roughly 30–40% of bacterial nodes in the networks consisted of daOTU associated with one or more eukaryotic taxa. Interestingly, “regional” (WSC vs. EGC) sub-networks displayed strong differences between both regimes in the PA fraction, with a much higher number of associations in the EGC (Figure 10). Little is known about the lifestyle and physiology of many of the organisms identified in the networks, especially for the bacterial fraction, and the translation of observed associations into biological traits is thus extremely limited (Ramanan et al., 2016). Furthermore, in many cases the association may represent a common response of taxonomic groups to environmental conditions, rather than direct interaction between them (Weiss et al., 2016). Nevertheless, the observed cross-domain associations showed clear differences between the regions with different phytoplankton bloom conditions, resulting in the enrichment of specific bacterial taxa and the development of distinct ecological networks. It has been previously proposed that shifts in the timing and composition of phytoplankton blooms, as well as temporal mismatches with grazers resulting in an altered food web, are among the main impacts of climate change in the Arctic (Soltwedel et al., 2016; Engel et al., 2017). Our observations of specific associations between eukaryotes and bacteria in the plankton suggest that such ecological shifts may be accompanied by substantial changes in the microbial community structure.
Conclusion
Our study revealed strong differences in pelagic microbial community activity and structure in the photic layers of the ice-free eastern (WSC) and ice-covered western (EGC) Fram Strait during summer 2014. Measured and modeled biogeochemical parameters suggested distinct ecosystem states in the two regions, namely different stages of the summer phytoplankton bloom, as a result of differences in sea ice cover and irradiance. Although it is challenging to conclusively decouple effects of water masses, seasonally driven biogeochemistry and biotic associations, our study shows that differences in bacterial communities between the regions could be explained by environmental parameters associated with phytoplankton bloom dynamics. This includes a strong increase in bacterial cell densities and activity in response to a declining phytoplankton bloom in the WSC, with an enrichment of phytoplankton bloom associated bacterial taxa commonly known to degrade phytoplankton products, such as Flavobacteria. In contrast, the EGC region showed high relative sequence proportions of bacterial taxa that have been associated with Arctic winter conditions (e.g., SAR202 clade, Marinimicrobia and Deltaproteobacteria). Moreover, co-occurrence networks provided evidence for a high variety of potential interactions between bacteria and microbial eukaryotes in the early bloom conditions, and their possible specialization with the advancement of the phytoplankton bloom. In times of a rapidly changing Arctic Ocean, our results highlight the potential impact of future ice-free summers on the structure and function of Arctic Ocean pelagic microbial communities. Additional sampling throughout the year will help to better resolve seasonally driven microbial community dynamics and contrast them to long-term shifts.
Materials and Methods
Field Sampling
Samples were collected in Fram Strait during the Polarstern expedition PS85 (June 6th – July 3rd 2014) from the eastern Greenland shelf to the west coast of Spitsbergen (Supplementary Table 1 and Figure 1). Sampling was carried out with 12 L Niskin bottles mounted on a CTD rosette (Sea-Bird Electronics Inc. SBE 911 plus probe) equipped with double temperature and conductivity sensors, a pressure sensor, altimeter, chlorophyll fluorometer, and transmissometer. The chlorophyll maximum depth (chl a max) was determined based on chl a fluorescence during the downcast, while the water samples were collected during the upcast. Along the transect samples were collected from surface water (5–10 m), the chl a max (10–30 m) and below the chl a max (30–60 m, Supplementary Table 1). Hydrographic data of the seawater including temperature and salinity were retrieved from the PANGAEA database (Rabe et al., 2014). Water masses were identified based on their hydrographic characteristics, according to Rudels et al. (2013).
Sampling for Bacterial Communities
For assessing bacterial community composition, 2 L of water were filtered through successive membrane filters of 3 μm (Whatman Nucleopore, 47 mm polycarbonate), and 0.22 μm (Millipore Sterivex filters) using a peristaltic pump (Masterflex; Cole Parmer). All samples were stored at -20°C until DNA isolation.
Sampling for Eukaryotic Microbial Communities
For assessing eukaryotic community composition, 2 L subsamples were taken in PVC bottles from the Niskin water samplers. Eukaryotic microbial cells were collected by sequential filtration using a Millipore Sterifil filtration system (Millipore, United States). Each water sample was filtered through three different mesh sizes (10, 3, and 0.4 μm) on 45 mm diameter Isopore Membrane Filters at 200 mbar. All samples were stored at -20°C until DNA isolation.
DNA Isolation and Amplicon Sequencing
Bacteria
Genomic bacterial DNA was isolated from the 3 μm and the 0.22 μm filter membranes to analyze the particle-associated (PA) and the free-living (FL) community, respectively, in a combined chemical and mechanical procedure using the PowerWater DNA Isolation Kit (MO BIO Laboratories, Inc., Carlsbad, CA, United States). Prior to DNA isolation the sterivex cartridges of the 0.22 μm membranes were cracked open in order to place the filters in the kit-supplied bead beating tubes. The isolation was continued according to the manufacturer’s instructions, and DNA was stored at -20°C. Library preparation was performed according to the standard instructions of the 16S Metagenomic Sequencing Library Preparation protocol (Illumina, Inc., San Diego, CA, United States). The hypervariable V3–V4 region of the bacterial 16S rRNA gene was amplified using bacterial primers S-D-Bact-0341-b-S-17 (5′-CCTACGGGNGGCWGCAG-3′) and S-D-Bact-0785-a-A-21 (5′-GACTACHVGGGTATCTAATCC-3′; Klindworth et al., 2013). Sequences were obtained on the Illumina MiSeq platform in a 2 × 300 bp paired-end run (CeBiTec Bielefeld, Germany), following the standard instructions of the 16S Metagenomic Sequencing Library Preparation protocol (Illumina, Inc., San Diego, CA, United States).
Eukaryotic Microbes
Genomic eukaryotic DNA was isolated from the 10, 3, and 0.4 μm filter membranes using the NucleoSpin Plant Kit (Machery-Nagel, Germany), following the manufacturer protocol. The resulting DNA-extracts were stored at -20°C. DNA concentrations were determined using the Quantus Fluorometer (Promega, United States) according to the manufacturer’s protocol, and equal volumes of the isolated genomic DNA from the three different filter fractions were pulled together. Library preparation was performed according to the standard instructions of the 16S Metagenomic Sequencing Library Preparation protocol (Illumina, Inc., San Diego, CA, United States). The hypervariable V4 region of the eukaryotic 18S rRNA gene was amplified using 528iF (5′-GCGGTAATTCCAGCTCCAA-3′) and 964iR (5′-ACTTTCGTTCTTGATYRR-3′) primers. All PCRs had a final volume of 25 μL and contained 12.5 μl of KAPA HIFI Mix (Kapa Biosystems, Roche, Germany), 5 μl of each primer 1 μmol L-1 and 2.5 μl DNA-template ∼5 ng. The DNA-template was a mix of equal volumes of genomic DNA isolated from the three different filter fractions, i.e., 10, 3, and 0.4 μm. PCR amplification was performed in a thermal cycler (Eppendorf, Germany) with an initial denaturation (95°C, 3 min) followed by 25 cycles of denaturation (95°C, 30 s), annealing (55°C, 30 s), and extension (72°C, 30 s) with a single final extension (72°C, 5 min). The PCR products were purified from an agarose gel 1% w/v with the AMPure XP PCR purification kit (Beckman Coulter, Ing., United States) according to the manufacturer’s protocol. Subsequent to purification DNA concentrations in the samples were determined using the Quantus Fluorometer (Promega, United States). Subsequently, indices and sequencing adapters of the Nextera XT Index Kit (Illumina, United States) were attached in the course of the Index PCR. All PCRs had a final volume of 50 μL and contained 25 μl of KAPA HIFI Mix (Kapa Biosystems, Roche, Germany), 5 μl of each Nextera XT Index Primer 1 μmol L-1, 5 μl DNA-template ∼5 ng and 10 μl PCR grade water. PCR amplification was performed in a thermal cycler (Eppendorf, Germany) with an initial denaturation (95°C, 3 min) followed by 8 cycles of denaturation (95°C, 30 s), annealing (55°C, 30 s), and extension (72°C, 30 s) with a single final extension (72°C, 5 min). Prior to quantification of the amplification products with the Quantus Fluorometer (Promega, United States) for sequencing the final library was cleaned up using the AMPure XP PCR purification kit (Beckman Coulter, Ing., United States). Sequences were obtained on the Illumina MiSeq platform in a 2 × 300 bp paired-end run (AWI Bremerhaven, Germany), following the standard instructions of the 16S Metagenomic Sequencing Library Preparation protocol (Illumina, Inc., San Diego, CA, United States).
Bioinformatics and Statistical Analyses
Both bacterial and eukaryotic libraries were subject to similar bioinformatic pipelines. The raw paired-end reads were primer-trimmed using ‘cutadapt’ (Martin, 2011), quality trimmed using ‘trimmomatic’ with a sliding window of four bases and a minimum average quality of 15 (v0.32; Bolger et al., 2014). The reads were merged using PEAR (v0.9.5; Zhang et al., 2014), and all merged reads below 350 bp or above 450 bp were removed from the dataset. Clustering into OTUs was done with the ‘swarm’ algorithm using default parameters (v2.0; Mahé et al., 2015). Chimeric sequences were identified and removed using ‘uchime’ function in VSEARCH (v1.9.7; Rognes et al., 2016). One representative sequence per OTU was taxonomically classified using ‘SINA’ (SILVA Incremental Aligner; v1.2.11; Silva reference database release 128; Quast et al., 2013) at a minimum alignment similarity of 0.9, and a last common ancestor consensus of 0.7 (Pruesse et al., 2012). The OTUs which were not taxonomically assigned to Bacteria/Eukarya or occurred with only a single sequence in the whole dataset (‘singletons’) were excluded from further analysis. Furthermore, OTUs in the bacterial dataset which were taxonomically assigned to chloroplast or mitochondria were excluded from further analysis, and OTUs in the eukaryotic dataset which were taxonomically assigned to metazoa were excluded as well.
All statistical analyses were conducted using R (v3.4.1)1 in RStudio (v1.0.153; RStudio Team, 2015). Sample data matrices were managed using the R package ‘phyloseq’ (v1.20.0; McMurdie and Holmes, 2013) and plots were generated using the R package ‘ggplot2’ (v2.2.1; Gómez-Rubio, 2017). A prevalence threshold (i.e., in how many samples did a taxon appear at least once) of 5% was applied to the OTU table prior to downstream analysis following (Callahan et al., 2016). All alpha diversity parameters and curves were obtained using R package ‘iNEXT’ (v2.0.12; Hsieh et al., 2018). The rarefaction curves for each sample were generated based on 40 equaly spaced rarefied sample sizes with 100 iterations.
Principal coordinate analysis was conducted on variance stabilized OTU abundance matrices (McMurdie and Holmes, 2014). The significance of the clustering was tested using the ‘ADONIS’ function in the R package ‘vegan’ (v2.4-5; Oksanen, 2017). To determine which environmental variables were significantly correlated with the community composition, a stepwise ordination significance test was performed using the ‘ordistep’ function in the R package ‘vegan’ (v2.4-5; Oksanen, 2017). The fold-change in abundance of each OTU between the regions was calculated using the R package ‘DEseq2’ (v1.16.1; Love et al., 2014). The method applies a generalized exact binomial test on variance stabilized OTU abundance. The taxonomic enrichment test was performed using the generally applicable gene-set enrichment method in the R package ‘GAGE’ (v2.26.3; Luo et al., 2009). The results were filtered by significance, after correction for multiple-testing according to Benjamini and Hochberg (1995) with an adjusted p-value < 0.05. The shared OTUs calculations and visualization were conducted using R packages ‘UpSetR’ (v1.3.3; Conway et al., 2017) and ‘VennDiagram’ (v1.6.18; Chen and Boutros, 2011).
Co-occurrence Network Analysis
The network analysis was conducted separately using the chl a max. FL and PA bacterial communities. The cross-domain co-occurrence networks between bacteria and eukaryotes were constructed using CoNet (v1.1.1beta; Faust and Raes, 2016), as described in Lima-Mendez et al. (2015). The measure-specific p-values were merged using Brown’s method (Brown, 1975) and correction for multiple-testing was performed according to Benjamini and Hochberg (1995). Edges with an adjusted p-value above 0.05 were discarded. The constructed networks were further analyzed and visualized using the R package ‘igraph’ (v1.1.2; Csardi and Nepusz, 2006).
Calculation of Consumed Inorganic Nutrients
The raw nutrient concentration measurements were retrieved from PANGAEA (Graeve and Ludwichowski, 2017). The nutrient consumption (Δ) at each station was calculated by subtracting the mean value of all collected measurements above 50 m from the mean value of all collected measurements between 50 and 100 m (below the seasonal pycnocline). The integrated chlorophyll a and inorganic nutrient values were calculated according to (Boss and Behrenfeld, 2010). The productivity estimates were calculated using the Redfield ratio 106 C: 16 N : 1 P, and for diatom contribution the ratio of 1:1 N:Si was assumed (see Supplementary Material).
Bacterial Abundance and Productivity
Bacterial abundance was determined by flow cytometry (FACSCalibur, Becton Dickinson). Samples were fixed with glutaraldehyde at 1% final concentration and stored at -20°C. Prior to analysis, samples were stained with the fluorescent dye SybrGreen I (Invitrogen) that binds to DNA. Bacterial cell numbers were estimated after visual inspection and manual gating of the bacterial population in the cytogram of side scatter vs. green fluorescence. Fluorescent latex beads (Polyscience, Becton Dickinson) were used to normalize the counted events to volume (Gasol and Del Giorgio, 2000).
The incorporation of 3H-leucine (specific activity 100 Ci mmol-1) was determined to estimate bacterial production (BP). The radiotracer was added at a saturating final concentration of 20 nmol L-1 before three replicate samples were incubated for 4–6 h in the dark close to in situ temperature at 0–2°C. Incubations were stopped by the addition of trichloroacetic acid (TCA) at a final concentration of 5%. Samples were then processed by the centrifugation method according to Smith and Azam (1992). Briefly, samples were centrifuged at 14,000 × g to obtain a cell pellet that was washed twice with 5% TCA. Incorporation into the TCA-insoluble fraction was measured by liquid scintillation counting after resuspension of the cell pellet in scintillation cocktail (Ultima Gold AB, Perkin Elmer).
Chlorophyll a Measurements
The concentration of chl a was determined from 0.5 to 2 L of seawater filtered onto glass fiber filters (Whatman GF/F) under low vacuum pressure (<200 mbar); the filters were stored at -20°C before analysis. Pigments were extracted with 10 ml of 90% acetone. The filters were treated with an ultrasonic device in an ice bath for less than a minute, and then further extracted in the refrigerator for 2 h. Subsequently they were centrifuged for 10 min at 5000 rpm at 4°C prior to measurement. The concentration was determined fluorometrically (Turner Designs), together with total phaeophytin concentration after acidification (HCl, 0.1 N) based on methods described in Edler (1979) and Evans (1980), respectively. The standard deviation of replicate test samples was <10%.
The Biogeochemical Model FESOM-REcoM2
To estimate biological productivity in areas and time periods that were not covered by sampling, we used the biogeochemical model REcoM2 coupled to the Finite Element sea ice Ocean Model (FESOM; Schourup-Kristensen et al., 2014). The model runs in a global setup and describes the ocean, sea ice and marine biogeochemistry, thus making it possible for us to estimate the phytoplankton bloom development stage in both the western, ice-covered part of Fram Strait and the eastern ice-free part (see Supplementary Information).
Data Accession Numbers and Analyses Repository
Data are accessible via the Data Publisher for Earth & Environmental Science PANGAEA (www.pangaea.de): chlorophyll a measurements - doi: 10.1594/PANGAEA.887840; bacterial counts and productivity - doi: 10.1594/PANGAEA.887881. Raw paired-end sequence, primer-trimmed reads were deposited in the European Nucleotide Archive (ENA; Silvester et al., 2018) under an umbrella project number PRJEB28027, or PRJEB26163 for Bacteria and PRJEB26288 for Microbial eukaryotes. The data were archived using the brokerage service of the German Federation for Biological Data (GFBio; Diepenbroek et al., 2014). Scripts for processing data can be accessed at https://github.com/edfadeev/Bact-comm-PS85.
Author Contributions
EF, CB, IS, and AB designed and conducted the study. IS and KM provided sequence data for the study. AE and JP provided the cell counts and bacterial productivity data. E-MN conducted the biogeochemical measurements. VS-K provided the modeled chl a estimates. EF analyzed the data and wrote the manuscript with guidance from CB, AB, and IS. All authors contributed to the final version of the manuscript.
Funding
This project has received funding from the European Research Council (ERC) under the European Union’s Seventh Framework Program (FP7/2007-2013) research project ABYSS (Grant Agreement No. 294757) to AB. Additional funding came from the Helmholtz Association, specifically for the FRAM infrastructure, and from the Max Planck Society. This publication is Eprint ID 46861 of the Alfred Wegener Institute Helmholtz Center for Polar and Marine Research, Bremerhaven, Germany.
Conflict of Interest Statement
The authors declare that the research was conducted in the absence of any commercial or financial relationships that could be construed as a potential conflict of interest.
Acknowledgments
We thank the captain and crew of RV Polarstern expedition PS85, as well as the chief scientist Ingo Schewe. We also thank Halina Tegetmeyer and Theresa Hargesheimer for bacterial sample processing and DNA extraction and sequencing, Laura Hehemann for producing the GIS representation of Fram Strait and Wilken-Jon von Appen for assisting with analysis of water column characteristics. This work was conducted in the framework of the HGF Infrastructure Program FRAM of the Alfred-Wegener-Institute Helmholtz Center for Polar and Marine Research.
Supplementary Material
The Supplementary Material for this article can be found online at: https://www.frontiersin.org/articles/10.3389/fmars.2018.00429/full#supplementary-material
Footnotes
References
Alonso-Sáez, L., Sánchez, O., Gasol, J. M., Balagué, V., and Pedrós-Alio, C. (2008). Winter-to-summer changes in the composition and single-cell activity of near-surface Arctic prokaryotes. Environ. Microbiol. 10, 2444–2454. doi: 10.1111/j.1462-2920.2008.01674.x
Alonso-Sáez, L., Zeder, M., Harding, T., Pernthaler, J., Lovejoy, C., Bertilsson, S., et al. (2014). Winter bloom of a rare betaproteobacterium in the Arctic Ocean. Front. Microbiol. 5:425. doi: 10.3389/fmicb.2014.00425
Amin, S. A., Parker, M. S., and Armbrust, E. V. (2012). Interactions between Diatoms and Bacteria. Microbiol. Mol. Biol. Rev. 76, 667–684. doi: 10.1128/MMBR.00007-12
Arrigo, K. R., van Dijken, G., and Pabi, S. (2008). Impact of a shrinking Arctic ice cover on marine primary production. Geophys. Res. Lett. 35, 1–6. doi: 10.1029/2008GL035028
Azam, F., and Malfatti, F. (2007). Microbial structuring of marine ecosystems. Nat. Rev. Microbiol. 5, 782–791. doi: 10.1038/nrmicro1747
Benjamini, Y., and Hochberg, Y. (1995). Controlling the false discovery rate: a practical and powerful approach to multiple testing. J. R. Stat. Soc. Ser. B 57, 289–300.
Beszczynska-Moller, A., Fahrbach, E., Schauer, U., and Hansen, E. (2012). Variability in Atlantic water temperature and transport at the entrance to the Arctic Ocean, 1997-2010. ICES J. Mar. Sci. 69, 852–863. doi: 10.1093/icesjms/fss056
Beszczynska-Möller, A., Woodgate, R., Lee, C., Melling, H., and Karcher, M. (2011). A synthesis of exchanges through the main oceanic gateways to the arctic ocean. Oceanography 24, 82–99. doi: 10.5670/oceanog.2011.59
Boetius, A., Albrecht, S., Bakker, K., Bienhold, C., Felden, J., Fernandez-Mendez, M., et al. (2013). Export of algal biomass from the melting arctic sea ice. Science 339, 1430–1432. doi: 10.1126/science.1231346
Bolger, A. M., Lohse, M., and Usadel, B. (2014). Trimmomatic: a flexible trimmer for Illumina sequence data. Bioinformatics 30, 2114–2120. doi: 10.1093/bioinformatics/btu170
Boss, E., and Behrenfeld, M. (2010). In situ evaluation of the initiation of the North Atlantic phytoplankton bloom. Geophys. Res. Lett. 37, 1–5. doi: 10.1029/2010GL044174
Bowman, J. P., McCammon, S. A., Brown, M. V., Nichols, D. S., and McMeekin, T. A. (1997). Diversity and association of psychrophilic bacteria in Antarctic sea ice. Appl. Environ. Microbiol. 63, 3068–3078.
Brinkmeyer, R., Knittel, K., Jürgens, J., Weyland, H., Amann, R., and Helmke, E. (2003). Diversity and structure of bacterial communities in arctic versus Antarctic pack ice. Am. Soc. Microbiol. 69, 6610–6619. doi: 10.1128/AEM.69.11.6610
Brown, M. (2001). A molecular phylogenetic survey of sea-ice microbial communities (SIMCO). FEMS Microbiol. Ecol. 35, 267–275. doi: 10.1016/S0168-6496(01)00100-3
Brown, M. B. (1975). 400: a method for combining non-independent, one-sided tests of significance. Biometrics 31, 987–992. doi: 10.2307/2529826
Buchan, A., LeCleir, G. R., Gulvik, C. A., and González, J. M. (2014). Master recyclers: features and functions of bacteria associated with phytoplankton blooms. Nat. Rev. Microbiol. 12, 686–698. doi: 10.1038/nrmicro3326
Busch, K., Endres, S., Iversen, M. H., Michels, J., Nöthig, E.-M., and Engel, A. (2017). Bacterial colonization and vertical distribution of marine gel particles (TEP and CSP) in the Arctic Fram Strait. Front. Mar. Sci. 4:166. doi: 10.3389/fmars.2017.00166
Callahan, B. J., Sankaran, K., Fukuyama, J. A., McMurdie, P. J., and Holmes, S. P. (2016). Bioconductor workflow for microbiome data analysis: from raw reads to community analyses. F1000Res. 5:1492. doi: 10.12688/f1000research.8986.2
Chafee, M., Fernàndez-Guerra, A., Buttigieg, P. L., Gerdts, G., Eren, A. M., Teeling, H., et al. (2018). Recurrent patterns of microdiversity in a temperate coastal marine environment. ISME J. 12, 237–252. doi: 10.1038/ismej.2017.165
Chao, A., Gotelli, N. J., Hsieh, T. C., Sande, E. L., Ma, K. H., Colwell, R. K., et al. (2014). Rarefaction and extrapolation with Hill numbers: a framework for sampling and estimation in species diversity studies. Ecol. Monogr. 84, 45–67. doi: 10.1890/13-0133.1
Chao, A., and Jost, L. (2012). Coverage-based rarefaction and extrapolation: standardizing samples by completeness rather than size. Ecology 93, 2533–2547. doi: 10.1890/11-1952.1
Chen, H., and Boutros, P. C. (2011). VennDiagram: a package for the generation of highly-customizable Venn and Euler diagrams in R. BMC Bioinformatics 12:35. doi: 10.1186/1471-2105-12-35
Cole, J. J. (1982). Interactions between bacteria and algae in aquatic ecosystems. Annu. Rev. Ecol. Syst. 13, 291–314. doi: 10.1146/annurev.es.13.110182.001451
Conway, J. R., Lex, A., and Gehlenborg, N. (2017). UpSetR: an R package for the visualization of intersecting sets and their properties. Bioinformatics 33, 2938–2940. doi: 10.1093/bioinformatics/btx364
Crespo, B. G., Pommier, T., Fernández-Gómez, B., and Pedrós-Alió, C. (2013). Taxonomic composition of the particle-attached and free-living bacterial assemblages in the Northwest Mediterranean Sea analyzed by pyrosequencing of the 16S rRNA. Microbiologyopen 2, 541–552. doi: 10.1002/mbo3.92
Csardi, G., and Nepusz, T. (2006). The igraph software package for complex network research. InterJ. Complex Syst. 1695, 1–9.
de Steur, L., Hansen, E., Gerdes, R., Karcher, M., Fahrbach, E., and Holfort, J. (2009). Freshwater fluxes in the East Greenland Current: a decade of observations. Geophys. Res. Lett. 36:L23611. doi: 10.1029/2009GL041278
Diepenbroek, M., Glöckner, F. O., Grobe, P., Güntsch, A., Huber, R., König-Ries, B., et al. (2014). “Towards an integrated biodiversity and ecological research data management and archiving platform: the German federation for the curation of biological data (GFBio),” in Informatik 2014, eds E. Plödereder, L. Grunske, E. Schneider, and D. Ull (Bonn: Gesellschaft für Informatik e.V), 1711–1721.
Dmitrenko, I. A., Polyakov, I. V., Kirillov, S. A., Timokhov, L. A., Frolov, I. E., Sokolov, V. T., et al. (2008). Toward a warmer Arctic Ocean: spreading of the early 21st century Atlantic Water warm anomaly along the Eurasian Basin margins. J. Geophys. Res. 113:C05023. doi: 10.1029/2007JC004158
Dobricic, S., Vignati, E., and Russo, S. (2016). Large-scale atmospheric warming in winter and the arctic sea ice retreat. J. Clim. 29, 2869–2888. doi: 10.1175/JCLI-D-15-0417.1
Edler, L. (ed.). (1979). Recommendations on Methods for Marine Biological Studies in the Baltic Sea. Phytoplankton and Chlorophyll. Lund: University of Lund.
Engel, A., Piontek, J., Metfies, K., Endres, S., Sprong, P., Peeken, I., et al. (2017). Inter-annual variability of transparent exopolymer particles in the Arctic Ocean reveals high sensitivity to ecosystem changes. Sci. Rep. 7:4129. doi: 10.1038/s41598-017-04106-9
Eric Collins, R., Rocap, G., and Deming, J. W. (2010). Persistence of bacterial and Archaeal communities in sea ice through an Arctic winter. Environ. Microbiol. 12, 1828–1841. doi: 10.1111/j.1462-2920.2010.02179.x
Evans, C. A. (1980). A Manual for Measurement of Chlorophyll a in Net Phytoplankton and Nannoplankton—Ocean Pulse Technical Mannual No. 3, Report No SHL 80-17.
Falkowski, P. G., Fenchel, T., and Delong, E. F. (2008). The microbial engines that drive earth’s biogeochemical cycles. Science 320, 1034–1039. doi: 10.1126/science.1153213
Faust, K., and Raes, J. (2012). Microbial interactions: from networks to models. Nat. Rev. Microbiol. 10, 538–550. doi: 10.1038/nrmicro2832
Faust, K., and Raes, J. (2016). CoNet app: inference of biological association networks using Cytoscape. F1000Res. 5:1519. doi: 10.12688/f1000research.9050.2
Fontanez, K. M., Eppley, J. M., Samo, T. J., Karl, D. M., and DeLong, E. F. (2015). Microbial community structure and function on sinking particles in the North Pacific Subtropical Gyre. Front. Microbiol. 6:469. doi: 10.3389/fmicb.2015.00469
Fuhrman, J. A., Cram, J. A., and Needham, D. M. (2015). Marine microbial community dynamics and their ecological interpretation. Nat. Rev. Microbiol. 13, 133–146. doi: 10.1038/nrmicro3417
Galand, P. E., Casamayor, E. O., Kirchman, D. L., and Lovejoy, C. (2009). Ecology of the rare microbial biosphere of the Arctic Ocean. Proc. Natl. Acad. Sci. U.S.A. 106, 22427–22432. doi: 10.1073/pnas.0908284106
Gasol, J. M., and Del Giorgio, P. A. (2000). Using flow cytometry for counting natural planktonic bacteria and understanding the structure of planktonic bacterial communities. Sci. Mar. 64, 197–224. doi: 10.3989/scimar.2000.64n2197
Ghiglione, J. F., and Murray, A. E. (2012). Pronounced summer to winter differences and higher wintertime richness in coastal Antarctic marine bacterioplankton. Environ. Microbiol. 14, 617–629. doi: 10.1111/j.1462-2920.2011.02601.x
Gilbert, J. A., Steele, J. A., Caporaso, J. G., Steinbrück, L., Reeder, J., Temperton, B., et al. (2012). Defining seasonal marine microbial community dynamics. ISME J. 6, 298–308. doi: 10.1038/ismej.2011.107
Giovannoni, S. J. (2017). SAR11 bacteria: the most abundant plankton in the oceans. Ann. Rev. Mar. Sci. 9, 231–255. doi: 10.1146/annurev-marine-010814-015934
Giovannoni, S. J., Cameron Thrash, J., and Temperton, B. (2014). Implications of streamlining theory for microbial ecology. ISME J. 8, 1553–1565. doi: 10.1038/ismej.2014.60
Gómez-Rubio, V. (2017). ggplot2 - elegant graphics for data analysis (2nd Edition). J. Stat. Softw. 77, 1–3. doi: 10.18637/jss.v077.b02
Graeve, M., and Ludwichowski, K.-U. (2017). Inorganic Nutrients Measured on Water Bottle Samples During Polarstern Cruise PS85 (ARK-XXVIII/2). Bremerhaven: Alfred Wegener Institute for Polar and Marine Research. doi: 10.1594/PANGAEA.882217
Grossart, H. H.-P., and Simon, M. (2007). Interactions of planktonic algae and bacteria: effects on algal growth and organic matter dynamics. Aquat. Microb. Ecol. 47, 163–176. doi: 10.3354/ame047163
Grossart, H.-P. P., Czub, G., and Simon, M. (2006). Algae-bacteria interactions and their effects on aggregation and organic matter flux in the sea. Environ. Microbiol. 8, 1074–1084. doi: 10.1111/j.1462-2920.2006.00999.x
Guillou, L., Viprey, M., Chambouvet, A., Welsh, R. M., Kirkham, A. R., Massana, R., et al. (2008). Widespread occurrence and genetic diversity of marine parasitoids belonging to Syndiniales (Alveolata). Environ. Microbiol. 10, 3349–3365. doi: 10.1111/j.1462-2920.2008.01731.x
Hanson, C. A., Fuhrman, J. A., Horner-Devine, M. C., and Martiny, J. B. H. (2012). Beyond biogeographic patterns: processes shaping the microbial landscape. Nat. Rev. Microbiol. 10, 497–506. doi: 10.1038/nrmicro2795
Hartmann, M., Zubkov, M. V., Scanlan, D. J., and Lepère, C. (2013). In situ interactions between photosynthetic picoeukaryotes and bacterioplankton in the Atlantic Ocean: evidence for mixotrophy. Environ. Microbiol. Rep. 5, 835–840. doi: 10.1111/1758-2229.12084
Herndl, G. J., and Reinthaler, T. (2013). Microbial control of the dark end of the biological pump. Nat. Geosci. 6, 718–724. doi: 10.1038/ngeo1921
Hsieh, T. C., Ma, K. H., and Chao, A. (2018). iNEXT: Interpolation and Extrapolation for Species Diversity. Available at: http://chao.stat.nthu.edu.tw/blog/software-download/
Iversen, R. K., and Seuthe, L. (2011). Seasonal microbial processes in a high-latitude fjord (Kongsfjorden, Svalbard): I. Heterotrophic bacteria, picoplankton and nanoflagellates. Polar Biol. 34, 731–749. doi: 10.1007/s00300-010-0929-2
Jephcott, T. G., Alves-de-Souza, C., Gleason, F. H., van Ogtrop, F. F., Sime-Ngando, T., Karpov, S. A., et al. (2016). Ecological impacts of parasitic chytrids, syndiniales and perkinsids on populations of marine photosynthetic dinoflagellates. Fungal Ecol. 19, 47–58. doi: 10.1016/j.funeco.2015.03.007
Joli, N., Monier, A., Logares, R., and Lovejoy, C. (2017). Seasonal patterns in Arctic prasinophytes and inferred ecology of Bathycoccus unveiled in an Arctic winter metagenome. ISME J. 11, 1372–1385. doi: 10.1038/ismej.2017.7
Kilias, E., Wolf, C., Nöthig, E.-M., Peeken, I., and Metfies, K. (2013). Protist distribution in the Western Fram Strait in summer 2010 based on 454-pyrosequencing of 18S rDNA. J. Phycol. 49, 996–1010. doi: 10.1111/jpy.12109
Klindworth, A., Pruesse, E., Schweer, T., Quast, C., Horn, M., Glo, F. O., et al. (2013). Evaluation of general 16S ribosomal RNA gene PCR primers for classical and next-generation sequencing-based diversity studies. Nucleic Acids Res. 41:e1. doi: 10.1093/nar/gks808
Kwok, R., and Rothrock, D. A. (2009). Decline in Arctic sea ice thickness from submarine and ICESat records: 1958-2008. Geophys. Res. Lett. 36:L15501. doi: 10.1029/2009GL039035
Leu, E., Søreide, J. E., Hessen, D. O., Falk-Petersen, S., and Berge, J. (2011). Consequences of changing sea-ice cover for primary and secondary producers in the European Arctic shelf seas: timing, quantity, and quality. Prog. Oceanogr. 90, 18–32. doi: 10.1016/j.pocean.2011.02.004
Lima-Mendez, G., Faust, K., Henry, N., Decelle, J., Colin, S., Carcillo, F., et al. (2015). Determinants of community structure in the global plankton interactome. Science 348:1262073. doi: 10.1126/science.1262073
Love, M. I., Huber, W., and Anders, S. (2014). Moderated estimation of fold change and dispersion for RNA-seq data with DESeq2. Genome Biol. 15:550. doi: 10.1186/s13059-014-0550-8
Lovejoy, C. (2014). Changing views of Arctic protists (marine microbial eukaryotes) in a changing Arctic. Acta Protozool. 53, 91–100. doi: 10.4467/16890027AP.14.009.1446
Lovejoy, C., Vincent, W. F., Bonilla, S., Roy, S., Martineau, M.-J. J., Terrado, R., et al. (2007). Distributions, phylogeny, and growth of cold-adapted picoprasinophytes in arctic seas. J. Phycol. 43, 78–89. doi: 10.1111/j.1529-8817.2006.00310.x
Luo, W., Friedman, M. S., Shedden, K., Hankenson, K. D., and Woolf, P. J. (2009). GAGE: generally applicable gene set enrichment for pathway analysis. BMC Bioinformatics 10:161. doi: 10.1186/1471-2105-10-161
Mahé, F., Rognes, T., Quince, C., de Vargas, C., and Dunthorn, M. (2015). Swarm v2: highly-scalable and high-resolution amplicon clustering. PeerJ 3:e1420. doi: 10.7717/peerj.1420
Marquardt, M., Vader, A., Stübner, E. I., Reigstad, M., and Gabrielsen, T. M. (2016). Strong seasonality of marine microbial eukaryotes in a high-arctic fjord (Isfjorden, in West Spitsbergen, Norway). Appl. Environ. Microbiol. 82, 1868–1880. doi: 10.1128/AEM.03208-15
Martin, M. (2011). Cutadapt removes adapter sequences from high-throughput sequencing reads. EMBnet J. 17, 10–12. doi: 10.14806/ej.17.1.200
McMurdie, P. J., and Holmes, S. (2013). phyloseq: an r package for reproducible interactive analysis and graphics of microbiome census data. PLoS One 8:e61217. doi: 10.1371/journal.pone.0061217
McMurdie, P. J., and Holmes, S. (2014). Waste not, want not: why rarefying microbiome data is inadmissible. PLoS Comput. Biol. 10:e1003531. doi: 10.1371/journal.pcbi.1003531
Metfies, K., von Appen, W.-J. J., Kilias, E., Nicolaus, A., and Nöthig, E.-M. M. (2016). Biogeography and photosynthetic biomass of arctic marine pico-eukaroytes during summer of the record sea ice minimum 2012. PLoS One 11:e0148512. doi: 10.1371/journal.pone.0148512
Milici, M., Deng, Z., Tomasch, J., Decelle, J., Wos-Oxley, M. L., Wang, H., et al. (2016). Co-occurrence analysis of microbial taxa in the Atlantic ocean reveals high connectivity in the free-living bacterioplankton. Front. Microbiol. 7:649. doi: 10.3389/fmicb.2016.00649
Monier, A., Terrado, R., Thaler, M., Comeau, A., Medrinal, E., and Lovejoy, C. (2013). Upper Arctic Ocean water masses harbor distinct communities of heterotrophic flagellates. Biogeosciences 10, 4273–4286. doi: 10.5194/bg-10-4273-2013
Morris, R. M., Frazar, C. D., and Carlson, C. A. (2012). Basin-scale patterns in the abundance of SAR11 subclades, marine Actinobacteria (OM1), members of the Roseobacter clade and OCS116 in the South Atlantic. Environ. Microbiol. 14, 1133–1144. doi: 10.1111/j.1462-2920.2011.02694.x
Müller, O., Wilson, B., Paulsen, M. L., Rumiñska, A., Armo, H. R., Bratbak, G., et al. (2018). Spatiotemporal dynamics of ammonia-oxidizing thaumarchaeota in distinct arctic water masses. Front. Microbiol. 9:24. doi: 10.3389/fmicb.2018.00024
Nikrad, M. P., Cottrell, M. T., and Kirchman, D. L. (2014). Growth activity of gammaproteobacterial subgroups in waters off the west Antarctic Peninsula in summer and fall. Environ. Microbiol. 16, 1513–1523. doi: 10.1111/1462-2920.12258
Nöthig, E.-M., Bracher, A., Engel, A., Metfies, K., Niehoff, B., Peeken, I., et al. (2015). Summertime plankton ecology in Fram Strait—a compilation of long- and short-term observations. Polar Res. 34:23349. doi: 10.3402/polar.v34.23349
Padilla, C. C., Ganesh, S., Gantt, S., Huhman, A., Parris, D. J., Sarode, N., et al. (2015). Standard filtration practices may significantly distort planktonic microbial diversity estimates. Front. Microbiol. 6:547. doi: 10.3389/fmicb.2015.00547
Paquette, R. G., Bourke, R. H., Newton, J. F., and Perdue, W. F. (1985). The east greenland polar front in autumn. J. Geophys. Res. 90, 4866–4882. doi: 10.1029/JC090iC03p04866
Peng, G., and Meier, W. N. (2017). Temporal and regional variability of Arctic sea-ice coverage from satellite data. Ann. Glaciol. 59, 191–200. doi: 10.1017/aog.2017.32
Perrette, M., Yool, A., Quartly, G. D., and Popova, E. E. (2011). Near-ubiquity of ice-edge blooms in the Arctic. Biogeosciences 8, 515–524. doi: 10.5194/bg-8-515-2011
Peura, S., Bertilsson, S., Jones, R. I., and Eiler, A. (2015). Resistant microbial cooccurrence patterns inferred by network topology. Appl. Environ. Microbiol. 81, 2090–2097. doi: 10.1128/AEM.03660-14
Pinhassi, J., and Hagström,. (2000). Seasonal succession in marine bacterioplankton. Aquat. Microb. Ecol. 21, 245–256. doi: 10.3354/ame021245
Pinhassi, J., Havskum, H., Peters, F., Malits, A., Sala, M. M., Havskum, H., et al. (2004). Changes in bacterioplankton composition under different phytoplankton regimens. Appl. Environ. Microbiol. 70, 6753–6766. doi: 10.1128/AEM.70.11.6753-6766.2004
Piontek, J., Sperling, M., Nöthig, E.-M., and Engel, A. (2015). Multiple environmental changes induce interactive effects on bacterial degradation activity in the Arctic Ocean. Limnol. Oceanogr. 60, 1392–1410. doi: 10.1002/lno.10112
Piontek, J., Sperling, M., Nöthig, E.-M. M., and Engel, A. (2014). Regulation of bacterioplankton activity in Fram Strait (Arctic Ocean) during early summer: the role of organic matter supply and temperature. J. Mar. Syst. 132, 83–94. doi: 10.1016/j.jmarsys.2014.01.003
Polyakov, I. V., Beszczynska, A., Carmack, E. C., Dmitrenko, I. A., Fahrbach, E., Frolov, I. E., et al. (2005). One more step toward a warmer Arctic. Geophys. Res. Lett. 32:L17605. doi: 10.1029/2005GL023740
Polyakov, I. V., Pnyushkov, A. V., Alkire, M. B., Ashik, I. M., Baumann, T. M., Carmack, E. C., et al. (2017). Greater role for Atlantic inflows on sea-ice loss in the Eurasian Basin of the Arctic Ocean. Science 356, 285–291. doi: 10.1126/science.aai8204
Pruesse, E., Peplies, J., and Glöckner, F. O. (2012). SINA: accurate high-throughput multiple sequence alignment of ribosomal RNA genes. Bioinformatics 28, 1823–1829. doi: 10.1093/bioinformatics/bts252
Quast, C., Pruesse, E., Yilmaz, P., Gerken, J., Schweer, T., Yarza, P., et al. (2013). The SILVA ribosomal RNA gene database project: improved data processing and web-based tools. Nucleic Acids Res. 41, D590–D596. doi: 10.1093/nar/gks1219
Rabe, B., von Appen, W.-J., Latarius, K., and Wisotzki, A. (2014). Physical Oceanography During Polarstern Cruise PS85 (ARK-XXVIII/2). Bremerhaven: Alfred Wegener Institute, Helmholtz Center for Polar and Marine Research. doi: 10.1594/PANGAEA.837425
RStudio Team (2015). RStudio: Integrated Development Environment for R. Available at: http://www.rstudio.com/
Ramanan, R., Kim, B.-H., Cho, D.-H., Oh, H.-M., and Kim, H.-S. (2016). Algae–bacteria interactions: evolution, ecology and emerging applications. Biotechnol. Adv. 34, 14–29. doi: 10.1016/j.biotechadv.2015.12.003
Randelhoff, A., Reigstad, M., Chierici, M., Sundfjord, A., Ivanov, V., Cape, M., et al. (2018). Seasonality of the physical and biogeochemical hydrography in the inflow to the arctic ocean through fram strait. Front. Mar. Sci. 5:224. doi: 10.3389/fmars.2018.00224
Riemann, L., Steward, G. F., and Azam, F. (2000). Dynamics of bacterial community composition and activity during a mesocosm diatom bloom. Appl. Environ. Microbiol. 66, 578–587. doi: 10.1128/AEM.66.2.578-587.2000.Updated
Rognes, T., Flouri, T., Nichols, B., Quince, C., and Mahé, F. (2016). VSEARCH: a versatile open source tool for metagenomics. PeerJ 4:e2584. doi: 10.7717/peerj.2584
Rudels, B., Anderson, L. G., and Jones, E. P. (1996). Formation and evolution of the surface mixed layer and halocline of the Arctic Ocean. J. Geophys. Res. Oceans 101, 8807–8821. doi: 10.1029/96JC00143
Rudels, B., Schauer, U., Björk, G., Korhonen, M., Pisarev, S., Rabe, B., et al. (2013). Observations of water masses and circulation with focus on the Eurasian Basin of the Arctic Ocean from the 1990s to the late 2000s. Ocean Sci. 9, 147–169. doi: 10.5194/os-9-147-2013
Schlitzer, R. (2015). Ocean Data View. Available at: http://odv.awi.de
Schourup-Kristensen, V., Sidorenko, D., Wolf-Gladrow, D. A., and Völker, C. (2014). A skill assessment of the biogeochemical model REcoM2 coupled to the Finite Element Sea Ice–Ocean Model (FESOM 1.3). Geosci. Model Dev. 7, 2769–2802. doi: 10.5194/gmd-7-2769-2014
Silvester, N., Alako, B., Amid, C., Cerdeño-Tarrága, A., Clarke, L., Cleland, I., et al. (2018). The European nucleotide archive in 2017. Nucleic Acids Res. 46, D36–D40. doi: 10.1093/nar/gkx1125
Simon, M., Glöckner, F., and Amann, R. (1999). Different community structure and temperature optima of heterotrophic picoplankton in various regions of the Southern Ocean. Aquat. Microb. Ecol. 18, 275–284. doi: 10.3354/ame018275
Simon, M., Grossart, H. H., Schweitzer, B., and Ploug, H. (2002). Microbial ecology of organic aggregates in aquatic ecosystems. Aquat. Microb. Ecol. 28, 175–211. doi: 10.3354/ame028175
Smith, D. C., and Azam, F. (1992). A simple, economical method for measuring bacterial protein synthesis rates in seawater using 3H-leucine. Mar. Microb. Food Webs 6, 107–114.
Soltwedel, T., Bauerfeind, E., Bergmann, M., Bracher, A., Budaeva, N., Busch, K., et al. (2016). Natural variability or anthropogenically-induced variation? Insights from 15 years of multidisciplinary observations at the arctic marine LTER site HAUSGARTEN. Ecol. Indic. 65, 89–102. doi: 10.1016/j.ecolind.2015.10.001
Soltwedel, T., Schauer, U., Boebel, O., Nothig, E.-M., Bracher, A., Metfies, K., et al. (2013). “FRAM - FRontiers in Arctic marine Monitoring Visions for permanent observations in a gateway to the Arctic Ocean,” in Proceedings of the MTS/IEEE OCEANS, (Bergen: IEEE), 1–7. doi: 10.1109/OCEANS-Bergen.2013.6608008
Spreen, G., Kaleschke, L., and Heygster, G. (2008). Sea ice remote sensing using AMSR-E 89-GHz channels. J. Geophys. Res. 113:C02S03. doi: 10.1029/2005JC003384
Stocker, R. (2012). Marine microbes see a sea of gradients. Science 338, 628–633. doi: 10.1126/science.1208929
Sun, L., Perlwitz, J., and Hoerling, M. (2016). What caused the recent “Warm Arctic, Cold Continents” trend pattern in winter temperatures? Geophys. Res. Lett. 43, 5345–5352. doi: 10.1002/2016GL069024
Taylor, A. H. H., Watson, A. J. J., and Robertson, J. E. E. (1992). The influence of the spring phytoplankton bloom on carbon dioxide and oxygen concentrations in the surface waters of the northeast Atlantic during 1989. Deep Sea Res. Part A Oceanogr. Res. Pap. 39, 137–152. doi: 10.1016/0198-0149(92)90101-X
Teeling, H., Fuchs, B. M., Becher, D., Klockow, C., Gardebrecht, A., Bennke, C. M., et al. (2012). Substrate-controlled succession of marine bacterioplankton populations induced by a phytoplankton bloom. Science 336, 608–611. doi: 10.1126/science.1218344
Töpper, B., Larsen, A., Thingstad, T. F., Thyrhaug, R., and Sandaa, R. A. (2010). Bacterial community composition in an Arctic phytoplankton mesocosm bloom: the impact of silicate and glucose. Polar Biol. 33, 1557–1565. doi: 10.1007/s00300-010-0846-4
Vader, A., Marquardt, M., Meshram, A. R., and Gabrielsen, T. M. (2015). Key Arctic phototrophs are widespread in the polar night. Polar Biol. 38, 13–21. doi: 10.1007/s00300-014-1570-2
Vernet, M., Richardson, T. L., Metfies, K., Nöthig, E.-M., and Peeken, I. (2017). Models of plankton community changes during a warm water anomaly in arctic waters show altered trophic pathways with minimal changes in carbon export. Front. Mar. Sci. 4:160. doi: 10.3389/fmars.2017.00160
von Appen, W.-J., Schauer, U., Somavilla, R., Bauerfeind, E., and Beszczynska-Möller, A. (2015). Exchange of warming deep waters across Fram Strait. Deep Sea Res. Part I Oceanogr. Res. Pap. 103, 86–100. doi: 10.1016/j.dsr.2015.06.003
Walczowski, W., Beszczynska-Möller, A., Wieczorek, P., Merchel, M., and Grynczel, A. (2017). Oceanographic observations in the Nordic Sea and Fram Strait in 2016 under the IO PAN long-term monitoring program AREX. Oceanologia 59, 187–194. doi: 10.1016/j.oceano.2016.12.003
Wassmann, P., Slagstad, D., and Ellingsen, I. (2010). Primary production and climatic variability in the European sector of the Arctic Ocean prior to 2007: preliminary results. Polar Biol. 33, 1641–1650. doi: 10.1007/s00300-010-0839-3
Weiss, S., Van Treuren, W., Lozupone, C., Faust, K., Friedman, J., Deng, Y., et al. (2016). Correlation detection strategies in microbial data sets vary widely in sensitivity and precision. ISME J. 10, 1669–1681. doi: 10.1038/ismej.2015.235
Wekerle, C., Wang, Q., Danilov, S., Schourup-Kristensen, V., von Appen, W.-J., and Jung, T. (2017). Atlantic Water in the Nordic Seas: locally eddy-permitting ocean simulation in a global setup. J. Geophys. Res. Oceans 122, 914–940. doi: 10.1002/2016JC012121
Wemheuer, B., Güllert, S., Billerbeck, S., Giebel, H.-A. A., Voget, S., Simon, M., et al. (2014). Impact of a phytoplankton bloom on the diversity of the active bacterial community in the southern North Sea as revealed by metatranscriptomic approaches. FEMS Microbiol. Ecol. 87, 378–389. doi: 10.1111/1574-6941.12230
Williams, T. J., Long, E., Evans, F., DeMaere, M. Z., Lauro, F. M., Raftery, M. J., et al. (2012). A metaproteomic assessment of winter and summer bacterioplankton from Antarctic Peninsula coastal surface waters. ISME J. 6, 1883–1900. doi: 10.1038/ismej.2012.28
Williams, T. J., Wilkins, D., Long, E., Evans, F., Demaere, M. Z., Raftery, M. J., et al. (2013). The role of planktonic Flavobacteria in processing algal organic matter in coastal East Antarctica revealed using metagenomics and metaproteomics. Environ. Microbiol. 15, 1302–1317. doi: 10.1111/1462-2920.12017
Wilson, B., Müller, O., Nordmann, E.-L., Seuthe, L., Bratbak, G., and Øvreås, L. (2017). Changes in marine prokaryote composition with season and depth over an arctic polar year. Front. Mar. Sci. 4:95. doi: 10.3389/fmars.2017.00095
Wilson, C., and Wallace, D. W. R. (1990). Using the nutrient ratio no Po as a tracer of continental-shelf waters in the central arctic-ocean. J. Geophys. Res. 95, 22193–22208. doi: 10.1029/JC095iC12p22193
Wollenburg, J. E., Katlein, C., Nehrke, G., Nöthig, E.-M., Matthiessen, J., Wolf- Gladrow, D. A., et al. (2018). Ballasting by cryogenic gypsum enhances carbon export in a Phaeocystis under-ice bloom. Sci. Rep. 8:7703. doi: 10.1038/s41598-018-26016-0
Yu, Z.-C., Chen, X.-L., Shen, Q.-T., Zhao, D.-L., Tang, B.-L., Su, H.-N., et al. (2015). Filamentous phages prevalent in Pseudoalteromonas spp. confer properties advantageous to host survival in Arctic sea ice. ISME J. 9, 871–881. doi: 10.1038/ismej.2014.185
Keywords: Arctic Ocean, phytoplankton bloom, microbial interactions, bacterioplankton, network analysis
Citation: Fadeev E, Salter I, Schourup-Kristensen V, Nöthig E-M, Metfies K, Engel A, Piontek J, Boetius A and Bienhold C (2018) Microbial Communities in the East and West Fram Strait During Sea Ice Melting Season. Front. Mar. Sci. 5:429. doi: 10.3389/fmars.2018.00429
Received: 03 July 2018; Accepted: 29 October 2018;
Published: 22 November 2018.
Edited by:
Marit Reigstad, UiT The Arctic University of Norway, NorwayReviewed by:
Franziska Wemheuer, University of New South Wales, AustraliaPunyasloke Bhadury, Indian Institute of Science Education and Research Kolkata, India
Copyright © 2018 Fadeev, Salter, Schourup-Kristensen, Nöthig, Metfies, Engel, Piontek, Boetius and Bienhold. This is an open-access article distributed under the terms of the Creative Commons Attribution License (CC BY). The use, distribution or reproduction in other forums is permitted, provided the original author(s) and the copyright owner(s) are credited and that the original publication in this journal is cited, in accordance with accepted academic practice. No use, distribution or reproduction is permitted which does not comply with these terms.
*Correspondence: Eduard Fadeev, ZWR1YXJkLmZhZGVldkBhd2kuZGU= Christina Bienhold, Q2hyaXN0aW5hLkJpZW5ob2xkQGF3aS5kZQ==; Y2JpZW5ob2xAbXBpLWJyZW1lbi5kZQ==