 Di Jin
 Chris Watson
 Hauke Kite-Powell
 Paul Kirshen2
- 1Marine Policy Center, Woods Hole Oceanographic Institution, Woods Hole, MA, United States
- 2School for the Environment, University of Massachusetts Boston, Boston, MA, United States
In this study, we develop an economic evaluation of the Boston Harbor Cleanup, a court-mandated action started in 1986, through a comparison of cleanup costs and relevant ecosystem service values. Our results suggest that the ecosystems in the study area provide services to society with a capitalized value ranging from $30 to $100 billion. The $4.7 billion cost of the Boston Harbor Cleanup is about 5–16% of the total asset value of ecosystem services. Although it is not clear what fraction of the ecosystem value is due to the cleanup, our results suggest that the cost of the cleanup may be justified by our high- or midpoint-estimates of the value of ecosystem services.
Introduction
Ecosystems in Boston Harbor and neighboring areas provide a multitude of services to society. The environment that we enjoy today is to a large extent a result of the Boston Harbor Cleanup project. Thirty years ago, the harbor was heavily polluted, and costly cleanup activities were motivated by the 1972 Clean Water Act (Levy and Connor, 1992). In this study, we attempt to evaluate the cleanup as an economic decision. We develop estimates of ecosystem service values for the Boston Harbor area and compare these ecosystem benefits with cleanup costs.
Coastal ecosystems are complex, and water quality affects ecosystem services through multiple pathways. Due to data limitations, it is difficult to develop a detailed analysis by documenting changes, before and after the cleanup, in water quality, ecosystem conditions, services they provide, and social benefits associated with these services. This type of assessment typically involves a subset of ecosystem services and cannot capture the full benefits following the cleanup (Fross and Kite-Powell, 2015). To capture the wide range of ecosystem benefits, we employ an alternative approach following Costanza et al. (1997), which estimates ecosystem values based on land covers.
Pollution control and cleanup is a common challenge facing many urban harbors around the world. Under budget constraints, ecosystem restoration projects must pass an efficiency test (cost-benefit analysis). Because of its cost, scale, and duration, the Boston Harbor Cleanup presents a unique case for cost-benefit analysis. What makes this case even more interesting is that the cleanup started as a court-mandated action in 1986 when it was widely believed that the action could not pass a cost-benefit test. With growing knowledge on ecosystem valuation in recent decades, we can now reexamine the cleanup as an economic decision. Results of this study will provide useful information to coastal managers and the public facing similar decisions in the coming years.
Boston Harbor Cleanup
Boston Harbor had been heavily polluted due to industrial development and population growth since the nineteenth century. By the mid-1970s, organizations within the Boston community started to fight for a cleaner Boston Harbor. The municipal wastewater treatment plants at Nut Island and Deer Island, constructed in 1952 and 1968 to service the greater Boston communities, were engineered to treat 112 million and 343 million gallons per day (mgd), and 280 and 848 mgd at peak flows (Levy and Connor, 1992). With flows exceeding their capacity, raw wastewater was often discharged directly into Boston Harbor, and the harbor was soon polluted to such an extent that recreational activity was severely constrained; marine habitat was greatly affected; and water quality was poor. In the early 1980s, the two failing primary treatment plants discharged a total of 350 million gallons untreated wastewater each day into the harbor. Digested sludge was discharged in the northern harbor. Frequent combined sewer overflows (CSO) discharged 3 billion gallons annually during wet weather (Rex, 2008).
In 1972 the Clean Water Act was passed. The Metropolitan District Commission (MDC) applied for a 301(h) waiver, claiming that the costs of constructing a secondary treatment plant outweighed the benefits (Levy and Connor, 1992). At the time, the MDC was the state agency charged with the operation of the wastewater treatment sites. The EPA failed to act on the waiver, and in 1982 the City of Quincy filed a lawsuit against the Commonwealth of Massachusetts for violating the Clean Water Act (Levy and Connor, 1992). In 1983, the Conservation Law Foundation filed a second lawsuit against the Commonwealth for violating and the EPA for failure to enforce the Clean Water Act (Levy and Connor, 1992). In 1986, Judge A. David Mazzone mandated the court-ordered construction of a new treatment plant and supplemental cleanup projects (Rex, 2008).
The cleanup operation consists of two court-mandated actions, which have led to significant improvement in water quality in the harbor area (Massachusetts Water Resources Authority (MWRA), 2008). By 1991, sludge discharges into the harbor were ended, and CSO discharges were cut in half to 1.5 billion gallons per year (Rex, 2008). In 1995 the new primary treatment facilities on Deer Island began operation (Massachusetts Water Resources Authority (MWRA), 2014). Finally, in 2000, wastewater was no longer discharged into shallow areas of the harbor, and treated effluent is now discharged into Massachusetts Bay through a 9.5 mile-long outfall (Rex, 2008). The cleanup has transformed Boston Harbor from the “dirtiest harbor in America” to a “Great American Jewel” (Massachusetts Water Resources Authority (MWRA), 2008). The total cost of the two court-mandated projects was $4.7 billion, including $3.8 billion for the Boston Harbor Project and $0.9 billion for the Combined Sewer Overflow project (Massachusetts Water Resources Authority (MWRA), 2014, 2016). Most of the cost has been absorbed by consumers through increased water and sewer bills.
Ecosystem Service Values
Economic Valuation of Ecosystem Services
Ecosystem services are the direct and indirect benefits that humans derive from ecosystems, and in coastal environments these include nutrient cycling, climate regulation, habitat provision, and recreational uses (Millennium Ecosystem Assessment Board (MEAB), 2003). While a general approach for ecosystem service identification and valuation has been developed, and there are many ecosystem valuation studies in the literature, the valuation of coastal protection projects remains a challenging task (de Groot et al., 2012; Reddy et al., 2015).
Economic value is a human construct and exists only in the context of human societies that make use of the market goods and services produced by people, and the ecosystem services supplied by the earth's environmental resources. Because it derives at least in part from people's preferences, which in turn are a function of their circumstances and understanding of the world, economic values are by definition more ephemeral and changeable than, for example, physical or chemical properties of resources. Some economic values can be estimated directly by observing the prices at which goods and services are traded in markets (e.g., the value of seafood). Other “non-market” goods and services are not traded in markets; their economic value must be estimated by techniques such as travel cost and random utility models, hedonic methods, or contingent valuation. The selection of valuation methods for various ecosystem services is not always straightforward. Examples of such selection can be found in de Groot et al. (2002) and Wang et al. (2010).
In theory, ecosystem value is jointly determined by the supply of ecosystem services (e.g., production of salt marsh as habitat for birds and fish) and demand for the services by society (people's willingness to pay) (Johnston et al., 2002). Thus, the value of an ecosystem is a function of its scale, condition, and the services it provides. To avoid double counting, changes in multiple ecosystem services should be valued jointly (Johnston et al., 2011). Also, marginal ecosystem service value may rise rapidly when changes in the ecosystem condition pass a “critical threshold” (Farber et al., 2002).
Marine ecosystems are biological assets that potentially are capable of generating flows of returns indefinitely. Fenichel et al. (2016) describe a conceptual framework for computing the price of natural capital (e.g., ecosystem resources). The unit price of natural capital is a function of the stock of natural capital, parameters characterizing ecological dynamics, human behavioral feedbacks, and the value of ecosystem service flows.
Unfortunately, valuation of ecosystem services at a specific location is typically a complex and time-consuming process. As a result, many studies involving ecosystem valuation of natural resources and environments rely on benefit transfer techniques: they adapt valuation information from the literature to the project sites (Woodward and Wui, 2001; Johnston et al., 2015). Earlier efforts to integrate results of ecosystem valuation studies from different locations are summarized in Costanza et al. (1997). More recently, researchers have developed the Ecosystem Service Valuation Database (ESVD) that summarizes results of valuation studies around the world. Other compilations of ecosystem values can be found in Pendleton (2008), de Groot et al. (2012), and Kocian et al. (2015).
Valuation Methods
The ecosystem service valuation framework for this study is outlined in Figure 1. Since different coastal areas host different ecosystems that provide different ecosystem services, the first step is to identify ecosystem/land cover types such as wetland, beaches, habitats, and recreational sites, and estimating their spatial extent. Next, specific ecosystem services that each land cover provides are identified (Table 1). The ecosystem service values are then estimated at the unit level by land cover.
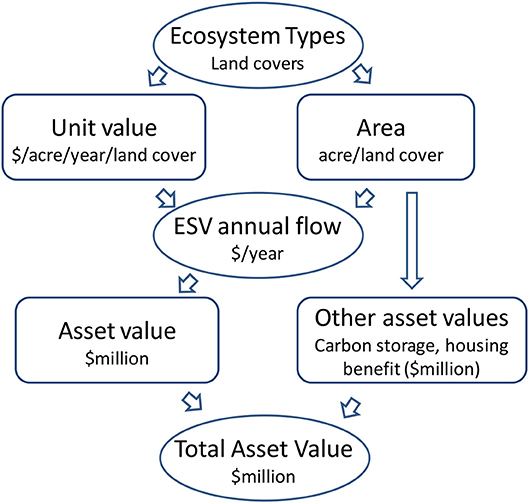
Figure 1. Ecosystem service valuation method.
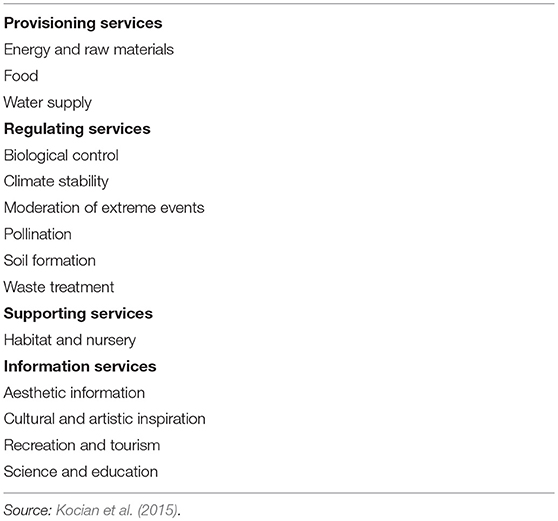
Table 1. Classification of ecosystem services.
We follow the general approach of Costanza et al. (1997) and utilize a simple unit value transfer method. Because valuation estimates of certain ecosystem services (e.g., recreational and health benefits) are significantly affected by population density, income, and other community characteristics at the study site, a key step in the process is making adjustments to the valuation estimates for different local ecological and social conditions (Brander et al., 2006; Johnston et al., 2015; Wolf et al., 2015). For example, the vast majority of published ecosystem valuation studies are conducted in non-urban settings; yet results from these studies have been used in cost-benefit analyses for coastal and marine ecosystem restoration projects in urban areas. Erroneous valuation of the ecosystems in coastal urban areas can have serious consequences, affecting a large population in a shared environment.
In urban areas, a network of multifunctional open spaces, parks, waterways, trees and woodlands is essential to support a high quality of life. Natural (green) space offers recreational and leisure opportunities to a large number of people. It is a place for children to play and people to meet and therefore has a social function (Vandermeulen et al., 2011). It offers considerable public health benefits as well (Wolf et al., 2015; Wolf and Robbins, 2015). To reflect these important beneficial effects in the study area, we select high-end estimates of ecosystem services in the literature and make additional adjustments (Figure 2). For the study, we consider 13 land cover types, and their high- and low-end unit values are in Table 2. Data sources for these ecosystem service values are summarized in Table A1 in the Appendix.
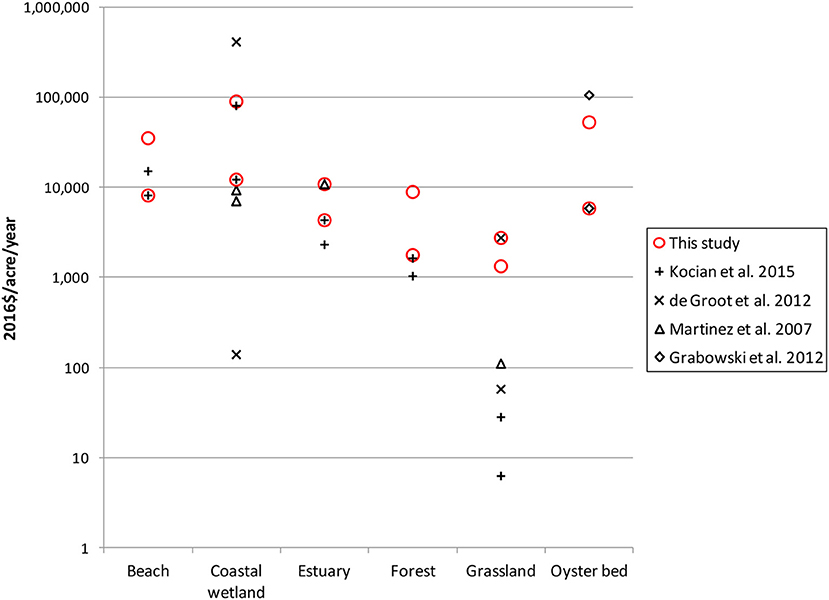
Figure 2. Unit ecosystem service values.
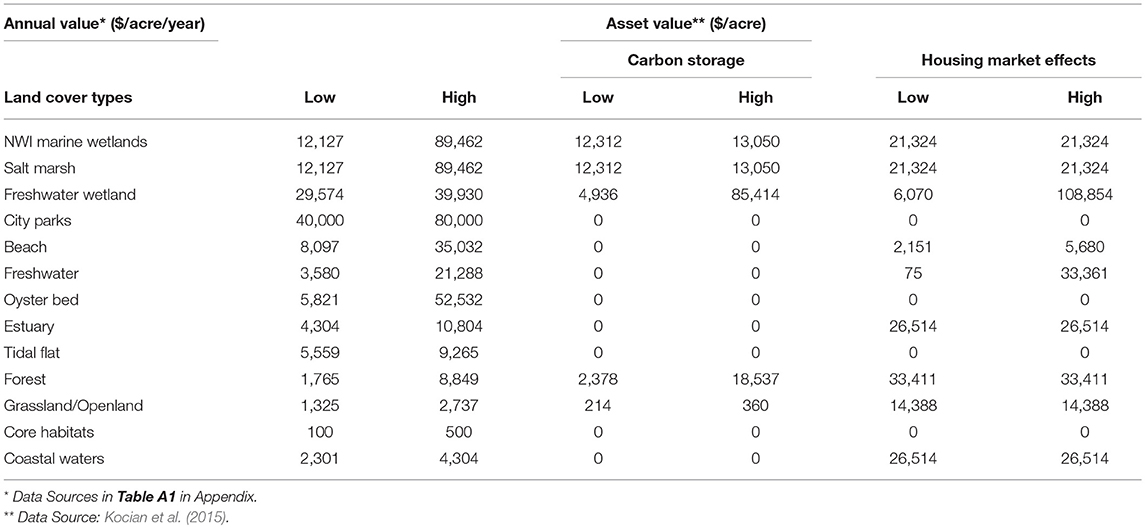
Table 2. Unit ecosystem service values (2016$).
Typically, the unit ecosystem service values available in the literature are given in U.S. dollars per unit area per year (de Groot et al., 2012; Kocian et al., 2015). In the study, we estimate both the annual value and asset (capitalized) value of ecosystem services. We calculate the total asset value of ecosystem services (in $) as the sum of two components. One is the sum of discounted annual flows over 100 years, and the other is a sum of additional asset (stock) values of other ecosystem services (Figure 1). The total ecosystem value is the sum of individual ecosystem services values across different land covers. Specifically, the total asset value is:
where t = (1, 2, …, 100) is year; δt is the discount rate in year t; i = (1, 2, …, 13) is the index for land cover types; ESVi is the unit flow value of ecosystem service from land cover i (in 2016$/acre/year); Si is the spatial extent of land cover i (in acres); and OAVi stands for the unit asset value of other ecosystem services from land cover i (in 2016$/acre). OAV includes additional asset values of ecosystems for carbon storage and increased housing values (e.g., a premium added to property values due to the presence of nearby ecosystem amenities). Note that an asset value is the sum of discounted annual values over time, and thus OAV should not be discounted. For example, a property's value (asset value) is the sum of its discounted annual rental values over the life of the property.
In economic project analysis, the rate at which future benefits and costs are discounted relative to current values often determines whether a project passes the benefit-cost test. This is especially true of projects with long time horizons, such as those dealing with long-term ecosystem service values. For example, studies have shown that the discount rate schedule makes a considerable difference to estimates of the social cost of carbon (the present value of damages from emitting a ton of carbon dioxide) (Arrow et al., 2013). Although there may be other causes for the discount rate to decline over time (e.g., declining productivity and population growth), uncertainty about future discount rates has been identified as the main reason for a declining discount rate schedule. Future discount rates are inherently uncertain because of uncertainty in the rates of growth in consumption and return to investment (Arrow et al., 2013; Cropper, 2013). In this study, we use the “approximate recommended” sliding-scale discount rates by Weitzman (2001). For comparison, we also use two constant discount rates (3 and 7%) in our ecosystem value calculations.
The areal extent of each type of land cover at Mean Higher High Water (MHHW) is quantified using Geographic Information System (GIS) analysis. We divide the study area into four sub-areas by watershed: Mystic River Watershed, Charles and Neponset Rivers (combined) Watershed, Weir River Watershed, and Harbor Islands, as in the Boston Harbor Barrier Assessment Study (Kirshen et al., 2018). The “Harbor Islands” watershed includes all areas of Boston Harbor not included in the other three watersheds. We adjusted watershed boundaries adjacent to the harbor slightly to assure no overlap with the Harbor Islands watershed.
To calculate the areas for different land covers in the four sub-areas, we compiled publicly available GIS datasets from different sources (Table A2 in Appendix). We assign a priority level to each land cover type to avoid double counting ecosystem values from overlapped areas of multiple land cover types. This way, the overlapped portions of lower priority land areas are not counted if they overlap with a higher priority land area. Generally, higher valued land covers (e.g., wetlands) are ranked higher on the priority list so that the overall ecosystem values are not underestimated. For example, a wetland area may also be in a city park, and by counting only the high-end unit value for wetland (which includes recreational values, etc.), we actually capture the park value.
Valuation Results
Different land covers in 2013 in the four sub-areas, Mystic River Watershed, Charles and Neponset Rivers Watershed, Weir River Watershed, and Harbor Islands, are shown in Figures 3–6, respectively. Results of the area calculation by land cover in the four sub-areas in 2013 are reported in Table 3. As noted above, the flow of ecosystem service values is converted to an asset value as the sum of discounted annual values over 100 years. As an example, the flow of high- and low-end estimates of annual values in the Mystic River Watershed under a declining discount rate is illustrated in Figure 7. As shown in the figure, the discount rate (red dashed line) is 4% in years 1–5, 3% in years 6–25, 2% in years 26–75, and 1% in years 76–100. Ecosystem service asset values for the four sub-areas under different discounting schedules are summarized in Table 4.
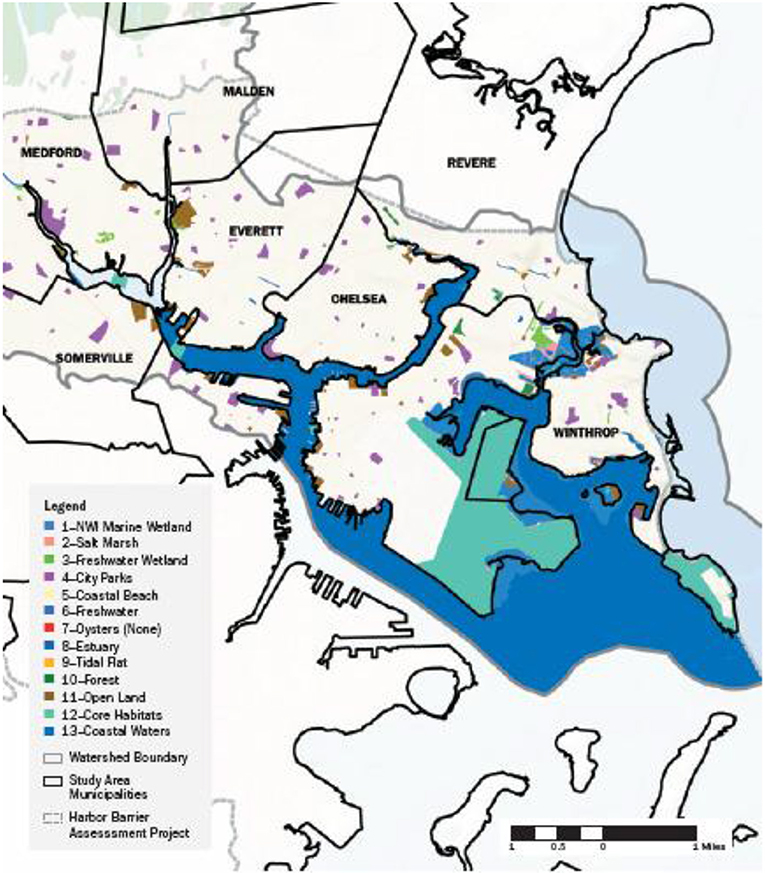
Figure 3. Mystic River Watershed.
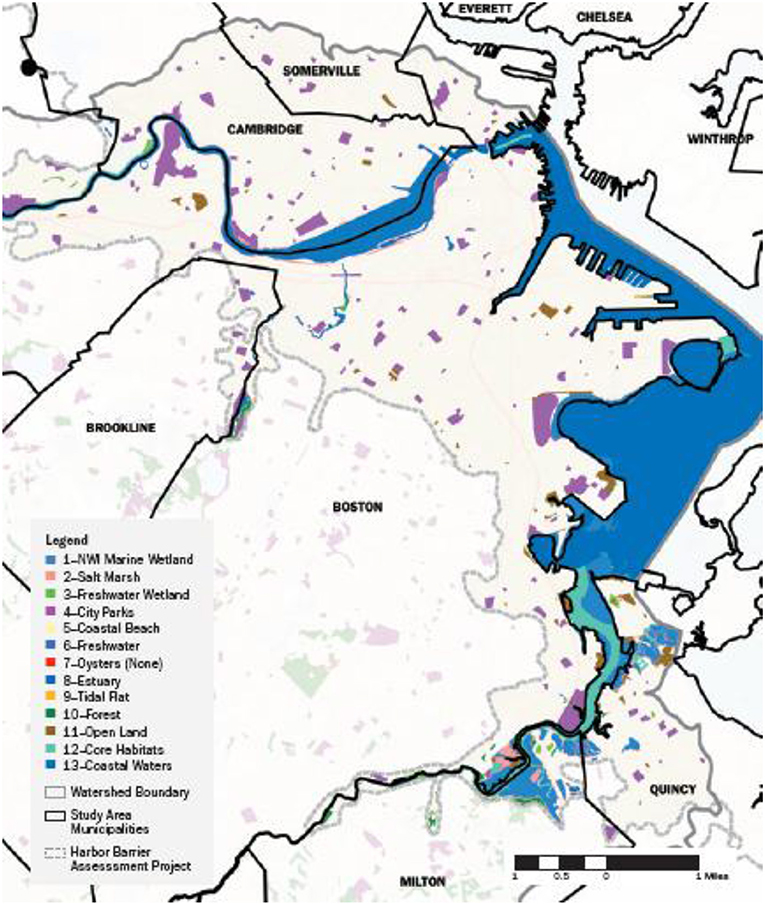
Figure 4. Charles and Neponset Rivers Watershed.
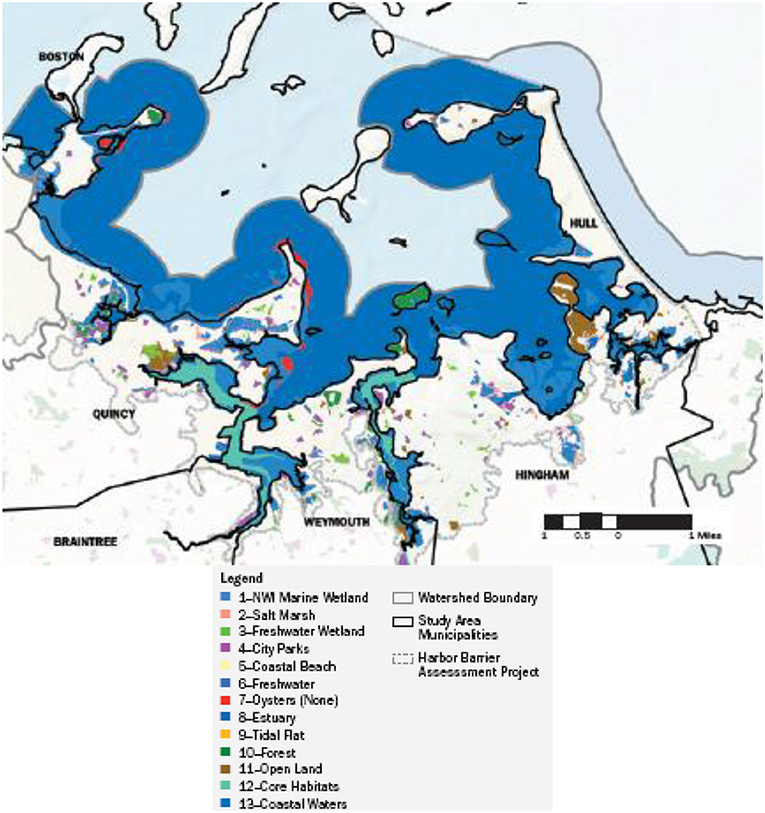
Figure 5. Weir River Watershed.
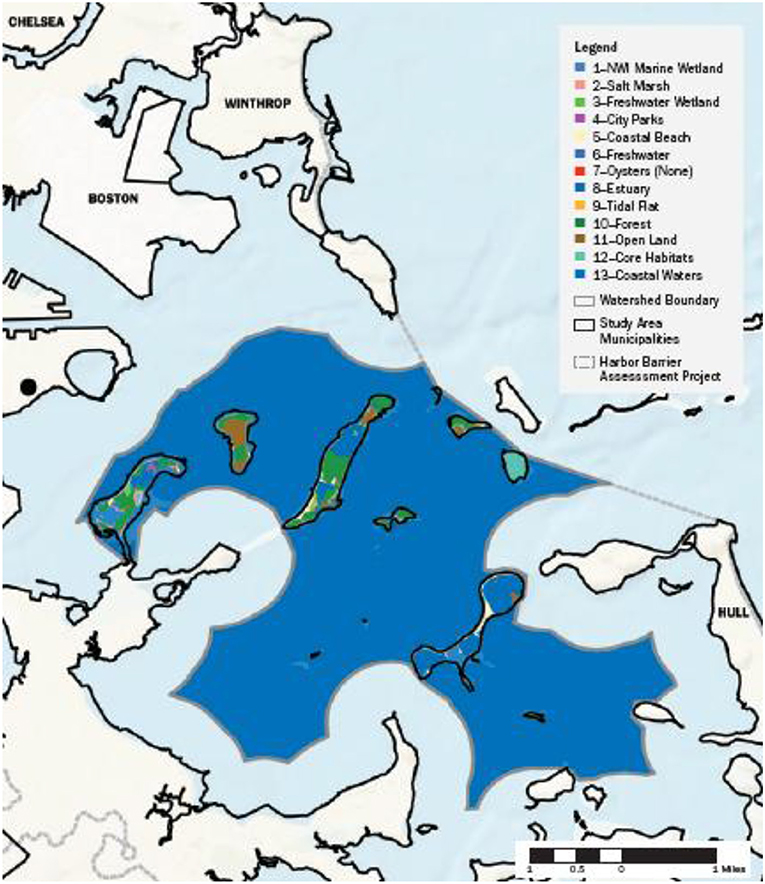
Figure 6. Harbor Islands.
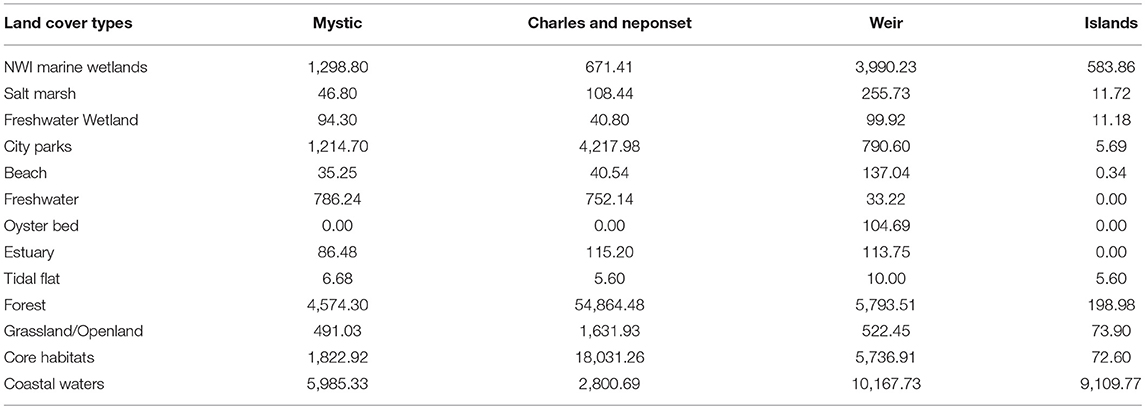
Table 3. 2013 Land cover areas (acres) at MHHW by watershed.
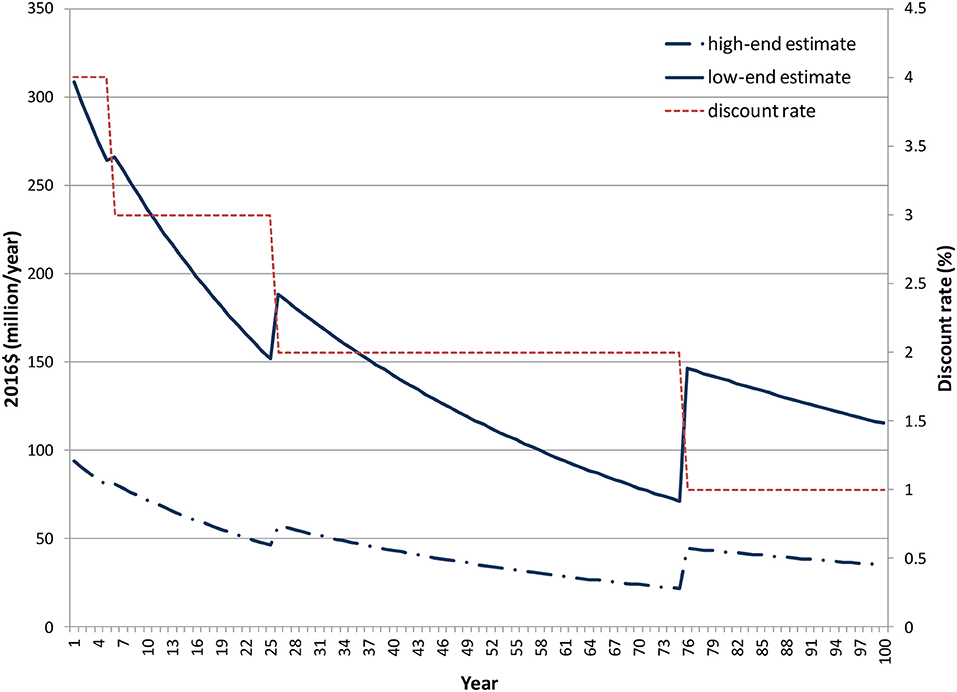
Figure 7. Flow of ecosystem service values (0 ft SLR), Mystic River Watershed (sliding-scale discount rate).
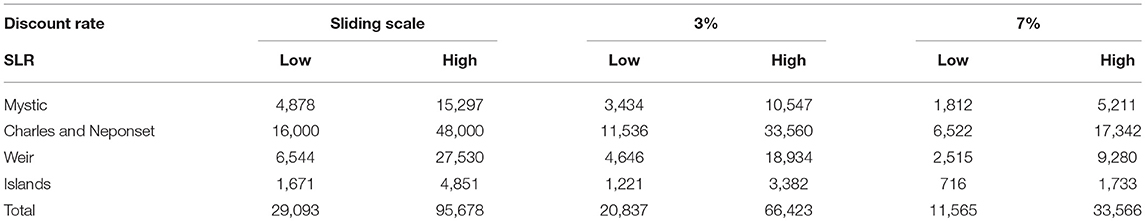
Table 4. Asset value of ecosystem services (2016 $ millions).
Cleanup Cost vs. Benefit of Ecosystem Services
Cost-benefit analysis (CBA) is a systematic method of identifying and measuring the economic benefits and costs of a project or program. The benefits of a project are the values of incremental outputs of goods and services, including environmental services, made possible by the project, and costs are the values of the incremental real resources used by the project (Hufschmidt et al., 1983). Ideally, benefit measures should reflect social welfare changes before and after the project (Johansson, 1993).
In the case of Boston Harbor Cleanup, relevant estimates of ecosystem service values in the 1980s (prior to the cleanup) are unavailable. Instead, we compare the cost of cleanup with a subset of ecosystem service values that are sensitive to water quality changes, assuming that these values would have been very low without the cleanup.
By comparing the cost of Boston Harbor Cleanup with the asset values of ecosystem services in the study area (last row in Table 4), we see that the $4.7 billion cleanup cost is about 5–16% of the total asset value of ecosystem services (about $30–100 billion under sliding scale discounting).
To provide a more detailed assessment, we compare the annual value of services provided by ecosystems sensitive to water quality changes with the annual debt service (total principal and interest payment) associated with the cleanup. The annual value of ecosystem services from the study area is in the range of $705 million to $2,128 million (Table 5). Ecosystem services that are sensitive to water quality change are identified in Tables 5. Assuming that without the cleanup all these services would have been lost due to poor water quality, we estimate the benefit of cleanup as $215 million to $859 million per year (Table 6).
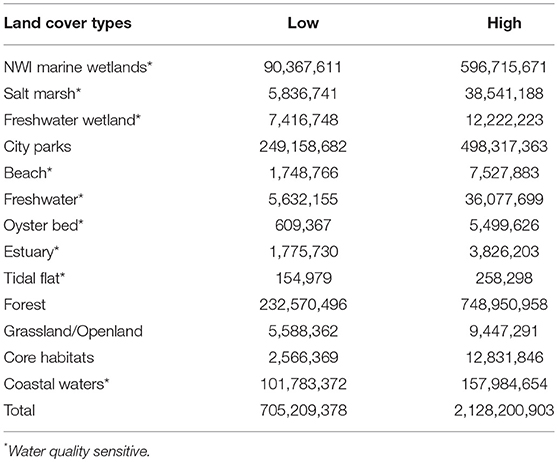
Table 5. Annual value of ecosystem services (2016$).
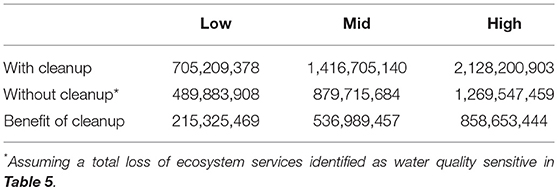
Table 6. Annual value of ecosystem services with and without cleanup (2016$).
Because the annualized payment for cleanup costs is affected by both interest rate and amortization period, we examine six different financing arrangements: three amortization periods (20, 40, and 60 years) each under two interest rates (3 and 7%) in Table 7. We calculate the benefit-cost ratio as the quotient of cleanup benefit [$215 million (low), $537 million (midpoint), or $859 million (high)] and the annual payment under each financing scheme. For example, with 3% interest rate and 60 year amortization, the annual payment of the $4.7 billion cost is $170 million. For the midpoint estimate of annual ecosystem service benefit of $537 million, the benefit-cost ratio is 3.16: the cost of cleanup is 32% (1/3.16) of the ecosystem service benefit. In other words, if 32% of the ecosystem value is attributable to the cleanup, then the investment in cleanup is economically justified. Note that in this case we consider only partial ecosystem values that are sensitive to water quality changes. If we use full ecosystem values in the calculation, the benefit-cost ratio will be significantly higher.
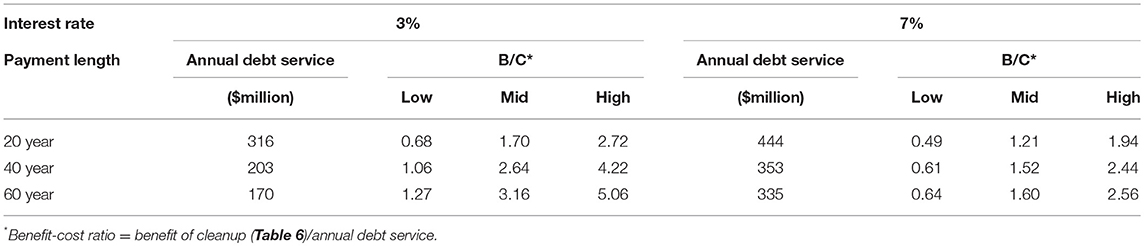
Table 7. Cost of Boston Harbor Cleanup vs. benefit of ecosystem services.
Overall, the results suggest that the cleanup investment is justified by our high-end and midpoint estimates of the ecosystem service benefits (B/C > 1). For the low-end estimates, the investment is justified if the debt is financed by long-term and low-interest loans. According to the Massachusetts Water Resources Authority (MWRA) (2014), the debt service schedule extends over 60 years (through fiscal year 2055). The long-term bond rates have been low (around 3%) in the recent decade. Both of these are favorable for low-cost financing.
Additional Consideration
With climate change and sea level rise (SLR), coastal land covers and associated ecosystem values will change in the future. As rising sea level inundates low-lying lands, property owners have typically attempted to hold back the sea by shoreline armoring, which can accelerate erosion and loss of beaches and tidal wetlands. To preserve natural defenses and other ecosystem services, alternative management approaches have been proposed to ensure that wetlands and beaches can migrate inland, and to remove buildings, roads, and other structures from land as they become submerged (Titus, 2011; Gittman et al., 2015).
To assess the effects of SLR on the asset value of ecosystem services under managed coastal retreat, we compiled several land covers as listed in Table A2 from Sea Level Affecting Marshes Model (SLAMM) results prepared by Woods Hole Group, Inc. (WHG) for conditions of 0, 1, 3, 5 feet of SLR under contract to Massachusetts Coastal Zone Management (CZM) (Woods Hole Group, 2016). The SLAMM model “simulates the dominant processes involved in wetland conversions and shoreline modifications during long-term sea level rise” (Clough et al., 2012). The WHG/CZM SLAMM model results we use in this analysis do not utilize impervious surfaces. Therefore, the model did not prohibit marshes and wetlands from expanding into currently “developed” areas; the marshes and wetlands migrate as dictated by the elevation landscape, as if the impervious features were absent.
We calculate the total asset values at two SLR stages (0 in 2013 and 5 feet in 2100), using the results of different land cover calculations and assuming no changes in the unit ecosystem service values. Figure 8 depicts the asset values for the four subareas under the two SLR scenarios and sliding scale discounting. The results suggest that, without additional shoreline protection measures and restrictions on marsh migration, the total ecosystem asset values are expected to increase (mainly due to growth in marsh/wetland areas) in the study area under SLR, highlighting the benefits of managed coastal. As a result, the benefit-cost ratio for the Boston Harbor Cleanup will be significantly higher than our baseline estimates. If, however, the marsh were not allowed to migrate in the SLAMM model simulations, marsh areas would reduce with SLR. As a result, the value of ecosystem services would decrease in future years.
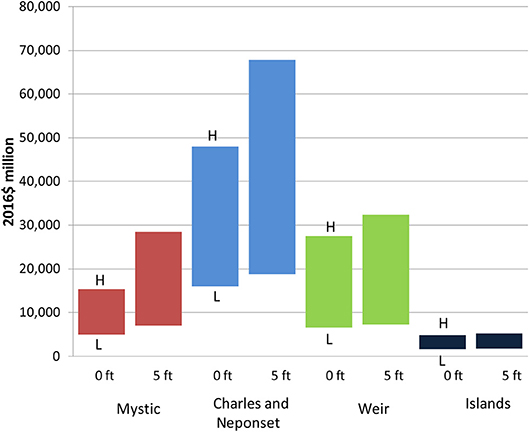
Figure 8. Effects of sea level rise (SLR) on ecosystem asset values (2016$ million, sliding scale discounting).
Conclusions
Ecosystems in the Boston Harbor study area provide a multitude of services to society with an estimated asset value of $30–100 billion. Sea level rise will affect these ecosystem service values: without shoreline armoring, the values are expected to grow, reflecting the benefits of managed retreat as a policy option. The $4.7 billion cost of the Boston Harbor Cleanup is about 5–16% of the total asset value of ecosystem services. With long-term and low-interest-rate financing, the annual cost for the cleanup may be justifiable by our estimates of annual value of ecosystem services.
In many places around the world, industrial and residential development projects are justified by cost-benefit analyses over environmental cleanup or ecosystem restoration proposals, because polluted environment and degraded ecosystems offer little ecosystem services. Our study highlights the potential benefits associated with the cleanup option. Indeed, the Boston Harbor Cleanup has led to a significant increase in private investment, and economic growth along the waterfront has outpaced the City's overall rate of increase (Save the Harbor/Save the Bay, 2004).
Author Contributions
DJ developed models and computer programs, collected and analyzed data, calculated valuation results, drafted the paper. CW developed GIS analysis, collected and analyzed data, calculated land cover results, created maps, edited the paper. HK-P Developed initial analysis of the case study, conducted literature review, reviewed the results, edited the paper. PK initiated the ecosystem valuation study, reviewed the results, edited the paper.
Funding
This article was prepared with support from WHOI Coastal Ocean Institute (COI Proposal #22575.01), Barr Foundation, NOAA COCA Program (NOAA Award Number: NA16OAR4310154), WHOI Sea Grant (NOAA Award Number: NA18OAR4170104), and the J. Seward Johnson Fund in Support of the Marine Policy Center. Erika Welch provided research assistance on GIS data collection and analysis.
Conflict of Interest Statement
The authors declare that the research was conducted in the absence of any commercial or financial relationships that could be construed as a potential conflict of interest.
Supplementary Material
The Supplementary Material for this article can be found online at: https://www.frontiersin.org/articles/10.3389/fmars.2018.00478/full#supplementary-material
References
Arrow, K., Cropper, M., Gollier, C., Groom, B., Heal, G., Newell, R., et al. (2013). Determining benefits and costs for future generations. Science 341, 349–350. doi: 10.1126/science.1235665
Brander, L. M., Florax, R. J. G. M., and Vermaat, J. E. (2006). The empirics of wetland valuation: a comprehensive summary and a meta-analysis of the literature. Environ. Resour. Econ. 33, 223–250. doi: 10.1007/s10640-005-3104-4
Clough, J., Park, R., Propato, M., Polaczyk, A., and Fuller, R. (2012). SLAMM 6.2 Technical Documentation. Waitsfield, VT: Warren Pinnacle Consulting, Inc. Available online at: http://warrenpinnacle.com/prof/SLAMM/ (Accessed 08-Jan-2018).
Costanza, R., d'Arge, R., de Groot, R., Farber, S., Grasso, M., Hannon, B., et al. (1997). The value of the world's ecosystem services and natural capital. Nature 387, 253–260.
Cropper, M. (2013). “How should benefits and costs be discounted in an intergenerational context?” in Resources. No.183. Resources for the Future (Washington, DC), 31–35. Available online at: http://www.rff.org/Publications/Resources/Pages/183-Benefits-and-Costs-in-Intergenerational-Context.aspx
David Evans and Associates and ECONorthwest (2004). Comparative Valuation of Ecosystem Services: Lents Project Case Study. Report prepared for City of Portland Watershed Management Program. Portland, OR.
de Groot, R., Brander, L., van der Ploeg, S., Costanza, R., Bernard, F., Braat, L., et al. (2012). Global estimates of the value of ecosystems and their services in monetary units. Ecosyst. Serv. 1, 50–61. doi: 10.1016/j.ecoser.2012.07.005
de Groot, R. S., Wilson, M. A., and Boumans, R. M. J. (2002). A typology for the classification, description, and valuation of ecosystem functions, goods, and services. Ecol. Econ. 41, 393–408. doi: 10.1016/S0921-8009(02)00089-7
Farber, S. C., Costanza, R., and Wilson, M. A. (2002). Economic and ecological concepts for valuing ecosystem services. Ecol. Econ. 41, 375–392. doi: 10.1016/S0921-8009(02)00088-5
Fenichel, E. P., Abbott, J. K., Bayham, J., Boone, W., Haacker, E. M. K., and Pfeiffer, L. (2016). Measuring the value of groundwater and other forms of natural capital. Proc. Natl. Acad. Sci. U.S.A. 113, 2382–2387. doi: 10.1073/pnas.1513779113
Fross, C., and Kite-Powell, H. (2015). A Partial Ecosystem Services Evaluation of the Boston Harbor: The Value of Cleanup. Marine Policy Center, Woods Hole Oceanographic Institution. Woods Hole, MA.
Gittman, R. K., Fodriem, F. J., Popowich, A. M., Keller, D. A., Bruno, J. F., Currin, C. A., et al. (2015). Engineering away our natural defenses: an analysis of shoreline hardening in the US. Front. Ecol. the Environ. 13, 301–307. doi: 10.1890/150065
Grabowski, J. H., Brumbaugh, R. D., Conrad, R. D., Keeler, A. G., Opaluch, J. J., Peterson, C. G., et al. (2012). Economic valuation of ecosystem services provided by oyster reefs. BioScience 62, 900–909. doi: 10.1525/bio.2012.62.10.10
Harnik, P., and Welle, B. (2009). Measuring the Economic Value of a City Park System. Washington, DC: The Trust for Public Land.
Hufschmidt, M. M., James, D. E., Meister, A. D., Bower, B. T., and Dixon, J. A. (1983). Environment, Natural Systems, and Development: An Economic Valuation Guide. Baltimore, MD: Johns Hopkins University Press.
Johansson, P,-O. (1993). Cost-Benefit Analysis of Environmental Change. New York, NY: Cambridge University Press.
Johnston, R. J., Magnusson, G., Mazzotta, M. J., and Opaluch, J. J. (2002). Combining Economic and Ecological Indicators to Prioritize Salt Marsh Restoration Actions. Am. J. Agric. Econ. 84, 1362–1370. doi: 10.1111/1467-8276.00403
Johnston, R. J., Rolfe, J., Rosenberger, R. S., and Brouwer, R. (2015). Benefit Transfer of Environmental and Resource Values: A Guide for Researchers and Practitioners. New York, NY: Springer.
Johnston, R. J., Segerson, K., Schultz, E. T., Besedin, E. Y., and Ramachandran, M. (2011). Indices of biotic integrity in stated preference valuation of aquatic ecosystem services. Ecol. Econ. 70, 1946–1956. doi: 10.1016/j.ecolecon.201
Kirshen, P., Borrelli, M., Byrnes, J., Chen, R., Lockwood, L., Watson, C., et al. (2018). Feasibility of Harbor-wide Barrier Systems: Preliminary Analysis for Boston Harbor. Boston, MA: Sustainable Solutions Lab, University of Massachusetts. Available online at: https://www.dropbox.com/s/zwznes9jin41i5k/Feasibility%20of%20Harbor-wide%20Barriers%20Report.pdf?dl=0
Kocian, M., Fletcher, A., Schundler, G., Batker, D., Schwartz, A., and Briceno, T. (2015). The Trillion Dollar Asset: The Economic Value of the Long Island Sound Basin. Tacoma, WA: Earth Economics.
Levy, P. F., and Connor, M. S. (1992). The Boston Harbor cleanup. New Engl. J. Pub. Policy 8, 91–104. Available online at http://scholarworks.umb.edu/nejpp/vol8/iss2/7
Martínez, M. L., Intralawan, A., Vázquez, G., Pérez-Maqueo, O., Sutton, P., and Landgrave, R. (2007). The coasts of our world: ecological, economic and social importance. Ecol. Econ. 63, 254–272. doi: 10.1016/j.ecolecon.2006.10.022
Massachusetts Water Resources Authority (MWRA) (2008). The Boston Harbor Project: An Environmental Success Story. Available online at: http://www.mwra.com/01news/2008/bhpenvironentalsuccess/bhpenvsuccess.htm
Massachusetts Water Resources Authority (MWRA) (2014). Capital Improvement Program: Final Fiscal Year 2015. Available online at: http://www.mwra.state.ma.us/finance/cip/fy15final/document.pdf
Massachusetts Water Resources Authority (MWRA) (2016). Capital Improvement Program: Fiscal Year 2017. Available online at http://www.mwra.state.ma.us/finance/cip/fy18final/document.pdf
Millennium Ecosystem Assessment Board (MEAB) (2003). Ecosystems and Human Well-being: A Framework for Assessment. Washington, DC: Island Press. Available online at: http://pdf.wri.org/ecosystems_human_wellbeing.pdf
Pendleton, L. H. (2008). The Economic and Market Value of Coasts and Estuaries: What's At Stake? Arlington, VA: Restore America's Estuaries (RAE).
Reddy, S. M. W., Guannel, G., Griffin, R., Faries, J., Boucher, T., Thompson, M., et al. (2015). Evaluating the role of coastal habitats and sea-level rise in hurricane risk mitigation: an ecological economic assessment method and application to a business decision. Integr. Environ. Assess. Manage. 12, 328–344. doi: 10.1002/ieam.1678
Rex,. A (2008). 20 Years of Change: Boston Harbor Pollution Abatement Project Timelines. Massachusetts Water Resources Authority. Outfall Monitoring Science Advisory Panel. Available online at: http://archives.lib.state.ma.us/bitstream/handle/2452/70735/ocn707397825.pdf?sequence=1&isAllowed=y
Save the Harbor/Save the Bay (2004). The Leading Edge: Boston Harbor's New Role in the City's Economy. Available online at: https://www.friendscny.org/wp-content/uploads/HarborPlanning/Save-the-Harbor-study-22The-Leading-Edge22-2004.pdf
Titus, J. G. (2011). Rolling Easements. Climate Ready Estuaries Progra, EP. Available online at: https://www.epa.gov/sites/production/files/documents/rollingeasementsprimer.pdf
Vandermeulen, V., Verspecht, A., Vermeire, B., Van Huylenbroeck, G., and Gellynck, X. (2011). The use of economic valuation to create public support for green infrastructure investments in urban areas. Landsc. Urban Plann. 103, 198–206. doi: 10.1016/j.landurbplan.2011.07.010
Wang, X., Chen, W., Zhang, L., Jin, D., and Lu, C. (2010). Estimating the ecosystem service losses from proposed land reclamation projects: a case study in Xiamen. Ecol. Econ. 69, 2549–2556. doi: 10.1016/j.ecolecon.2010.07.031
Wolf, K. L., Measells, M. K., Grado, S. C., and Robbins, A. S. T. (2015). Economic values of metro nature health benefits: a life course approach. Urban Forest. Urb. Green. 14, 694–701. doi: 10.1016/j.ufug.2015.06.009
Wolf, K. L., and Robbins, A. S. T. (2015). Metro nature, environmental health, and economic value. Environ. Health Perspect. 123, 390–398. doi: 10.1289/ehp.1408216
Woods Hole Group (2016). Modeling the Effects of Sea-Level Rise on Coastal Wetlands. Prepared for Massachusetts Office of Coastal Zone Management, Boston, Massachusetts. East Falmouth, MA: Woods Hold Group, Inc.
Keywords: Boston Harbor, pollution cleanup, ecosystem valuation, cost-benefit analysis, coastal management
Citation: Jin D, Watson C, Kite-Powell H and Kirshen P (2018) Evaluating Boston Harbor Cleanup: An Ecosystem Valuation Approach. Front. Mar. Sci. 5:478. doi: 10.3389/fmars.2018.00478
Received: 03 June 2018; Accepted: 28 November 2018;
Published: 17 December 2018.
Edited by:
Sebastian Villasante, University of Santiago de Compostela, SpainReviewed by:
Christian T. K.-H. Stadtlander, Independent Researcher, St. Paul, United StatesRichard Burroughs, University of Rhode Island, United States
Copyright © 2018 Jin, Watson, Kite-Powell and Kirshen. This is an open-access article distributed under the terms of the Creative Commons Attribution License (CC BY). The use, distribution or reproduction in other forums is permitted, provided the original author(s) and the copyright owner(s) are credited and that the original publication in this journal is cited, in accordance with accepted academic practice. No use, distribution or reproduction is permitted which does not comply with these terms.
*Correspondence: Di Jin, ZGppbkB3aG9pLmVkdQ==