 Anne W. Thompson1*
 Ger van den Engh2
 Nathan A. Ahlgren3
 Kathleen Kouba1
 Samantha Ward1
 Samuel T. Wilson4
 David M. Karl4
- 1Department of Biology, Portland State University, Portland, OR, United States
- 2Center for Marine Cytometry, Concrete, WA, United States
- 3Department of Biology, Clark University, Worcester, MA, United States
- 4Daniel K. Inouye Center for Microbial Oceanography: Research and Education, University of Hawaii at Mānoa, Honolulu, HI, United States
The cyanobacterium Prochlorococcus is the dominant phototroph in surface waters of the vast oligotrophic oceans, the foundation of marine food webs, and an important component of global biogeochemical cycles. The prominence of Prochlorococcus across the environmental gradients of the open ocean is attributed to its extensive genetic diversity and flexible chlorophyll physiology, enabling light capture over a wide range of intensities. What remains unknown is the balance between temporal dynamics of genetic diversity and chlorophyll physiology in the ability of Prochlorococcus to respond to a variety of short (approximately 1 day) and longer (months to year) changes in the environment. Previous field research established depth-dependent Prochlorococcus single cell chlorophyll distributions in the North Pacific Subtropical Gyre. Here, we examined whether the shifts in chlorophyll distributions correspond to changes in Prochlorococcus genetic diversity (i.e., ecotype-level community structure) or photoacclimation of stable communities over short time intervals. We report that community structure was relatively stable despite abrupt shifts in Prochlorococcus chlorophyll physiology, due to unexpected physiological plasticity of high-light adapted Prochlorococcus ecotypes. Through comparison with seasonal-scale changes, our data suggest that variability on daily scales triggers shifts in Prochlorococcus photoacclimation, while seasonal-scale dynamics trigger shifts in community structure. Together, these data highlight the importance of incorporating the process of photoacclimation and chlorophyll dynamics into interpretations of phytoplankton population dynamics from chlorophyll data as well as the importance of daily-scale variability to Prochlorococcus ecology.
Introduction
The picocyanobacterium Prochlorococcus is the numerically dominant photosynthetic microorganism in the Earth’s subtropical ocean gyres and by extension the most abundant photosynthetic cell on Earth (Biller et al., 2015). Prochlorococcus is a key component in the transfer of carbon and energy through open ocean food webs (Flombaum et al., 2013; Biller et al., 2015). The abundance and global distribution of Prochlorococcus is attributed to its affinity for warm oligotrophic waters, genetic diversity that spans at least 12 distinct lineages (termed ecotypes), and physiological plasticity (photoacclimation) that permits the tuning of chlorophyll concentrations to light availability across the euphotic zone (Moore et al., 1998; Moore and Chisholm, 1999; Hess et al., 2001; Coleman and Chisholm, 2007; Biller et al., 2015).
The 12 Prochlorococcus ecotypes have been separated broadly into high light (HL) ecotypes and low light (LL) ecotypes based on their 16S-23S intergenic transcribed (ITS) region sequence similarity (Rocap et al., 2002, 2003) and laboratory-based photophysiological characteristics (Moore et al., 1998; Moore and Chisholm, 1999). In culture, while both HL and LL ecotypes can photoacclimate over a wide range of light intensities, HL ecotypes have lower chlorophyll b/a2 ratios and are inhibited at very low light intensities where LL ecotypes thrive (Moore and Chisholm, 1999). The HL/LL dichotomy is supported by more recent data on genome content from cultured isolates (Rocap et al., 2003; Kettler et al., 2007; Biller et al., 2014), environmental sequences (Larkin et al., 2016), single cell genomes (Malmstrom et al., 2013; Kashtan et al., 2014), and the distribution of HL and LL ecotypes over depth (West and Scanlan, 1999; Ahlgren et al., 2006; Johnson et al., 2006; Zinser et al., 2007; Malmstrom et al., 2010). HL ecotypes eMED4 (HLI) and eMIT9312 (HLII) nearly always dominate the surface mixed layer, while eSS120 (LLII/III) and eMIT9313 (LLIV) become more abundant below the thermocline. LL ecotype eNATL is also most abundant below the thermocline, but persists in the surface mixed layer after deep mixing unlike other LL ecotypes (Malmstrom et al., 2010). Distinct ecotypes contain different sets of functional genes (Rocap et al., 2003; Kettler et al., 2007; Biller et al., 2014; Kashtan et al., 2014), interact uniquely with other microorganisms (Sullivan et al., 2003; Sher et al., 2011), and adjust differently to changes in light availability (Moore and Chisholm, 1999; Malmstrom et al., 2010). Therefore, shifts in ecotype community structure could impact the contributions of the Prochlorococcus “federation” to biogeochemical cycling (Biller et al., 2015).
The physiological plasticity of Prochlorococcus is evident in the culture experiments discussed above and also in the patterns of chlorophyll concentration per cell (i.e., single cell chlorophyll distributions) observed in natural assemblages of Prochlorococcus in the ocean. Natural Prochlorococcus populations increase chlorophyll concentration per cell toward the base of the euphotic zone. In some cases, below the thermocline distinct Prochlorococcus populations with high (“bright”) and low (“dim”) chlorophyll concentrations per cell co-exist, called a “double population” or “bimodal” population (Campbell and Vaulot, 1993; Dusenberry et al., 2000). However, more often, a gradual transition between “dim” and “bright” populations occurs with depth (Campbell and Vaulot, 1993; Dusenberry et al., 2000). The dim and bright populations are reminiscent of the HL/LL ecotype dichotomy but their genetic identity has not been directly linked to their in situ chlorophyll physiology, despite the many studies of Prochlorococcus ecotype distribution mentioned above. The relationships between Prochlorococcus chlorophyll concentration in situ, ecotype community structure, and productivity remain unknown but is critical for measuring and modeling Prochlorococcus contributions to global cycles under different oceanic scenarios (Follows et al., 2007; Lange et al., 2018; Morozov and Tang, 2018).
Here, we analyzed Prochlorococcus ecotype abundance alongside previously reported data on single cell chlorophyll distributions during a 2-week time-course at Station ALOHA that spanned the destratification and restratification of the water column (van den Engh et al., 2017). During this period, a burst in wind speed triggered destratification of the water column down to 128 m. Easing winds in the second half of the time-course allowed the restratification of the water column over a 6–7 day period. Dynamic shifts in Prochlorococcus single cell chlorophyll distributions were observed over depth and across daily time-scales in response to the changes in stratification. After deep mixing, there were more bimodal Prochlorococcus populations at the top of the thermocline, consistent with previous studies (Campbell and Vaulot, 1993; Dusenberry et al., 2000). We examined Prochlorococcus ecotype community structure in the samples from this time course and found that the shifts in single cell chlorophyll distributions could not be fully explained by shifts in ecotype community structure. Rather, photoacclimation by Prochlorococcus was the main contributor toward shifts in chlorophyll distribution. Thus, we hypothesize that shifts in community structure would require longer periods of altered oceanographic conditions. These observations have important implications for the interpretation of chlorophyll as a proxy for phytoplankton abundance in the open ocean and highlight the importance of sub-seasonal oceanic variability to Prochlorococcus ecology.
Materials and Methods
Cruise Information and Sampling
Samples were collected in the North Pacific Subtropical Gyre (NPSG) between March 11–25, 2014 onboard the R/V Kilo Moana, at Station ALOHA (22°45′N, 158°00′W) (Karl and Lukas, 1996), cruise number KM1409, using an Eulerian approach. Seawater samples were collected by 12L Niskin® bottles mounted on a rosette. 15 high-resolution depth profiles of temperature, salinity, dissolved oxygen, and bulk fluorescence were obtained by profiling with a CTD package (Sea-Bird SBE 911Plus) (see van den Engh et al., 2017, Figure 3). During the cruise, 15 depth profiles were sampled for flow cytometry at approximately 5 m intervals. In this study we report on the abundance of four Prochlorococcus ecotypes across five high-resolution depth profiles sampled during this period between the surface and 200 m. In order to obtain a high-resolution ecotype profile at 5-m intervals from the surface to 200 m, two of these casts were performed back to back (cast 57 and cast 58, March 23rd), and data from these two profiles are combined in the figures and analysis we present. Wind speed at Station ALOHA was obtained from the Woods Hole Oceanographic Institution Hawaii Ocean Time-series Site (WHOTS) buoy for the period of interest1. Mixed layer depth was calculated as a 0.125 kg/m3 offset from the density at 1 decibar. Cruise data for KM1409 (a.k.a. HOE BOE I) is available on the Center for Microbial Oceanography: Research and Education website2. To compare the 2-week time-course to seasonal patterns, a database of monthly Prochlorococcus ecotype abundance and flow cytometry measurements from Station ALOHA (Malmstrom et al., 2010) was analyzed for the same parameters as the 2014 expedition.
Nutrient Analysis
Nutrient analysis, which included the sum of nitrite (NO2-) plus nitrate (NO3-) (N+N), phosphate (P), and silica (Si), was performed on land using a Bran+Luebbe Autoanalyzer III. NO2- + NO3- was also determined using the chemiluminescence method for samples collected from 0–175 m as this method has an improved detection limit of 1 nmol L-1 (Dore and Karl, 1996).
Quantitative PCR (qPCR)
Quantitative PCR for four discrete Prochlorococcus ecotypes (eMED4, eMIT9312, eNATL, and eSS120) was carried out with previously established primers (Zinser et al., 2007), with procedural modifications to enable high-throughput processing while at sea. Modifications included using whole seawater diluted 10-fold in sterile nuclease-free water as the template in qPCRs, rather than lysed cells (Zinser et al., 2007). With the 10-fold dilution and 25 μl qPCR volumes, effectively, 1 μl aliquots of each discrete seawater sample were assayed in triplicate for each ecotype. Initial tests with less diluted seawater (i.e., 1:1 and 1:5) resulted in inhibition of qPCR, while higher dilutions limited the sensitivity to detect less abundant ecotypes. Standards were prepared from linearized plasmids. Linearized plasmid standards and were normalized to qPCR standards used in previous studies, which were generated from known quantities of cultured cells of each ecotype to ensure accuracy and robust comparison to existing studies with the same assays (Johnson et al., 2006; Zinser et al., 2007; Malmstrom et al., 2010). As reported in Zinser et al. (2006), the theoretical limit of detection for the assays is 0.65 cells mL-1. Samples where qPCR amplification was not detected were eliminated from analysis. Depth integrated abundances for each ecotype were calculated down to 150 m, keeping in mind the caveats of large error presence at some depths.
Flow Cytometry and Cell Sorting of Prochlorococcus Bimodal Populations
Flow cytometry was performed to enumerate cells and quantify single-cell chlorophyll distributions in Prochlorococcus as previously described (van den Engh et al., 2017). Briefly, a BD Influx flow cytometer equipped with a small particle detector was used shipboard to count and analyze unpreserved seawater samples. Data collection was triggered on forward light scatter (FSC). Red fluorescence was used as a proxy for chlorophyll concentration.
Toward identifying the ecotypes of Prochlorococcus in bimodal populations, two populations of Prochlorococcus were distinguished based on red fluorescence (i.e., chlorophyll) and forward scatter signals. Distinction and naming of the two populations followed previous work where the Prochlorococcus bimodal populations were observed (Campbell and Vaulot, 1993; Binder et al., 1996; van den Engh et al., 2017). “Bright” Prochlorococcus contained relatively high chlorophyll fluorescence forward scatter. “Dim” Prochlorococcus were defined as cells with relatively low chlorophyll fluorescence and forward scatter. Supplementary Figure S1 shows how “bright” and “dim” cells were distinguished along a representative depth profile. We compared the abundance and depth distribution of “bright” and “dim” Prochlorococcus to HL and LL ecotype abundances in the 2-week time-series.
A similar comparison between the depth distribution of “bright” Prochlorococcus and LL ecotypes was completed for a 1-year period (2007–2008) from data previously published as a 5-year monthly time-series at Station ALOHA (Malmstrom et al., 2010). For the 5-year dataset, different gains were used for different flow cytometry samples, so gates were drawn on data normalized to spiked-in fluorescent 1 μm diameter beads. Depth profiles including samples without spiked-in beads were excluded from the analysis. Thus, we examined four depth profiles from this period (Supplementary Figure S7).
Flow cytometry cell sorting coupled to sequence analysis was used to identify the Prochlorococcus ecotype composition of each population of a Prochlorococcus bimodal population. Because all flow cytometry during the 2-week Station ALOHA time-series was performed shipboard without preservation and samples were not archived, a bimodal population was obtained in March 2017 from a region approximately 808 nautical miles Northeast of Station ALOHA (30° 29.94′ N, 145° 37.10′ W) on cruise number SKQ201703s on board the R/V Sikuliaq from 85 m depth within the top of the thermocline. The double populations in this sample appear identical to double populations observed at Station ALOHA (Campbell and Vaulot, 1993; van den Engh et al., 2017). For cell sorting, we used established protocols to ensure sterility and minimize possible free DNA contamination of cell sorts (Rodrigue et al., 2009). Prochlorococcus populations were sorted based on their forward light scatter (FSC) and red fluorescence (i.e., chlorophyll) properties. Bright and dim populations were identified for sorting (see above), with stringent sort gates drawn around each population to avoid overlap. From each population, 10,000 cells were sorted into separate 1.5 mL microfuge tubes, using the “1.0 Drop Single” sort mode, followed by storage at -80°C until use in whole genome amplification (see below). Alongside cell sorts, 1 μm polystyrene beads (Polysciences) were spiked into the seawater sample and sorted identically to the cells as a negative control for use in whole genome amplification.
Whole Genome Amplification of Sorted Cells
Multiple displacement amplification (MDA) was used to amplify whole genomes of sorted cells from the Prochlorococcus bright and dim populations in the single sample described above. MDA was used instead of PCR applied directly to the sorted cells to make sure we obtained adequate material for downstream sequencing of the target populations, even though PCR applied directly to sorted cells could have yielded enough material for sequencing. MDA was carried out using the RepliG Mini kit (Qiagen), following manufacture’s protocols, with a 10-hour linear amplification step. For each sorted population (dim and bright) and the bead controls, MDAs were carried out in three replicate reactions. Template for each MDA was approximately 1,500 cells or beads in approximately 3 μl volume. MDA product was diluted 100-fold with nuclease-free water, quantified by Qubit (Thermo Fisher Scientific), and analyzed by gel electrophoresis to assess quality and size distribution of fragments prior to PCR amplification of cyanobacterial ITS regions.
Barcoded ITS PCR and Sequencing
Diluted MDA product (5 ng) was used in triplicate PCRs with primers targeting the cyanobacterial 16S-23S intergenic transcribed (ITS) region. Primers 1247f (Rocap et al., 2002) and ITS-ar (Lavin et al., 2008) were linked to Illumina adaptor sequences and unique barcodes and index sequences following a similar strategy as used for 16S rRNA amplicon sequencing described in Parada et al. (2016) and Ahlgren et al. (unpublished). MDA from the negative control bead sorts routinely yielded no detectable PCR product so were not sequenced, giving us confidence that sequences recovered from cell sorts were derived directly from cells and not from “free DNA” in seawater co-sorting with the target cells. Barcoded PCR products were purified with AxygenTM AxyPrep MagTM PCR Clean-up Kits (Axygen Scientific), quantified by Qubit and qPCR targeting Illumina adaptors (Kapa Biosystems), then pooled to create the multiplexed sample library for sequencing. Sequencing was by Illumina MiSeq (2 × 250 bp paired end reads), though only reverse reads were used for calling operational taxonomic units (OTUs). QIIME (Caporaso et al., 2010) was used to quality filter sequence reads and call OTUs de novo. A representative sequence from each OTU was identified to the ecotype level using BLASTn (Altschul et al., 1990) with a database of cyanobacterial ITS sequences from cultured isolates.
Results
Shifts in Water Column Properties Due to Wind-Driven Mixing
During a 2-week period at Station ALOHA we observed the destratification and restratification of surface waters (Figure 1). At the beginning of the time-course an increase in wind speed drove the destratification of a previously stratified water column, deepened the mixed layer, entrained water from the previously stratified thermocline into the new deep mixed layer (Ferrón et al., 2015), and cooled sea surface temperature. Restratification of the water column and shoaling of the mixed layer occurred during a 1-week period following peak wind speeds (Figure 1A). Detailed analysis of the oceanographic context of the sampling period has been described previously in two studies (Ferrón et al., 2015; van den Engh et al., 2017). The depth of the mixed layer ranged from 61 to 128 m during the 2-week period, which is comparable to seasonal shifts in the mixed layer depth at Station ALOHA over a 5-year period (Supplementary Figure S2). Prochlorococcus concentration decreased approximately 2-fold in the surface mixed layer following the deepest mixing (Figure 1B), leading to a similar decrease in depth-integrated abundance over the time-course (Supplementary Figure S3). Concentrations of phosphorus, silica, and N+N were measured at six time-points for several depths within the mixed layer and thermocline (Supplementary Figure S4). We observed depletion of Si and P in the surface mixed layer following deep mixing, whereas a shift N+N concentration was not detected.
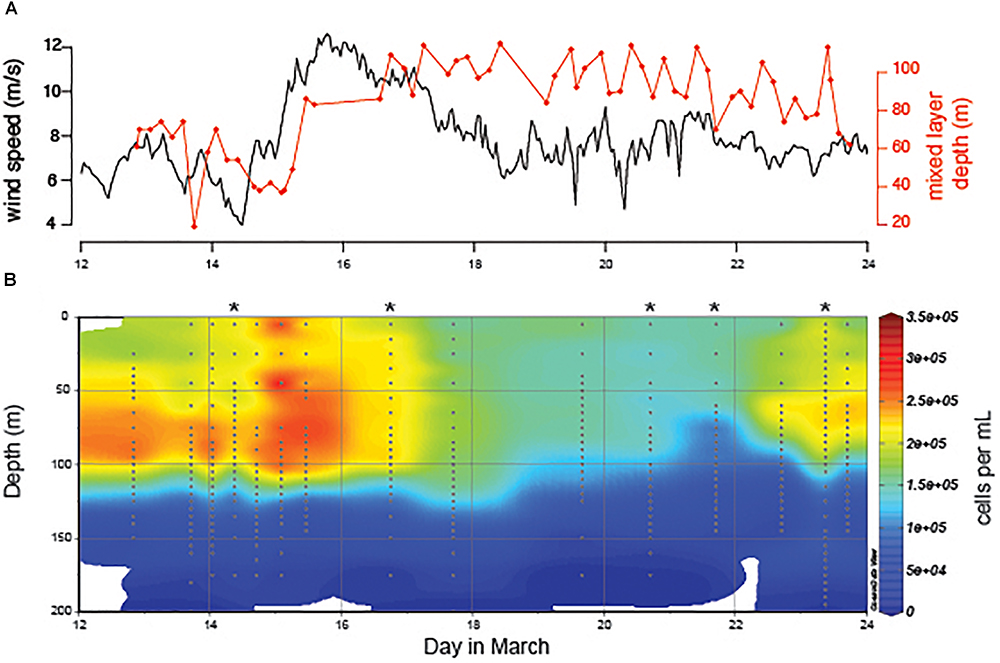
Figure 1. (A) Water column properties at Station ALOHA in response to a peak in wind speed (black) and deepening of the mixed layer (red). (B) Prochlorococcus abundance over the 2-week time-course. Depth profiles with accompanying ecotype abundance data (Figure 2) are marked with asterisks. All depth profiles have accompanying single cell chlorophyll distribution data presented in van den Engh et al. (2017).
Variation in Prochlorococcus Ecotype Composition
To measure shifts in Prochlorococcus community structure in response to 2 weeks of daily-scale oceanographic variability, we analyzed five high-resolution depth profiles for four dominant Prochlorococcus ecotypes by qPCR, including the HL ecotypes eMED4 and eMIT9312 and the LL ecotypes eNATL and eSS120 (Figure 2).
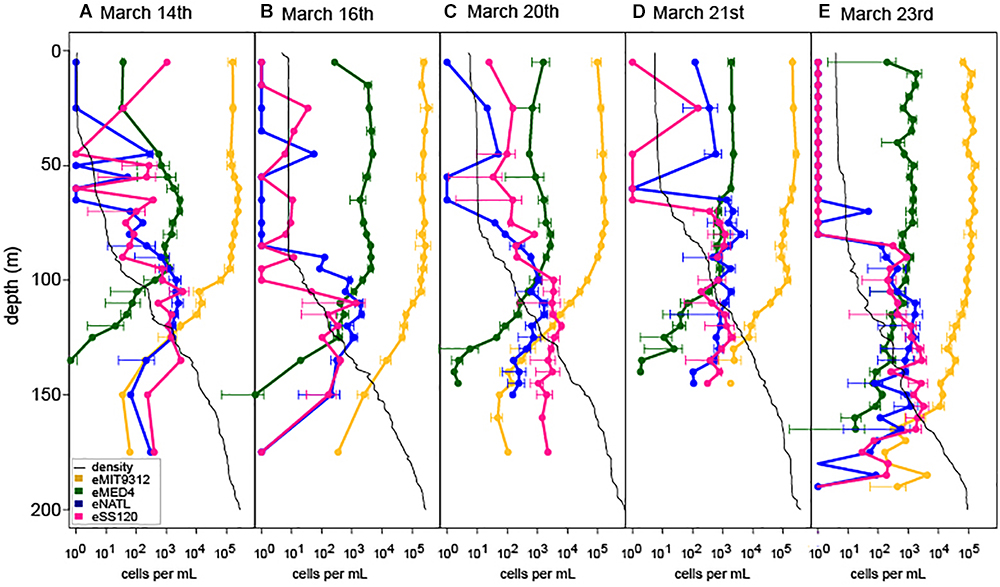
Figure 2. Ecotype abundance of Prochlorococcus over depth profiles across a 2-week period at Station ALOHA (A–E). Oceanographic context and Prochlorococcus abundance for profiles is marked in Figure 1B. Peak wind speeds and deepest mixing occurred on March 16th (B) and eased through the remaining time course. Density profiles for each cast are show by the black trace in each plot.
Despite the dramatic shifts in the depth of the surface mixed layer (Figure 1A) HL ecotype eMIT9312 always outnumbered eMED4 in the surface mixed layer (Figure 2) and in depth integrated abundance (Supplementary Figure S5), consistent with seasonal dynamics of HL ecotypes at Station ALOHA (Malmstrom et al., 2010). In contrast, the relative abundance of LL ecotypes was dynamic over the 2-week time-course in multiple ways (Figure 2 and Supplementary Figure S5). After deep mixing (March 20th and March 21st), both LL ecotypes eSS120 and eNATL became more abundant in the surface mixed layer, coinciding with the entrainment of water from the previously stratified thermocline into the surface mixed layer due to the strengthened wind (Ferrón et al., 2015). However, at all time points, LL ecotype abundance remained orders of magnitude less than HL ecotype abundance in the surface mixed layer. LL ecotype abundance in the surface mixed layer returned to levels below detection limit by the end of the time-course (March 23rd) when the water column became restratified. In addition, there were multiple shifts in the relative dominance of eNATL or eSS120 in the surface mixed layer. Prior to the onset of deep mixing, eNATL and eSS120 were present at or near detection limit in the surface mixed layer (March 14th and 16th). As the water column became destratified, the LL ecotypes increased in abundance in the surface mixed layer, with eSS120 dominating the LL ecotypes (March 20th). One day later (March 21st) (or approximately 10 km away because this is a Eulerian sampling scheme) eNATL dominated LL ecotypes in the surface mixed layer. Short-term shifts in eNATL and eSS120 abundance were also observed in their of depth-integrated inventories (Supplementary Figure S5).
Ecotype vs. Chlorophyll Physiology Comparison
Previous work documented dramatic shifts in Prochlorococcus single cell chlorophyll concentrations over depth and from day-to-day (van den Engh et al., 2017). In Station ALOHA surface mixed layers, Prochlorococcus single cell chlorophyll distributions were unimodal with mean chlorophyll content constant over depth. Below the mixed layer in a continuously stratified water column, Prochlorococcus single cell chlorophyll distributions were also unimodal, however, the mean chlorophyll increased continuously with depth. Discontinuities in water column density (or potential density) below the mixed layer corresponded to abrupt shifts in the means of Prochlorococcus single cell chlorophyll distributions and occasionally resulted in bimodal distributions (i.e., a Prochlorococcus “double” population; see Figure 4 and Supplementary Figure S1). Such depth discontinuities in single cell chlorophyll distributions were commonly seen in the second part of the time-course following destratification of the water column (van den Engh et al., 2017).
We tested whether shifts in chlorophyll distributions corresponded to shifts in Prochlorococcus ecotype community structure or photoacclimation to different light levels, or both. Genomic analysis and growth physiology studies suggest that LL ecotypes contain more chlorophyll per cell than HL ecotypes (Moore and Chisholm, 1999). First, we tested whether increased abundance of cells with higher chlorophyll (i.e., bright cells, see section Materials and Methods) corresponded to increased abundance of LL ecotypes. We found that the depth profiles of Prochlorococcus bright populations and LL-ecotypes changed proportionally across depths in all casts along the 2-week time-course (Figure 3). The strength of the correlation between bright Prochlorococcus and LL-ecotypes varied across the time-course, with the best correlation on March 20th (R2 = 0.854) and poorest correlation on March 21st (R2 = 0.231), where two maxima were observed for both the LL ecotype and bright cell profiles (Figure 3D). However, the abundance of bright Prochlorococcus was substantially greater than the sum of LL-ecotypes eNATL and eSS120 (see different x-axis scales, Figure 3). Next, we tested whether the relationship we observed between bright Prochlorococcus and LL-ecotypes was a widespread feature of Prochlorococcus by comparing the 2-week time series to monthly samples from a previously published time-series of Prochlorococcus abundance and ecotype composition at Station ALOHA (Malmstrom et al., 2010). Our observations of a proportional relationship and discrepancy in absolute abundance between bright Prochlorococcus and LL-ecotypes abundances, was recapitulated in the monthly time-course at Station ALOHA (Supplementary Figures S6, S7).
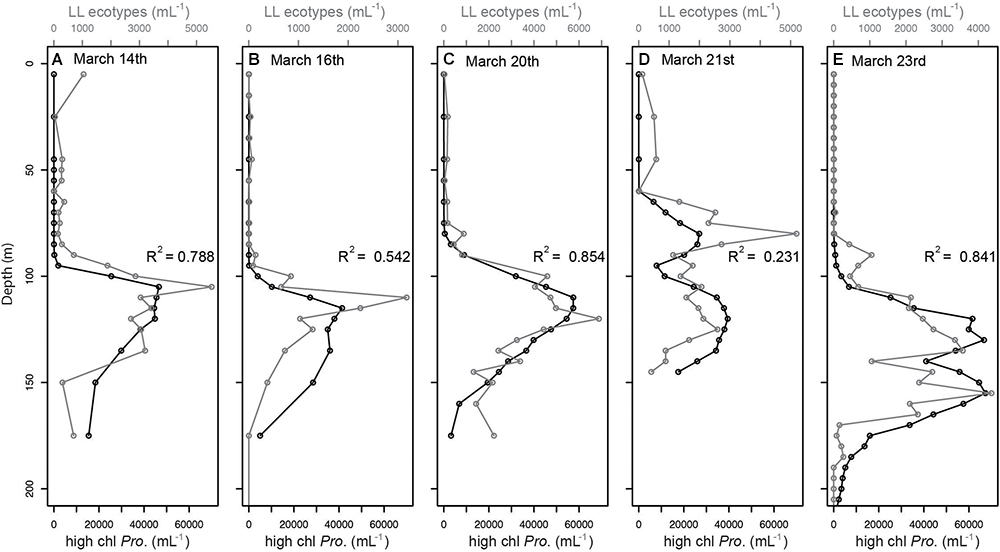
Figure 3. Comparison of vertical profiles of Prochlorococcus LL ecotypes (eNATL and eSS120) across the two week time-course (A–E), as measured by qPCR (black symbols) and “bright” (high chl. Pro.) Prochlorococcus cells as measured by flow cytometry (gray symbols) and defined in Supplementary Figure S1. The relationship between these independent measurements on the same subpopulations of Prochlorococcus cells is indicated by the correlation values (R2) shown in each plot. Peak wind speeds and deepest mixing occurred on March 16th (B) and eased through the remaining time course. Similar patterns were observed over a year time-course at Station ALOHA (Supplementary Figure S7). Comparison of “bright” and “dim” abundances over depth were presented previously in van den Engh et al. (2017).
For both time-series two important caveats exist toward the above interpretation of the results. First, the qPCR assays employed do not detect all lineages of LL-ecotypes. Zinser et al. (2006) demonstrated that in the North Atlantic, under certain conditions, Prochlorococcus counts by qPCR are an order-of-magnitude less than counts by flow cytometry deep within the euphotic zone. The undetected LL-ecotypes are likely composed of more recently recognized LL-ecotypes (i.e., LLV, LLVI, and LLVII) and possibly additional unrecognized LL-ecotypes. Thus, in our samples, abundance of LL-ecotypes from lineages other than eSS120 and eNATL could contribute toward the difference between bright Prochlorococcus and LL-ecotypes (Figure 3). Secondly, differences in cell lysis of LL-ecotypes during PCR and differences in qPCR yield could contribute to the magnitude of the difference between bright cells and LL-ecotypes. LL ecotypes require more rigorous cell lysis protocols (Martiny et al., 2006). Inefficient lysis of LL-ecotypes could have contributed toward the difference in quantity of bright cells and LL-ecotypes.
Ecotype Composition of Prochlorococcus “Double” Populations
To further test whether physiologically distinct Prochlorococcus cell populations represent distinct genotypes, and address the caveats presented above, we examined the ecotype composition of the two populations in a Prochlorococcus “double” population (Figure 4A). Sequencing of ITS amplicons from the sorted whole genome-amplified dim and bright cells revealed that LL-ecotype OTUs (eNATL) were present exclusively among the bright cells (Figure 4B, top). HLII OTUs (eMIT9312) were present mostly among the dim cells and HLI OTUs (eMED4) were present in both dim and bright populations (Figure 4B, bottom). In summary, HL ecotypes were present in both bright and dim populations. Note: The sample used for cell sorting was obtained from a station Northeast of Station ALOHA in March 2017 (85 m depth within the top of the thermocline). The dominance of HLI ecotypes at this latitude is consistent with prior understanding of Prochlorococcus HLI and HLII global distributions (Johnson et al., 2006; Ribalet et al., 2015; Larkin et al., 2016).
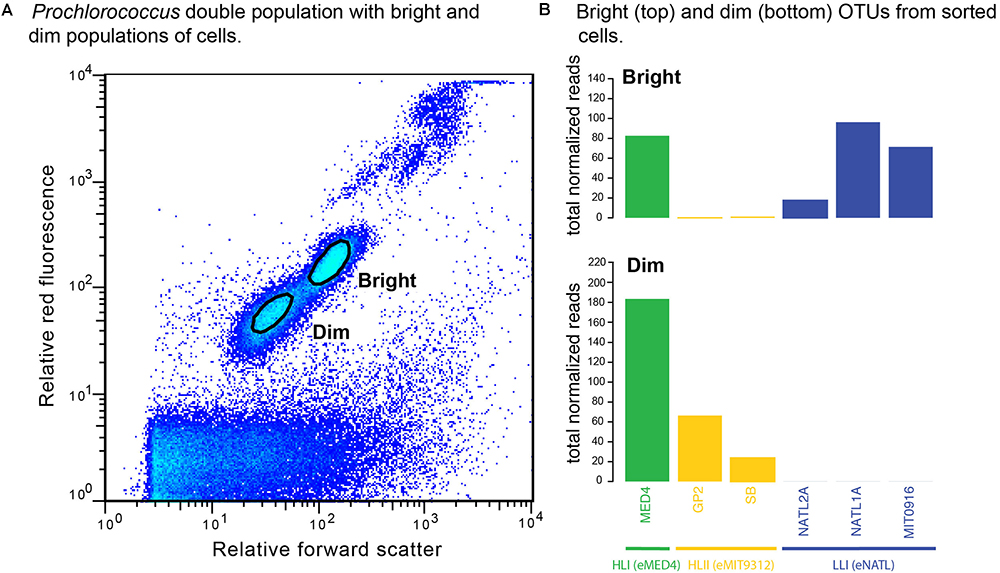
Figure 4. Ecotype identity of cells from Prochlorococcus double populations. (A) “Bright” and “dim” populations were defined based on relative red fluorescence and relative forward scatter signals. The boundary of sort gates is indicated by black ovals. “Bright” cells (B top) were composed of low-light adapted ecotypes (blue) and high-light adapted ecotypes (green and yellow). “Dim” cells (B bottom) were composed solely of high-light adapted ecotypes (green and yellow).
Discussion
The numerical dominance of Prochlorococcus in the surface waters of open ocean gyres is attributed to the group’s extensive genetic diversity and physiological plasticity that supports growth across a wide range of environmental conditions (Coleman and Chisholm, 2007; Biller et al., 2015). While these two Prochlorococcus characteristics have been studied extensively among cultured isolates and natural assemblages, no studies have examined the relationship between genetic diversity and physiological plasticity in the same samples in the context of physical and biogeochemical variability in the ocean. Determining how this abundant cyanobacterial group responds to changes in oceanographic conditions is essential toward advancing understanding of the contributions of Prochlorococcus to global biogeochemical cycles.
Chlorophyll Physiology Cannot Be Fully Explained by Community Structure
We found that the chlorophyll physiology of Prochlorococcus populations could not be explained solely by ecotype composition. While correlations of bright (i.e., high chlorophyll content) Prochlorococcus cells and LL Prochlorococcus ecotypes were strong across depth profiles, bright Prochlorococcus outnumbered LL ecotypes by 2–10-fold across a 2-week daily time-series (Figure 3) and a year-long period (Supplementary Figure S7). This result suggested that bright cells are composed of both HL ecotypes and LL ecotypes. To address this possibility, we demonstrated that sequences from HL ecotypes were present in cell sorts of both bright and dim populations, while sequences from LL ecotypes were found only among sorted cells of the bright population (Figure 4). In addition, the ecotype abundance profiles show that there are many samples in which multiple ecotypes coexist that do not show bimodal distributions in the corresponding database of single cell chlorophyll distributions (van den Engh et al., 2017). Together, these observations do not support hypotheses raised in early studies of Prochlorococcus where high-chlorophyll (bright) populations of cells in the stratified thermocline were hypothesized to be composed of distinct Prochlorococcus genotypes (Campbell and Vaulot, 1993; Dusenberry et al., 1999). Rather, the Prochlorococcus high-chlorophyll phenotype is composed of diverse Prochlorococcus genotypes. These data support a suggestion by van den Engh et al. (2017) that bimodal populations could be the result of recent mixing of water and vertical transport (and cell populations) from different depths. The bimodal population could be the result of observation before the cells have had time to photoacclimate to the new light availability at the new depth. This observation suggests that light conditions below the mixed layer may be dynamic in previously unrecognized ways (i.e., non-diel patterns) due to processes such as turbulent mixing at the mixed layer to thermocline interface, breaking of internal waves, light shock, and long periods of darkness. Indeed, recent laboratory experiments show that Prochlorococcus in the company of heterotrophic bacteria can survive prolonged darkness (Coe et al., 2016). More work examining how Prochlorococcus responds to non-diel light fluctuations is needed to more deeply understand the ecology of this abundant cyanobacterium.
We also found that HL ecotypes were able to match LL ecotypes in their elevated chlorophyll concentrations at the light-limited base of the euphotic zone. An elegant set of light physiology studies have documented that LL ecotypes in culture have distinctly more chlorophyll per cell and chlorophyll b relative to divinyl chlorophyll a than HL ecotypes in culture across a range of light intensities (Moore and Chisholm, 1999). Furthermore, in culture, LL ecotypes have a clear growth advantage at low light levels characteristic of the base of the euphotic zone (Moore and Chisholm, 1999). Our results suggest that in the natural conditions of the water column HL ecotypes may be even more physiologically plastic than expected from laboratory studies. This perhaps is not surprising given previous observations (Ahlgren et al., 2006; Johnson et al., 2006; Zinser et al., 2007; Malmstrom et al., 2010) that HL ecotypes are abundant deep in the water column such that they span the lowest and highest of light intensities encountered in the euphotic zone (Figure 2). Our results indicate that HL ecotypes may be capable of augmenting internal chlorophyll concentrations and cell size (FSC as a proxy) to the same extent as LL ecotypes in natural assemblages (Figure 4). Important future work would examine the HL and LL-specific growth rates at the base of the euphotic zone, influences of light and nutrient availability on LL and HL cell phenotype at this position in the water column, as well as the metabolic activity of cells from each group, to understand the contributions of coexisting ecotypes to biogeochemical cycling and primary production in the deep euphotic zone.
Deep Mixing Entrains LL Ecotypes Into Surface Mixed Layer
We observed slight increases in the abundance of LL ecotypes in the surface mixed layer, especially eNATL, following mixing into a previously stratified thermocline (Figure 2). An entrainment event occurred during this period (Ferrón et al., 2015), thus we hypothesize that the increase in the abundance of LL ecotypes was linked to the entrainment of stratified water containing LL ecotypes from below the mixed layer into the new deeper surface mixed layer. Entrainment of water from the stratified thermocline into the mixed layer was also implicated in transporting LL ecotype eNATL into surface waters during periods of deep mixing in 5-year time-courses at Station ALOHA and BATS (Malmstrom et al., 2010). The persistence of eNATL, and not eSS120 or eMIT9313, is consistent with eNATL’s superior ability to handle high-light exposure (Malmstrom et al., 2010). Malmstrom et al. (2010) also observed the net accumulation of LL ecotype eNATL in surface waters during month-long periods of deep mixing. However, in that study it was not possible to determine if eNATL’s persistence was due to growth in the surface mixed layer. In contrast, in the 2-week period we studied, elevated concentrations of eNATL did not lead to their accumulation in the surface mixed layer. We hypothesize that LL ecotypes could not compete with HL ecotypes as the water column restratified over a period of several days in our time-series. These results may indicate that LL ecotypes detected in the surface mixed layer across ocean basin transects (Johnson et al., 2006) could be the result of either recent water entrainment from the stratified thermocline or sustained periods of deep mixing. Experiments testing the metabolic activity of LL ecotypes such as eNATL that are present in the surface mixed layer would help determine the ecosystem contributions of these vertically transported cells. The Eulerian sampling approach taken here, and in the 1-year time-series, cannot rule out the possibility that a new water mass arrived at Station ALOHA during the sampling period influencing the distribution of Prochlorococcus ecotypes. Future experiments using Lagrangian approaches, such as Robidart et al. (2014), would be useful toward developing additional understanding of the interaction between physical oceanographic processes, Prochlorococcus chlorophyll distribution, and Prochlorococcus community structure dynamics.
Prochlorococcus Photoacclimation and Shifts in Community Structure Occur on Distinct Time-Scales
Subtle shifts in Prochlorococcus community structure contrasted with dramatic shifts in Prochlorococcus abundance (Figure 1B and Supplementary Figure S3) and single cell chlorophyll distributions (van den Engh et al., 2017) from day-to-day across the 2-week time-course at Station ALOHA. Photoacclimation allowed for relatively rapid adjustments to unexpectedly altered conditions (i.e., non-diel changes in light availability), possibly on time-scales ranging from minutes [changes in gene and protein expression (Steglich et al., 2010)] to days [estimates of changes in chlorophyll concentration per cell, or photoacclimation rates, from 0.9–2 d-1 (Dusenberry et al., 2001)]. Meanwhile, our comparison to the monthly time-series at Station ALOHA suggests that shifts in ecotype-level community structure require longer exposure to new conditions for favored ecotypes to accumulate, possibly due to relatively slow Prochlorococcus growth rates (Moore et al., 1998; Mann and Chisholm, 2000). Finally, shifts in abundance were not tied to shifts in community structure, but were the product of dilution of a Prochlorococcus-rich surface mixed layer with water entrained from less Prochlorococcus-rich waters of the stratified thermocline, and possibly the slowing of cell division rates with the decrease in surface temperature that accompanied the deepened mixed layer. These observations suggest that the success of Prochlorococcus globally is tied to the ability of the cells to respond to variability across a range of time-scales that match the time-scales of variability in the open ocean.
Conclusion
We have measured the relationship between Prochlorococcus community structure and chlorophyll physiology over a short-term destratification and restratification event in the NPSG. We found that shifts in Prochlorococcus abundance and single cell chlorophyll distributions over daily time scales were the product of photoacclimation (phenotype) rather than shifts in community structure (genotype). HL ecotypes were able to express chlorophyll at similar levels as LL ecotypes in order to photoacclimate to low light intensities, demonstrating a physiological plasticity that was unexpected based on previously published laboratory experiments. These results emphasize the importance of incorporating the process of photoacclimation into prediction of phytoplankton biomass from chlorophyll concentrations (Behrenfeld et al., 2016; Lange et al., 2018; Morozov and Tang, 2018), as we show that chlorophyll properties of the subtropical ocean’s dominant phototroph are highly dynamic in space and time.
Author Contributions
AT, GvdE, and DK came up with the design of sampling and experiments described in this paper. Data analysis was performed by AT, KK, SW, and STW. The manuscript was written by AT with contributions from all authors.
Funding
Funding was provided by the National Science Foundation OCE-1646709 to AT, OCE-1260164 to M. Church and DK, and DBI-0424599 to DK, the Gordon and Betty Moore Foundation (award #3794 to DK), and the Simons Foundation (award #329108 to E. DeLong and DK).
Conflict of Interest Statement
The authors declare that the research was conducted in the absence of any commercial or financial relationships that could be construed as a potential conflict of interest.
Acknowledgments
We thank the officers, crew, and scientists of the R/V Kilo Moana during cruise number KM1409 in March 2014.
Supplementary Material
The Supplementary Material for this article can be found online at: https://www.frontiersin.org/articles/10.3389/fmars.2018.00488/full#supplementary-material
Footnotes
References
Ahlgren, N. A., Rocap, G., and Chisholm, S. W. (2006). Measurement of Prochlorococcus ecotypes using real-time polymerase chain reaction reveals different abundances of genotypes with similar light physiologies. Environ. Microbiol. 8, 441–454. doi: 10.1111/j.1462-2920.2005.00910.x
Altschul, S. F., Gish, W., Miller, W., Myers, E. W., and Lipman, D. J. (1990). Basic local alignment search tool. J. Mol. Biol. 215, 403–410. doi: 10.1016/S0022-2836(05)80360-2
Behrenfeld, M. J., O’Malley, R. T., Boss, E. S., Westberry, T. K., Graff, J. R., Halsey, K. H., et al. (2016). Revaluating ocean warming impacts on global phytoplankton. Nat. Clim. Change 6, 323–330. doi: 10.1038/nclimate2838
Biller, S. J., Berube, P. M., Berta-Thompson, J. W., Kelly, L., Roggensack, S. E., Awad, L., et al. (2014). Genomes of diverse isolates of the marine cyanobacterium Prochlorococcus. Sci. Data 1:140034. doi: 10.1038/sdata.2014.34
Biller, S. J., Berube, P. M., Lindell, D., and Chisholm, S. W. (2015). Prochlorococcus: the structure and function of collective diversity. Nat. Rev. Microbiol. 13, 13–27. doi: 10.1038/nrmicro3378
Binder, B. J., Chisholm, S. W., Olson, R. J., Frankel, S. L., and Worden, A. Z. (1996). Dynamics of picophytoplankton, ultraphytoplankton and bacteria in the central equatorial Pacific. Deep-Sea Res. Part II Top. Stud. Oceanogr. 43, 907–931. doi: 10.1016/0967-0645(96)00023-9
Campbell, L., and Vaulot, D. (1993). Photosynthetic picoplankton community structure in the subtropical North Pacific Ocean near Hawaii (station ALOHA). Deep-Sea Res. Part I Oceanogr. Res. Pap. 40, 2043–2060. doi: 10.1016/0967-0637(93)90044-4
Caporaso, J. G., Kuczynski, J., Stombaugh, J., Bittinger, K., Bushman, F. D., and Costello, E. K. (2010). QIIME allows analysis of high-throughput community sequencing data. Nat. Methods 7, 335–336. doi: 10.1038/nmeth.f.303
Coe, A., Ghizzoni, J., LeGault, K., Biller, S., Roggensack, S. E., and Chisholm, S. W. (2016). Survival of Prochlorococcus in extended darkness. Limnol. Oceanogr. 61, 1375–1388. doi: 10.1002/lno.10302
Coleman, M. L., and Chisholm, S. W. (2007). Code and context?: Prochlorococcus as a model for cross-scale biology. Trends Microbiol. 15, 398–407. doi: 10.1016/j.tim.2007.07.001
Dore, J. E., and Karl, D. M. (1996). Nitrification in the euphotic zone as a source for nitrite, nitrate, and nitrous oxide at Station ALOHA. Limnol. Oceanogr. 41, 1619–1628. doi: 10.4319/lo.1996.41.8.1619
Dusenberry, J. A., Olson, R. J., and Chisholm, S. W. (1999). Frequency distributions of phytoplankton single-cell fluorescence and vertical mixing in the surface ocean. Limnol. Oceanogr. 44, 431–435. doi: 10.4319/lo.1999.44.2.0431
Dusenberry, J. A., Olson, R. J., and Chisholm, S. W. (2000). Field observations of oceanic mixed layer dynamics and picophytoplankton photoacclimation. J. Mar. Syst. 24, 221–232. doi: 10.1016/S0924-7963(99)00087-1
Dusenberry, J. A., Olson, R. J., and Chisholm, S. W. (2001). Photoacclimation kinetics of single-cell fluorescence in laboratory and field populations of Prochlorococcus. Deep-Sea Res. Part I Oceanogr. Res. Pap. 48, 1443–1458. doi: 10.1016/S0967-0637(00)00096-0
Ferrón, S., Wilson, S. T., Martínez-García, S., Quay, P. D., and Karl, D. M. (2015). Metabolic balance in the mixed layer of the oligotrophic North Pacific Ocean from diel changes in O2/Ar saturation ratios. Geophys. Res. Lett. 42, 3421–3430. doi: 10.1002/2015GL063555
Flombaum, P., Gallegos, J. L., Gordillo, R. A., Rincón, J., Zabala, L. L., Jiao, N., et al. (2013). Present and future global distributions of the marine cyanobacteria Prochlorococcus and Synechococcus. Proc. Natl. Acad. Sci. U.S.A. 110, 9824–9829. doi: 10.1073/pnas.1307701110
Follows, M. J., Dutkiewicz, S., Grant, S., and Chisholm, S. W. (2007). Emergent biogeography of microbial communities in a model ocean. Science 315, 1843–1846. doi: 10.1126/science.1138544
Hess, W. R., Rocap, G., Ting, C. S., Larimer, F., Stilwagen, S., Lamerdin, J., et al. (2001). The photosynthetic apparatus of Prochlorococcus: insights through comparative genomics. Photosynth. Res. 70, 53–71. doi: 10.1023/A:1013835924610
Johnson, Z. I., Zinser, E. R., Coe, A., McNulty, N. P., Woodward, E. M. S., and Chisholm, S. W. (2006). Niche partitioning among Prochlorococcus ecotypes along ocean-scale environmental gradients. Science 311, 1737–1740. doi: 10.1126/science.1118052
Karl, D. M., and Lukas, R. (1996). The Hawaii Ocean Time-series (HOT) program: background, rationale and field implementation. Deep-Sea Res. Part II Top. Stud. Oceanogr. 43, 129–156. doi: 10.1016/0967-0645(96)00005-7
Kashtan, N., Roggensack, S. E., Rodrigue, S., Thompson, J. W., Biller, S. J., Coe, A., et al. (2014). Single-cell genomics reveals hundreds of coexisting subpopulations in wild Prochlorococcus. Science 344, 416–420. doi: 10.1126/science.1248575
Kettler, G. C., Martiny, A. C., Huang, K., Zucker, J., Coleman, M. L., Rodrigue, S., et al. (2007). Patterns and implications of gene gain and loss in the evolution of Prochlorococcus. PLoS Genetics 3:e231. doi: 10.1371/journal.pgen.0030231
Lange, P. K., Brewin, R. J. W., Dall’Olmo, G., Tarran, G. A., Sathyendranath, S., Zubkov, M., et al. (2018). Scratching beneath the surface: a model to predict the vertical distribution of Prochlorococcus using remote sensing. Remote Sens. 10:847.
Larkin, A. A., Blinebry, S. K., Howes, C., Lin, Y., Loftus, S. E., Schmaus, C. A., et al. (2016). Niche partitioning and biogeography of high light adapted Prochlorococcus across taxonomic ranks in the North Pacific. ISME J. 10, 1555–1567. doi: 10.1038/ismej.2015.244
Lavin, P., Gomez, P., Gonzalez, B., and Ulloa, O. (2008). Diversity of the marine cyanobacteria Prochlorococcus and Synechococcus assessed by terminal restriction fragment length polymorphisms of 16S-23S rRNA internal transcribed spacer sequences. Rev. Chil. Hist. Nat. 81, 515–531.
Malmstrom, R. R., Coe, A., Kettler, G. C., Martiny, A. C., Frias-Lopez, J., Zinser, E. R., et al. (2010). Temporal dynamics of Prochlorococcus ecotypes in the Atlantic and Pacific oceans. ISME J. 4, 1252–1264. doi: 10.1038/ismej.2010.60
Malmstrom, R. R., Rodrigue, S., Huang, K. H., Kelly, L., Kern, S. E., Thompson, A., et al. (2013). Ecology of uncultured Prochlorococcus clades revealed through single-cell genomics and biogeographic analysis. ISME J. 7, 184–198. doi: 10.1038/ismej.2012.89
Mann, E. L., and Chisholm, S. W. (2000). Iron limits the cell division rate of Prochlorococcus in the eastern equatorial Pacific. Limnol. Oceanogr. 45, 1067–1076. doi: 10.4319/lo.2000.45.5.1067
Martiny, A. C., Coleman, M. L., and Chisholm, S. W. (2006). Phosphate acquisition genes in Prochlorococcus ecotypes: evidence for genome-wide adaptation. Proc. Natl. Acad. Sci. U.S.A. 103, 12552–12557. doi: 10.1073/pnas.0601301103
Moore, L. R., and Chisholm, S. W. (1999). Photophysiology of the marine cyanobacterium Prochlorococcus: ecotypic differences among cultured isolates. Limnol. Oceanogr. 44, 628–638. doi: 10.4319/lo.1999.44.3.0628
Moore, L. R., Rocap, G., and Chisholm, S. W. (1998). Physiology and molecular phylogeny of coexisting Prochlorococcus ecotypes. Nature 393, 464–467. doi: 10.1038/30965
Morozov, E., and Tang, D. (2018). Satellite ocean colour algorithm for Prochlorococcus, Synechococcus, and picoeukaryotes concentration retrieval in the South China Sea. Adv. Space Res. (in press). doi: 10.1016/j.asr.2018.07.005
Parada, A. E., Needham, D. M., and Fuhrman, J. A. (2016). Every base matters: assessing small subunit rRNA primers for marine microbiomes with mock communities, time series and global field samples. Environ. Microbiol. 18, 1403–1414. doi: 10.1111/1462-2920.13023
Ribalet, F., Swalwell, J., Clayton, S., Jimenez, V., Sudek, S., Lin, Y., et al. (2015). Light-driven synchrony of Proclorococcus growth and mortality in the subtropical Pacific gyre. Proc. Natl. Acad. Sci. U.S.A. 112, 8008–8012. doi: 10.1073/pnas.1424279112
Robidart, J. C., Church, M. J., Ryan, J. P., Ascani, F., Wilson, S. T., Bombar, D., et al. (2014). Ecogenomic sensor reveals controls on N2-fixing microorganisms in the North Pacific Ocean. Int. Soc. Microb. Ecol. 8, 1175–1185. doi: 10.1038/ismej.2013.244
Rocap, G., Distel, D., Waterbury, J. B., and Chisholm, S. W. (2002). Resolution of Prochlorococcus and Synechococcus ecotypes by using 16S-23S ribosomal internal transcribed spacer sequences. Appl. Environ. Microbiol. 68, 1180–1191.
Rocap, G., Larimer, F. W., Lamerdin, J., Malfatti, S., Chain, P., Ahlgren, N. A., et al. (2003). Genome divergence in two Prochlorococcus ecotypes reflects oceanic niche differentiation. Nature 424, 1042–1047. doi: 10.1038/nature01947
Rodrigue, S., Malmstrom, R. R., Berlin, A. M., Birren, B. W., Henn, M. R., and Chisholm, S. W. (2009). Whole genome amplification and de novo assembly of single bacterial cells. PLoS One 4:e6864. doi: 10.1371/journal.pone.0006864
Sher, D., Thompson, J. W., Kashtan, N., Croal, L., and Chisholm, S. W. (2011). Response of Prochlorococcus ecotypes to co-culture with diverse marine bacteria. ISME J. 5, 1125–1132. doi: 10.1038/ismej.2011.1
Steglich, C., Lindell, D., Futschik, M., Rector, T., Steen, R., and Chisholm, S. W. (2010). Short RNA half-lives in the slow-growing marine cyanobacterium Prochlorococcus. Genome Biol. 11:R54. doi: 10.1186/gb-2010-11-5-r54
Sullivan, M. B., Waterbury, J. B., and Chisholm, S. W. (2003). Cyanophages infecting the oceanic cyanobacterium Prochlorococcus. Nature 424, 1047–1051. doi: 10.1038/nature01929
van den Engh, G. J., Doggett, J. K., Thompson, A. W., Doblin, M. A., Gimpel, C. N. G., and Karl, D. M. (2017). Dynamics of Prochlorococcus and Synechococcus at station aloha revealed through flow cytometry and high-resolution vertical sampling. Front. Mar. Sci. 4:359. doi: 10.3389/fmars.2017.00359
West, N. J., and Scanlan, D. J. (1999). Niche-partitioning of Prochlorococcus populations in a stratified water column in the Eastern North Atlantic Ocean. Appl. Environ. Microbiol. 65, 2585–2591.
Zinser, E. R., Coe, A., Johnson, Z. I., Martiny, A. C., Fuller, N. J., Scanlan, D. J., et al. (2006). Prochlorococcus ecotype abundances in the North Atlantic Ocean as revealed by an improved quantitative PCR method. Appl. Environ. Microbiol. 72, 723–732. doi: 10.1128/AEM.72.1.723-732.2006
Keywords: microbial oceanography, cyanobacteria, chlorophyll, photoacclimation, Prochlorococcus
Citation: Thompson AW, van den Engh G, Ahlgren NA, Kouba K, Ward S, Wilson ST and Karl DM (2018) Dynamics of Prochlorococcus Diversity and Photoacclimation During Short-Term Shifts in Water Column Stratification at Station ALOHA. Front. Mar. Sci. 5:488. doi: 10.3389/fmars.2018.00488
Received: 28 August 2018; Accepted: 30 November 2018;
Published: 21 December 2018.
Edited by:
Qinglu Zeng, Hong Kong University of Science and Technology, Hong KongReviewed by:
Daniel Jonathan Sher, University of Haifa, IsraelSijun Huang, South China Sea Institute of Oceanology (CAS), China
Copyright © 2018 Thompson, van den Engh, Ahlgren, Kouba, Ward, Wilson and Karl. This is an open-access article distributed under the terms of the Creative Commons Attribution License (CC BY). The use, distribution or reproduction in other forums is permitted, provided the original author(s) and the copyright owner(s) are credited and that the original publication in this journal is cited, in accordance with accepted academic practice. No use, distribution or reproduction is permitted which does not comply with these terms.
*Correspondence: Anne W. Thompson, YXd0QHBkeC5lZHU=