 Susana Agusti
 Luis M. Lubián3†
 Marta Estrada
 Carlos M. Duarte
- 1Red Sea Research Center, King Abdullah University of Science and Technology, Thuwal, Saudi Arabia
- 2Department of Global Change Research, IMEDEA, Instituto Mediterráneo de Estudios Avanzados (CSIC-UIB), Esporles, Spain
- 3Instituto de Ciencias Marinas de Andalucía (CSIC), Campus Universitario Río San Pedro, Puerto Real, Spain
- 4Marine Ecology and Limnology Research Group, Department of Ecology and Geology, University of Málaga, Málaga, Spain
- 5Department of Marine Biology and Oceanography, Instituto de Ciencias del Mar (CSIC), Barcelona, Spain
The oligotrophic subtropical gyres are the largest biome on Earth, where picoplankton constitute the dominant autotrophs. The trend for autotrophic picoplankton to increase with sea temperature has led to predictions that picophytoplankton abundance will increase with warming. Here we conducted a global survey in the open subtropical-tropical ocean to resolve the functional relationships between picophytoplankton abundance and oceanic properties (water temperature, chlorophyll a concentration, nutrient concentrations, and underwater visible and ultraviolet B radiation). We then used these relationships to build models projecting the future changes of Synechococcus, Prochlorococcus, and eukaryotic picoautotrophs populations in the subtropical gyres with warming. Our goal is to refine the forecasts for this large biome and implement the analysis by including the picoeukaryotes, absent in previous models, but a relevant component of picophytoplankton. The data obtained and the relationships found in our global survey of the subtropical-tropical ocean between picophytoplankton abundance and ocean properties differed from previous global studies including colder (temperate, subpolar, and polar) and coastal waters. These differences included a lower abundance of Synechococcus populations, significant negative relationships between Prochlorococcus abundance and nutrient concentrations, and positive relationships for picoeukaryotes and no relationship for Synechococcus abundance, and, a moderate response to temperature in the warm waters of the tropical-subtropical open ocean. A model based on temperature increase alone forecasts a general increase in picoautotrophs by year 2100, although minimal for picoeukaryotes, and much more moderate for Synechococcus than previously forecasted. However, a global change model linking the thermal increase with the associated decline in chlorophyll a, and increased underwater solar radiation penetration, projected a decline in the abundance of autotrophic picoplankton. The decline was larger at the surface layer and partially compensated by the increased importance of deep picophytoplankton blooms, especially those of Prochlorococcus. The global change model predicted an increased dominance of Prochlorococcus sp. in the subtropical-tropical ocean with future warming. Our results, based on current patterns of picophytoplankton distribution, help improve existing projections by considering feedbacks affecting picophytoplankton abundance in the future subtropical and tropical ocean, the larger biome on Earth.
In memoriam of Prof. Luis M. Lubián, an outstanding researcher and friend.
Introduction
Autotrophic picoplankton are globally significant, delivering about half of the ocean primary production and 1/4 of all primary production in the biosphere. Autotrophic picoplankton, consisting of cyanobacteria (Synechococcus and Prochlorococcus) and eukaryotic cells < 2 μm in cell diameter (Raven, 1998), are the dominant contributors to photosynthetic production in warm and oligotrophic regions of the ocean (Agawin et al., 2000). Autotrophic picoplankton inhabit the subtropical and tropical ocean, which represents over 70% of the ocean surface. Understanding the drivers of the abundance of autotrophic picoplankton is, therefore, relevant to help predict changes in its dynamics as a result of global change affecting the ocean ecosystem, such as ocean warming.
Current trends of change in the oligotrophic ocean with ongoing climate change include warming and the increase of water column stratification, conducive to oligotrophication (Gregg and Conkright, 2002; Antoine et al., 2005; Behrenfeld et al., 2006; Boyce et al., 2010). In particular, the oligotrophic ocean has warmed by about 0.3°C over the past 50 years (Burrows et al., 2011) and there is evidence that the oligotrophic gyres of the ocean are expanding in size (Polovina et al., 2008) while undergoing further oligotrophication, reflected in a reported 1% decline in chlorophyll a concentration, a proxy of phytoplankton community biomass, per year (Boyce et al., 2010), as these changes compound the effects of climate change with those of ocean oscillations (Boyce et al., 2010; Mackas, 2011; Rykaczewski and Dunne, 2011). Decreased productivity based on time series of satellite-derived net primary production (NPP) in the subtropical gyres was also recently shown by Signorini et al. (2015). NPP showed downward trends for all the gyres in the last 16 years, while all 5 gyres exhibited positive trends in sea surface temperature and sea-level anomaly (Signorini et al., 2015).
Past research showed the contribution of autotrophic picoplankton to increase with increasing temperature, predicting that the abundance of autotrophic picoplankton should increase with ocean warming along the twenty-first century (Agawin et al., 2000; Morán et al., 2010; Flombaum et al., 2013). Specifically, a recent review, based on an impressive compilation of data on the abundance of picocyanobacteria, reported robust positive global relationships between temperature and the abundance of picocyanobacteria in the ocean (Flombaum et al., 2013). On the basis of these relationships, Flombaum et al. (2013) predicted an increase in the abundance of autotrophic picoplankton between 14 and 29% with warming by year 2100, leading to the conclusion that oceanic microbial communities will experience complex changes as a result of projected future climate conditions which may have large impacts on ocean ecosystems and biogeochemical cycles.
As autotrophic picoplankton is the dominant component of phytoplankton biomass (most often estimated as chlorophyll a concentration) and productivity in the oligotrophic ocean, the current and forecasted trend for a decline in chlorophyll a concentration with warming is at odds with the prediction that the abundance of autotrophic picoplankton will increase. Indeed, future scenarios of the ocean requires a global change framework that explicitly considers the cascade of effects, and feed-back responses, affecting the response of biota to warming (Duarte, 2015), which involves changes in many relevant ocean processes in addition to the direct thermal effect on the organisms themselves.
Independent analysis concurred in demonstrating a positive relationship between increased temperature and autotrophic picoplankton abundance (Agawin et al., 2000; Morán et al., 2010; Flombaum et al., 2013). However, Agawin et al. (2000) base their conclusion on an analysis of the relative abundance of picoplankton. The analysis by Agawin et al. (2000), therefore, suggests that if warming leads to oligotrophication, as supported by available evidence (Roemmich and McGowan, 1995; Sarmiento et al., 1998; Signorini et al., 2015), then the relative abundance of autotrophic picoplankton may increase, but their total abundance should decline with warming. Marañón et al. (2013) based on allometric relationships of phytoplankton growth and nutrient uptake rate with cell size, pointed that biogeographic patterns in phytoplankton size structure and growth rate are independent of temperature and driven mainly by changes in resource supply. Nutrient supply in the oligotrophic ocean is predicted to decline in a strongly stratified warmer subtropical ocean (Sarmiento et al., 1998, 2004) so recent models based on increased thermal stratification in the oligotrophic ocean predicted a decrease in marine productivity (Steinacher et al., 2010; Bopp et al., 2013), total biomass, mean cell size, and functional diversity (Acevedo-Trejos et al., 2014; Chust et al., 2014). Moreover, the oligotrophication associated with warming is associated with increased water transparency (Boyce et al., 2010) and, thus, increased penetration of UV-B radiation in the clear waters of the oligotrophic ocean, to which autotrophic picoplankton are highly vulnerable (Llabrés and Agusti, 2006; Agustí and Llabrés, 2007), suggesting that oligotrophication may lead to enhanced mortality of autotrophic picoplankton at the subsurface layer of the subtropical ocean and a positive feedback conducive to further reduction of biomass and oligotrophication at the surface layer.
Here we extend the analysis of drivers of change in the abundance of autotrophic picoplankton in a warming ocean to include the effects derived from the changes in phytoplankton biomass, as described by chlorophyll a concentration, PAR and UV-B radiation, with warming. We also extend the analysis to include eukaryotic picoautotrophs, which are also important components of the autotrophic picoplankton community (Raven, 1998; Moon-van der Staay et al., 2001), but were not included in the previous global analysis (Flombaum et al., 2013). Chlorophyll a concentration is widely adopted as a proxy for community biomass of autotrophic plankton (Claustre, 1994), while also providing insights into the local taxonomic composition of the algal assemblage (Agawin et al., 2000; Uitz et al., 2006). In particular, the proportion of picophytoplankton in plankton communities has been reported to decrease with increasing chlorophyll a concentration (Agawin et al., 2000), which also affects the structure of heterotrophic components of plankton communities (Gasol et al., 1997; Irigoien et al., 2014). The interest in chlorophyll a to represent autotrophic biomass was further enhanced by the capacity to retrieve this property from space and, along with temperature and irradiance, predict oceanic primary production (Morel and Berthon, 1989; Campbell et al., 2002).
In this study we aim to analyze the drivers of variability of picoplankton abundance across the subtropical and tropical ocean based on a coherent assessment of autotrophic picoplankton abundance along the global subtropical and tropical ocean derived from the Malaspina 2010 Circumnavigation Expedition (Duarte, 2015). We identify the response of autotrophic picoplankton abundance, characterized by picoeukaryotes and picocyanobacteria populations, to concurrent drivers possibly acting in opposite directions, such as oligotrophication and warming, in a future, warmer subtropical ocean (Figure 1; Tyrrell, 2011; Duarte, 2015). We then use the relationships established to develop a model forecasting the response of autotrophic picoplankton abundance to future warming and oligotrophication, including the feedback between decreased chlorophyll a and increased PAR and UV-B radiation at depth. We then analyze how these drivers may influence the vertical distribution of picophytoplankton in the future subtropical and tropical ocean.
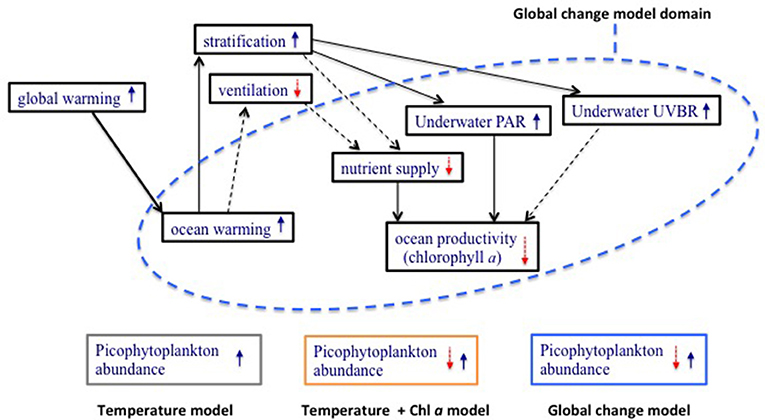
Figure 1. A conceptual model, modified after Tyrrell (2011), of the effect of ocean warming on key ocean properties affecting primary producers (blue text inside black boxes). Solid arrows indicate a positive influence and an increase in the value of the property, and broken arrows indicate a negative influence and a decrease in the property. Upward blue and downward red arrows within a box indicate an increase and a decrease in the property, respectively. The diagram identifies the processes considered by a model based on the direct thermal effects on the organisms (gray box), those included in a model considering increased temperature and changes in productivity due to oligotrophication with ocean warming (yellow box), and a global-change model considering multiple relevant processes and interactions affected by warming (blue box). The presence of both upward and downward arrows within a box indicates that the responses involve positive and negative effects due to complex interactions that render predictions cumbersome.
Methods
Picophytoplankton in the Subtropical and Tropical Ocean and Environmental Variables
A total of 142 stations were sampled during the Malaspina-2010 Expedition (Cózar et al., 2014; Irigoien et al., 2014; Duarte, 2015) on board the R/V BIO Hespérides along the Atlantic, Indian and Pacific Oceans (Figure 2). The ocean circumnavigation started on 15 December 2010 in Cádiz (Spain) and finished on 15 July 2011 in Cartagena (Spain) (Figure 2). The expedition left Spain sailing south along the Atlantic Ocean to enter the Indian Ocean to enter the Pacific Ocean through the Bass Straight (Australia), and returning to the Northern Hemisphere in May, 2011, crossing the Pacific to enter the Atlantic Ocean through the Panama Canal, sailing across the Atlantic to return to Spain. The expedition sampled mostly the subtropical, oligotrophic ocean (Figure 2), with the sequence of the survey leading to sampling mostly during spring and summer. Water column samples from generally 10 depths in most stations, including surface to a maximum of 200 m, were sampled using 12 L Niskin bottles attached to a Rosette-CTD system. Surface (3 m) waters were collected using 30 L Niskin bottles. The criteria used to select the depths of sampling in the water column along the whole expedition was based on real time profiles of fluorescence (CTD) and underwater Photosynthetically active radiation (PAR) recorder by a 4π sensor installed in the Rossette (Licor co.). The depths selected in the expedition included surface (3m), 10 m, and the depths receiving the 50% of PAR at the surface, the 20% of PAR, an intermediate depth between the depths receiving the 20% and 7%PAR, the depth of the 7%PAR, an intermediate depth between the depth of the 7% PAR and the depth of the deep fluorescence maximum (DFM), the depth of the DFM and two depths below, including DFM + 10 meters and DFM + 20 meters, representing a depth range between 3 and 180 m.
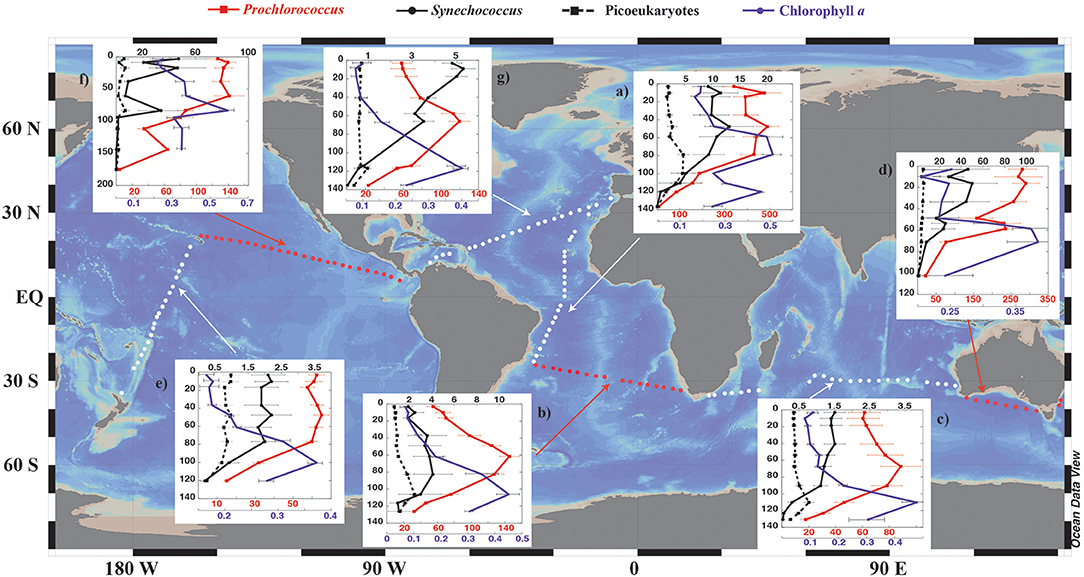
Figure 2. Each panel represents the vertical distribution of autotrophic picoplankton abundances averaged for cruise sections and sampling depth (mean ± SE, × 103 cell ml−1) across sampling stations for the different cruise legs during the Malaspina-2010 expedition: (a,b,g) legs 1, 2, and 7, Atlantic Ocean; (c) leg 3, Indian Ocean; (d) leg 4, South Australian Bight; (e) leg 5 and (f) leg 6, Pacific Ocean. The different stations sampled are traced with white and red circles along the map. White and red arrows indicate the set of stations (sections) at which each panel is referring for. Prochlorococcus (red lines and squares), Synechococcus (continuous black lines and circles), and picoeukaryotes (dashed black lines and squares). Chlorophyll a vertical distribution for each sampling leg and depth (mean ± SE, μg l−1, purple lines and circles) is also shown in each panel. The purple and red colors of the X axis correspond to the chlorophyll a and picophytoplankton values, respectively.
Picophytoplankton abundance and identification of Prochlorococcus, Synechococcus, and picoeukaryotes was determined on board in fresh samples by flow cytometry. An aliquot of a calibrated solution of 1μm diameter fluorescent spheres (Polysciences) was added to 1 ml replicated samples, as an internal standard for the quantification of cell concentration (Lubián, 2012). Red (FL3, bandpass filter >670 nm), green (FL1, bandpass filter 530 nm) and orange (FL2, bandpass filter 585 nm) fluorescence as well as the forward and side scattering signals of the cells and beads were used to detect picoplanktonic populations of Synechococcus, Prochlorococcus, and eukaryotes (Marie et al., 2005). Parallel to picophytoplankton analysis, nutrients and chlorophyll a concentration, used as a proxy of phytoplankton biomass, were determined at the same sampling depths. Chlorophyll a concentration was extracted in 90% acetone and determined fluorimetrically (Yentsch and Menzel, 1963; Estrada, 2012). Nutrients were analyzed using standard autoanalyzer techniques (Hansen and Koroleff, 1999; Vidal and Teixidor, 2012).
Underwater PAR and ultraviolet B (UVB) radiation were measured in each station using a PRR-800 Underwater Profiling Radiometer (Biospherical Instruments). The radiometer measured radiation at the wavelengths: 305, 313, 320, 345, 380, 395, 412, 443, 465, 490, 510, 555, 670, 694, 710 nm and also has a PAR sensor, from which PAR data were obtained. However, PAR data obtained from CTD casts was used in those cases in which no data was registered with the radiometer. Percentages of PAR and UVB (at 305 nm), relative to the irradiance values at the surface, were calculated at each depth from the downwelling extinction coefficients (Kd), obtained previously from the linear regression between natural log transformed radiation measurements vs. depth. These percentages were calculated for all the sampling depths, also for the deepest ones, to allow them to be included in the general analysis.
Models to Project Autotrophic Picoplankton in the Future Subtropical and Tropical Ocean
Projections of the future abundance of picoautotrophic organisms were built on the basis of general linear regression models (GLM) fitted to the data obtained during the survey, including main effects and interactions among the key drivers tested. Plots of response residuals vs. predicted response values and plots of response effects by individual predictor variables were inspected for departures from the assumptions of GLM, and response variables and predictor values transformed when needed to meet the assumptions of GLM. Specifically, response variables (picophytoplankton cell abundance) were log10 transformed due to their long-tail distribution, temperature was transformed as the inverse of temperature and chlorophyll a concentration, PAR (%) and UVB (%) were log10 transformed due to their long-tail distribution. In addition to contribute to meet the assumptions of the analysis, the inverse temperature reflects the functional relationship between temperature and processes embedded in the Arrhenius equation, which has been shown to apply to describe the responses of planktonic processes to temperature (Regaudie-de-Gioux and Duarte, 2012).
The warming scenarios explored involving 1, 2, and 3°C warming by year 2100 compared to the year 2010, represent the ranges encompassed by the RCP2.6, RCP4.5, and RCP6.0 scenarios in the IPCC AR5 report also corresponding to projected surface ocean warming (Gattuso et al., 2015), and assumed similar linear warming rates (0.01, 0.02, and 0.03°C yr−1, respectively). Moreover, the COP21 Conference reached a global commitment to keeping global warming below 2°C, so we used this single temperature in some projections as indicated below. We explored the responses to three scenarios, of increasing complexity of ocean change: (1) a simple scenario considering warming only as the temperature increase of the ocean mixed layer by 1, 2, or 3°C by 2100; (2) a scenario of oligotrophication with warming proceeding at the log-linear rate of chlorophyll a decline with temperature change reported for the subtropical and tropical ocean by Boyce et al. (2010); and (3) a scenario where oligotrophication with warming also results in increased %PAR and %UV-B with depth.
Projections based on temperature increase alone were based on a model predicting picoautotrophic abundance from a quadratic polynomial regression using temperature (°C), to follow the model used by Flombaum et al. (2013). Forecasts were generated using the equations obtained with temperature increasing linearly from the mean temperature in the survey (22.61°C) to 1, 2, and 3°C warmer by the end of the century. The warming rates encompass the range of mixed-layer ocean warming expected under various scenarios of warming (from 0.71°C for RCP2.6 to 2.73°C for RCP8.5, Gattuso et al., 2015).
The model considering warming and oligotrophication (increasing water temperature and decreased chlorophyll a concentration, Figure 1), was based on the additive regression equations, where %PAR was held constant at the average value obtained in the survey of 8.3% of the surface irradiance; temperature increased over time as in the previous model (to 1, 2, and 3°C warmer by the end of the century) and chlorophyll a concentration declined with temperature at a log-linear rate of −0.126 ± 0.013 μg Chla l−1 °C−1 reported for the subtropical and tropical ocean by Boyce et al. (2010). The forecasts derived considering warming, nutrients and oligotrophication and its consequences on PAR and UV-B (305 nm) penetration (global model Figure 1) were derived using the equations considering these main factors and their interactions. Only two-factor interactions were significant.
Models projecting the changes on picoautotrophic abundance with depth were derived using the equations obtained to predict abundance at the year 2100 with the initial abundance set to the average values derived over 10 m depth bins calculated from the vertical profiles obtained in the survey. Where predicted initial values deviated somewhat from the average values observed, the intercept of the fitted regression equations was modified to adjust the observed mean initial values. These corrections were always small (< 10% of the intercept). Depth itself was not included in these models as a predictor because it correlates strongly with many of the predictor variables expected to change with ocean warming, such as temperature, %PAR and %UVR. Whereas, depth may have some effects independent of those, such as turbulence and pressure, depth does not change with ocean warming or indirectly with changes in phytoplankton biomass or ocean productivity, so it is a fixed term that does not affect future changes. Hence, providing the risk of strong collinearity we opted to leave depth out of the models to predict future scenarios.
Percent biomass of the components of picophytoplankton community was calculated as the biovolume of Prochlorococcus, Synechococcus, and picoeukaryotes, relative to the total picoplankton biovolume. Percentages of biomass were calculated from present and forecasted averaged abundance populations in the Atlantic, Indian and Pacific Oceans. Cell volume was calculated assuming cell diameters of 0.6, 0.9 and 1.4 μm for Prochlorococcus, Synechococcus, and picoeukaryotes, respectively (Raven, 1998). Forecasts of percent biomass were based on an increase of 2°C scenario.
All statistical analyses were run using JMP Pro v. 13.1 statistical analysis software for OSX. Polynomial regression was fitted using centered polynomial regression, where quadratic and higher order terms are applied to the centered [x – mean(x)] predictor variable, to avoid miss-fitting the model if this is non-linear (Hastie, 2017).
Results
Picophytoplankton Abundance in the Tropical and Subtropical Ocean and Drivers of Variability
The global sampling performed across the tropical and subtropical oceans (Figure 2), showed a subsurface deep-chlorophyll maximum at an average depth of 100 ± 2.7 m across the survey, typically corresponding to the depth receiving 1% of PAR. Prochlorococcus (mean ± SE, 126.6 ± 4.4 × 10³ cells ml−1) was the dominant component of the autotrophic picoplankton community, followed by Synechococcus (7.7 ± 0.8 × 10³ cells ml−1) and eukaryotic cells (1.7 ± 0.12 × 10³ cells ml−1, Table 1). The abundance of autotrophic picoplankton varied greatly along the circumnavigation, with Prochlorococcus abundance fluctuating 1,000-fold (with a range of 0.82 × 10³ cells ml−1 in the Indian Ocean to 1,422 × 103 cells ml−1 in the Equatorial Atlantic), that of Synechococcus sp. oscillating 10,000-fold (with a range of 0.025 × 10³ cells ml−1 in the Indian Ocean to 485 × 103 cells ml−1 in the NE Pacific) and that of eukaryotes varying 1,000-fold (from 0.041 × 10³ cells ml−1 in the Indian Ocean to 79.3 × 10³ cells ml−1 in the NE Pacific, Table 1). In general, the abundance of autotrophic picoplankton declined from surface waters to the bottom of the euphotic layer (Figure 2), but intermediate peaks, at the depth of the deep chlorophyll maximum were typically observed (Figure 2). Lower abundance values near the surface with respect to deeper layers were also observed in some of the profiles (i.e., Prochlorococcus in the Atlantic and Indian Oceans, Figure 2), consistent with the reported role of UV-B radiation, which can be intense near the surface, as a stressor for autotrophic picoplankton in oligotrophic ocean waters (Figure 1).
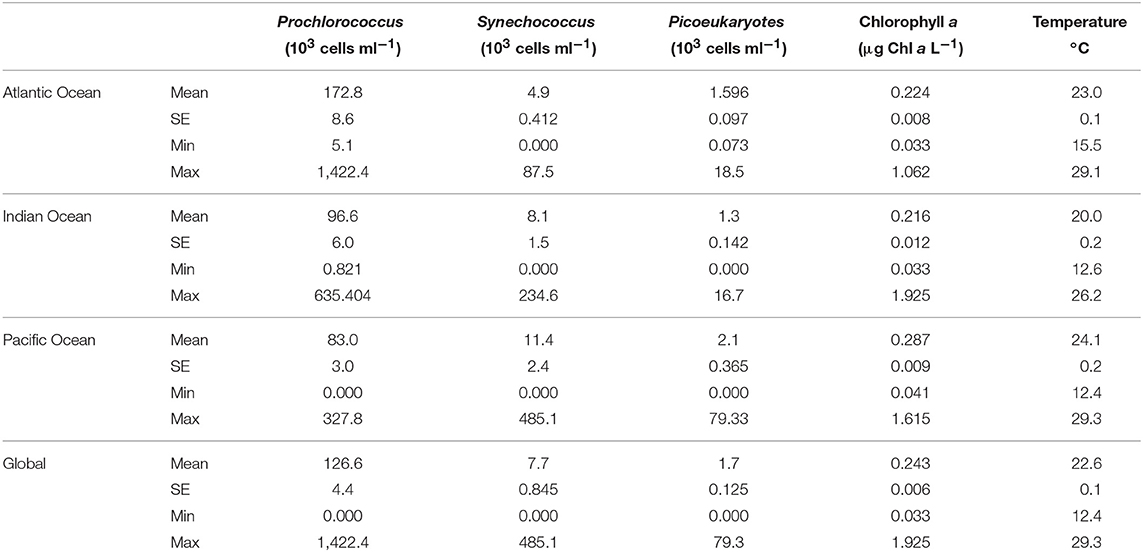
Table 1. Global and per ocean basin mean abundance values of the three groups of pico-phytoplankton: Prochlorococcus (N = 1259), Synechococcus (N = 1077), and eukaryotic picoplankton (N = 1237).
The abundance of picocyanobacteria showed a weak but statistically significant trend to increase with chlorophyll a concentration, and a stronger tendency to increase with temperature and percent PAR (Figure 3). The abundance of eukaryotic picoplankton increased strongly with increasing chlorophyll a concentration but increased weakly with temperature and percent irradiance (Figure 3; Table 2). However, temperature, PAR and chlorophyll a concentration are not independent, as both temperature and PAR decline with depth while chlorophyll a concentration tends to increase with depth to the deep chlorophyll maximum (Figure 2). Moreover, the abundance of picocyanobacteria increased with increasing percent PAR until PAR reached >10% surface irradiance but showed a tendency for a slight decline at PAR levels >30% surface irradiance (Figure 3; Table 2), consistent with the negative effect of high solar radiation, including UV-B radiation, on autotrophic picoplankton. Major differences were found in the relationships of the picophytoplankton groups with nutrient concentrations. Prochlorococcus showed a highly significant negative relationship with increasing nitrate and phosphate concentrations (Figure 4; Table 2), while picoeukaryotes abundance was positive and significantly related to both nitrate and phosphate concentrations (Figure 4; Table 2). The cell abundance of Synechococcus was, in contrast, independent (P > 0.05) of either nitrate or phosphate concentrations.
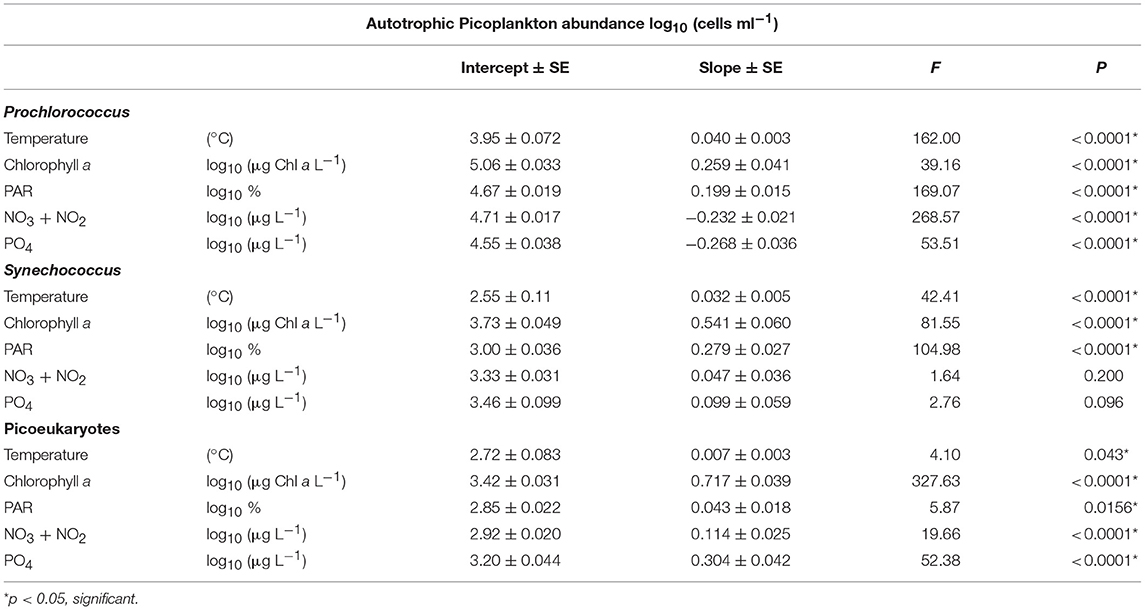
Table 2. Summary of the parameters and statistics for the linear relationships between autotrophic picophytoplankton abundance and water properties in the Subtropical and Tropical Ocean.
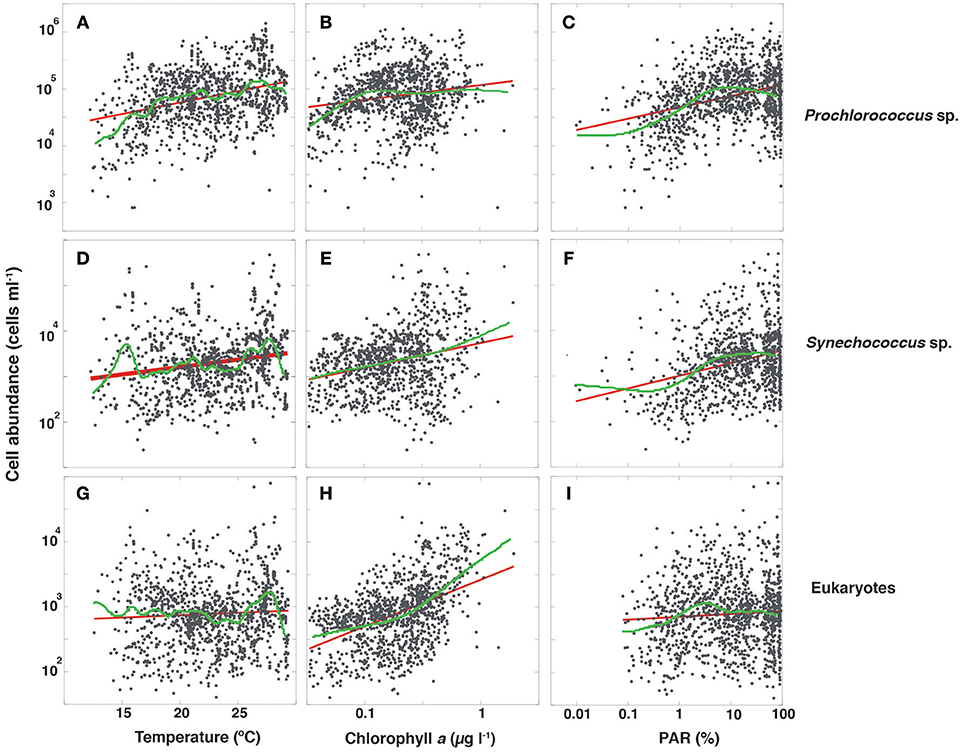
Figure 3. The relationships between log10 picophytoplankton abundance and temperature, log10 chlorophyll a, and log10 %PAR data compiled along the Malaspina-2010 Expedition. All oceans and sampling depths are included. Each panel contains the fitted linear (red line) and smoothing spline fit (lambda = 1, green line). The smoothing spline fit was not used in the models for projections. (A) Prochlorococcus abundance vs. temperature (Linear fit, R2 = 0.111, P < 0.0001; Smoothing spline fit, R2 = 0.172). (B) Prochlorococcus relationship with chlorophyll a (Linear fit, R2 = 0.033, P < 0.0001; Smoothing spline fit, R2 = 0.097). (C) Prochlorococcus relationship with PAR (%) (Linear fit, R2 = 0.119, P < 0.0001; Smoothing spline fit, R2 = 0.200). (D) Synechococcus abundance relationship with temperature (Linear fit, R2 = 0.038, P < 0.0001; Smoothing spline fit, R2 = 0.141). (E) Synechococcus relationship with chlorophyll a (Linear fit, R2 = 0.075, P < 0.0001; Smoothing spline fit, R2 = 0.080). (F) Synechococcus relationship with PAR (%) (Linear fit, R2 = 0.089, P < 0.0001; Smoothing spline fit, R2 = 0.119). (G) picoeukaryotes abundance relationship with temperature (Linear fit, R2 = 0.003, P < 0.0429; Smoothing spline fit, R2 = 0.091). (H) picoeukaryotes relationship with chlorophyll a (Linear fit, R2 = 0.225, P < 0.0001; Smoothing spline fit, R2 = 0.262). (I) picoeukaryotes relationship with PAR (%) (Linear fit, R2 = 0.089, P < 0.0156; Smoothing spline fit, R2 = 0.005).
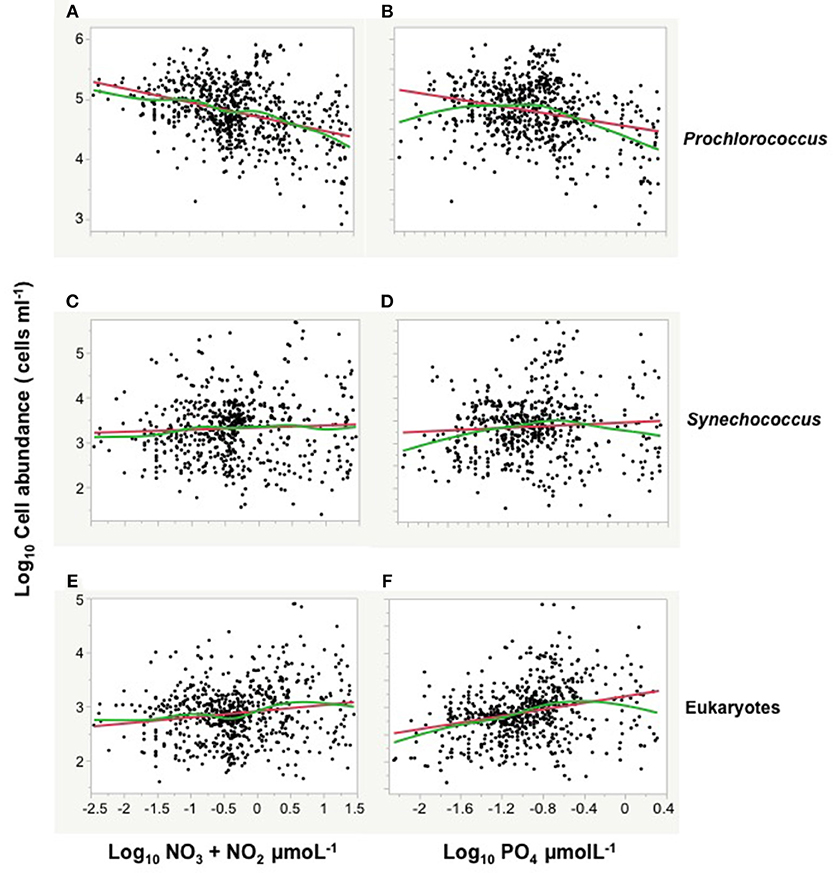
Figure 4. The relationships between log picophytoplankton abundance and log NO3 + NO2, and log PO4 concentrations during the Malaspina expedition. All oceans and sampling depths are included. Each panel contains the fitted linear (red line) and smoothing spline (lambda = 1, green line) relationships. The smoothing spline fit was not used in the models for projections. (A) Prochlorococcus abundance vs. log NO3 + NO2 (Linear fit, R2 = 0.14, P < 0.0001; Smoothing spline fit, R2 = 0.172). (B) Prochlorococcus relationship with PO4 (Linear fit, R2 = 0.14, P < 0.0001; Smoothing spline fit, R2 = 0.14). (C) Synechococcus abundance vs. NO3 + NO2 (Linear fit, R2 = 0.002, P = 0.20; Smoothing spline fit, R2 = 0.01). (D) Synechococcus relationship with PO4 (Linear fit, R2 = 0.005, P = 0.096; Smoothing spline fit, R2 = 0.03). (E) picoeukaryotes abundance vs. NO3 + NO2 (Linear fit, R2 = 0.02, P < 0.0001; Smoothing spline fit, R2 = 0.172). (F) eukaryotes abundance relationship with PO4 (Linear fit, R2 = 0.075, P < 0.0001; Smoothing spline fit, R2 = 0.11).
Nutrient concentrations indeed were negatively related to water temperature as both nitrate and phosphate significantly decreased with increasing temperature (Figure 5). Nutrient concentrations were also inversely related with light penetration, as both nitrate and phosphate concentrations showed strong and significant negative relationships with the % of PAR at depth (Figure 5). Hence, simple relationships between the abundance of autotrophic picoplankton and nutrients, chlorophyll a concentration, temperature, or water transparency (%PAR) may not reveal the complex interactions between these and other potential drivers, such as the penetration of UV-B radiation.
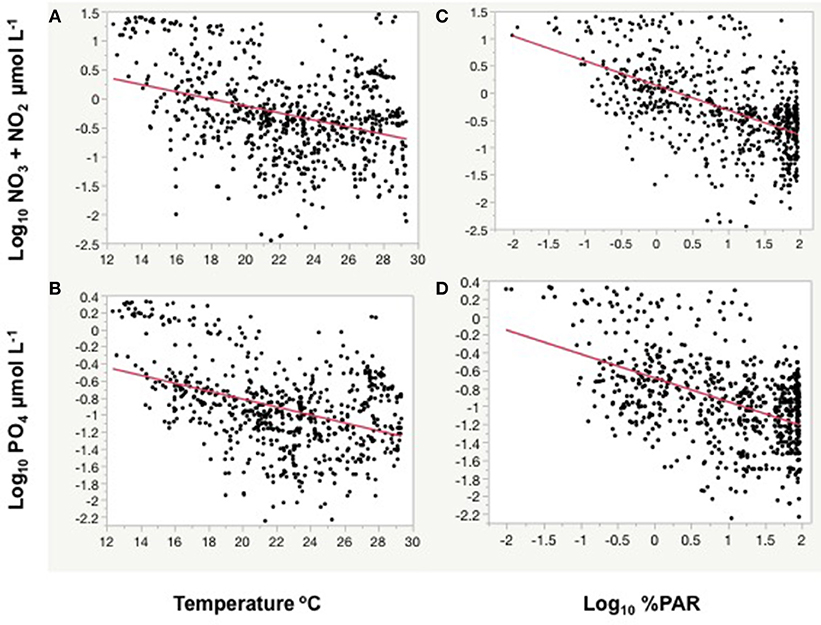
Figure 5. The relationships between (A) log10 NO3 + NO2 concentration and (B) log10 PO4 concentrations with temperature, and, between (C) log10 NO3 + NO2 concentration and (D) log10 PO4 concentrations and the log10 %PAR at depth observed during the Malaspina expedition. Red lines represent the linear fits. (A) Linear fitted equation, log NO3 + NO2 = 1.10 – 0.062*Temperature (°C), r2 = 0.12, P < 0.0001. (B) Linear fitted equation, log PO4 = 0.12 – 0.046*Temperature (°C), r2 = 0.16, P < 0.0001. (C) Linear fitted equation, log NO3 + NO2 = 0.135 – 0.45*log %PAR, r2 = 0.29, P < 0.0001. (D) Linear fitted equation, log PO4 = −0.68 – 0.266*log %PAR, r2 = 0.24, P < 0.0001.
The quadratic polynomial regression using temperature (°C) resulted in significant fitted models for the picophytoplankton: log Prochlorococcus abundance (cells ml−1) = 4.10 + 0.0364 T – 0.00388 (T – 22.61)2 (R2 = 0.13, P < 0.0001); log Synechococcus abundance (cells ml−1) = 2.38 + 0.0379 T + 0.00314 (T – 23.15)2 (R2 = 0.04, P < 0.0001; and log eukaryotes abundance (cells ml−1) = 2.63 + 0.0093 T + 0.0027 (T – 22.75)2 (R2 = 0.01, P = 0.0013).
The results of the parameters of the model considering the additive effects of temperature and Chl a concentration were compiled on Table 3, although the final models used are slightly different, as non-significant terms were not included. The global additive effect models were consistent for all three groups (Table 3), indicating that the abundance of all three picoautotroph groups increases with chlorophyll a and %PAR, but declines with increasing %UV-B radiation. The abundance of Synechococcus and picoeukaryotes was independent of temperature, but was significant for Prochlorococcus (Table 3). The positive relationship with chlorophyll a accounting for most of the 33% of the variance explained by each of the relationship with chlorophyll a, PAR and UV-B (Table 3). Whereas, the abundance of Synechococcus and picoeukaryotes increased linearly with chlorophyll a, that of Prochorococcus increased as chlorophyll a3/4 (Table 3). The finding that Synechoccocus and picoeukaryotes abundance was not significantly related to temperature, once PAR and Chl a were considered (Table 3), strongly suggests that the simple relationship with temperature observed (Figure 3) is an indirect relationships with nutrients (Figure 5), %PAR and Chl a concentration. This was also described by the relationships between %PAR and %UV-B305 and depth and chlorophyll a concentration derived from our survey (Supplementary Material, Supplementary Figure 1).
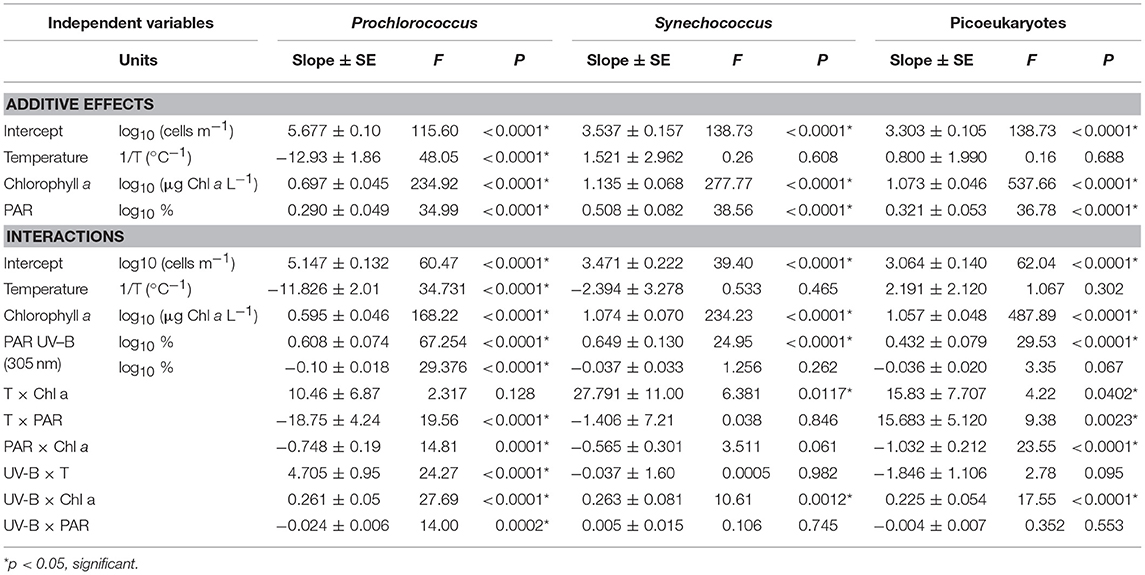
Table 3. Additive effects and Interactions between autotrophic picoplankton abundance, temperature, chlorophyll a, PAR, and UVB radiation.
However, the consideration of interactions between these drivers shows a role for temperature. The most comprehensive models consider all independent effects and interactions between chlorophyll a, temperature, %PAR and %UV-B305 and the abundance of autotrophic picoplankton (Table 3). Picoautotroph abundance increased significantly with increasing chlorophyll a, %PAR and temperature whereas the effect of %UV-B305 was negative, as expected (Table 3).
Picophytoplankton in the Future Tropical and Subtropical Ocean
Consideration of warming as an increase in temperature alone, projected an increase in picoautotroph's abundance, particularly strong for Synechococcus (38% increase by 2100 with 3°C warming, Figure 6), in contrast, temperature increase and decreased chlorophyll a with warming projected a steep decline of picoautotroph abundance, particularly abrupt for eukaryotes (62% decline with 3°C warming and oligotrophication, Figure 6). However, the decline is smoother when the increase in PAR penetration at depth with oligotrophication is considered, which was derived from the relationships between %PAR and %UV-B305 and depth and chlorophyll a concentration (Supplementary Material, Supplementary Figure 1), particularly for picocyanobacteria (Figure 6). This scenario, which is more complex but arguably more realistic as well, predicts that Prochloroccocus, Synechococcus, and picoeukaryotes abundance will decline by 18, 32, and 42% with a 2°C warming and the associated oligotrophication, compared to an increase of 14, 22, and 7% when only warming is considered (Figure 6).
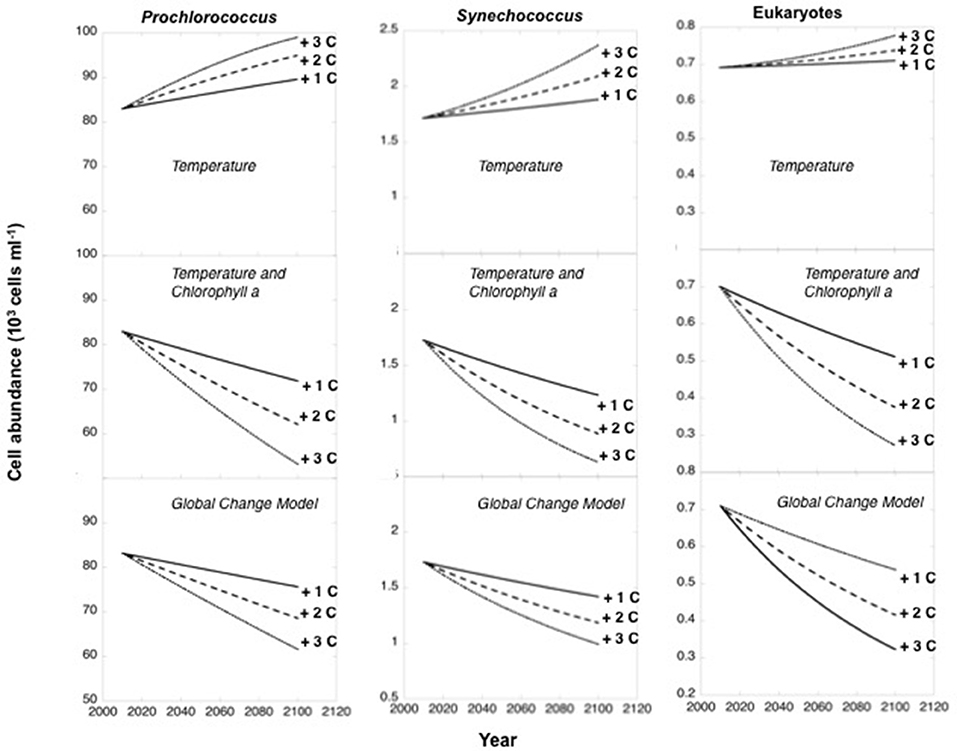
Figure 6. Projected changes with time in the abundance of Prochlorococcus, Synechococcus, and picoeukaryotes from mean present values to forecast abundances at year 2100. Three scenarios of warming were considered by increasing the mean temperature obtained for the mixed layer in the survey (22.61°C) by 1°C (continuous lines), 2°C (dashed lines), and 3°C (dotted lines) by the end of the century. Each three series of panels considers three scenarios of prediction: thermal increase only, increased temperature and the decline in Chl a associated to warming (oligotrophication), and the global change model considering thermal increase, decrease in Chl a due to oligotrophication and the consequent increase in PAR and UVB levels. Forecasts were generated using fitted equations of regression models (Table 2). Present abundance values represent the mean values obtained for the global ocean in the Malaspina-2010 survey.
Further insights into the expected changes were derived by also examining the changes in the average vertical distribution of picoautotrophs abundance for each of the three scenarios. Consideration of warming as temperature increase alone leads to an increase in picoautotroph abundance, particularly in the top 20 m of the subtropical ocean, whereas warming and oligotrophication leads to a decline, with this decline being higher at depth (Figure 7). In contrast consideration of increase in UV-B doses in the upper layers and increase in PAR at depth with oligotrophication and warming is predicted to lead to a smoother decline and a relative enhancement of the peak in abundance at about 35 m depth, the depth of maximum abundance, to the extent that the Prochloroccocus and eukaryotes abundance at this depth is comparable with warming to that at present (Figure 6). Under this scenario, the highest decline in picoautotroph abundance is observed at surface due to increased UV-B with oligotrophication (Figure 6), and increased PAR at depth allowing increased mid-water blooms.
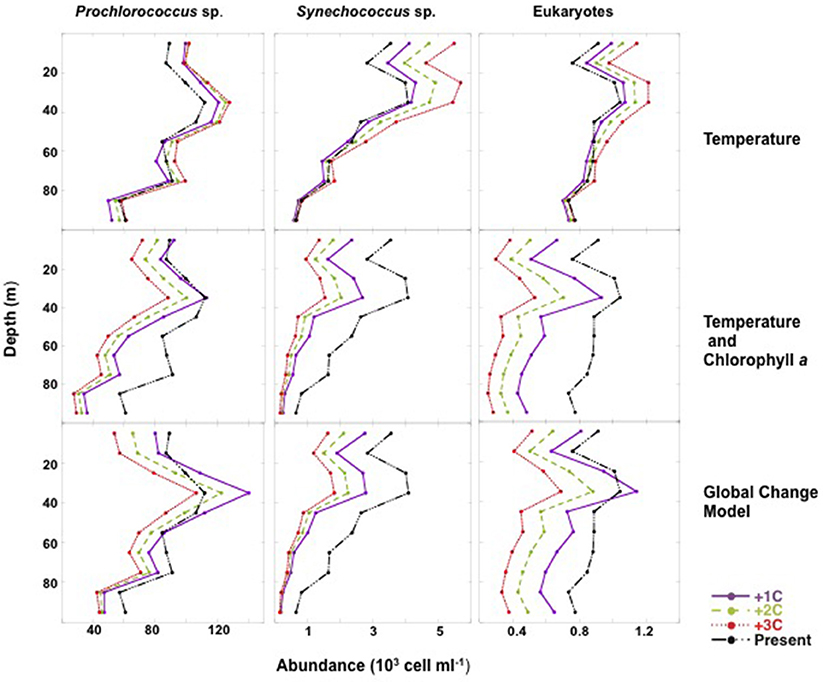
Figure 7. Three warming scenarios (1°C, purple continuous lines; 2°C, green dashed lines; and 3°C, red dashed lines) were considered to predict the changes in the vertical profiles of Prochlorococcus, Synechococcus, and pico-eukaryotes by year 2100. Global present vertical profiles of abundance (black dashed lines) for each picophytoplankton population were obtained from the depth averaged abundances in the mixed layer obtained during the Malaspina-2010 survey.
The biomass of extant picophytoplankton communities in the tropical and subtropical ocean were dominated by Prochlorococcus (Figure 8), contributing between 68 and 82% of picophytoplankton biomass in the Indian and Atlantic Oceans, respectively, and 55% of picophytoplankton biomass in the Pacific Ocean (Figure 8). We used the relationships developed to explore the community composition of picophytoplankton in a future subtropical ocean 2°C warmer than present. A model considering warming as an increase in temperature alone predicts a dramatic shift in the composition of picophytoplankton communities relative to extant communities, with a major increase of picoeukaryotes, more pronounced in the Pacific Ocean (Figure 8), followed by that of Synechococcus and a decrease of Prochlorococcus across the subtropical ocean (Figure 8). However, the predictions changed greatly when warming was considered along with its associated decrease in productivity. This model predicted an increase of Prochlorococcus dominance and a decrease of the contribution of picoeukaryotes across the subtropical ocean (Figure 8). The global change model forecasts a larger increase in the contribution of Prochlorococcus (Figure 8) across the subtropical ocean. Also smoother changes in community composition, specifically involving a smaller decrease in the contribution of Synechococcus relative to that predicted by the warming + reduced productivity model (Figure 8).
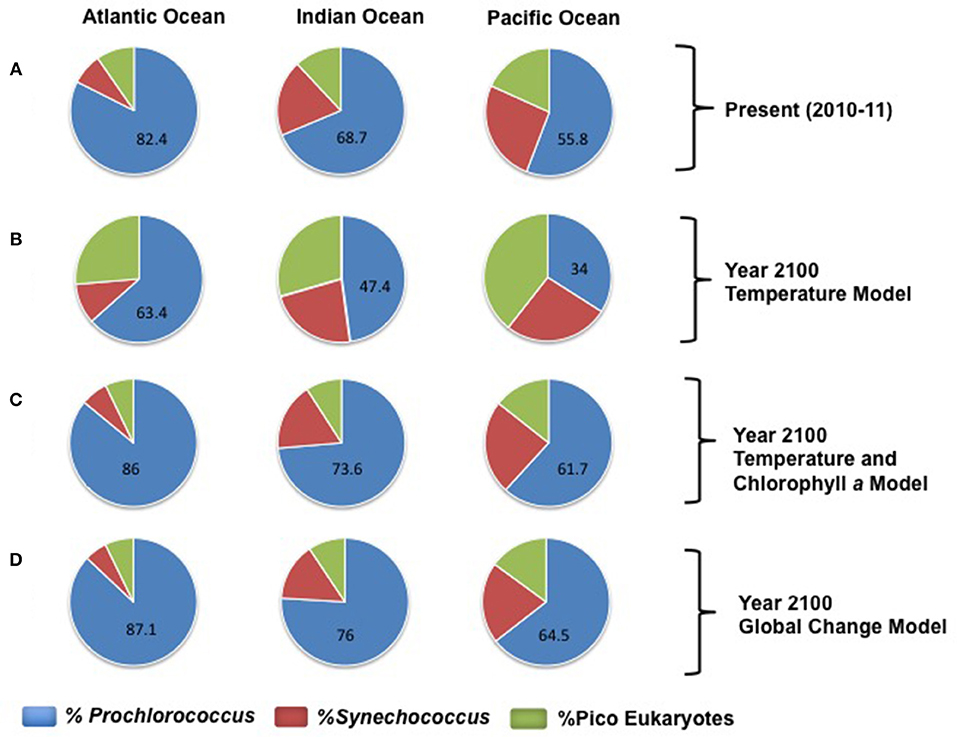
Figure 8. Composition of picoautrophic communities, represented as the average percent contribution to picoautotrophs biomass, in the subtropical waters of the three oceanic basins sampled. The slices in the pie charts are proportional to the percentage of the biomass of Prochlorococcus (blue), Synechococcus (red), and pico-eukaryotes (green), and numbers indicating the percentage of Prochlorococcus. (A) represents the average picophytoautotrophs community in the extant subtropical and tropical ocean, as derived from our survey. (B–D) represent the changes in community composition forecasted for year 2100 by each of the three models (thermal effects, thermals effects and reduced oceanic Chl a, and thermal effects with reduced Chl a and its feedback effects on the submarine light field, under a maximum warming of 2°C across the subtropical and tropical Ocean.
Discussion
The empirical picoautotrophs abundance vs. temperature relationships observed in the tropical and subtropical oligotrophic ocean during this study indicated that responses to temperature of these organisms to warming may be complex. Also, ocean temperature is closely correlated to other properties, such as nutrient availability, and stratification, so that the interpretation of picophytoplankton responses must be cumbersome (Agawin et al., 2000). The functional significance of temperature relationships must derive from consistency with experimentally-determined relationships. There are surprisingly few experimentally-determined temperature responses of picoautotrophs, but existing evidence points at an increase in growth rates up to 20–25°C (Agawin et al., 1998; Boyd et al., 2010; Kulk et al., 2012) and a decline at warmer temperatures (Agawin et al., 1998; Boyd et al., 2010).
Previous global analyses of the response of picophytoplankton to warming encompassed the whole geographical distribution of picocyanobacteria, in an impressive data set including polar, subpolar, temperate, subtropical and coastal populations, spanning from heavily eutrophied coastal areas to the open ocean (Flombaum et al., 2013). In contrast, our study focused on oceanic tropical and subtropical oceanic areas, including the subtropical gyres, and, hence, showed differences with previous global analyses. Our focus in the subtropical and tropical ocean is justified by the prevalence and dominance of picoeukaryotes in these warm, oligotrophic waters (Partensky et al., 1999; Agawin et al., 2000). Our results showed significant, but contrasting relationships between picophytoplankton with nutrient concentrations, whereas analyses based on global data indicated a very weak role of nutrient concentrations on the abundance of picocyanobacteria. Whereas, in agreement with Flombaum et al. (2013), we did not find significant relationships between Synechococcus abundance and nutrient concentrations, we found significant negative relationships with Prochorococcus and positive with picoeukaryote abundance. Relationships with temperature also differed, as the range of temperature in the subtropical ocean is restricted to the high temperature ranges, compared to the assessment, including polar oceans, of Flombaum et al. (2013). Also, the abundance of Synechococcus populations in the tropical and subtropical ocean differed from that at the global scale. Although the maximum values of Synechococcus abundance found here are close to those reported in previous data compilations, the frequency of highly abundant (i.e., >104 cells ml−1) Synechoccoccus populations in warm waters differed, as eutrophic subtropical coastal areas were included in the global data set (Flombaum et al., 2013). In the warmest waters of the open oligotrophic subtropical ocean sampled during the Malaspina expedition, Synechococcus population abundance were of the order of 103 cells ml−1, one order of magnitude lower than the populations found in the global data set, which were affected by the consistently high values found in eutrophic subtropical coastal waters (Flombaum et al., 2013). These differences in the scope (open subtropical and tropical ocean vs. global coastal and open ocean) of the data sets influenced the relationships found and, therefore, the projections of the responses of picophytoplankton to warming.
Indeed, responses of planktonic communities to warming are predicted to differ between nutrient-replete and nutrient-limited waters (Lewandowska et al., 2014). The prediction that picoautotroph abundance should increase with warming in the subtropical and tropical ocean (Flombaum et al., 2013) may, therefore, be applicable for eutrophied coastal areas, but is inconsistent with our results for the open oligotrophic ocean, which are, in turn, coherent with the evidence for on-going oligotrophication of the subtropical open ocean (Boyce et al., 2010; Signorini et al., 2015) and a decline in primary production (Gregg and Conkright, 2002; Behrenfeld et al., 2006) with warming. Particularly, for the unproductive oligotrophic gyres (Antoine et al., 2005), which seems to have recently expanded in size (Polovina et al., 2008). Indeed, predictions of changes in picoplankton communities with warming (Morán et al., 2010; Flombaum et al., 2013) did not test the relationship between the abundance of autotrophic picoplankton and chlorophyll a, used as a proxy for phytoplankton biomass. So previous analysis did not address how picoplankton abundance responds to changes in phytoplankton biomass associated with warming-driven ocean oligotrophication (Boyce et al., 2010). A 10-fold increase in picophytoplankton abundance with warming, as predicted by Flombaum et al. (2013), should be sustained by increased nutrient inputs or at the expense of the reduction of nano and microphytoplankton cells in the community. Whereas, this is possible in the eutrophic coastal waters included in the assessment of Flombaum et al. (2013), this is very unlikely in the open oligotrophic ocean where communities are indeed largely dominated by picophytoplankton (77% ± 0.5 (mean ± SE) of the total Chl a was in the < 2 μm fraction). Indeed, nutrient supply is predicted to decline in a strongly stratified warmer subtropical ocean (Sarmiento et al., 1998, 2004). Reported increases in picophytoplankton abundance correspond to subpolar and temperate North Atlantic waters (from 43 to 60°N in Morán et al., 2010) or to warmer but eutrophied coastal areas (Phlips et al., 1999; Gaulke et al., 2010). Indeed, available evidence points at a realized reduction in chlorophyll a concentrations in the subtropical open ocean with warming resulting from reduced nutrient supply due to increased stratification (Roemmich and McGowan, 1995; Signorini et al., 2015). However, some areas outside the subtropical gyres have increased in productivity, such as upwelling zones (Bakun, 1990). The observed trend toward reduced chlorophyll a concentration in the subtropical ocean with warming (Antoine et al., 2005; Behrenfeld et al., 2006; Boyce et al., 2010) is inherently inconsistent with an increase in picophytoplankton abundance, as these are the dominant contributors to chlorophyll a in these waters. Hence, picophytoplankton abundance is projected to decline in the future warm, oligotrophic open ocean when considering the rate of chlorophyll a decline associated with temperature increase observed for oligotrophic areas (Boyce et al., 2010). The rates of Chl a decline of Boyce et al. (2010) used here for the projection of future picophytoplankton abundance involve uncertainties. The results of Boyce et al. (2010) were questioned by some authors due to a possible influence from temporal sampling bias (Rykaczewski and Dunne, 2011). Also the decline rates they reported could be influenced by pooling data on transparency and in situ chlorophyll a concentration values (Mackas, 2011). However, the decline in chlorophyll a over time in the oligotrophic ocean concluded by Boyce et al. (2010) has been confirmed by independent studies free of such sources of error since (Signorini et al., 2015; Agusti et al., 2017). Despite possible uncertainties, the use here of reported trends in chlorophyll a concentration with warming to constrain picophytoplankton abundance improves the consistency between forecasted picophytoplankton abundance and warming effects on chlorophyll a, which reflects the consequences of warming on increased stratification and the associated decline in nutrient availability, for which there are still few time-series (but HOT and BATS) reported for the open ocean. Since Chl a concentration is a mean driver of the attenuation of solar radiation with depth in the oligotrophic ocean (Morel and Berthon, 1989; Hargreaves, 2003), it follows that the predicted decline in Chl a concentration with future warming should also lead to increased PAR and UVB depth penetration. The inclusion of picoeukaryotes populations, which were not assessed in previous analyses, in our analysis revealed a negligible increase in the abundance of this picoautotrophs when considering temperature increase alone, as these populations showed a weaker association with temperature than picocyanobacteria.
Our study also implemented predictions of picophytoplankton in the water column. The global model considering interactions between environmental variables predicted a population decline at the surface waters but a relative enhancement of mid-water, about 35 m, blooms of picophytoplankton with warming. Increased surface stratification and higher penetration of PAR and UVB underwater should inhibit surface populations but increased PAR penetration to mid-water layers, must help an increase in productivity at intermediate depths. Moreover, the results obtained predict an increase in the dominance, as the percentage of picoautotrophic biomass, of the genus Prochlorococcus. Single-effect models based solely in statistical relationships with temperature forecast however an increase in Synechococcus, and pico-eukaryotes as the dominant components of the future subtropical autotrophic community. This prediction could be in conflict with observations of decline in ocean productivity governed by increased water column-stratification (Bouman et al., 2011). A shift in the community toward increasing dominance of picoeukaryotes will require additional nutrients inputs, as picoeukaryotes abundance in this study were positively related to nutrients concentration, as described for the Pacific Ocean (Blanchot et al., 2001) and to oceanic nutrient supply (Mouriño-Carballido et al., 2016). Our prediction of increasing dominance of Prochlorococcus is in agreement with models based on increased thermal stratification in the oligotrophic ocean, forecasting a decrease in total biomass and mean cell phytoplankton size (Acevedo-Trejos et al., 2014).
Our results, inferred from an empirical analysis of extant picoautotroph niches derived from a coherent survey of their abundance in the subtropical and tropical Ocean are consistent with (1) experimental assessments of thermal niches of marine picoautotrophs (Agawin et al., 1998; Thomas et al., 2012), (2) the observed trend toward oligotrophication of the subtropical and tropical ocean with warming (Gregg and Conkright, 2002; Antoine et al., 2005; Behrenfeld et al., 2006; Polovina et al., 2008), (3) the vulnerability of picoautotrophs to UV-B radiation (Llabrés and Agusti, 2006; Agustí and Llabrés, 2007), and responses to increased deep PAR penetration (4) the increased dominance of picoautotrophs with decreasing chlorophyll a (Agawin et al., 2000).
In summary, whereas picoautotrophs abundance is expected to increase in temperate and subpolar oceans as warming shifts their thermal regimes toward the thermal niche of picoautotrophs, our results predict, consistent with experimental and observational results, that picoautotrophs abundance will be much more moderate or even decline, with a relative increase in Prochlorococcus and an increase in the importance of deep blooms, in the subtropical and tropical ocean. As subtropical gyres represent 70% of the ocean surface, the largest biome in the planet, the responses predicted here represent a significant change in the Earth system with important implications for global biodiversity and biogeochemical cycling.
Author Contributions
SA, LL, EM-O, and CD design the study. CD directed the circumnavigation. SA, LL, and EM-O provided picoplankton data. SA provided UVB and PAR data. ME provided the chlorophyll a concentration data. SA and CD analyzed the data and compose tables and figures. All authors contributed to writing the manuscript.
Conflict of Interest Statement
The authors declare that the research was conducted in the absence of any commercial or financial relationships that could be construed as a potential conflict of interest.
Acknowledgments
This research is a contribution to the Malaspina Expedition 2010 project, funded by the CONSOLIDER Ingenio 2010 programme of the Spanish Ministry of Science and Competitiveness (CSD2008-00077). Also funded by SA's baseline BAS/1/1072-01-01 KAUST fund. We thank the UTM personnel and the scientist on board the Malaspina expedition, for help with sampling and data analysis of CTD, and nutrients, and the BIO Hesperides crew for their professional help during the cruises. We are grateful to M. de Oca for flow cytometry acquisitions during legs 1, 3, and 5, and to Moira Llabres for data analysis.
Supplementary Material
The Supplementary Material for this article can be found online at: https://www.frontiersin.org/articles/10.3389/fmars.2018.00506/full#supplementary-material
References
Acevedo-Trejos, E., Brandt, G., Steinacher, M., and Merico, A. (2014). A glimpse into the future composition of marine phytoplankton communities. Front. Mar. Sci. 1:15. doi: 10.3389/fmars.2014.00015
Agawin, N. S. R., Duarte, C. M., and Agusti, S. (1998). Growth and abundance of Synechococcus sp. in a Mediterranean Bay: seasonality and relationship with temperature. Mar. Ecol. Progr. Ser. 170, 45–53. doi: 10.3354/meps170045
Agawin, N. S. R., Duarte, C. M., and Agusti, S. (2000). Nutrient and temperature control of the contribution of picoplankton to phytoplankton biomass and production. Limnol. Oceanogr. 45, 591–600. doi: 10.4319/lo.2000.45.3.0591
Agustí, S., and Llabrés, M. (2007). Solar radiation-induced mortality of marine pico-phytoplankton in the oligotrophic ocean. Photochem. Photobiol. 83, 793–801. doi: 10.1111/j.1751-1097.2007.00144.x
Agusti, S., Martinez-Ayala, J., Regaudie-de-Gioux, A., and Duarte, C. M. (2017). Oligotrophication and metabolic slowing-down of a NW Mediterranean coastal ecosystem. Front. Mar. Sci. 4:432. doi: 10.3389/fmars.2017.00432
Antoine, D., Morel, A., Gordon, H. R., Banzon, V. F., and Evans, R. H. (2005). Bridging ocean color observations of the 1980s and 2000s in search of long-term trends. J. Geophys. Res. 110, 1–22. doi: 10.1029/2004JC002620
Bakun, A. (1990). Global climate change and intensification of coastal ocean upwelling. Science 247, 198–201. doi: 10.1126/science.247.4939.198
Behrenfeld, M. J., O'Malley, R. T., Siegel, D. A., McClain, C. R., Sarmiento, J. L., Feldman, G. C., et al. (2006). Climate-driven trends in contemporary ocean productivity. Nat. Lett. 444, 752–755. doi: 10.1038/nature05317
Blanchot, B., Andre, J. M., Navarette, C., Neveux, J., and Radenac, M. H. (2001). Picophytoplankton in the equatorial Pacific: vertical distributions in the warm pool and in the high nutrient low chlorophyll conditions. Deep Sea Res. I 48, 297–314. doi: 10.1016/S0967-0637(00)00063-7
Bopp, L., Resplandy, L., Orr, J. C., Doney, S. C., Dunne, J. P., Gehlen, M., et al. (2013). Multiple stressors of ocean ecosystems in the 21st century: projections with CMIP5 models. Biogeosciences 10, 6225–6245. doi: 10.5194/bg-10-6225-2013
Bouman, H. A., Ulloa, O., Barlow, R., Li, W. K., Platt, T., Zwirglmaier, K., et al. (2011). Water-column stratification governs the community structure of subtropical marine picophytoplankton. Environ. Microbiol. Rep. 3, 473–482. doi: 10.1111/j.1758-2229.2011.00241.x
Boyce, D. G., Lewis, M. R., and Worm, B. (2010). Global phytoplankton decline over the past century. Nature 466, 591–596. doi: 10.1038/nature09268
Boyd, P. W., Strzepek, R., Fu, F., and Hutchins, D. (2010). Environmental control of open-ocean phytoplankton groups: now and in the future. Limnol. Oceanogr. 55, 1353–1376. doi: 10.4319/lo.2010.55.3.1353
Burrows, M. T., Schoeman, D. S., Buckley, L. B., Moore, P., Poloczanska, E. S., Brander, K. M., et al. (2011). The pace of shifting climate in marine and terrestrial ecosystems. Science 334, 652–655. doi: 10.1126/science.1210288
Campbell, J., Antoine, D., Armstrong, R., Arrigo, K., Balch, W., Barber, R., et al. (2002). Comparison of algorithms for estimating ocean primary production from surface chlorophyll, temperature, and irradiance. Global Biogeochem. Cycles 16:1035. doi: 10.1029/2001GB001444
Chust, G., Allen, J. I., Bopp, L., Schrum, C., Holt, J., Tsiaras, K., et al. (2014). Biomass changes and trophic amplification of plankton in a warmer ocean. Glob. Chang. Biol. 20, 2124–2139. doi: 10.1111/gcb.12562
Claustre, H. (1994). The trophic status of various oceanic provinces as revealed by phytoplankton pigment signatures. Limnolol. Oceanogr. 39, 1206–1210.
Cózar, A., Echevarría, F., González-Gordillo, J. I., Irigoien, X., Ubeda, B., Hernández-León, S., et al. (2014). Plastic debris in the open ocean. Proc. Natl. Acad. Sci. U.S.A. 111, 10239–10244. doi: 10.1073/pnas.1314705111
Duarte, C. M. (2015). Seafaring in the 21st century: the Malaspina 2010 circumnavigation expedition. Limnol. Oceanogr. Bull. 24, 11–14. doi: 10.1002/lob.10008
Estrada, M. (2012). “Determinación fluorimétrica de la concentración de clorofila a,” in Expedición de circunnavegación Malaspina 2010: Cambio global y exploración de la biodiversidad del Océano. Libro Blanco de métodos y técnicas de trabajo oceanográfico, ed E. Moreno-Ostos (Madrid: Consejo Superior de Investigaciones Cientificas), 399–405.
Flombaum, P., Gallegos, J. L., Gordillo, R. A., Rincón, J., Zabala, L. L., Jiao, N., et al. (2013). Present and future global distributions of the marine Cyanobacteria, Prochlorococcus, and Synechococcus. Proc. Natl. Acad. Sci. U.S.A. 110, 9824–9829. doi: 10.1073/pnas.1307701110
Gasol, J. M., del Giorgio, P. A., and Duarte, C. M. (1997). Biomass distribution in marine planktonic communities. Limnol. Oceanogr., 42, 1353–1363. doi: 10.4319/lo.1997.42.6.1353
Gattuso, J. P., Magnan, A., Billé, R., Cheung, W. W., Howes, E. L., Joos, F., et al. (2015). Contrasting futures for ocean and society from different anthropogenic CO2 emissions scenarios. Science 349:aac4722. doi: 10.1126/science.aac4722
Gaulke, A. K., Wetz, M. S., and Paerl, H. W. (2010). Picophytoplankton: a major contributor to planktonic biomass and primary production in a eutrophic, river-dominated estuary. Estuar. Coast. Shelf Sci. 90, 45–54. doi: 10.1016/j.ecss.2010.08.006
Gregg, W. W., and Conkright, M. E. (2002). Decadal changes in global ocean chlorophyll. Geophys. Res. Lett. 29, 20-1–20-4. doi: 10.1029/2002GL014689
Hansen, H. P., and Koroleff, F. (1999). “Determination of nutrients,” in Methods of Seawater Analysis, eds K. Grasshoff, K. Kremling, and M. Ehrhardt (Wiley-VCH Verlag GmbH). doi: 10.1002/9783527613984.ch10
Hargreaves, B. R. (2003). “Water column optics and penetration of UVR,” in UV Effects in Aquatic Organisms and Ecosystems, eds E. W. Helbling, and H. Zagarese (Cambridge: The Royal Society of Chemistry).
Hastie, T. J. (2017). “Generalized additive models,” in Statistical Models (New York, NY: S. Routledge), 249–307.
Irigoien, X., Klevjer, T. A., Røstad, A., Martinez, U., Boyra, G., Acuña, J. L., et al. (2014). Large mesopelagic fish biomass and trophic efficiency in the open Ocean. Nat. Commun. 5:3271. doi: 10.1038/ncomms4271
Kulk, G., de Vries, P., van de Poll, W. H., Visser, R. J. W., and Buma, A. G. J. (2012). Temperature-dependent growth and photophysiology of prokaryotic and eukaryotic oceanic picophytoplankton. Mar. Ecol. Prog. Ser. 466, 43–5. doi: 10.3354/meps09898
Lewandowska, A. M., Boyce, D. G., Hofmann, M., Matthiessen, B., Sommer, U., and Worm, B. (2014). Effects of sea surface warming on marine plankton. Ecol. Lett., 17, 614–623. doi: 10.1111/ele.12265
Llabrés, M., and Agusti, S. (2006). Pico-phytoplankton cell death induced by UV radiation: evidence for oceanic Atlantic communities. Limnol. Oceanogr. 51, 21–29. doi: 10.4319/lo.2006.51.1.0021
Lubián, L. M. (2012). “Determinación de la abundancia de nano y picofitoplancton mediante citometría de flujo,” in Expedición de circunnavegación Malaspina 2010: Cambio global y exploración de la biodiversidad del Océano. Libro Blanco de métodos y técnicas de trabajo oceanográfico, ed E. Moreno-Ostos (Madrid: Consejo Superior de Investigaciones Cientificas), 381–385.
Mackas, D. L. (2011). Does blending of chlorophyll data bias temporal trend? Nature 472, E4–E5. doi: 10.1038/nature09951
Marañón, E., Cermeño, P., López-Sandoval, D. C., Rodríguez-Ramos, T., Sobrino, C., Huete-Ortega, M., et al. (2013). Unimodal size scaling of phytoplankton growth and the size dependence of nutrient uptake and use. Ecol. Lett. 16, 371–379. doi: 10.1111/ele.12052
Marie, D., Simon, N., and Vaulot, D. (2005). “Phytoplankton cell counting by flow cytometry,” in Algal Culturing Techniques 27 (Burlington, MA: Academic Press), 253–267.
Moon-van der Staay, S. Y., De Wachter, R., and Vaulot, D. (2001). Oceanic 18S rDNA sequences from picoplankton reveal unsuspected eukaryotic diversity. Nature 409, 607–610. doi: 10.1038/35054541
Morán, X. A. G., López-Urrutia, Á., Calvo-Díaz, A., and Li, W. K. W. (2010). Increasing importance of small phytoplankton in a warmer ocean. Glob. Change Biol. 16, 1137–1144. doi: 10.1111/j.1365-2486.2009.01960.x
Morel, A., and Berthon, J. F. (1989). Surface pigments, algal biomass profiles, and potential production of the euphotic layer: relationships reinvestigated in view of remote-sensing applications. Limnol. Oceanogr. 34, 1545–1562. doi: 10.4319/lo.1989.34.8.1545
Mouriño-Carballido, B., Hojas, E., Cermeño, P., Chouciño, P., Fernández-Castro, B., Latasa, M., et al. (2016). Nutrient supply controls picoplankton community structure during three contrasting seasons in the northwestern Mediterranean Sea. Mar. Ecol. Prog. Ser. 543, 1–19. doi: 10.3354/meps11558
Partensky, F., Blanchot, J., and Vaulot, D. (1999). Differential distribution and ecology of Prochlorococcus and Synechococcus in oceanic waters: a review. Bull. Inst. Oceanogr. Monaco, 19, 457–476.
Phlips, E. J., Badylak, S., and Lynch, T. C. (1999). Blooms of the picoplanktonic cyanobacterium Synechococcus in Florida Bay, a subtropical inner-shelf lagoon. Limnol. Oceanogr. 44, 1166–1175. doi: 10.4319/lo.1999.44.4.1166
Polovina, J. J., Howell, E. A., and Abecassis, M. (2008). Ocean's least productive waters are expanding. Geophys. Res. Lett. 35:3. doi: 10.1029/2007GL031745
Raven, J. (1998). The twelfth Tansley lecture. Small is beautiful: the picophytoplankton. Funct. Ecol. 12, 503–513. doi: 10.1046/j.1365-2435.1998.00233.x
Regaudie-de-Gioux, A., and Duarte, C. M. (2012). Temperature dependence of planktonic metabolism in the ocean. Glob. Biogeochem. Cycles 26. doi: 10.1029/2010GB003907
Roemmich, D., and McGowan, J. (1995). Climatic warming and the decline of zooplankton in the California current. Science 267:1324. doi: 10.1126/science.267.5202.1324
Rykaczewski, R. R., and Dunne, J. P. (2011). A measured look at ocean chlorophyll trends. Nature 472, E5–E6. doi: 10.1038/nature09952
Sarmiento, J. L., Hughes, T. M., Stouffer, R. J., and Manabe, S. (1998). Simulated response of the ocean carbon cycle to anthropogenic climate warming. Nature 393, 245–249. doi: 10.1038/30455
Sarmiento, J. L., Slater, R., Barber, R., Bopp, L., Doney, S. C., Hirst, A. C., et al. (2004). Response of ocean ecosystems to climate warming. Glob. Biogeochem. Cycles 18:3. doi: 10.1029/2003GB002134
Signorini, S. R., Franz, B. A., and McClain, C. R. (2015). Chlorophyll variability in the oligotrophic gyres: mechanisms, seasonality and trends. Front. Mar. Sci. 2:1. doi: 10.3389/fmars.2015.00001
Steinacher, M., Joos, F., Fr, F., Fr, T. L., Bopp, L., Cadule, P., et al. (2010). Projected 21st century decrease in marine productivity: a multi-model analysis. Biogeosciences i7, 979–1005. doi: 10.5194/bg-7-979-2010
Thomas, M. K., Kremer, C. T., Klausmeier, C. A., and Litchman, E. (2012). A global pattern of thermal adaptation in marine phytoplankton. Science 338, 1085–1088. doi: 10.1126/science.1224836
Tyrrell, T. (2011). Anthropogenic modification of the oceans. Philos. Trans. R. Soc. A 369, 887–908. doi: 10.1098/rsta.2010.0334
Uitz, J., Claustre, H., Morel, A., and Hooker, S. B. (2006). Vertical distribution of phytoplankton communities in open ocean: an assessment based on surface chlorophyll. J. Geophys. Res. 111:C08005. doi: 10.1029/2005JC003207
Vidal, M., and Teixidor, I. (2012). “Muestreo de nutrientes disueltos,” in Expedición de circunnavegación Malaspina 2010: Cambio global y exploración de la biodiversidad del Océano. Libro Blanco de métodos y técnicas de trabajo oceanográfico, ed E. Moreno-Ostos (Madrid: Consejo Superior de Investigaciones Cientificas), 121–124.
Keywords: ocean warming, Proclorococcus, Synechococcus, pico eukaryotes, temperature, nutrients, underwater PAR, UVB radiation
Citation: Agusti S, Lubián LM, Moreno-Ostos E, Estrada M and Duarte CM (2019) Projected Changes in Photosynthetic Picoplankton in a Warmer Subtropical Ocean. Front. Mar. Sci. 5:506. doi: 10.3389/fmars.2018.00506
Received: 14 April 2018; Accepted: 18 December 2018;
Published: 15 January 2019.
Edited by:
Rui Rosa, Universidade de Lisboa, PortugalReviewed by:
Anthony J. Richardson, The University of Queensland, AustraliaGuillem Chust, Centro Tecnológico Experto en Innovación Marina y Alimentaria (AZTI), Spain
Copyright © 2019 Agusti, Lubián, Moreno-Ostos, Estrada and Duarte. This is an open-access article distributed under the terms of the Creative Commons Attribution License (CC BY). The use, distribution or reproduction in other forums is permitted, provided the original author(s) and the copyright owner(s) are credited and that the original publication in this journal is cited, in accordance with accepted academic practice. No use, distribution or reproduction is permitted which does not comply with these terms.
*Correspondence: Susana Agusti, c3VzYW5hLmFndXN0aUBrYXVzdC5lZHUuYXU=
†Deceased