 Toyonobu Fujii1*
 Kenji Kaneko1Hiroki Murata2
 Chinatsu Yonezawa2Ayu Katayama3Megumi Kuraishi1Yuka Nakamura1
 Daisuke Takahashi4Yasushi Gomi2
 Hiroya Abe5Akihiro Kijima1
- 1Tohoku Ecosystem-Associated Marine Sciences, Graduate School of Agricultural Science, Tohoku University, Sendai, Japan
- 2Graduate School of Agricultural Science, Tohoku University, Sendai, Japan
- 3Department of Food, Agricultural and Environment, Miyagi University, Sendai, Japan
- 4School of Marine Science and Technology, Tokai University, Shizuoka, Japan
- 5National Institute for Environmental Studies, Tsukuba, Japan
The 2011 Great East Japan Earthquake and tsunami wiped out over 1200 shellfish and ascidian culture long-lines and ∼120 salmon farm cages that comprised the entire aquaculture installations in Onagawa Bay, Japan, and severely altered the associated ecosystem. A year later, we launched a coordinated monitoring program to measure the extent of the damage caused by the disaster and monitor the change in the state of the marine ecosystem. As part of this effort, we conducted multi-seasonal sampling to characterize spatio-temporal variation in benthic macrofaunal community and a range of environmental parameters across Onagawa Bay between March 2012 and January 2018. The 492 total macrofaunal species recorded included Polychaeta (38.8%), Bivalvia (13.2%), Amphipoda (10.8%), Decapoda (9.6%), Gastropoda (9.3%), and Echinodermata (4.3%). At the outermost reference site, macrofaunal abundance, biomass, and species diversity were all consistently high throughout the study period. Inside Onagawa Bay, macrofauna metrics increased steadily from the lowest values at the beginning of the study to the highest over time. During the same period, the spatial extent of aquaculture facilities for long-lines and fish cages recovered steadily to within 60.8% and 74.8% of the original state, respectively. The significant variables identified by multivariate analysis to explain spatio-temporal variability in benthic macrofaunal communities were: (1) proximity to the nearest aquaculture facilities; (2) wind fetch length (exposure); (3) sediment grain size; and (4) the total area of aquaculture facilities. This study suggests that coastal aquaculture operations may strongly influence the occurrence and distribution of benthic macrofaunal communities and thereby influence the recovery of seafloor biota at ecosystem scales following a catastrophic natural disaster.
Introduction
Marine ecosystems have played a vital role in supporting human well-being since ancient times by providing a wealth of resources and services (Katsanevakis et al., 2011; Thurber et al., 2014). However, an array of natural and anthropogenic stressors impacts the global ocean (Halpern et al., 2008; McCauley et al., 2015). Natural environmental stressors or disturbances that affect marine ecosystems may include floods, droughts, hurricanes, volcanic eruptions, earthquakes, and tsunamis (e.g., Whanpetch et al., 2010; Lomovasky et al., 2011). Anthropogenic stressors such as fisheries, aquaculture, land reclamation, eutrophication, marine litter, construction of sea defense walls additionally affect marine ecosystems with increasing frequency (e.g., Benn et al., 2010; Foden et al., 2011; Katsanevakis et al., 2011). These natural and anthropogenic stressors interact, complicating assessment of the consequences of any single stressor (Halpern and Fujita, 2013; McCauley et al., 2015; Gunderson et al., 2016; Liess et al., 2016).
On 11 March 2011, the Great East Japan Earthquake and subsequent tsunami devastated extensive areas of the Pacific coast of the Tohoku region in northern Japan. The major disturbances caused by the disaster included the immediate physical force of the tsunami and associated negative impacts on intertidal biota (Urabe et al., 2013), large amounts of terrestrial debris washed out into the ocean, a severe accident at the Fukushima Daiichi nuclear power plant that caused leakage of radioactive contaminants (Sohtome et al., 2014), spills of toxic chemicals (e.g., heavy oil), and associated negative impacts on subtidal benthic fauna (Abe et al., 2015). Coastal regions also suffered from loss of seagrass/seaweed beds with their associated fauna (Takami et al., 2013), abrupt accumulation of tsunami deposits and resuspended mud on the seafloor (Seike et al., 2013; Toyofuku et al., 2014; Kanaya et al., 2015; Seike et al., 2016), and widespread land subsidence. In order to measure the extent of the damage caused by the disaster and to monitor the subsequent change in the state of the marine environment, we launched the “Tohoku Ecosystem-Associated Marine Sciences” (TEAMS) project in March 2012. As part of this study, we initiated a coordinated monitoring program to obtain a holistic view on the spatio-temporal dynamics of the marine ecosystem of Onagawa Bay (Figure 1). To this end, we monitored a range of environmental parameters including biogeochemistry, physical measurements, sediment properties, and community dynamics of benthic and pelagic components potentially impacted by the disaster. This study presents the benthic component and associated environmental factors.
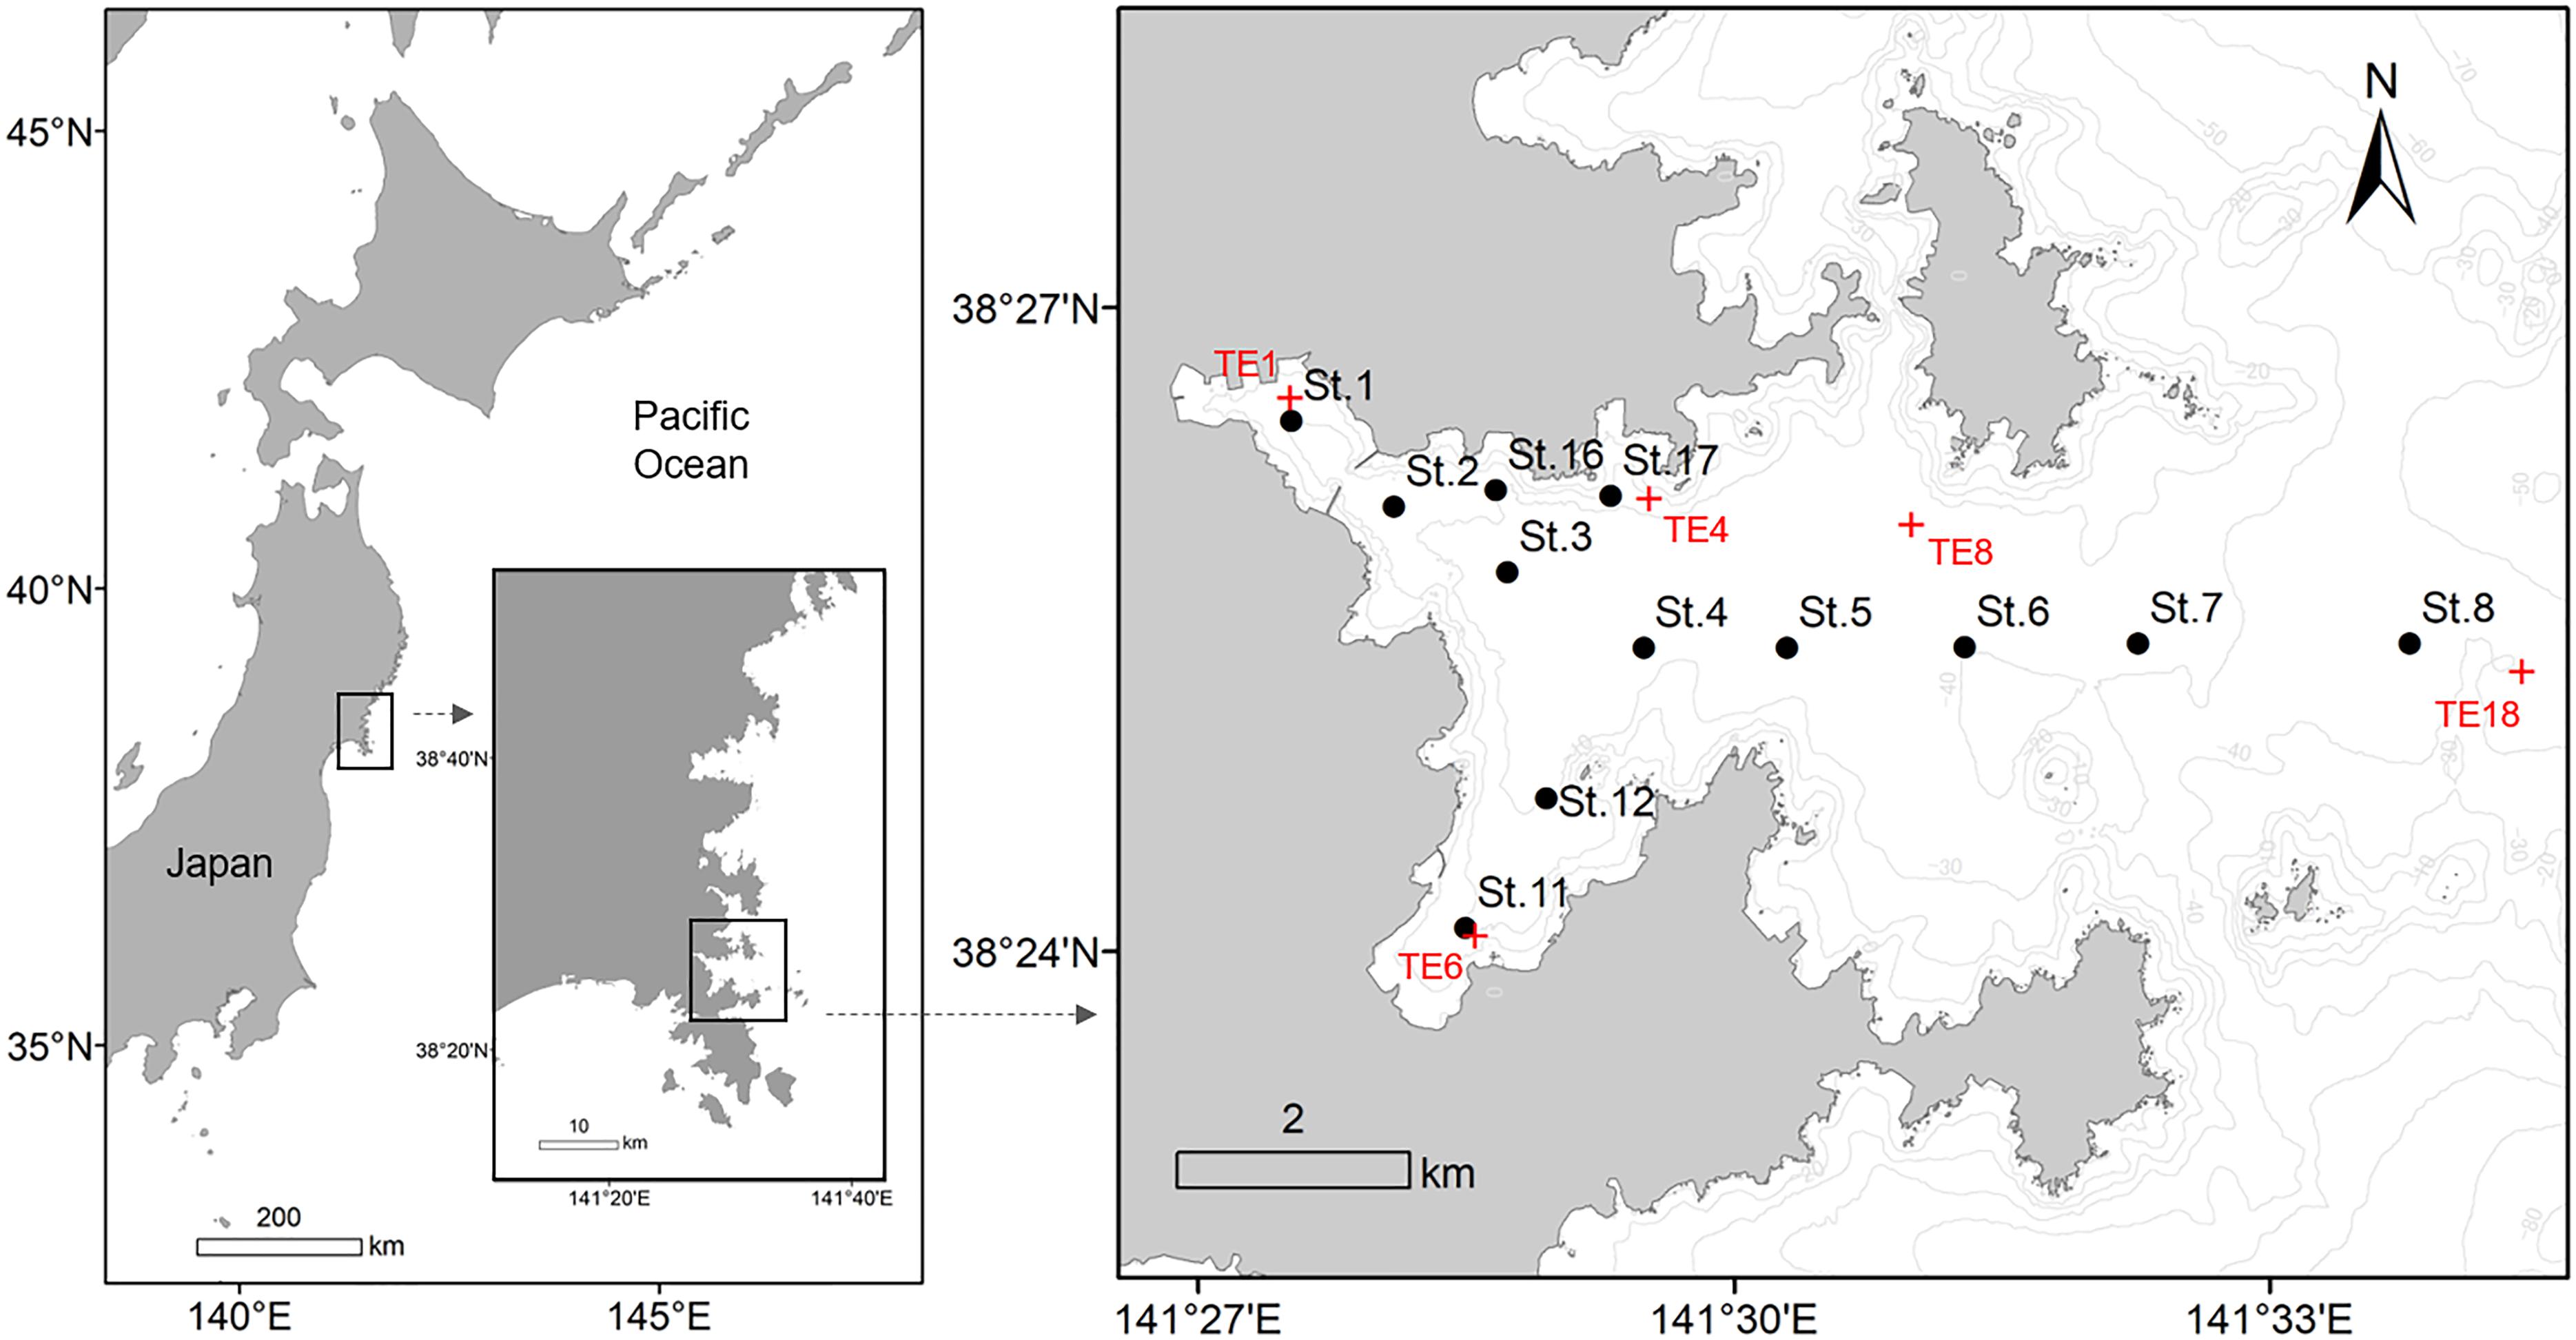
Figure 1. Map of Onagawa Bay, Japan, showing sampling stations for the Onagawa Bay Monthly Survey on board RV Suikoh from March 2012 onward (filled black circles: St.1–8, 11, 12, 16, and 17). Red cross symbols (TE1, 4, 6, 8, and 18) indicate locations of five of the sampling stations for the long-term environmental survey program conducted by Miyagi Prefecture and Tohoku Electric Power Company that provided comparative pre-tsunami data.
Prior to the earthquake and tsunami, fishing and aquaculture were the primary industries for many towns and villages along the Tohoku Pacific coast. For example, Onagawa Bay supported over 1200 long-lines for culturing scallops, oysters, and edible ascidians as well as around 120 fish cages for farming salmonids. However, the 2011 earthquake and tsunami wiped out entire aquaculture installations. Rehabilitation of coastal aquaculture therefore attracted considerable interest from both marine scientists and policy makers. Recent studies demonstrate varying, but often negative, effects of aquaculture on the environment through changes in the physical, chemical, and biological attributes of sediments below and the water column around aquaculture installations (e.g., Tovar et al., 2000; Borja et al., 2009; Forchino et al., 2011; Sarà et al., 2011; Farmaki et al., 2014; Tomassetti et al., 2016). Most studies demonstrate reduced impacts of shellfish aquaculture than finfish aquaculture because shellfish are grown at comparatively lower intensity and require no external feed (Shumway et al., 2003; McKindsey et al., 2006; Weise et al., 2009). However, shellfish farms typically cover a much greater area than finfish farms and may affect the surrounding environment differently (Weise et al., 2009).
Benthic macrofauna have long been used as indicators of environmental health and trends in coastal marine ecosystems (Borja et al., 2009; Forchino et al., 2011; Tomassetti et al., 2016). We therefore investigated spatio-temporal dynamics of benthic macrofaunal community structure in relation to changes in multiple environmental factors including the rehabilitation of coastal aquaculture facilities in Onagawa Bay following the 2011 Tohoku earthquake and tsunami. Our study addresses four lines of investigation:
(1) characterize spatio-temporal dynamics of benthic macrofaunal community structure;
(2) describe spatio-temporal variation in major environmental variables;
(3) map spatio-temporal distribution of coastal aquaculture facilities to estimate changes in the location, number, and total area of aquaculture facilities;
(4) examine the relationship between macrofaunal community structure and the explanatory environmental variables described above.
In addition, we extracted a subset of an external survey data collected near our sampling locations before the 2011 disaster as a baseline for comparison. Our overall aim is to provide insight into the environmental and anthropogenic factors most strongly related to the recovery of seafloor biota and coastal environmental health in this region.
Materials and Methods
Study Site
Onagawa Bay has an area of 27.15 km2, located at the southernmost part of a ria coastline, known locally as the “Sanriku Coast,” on the Pacific Ocean of northern Japan (Figure 1). Geologically, this stretch of coast was formed by a combination of sea level rise and the submergence of mountains and river valleys that resulted in an extremely irregular and indented coastline. Onagawa Bay is also a natural sheltered deep-water harbor with a mean depth of 33 m, which makes it suitable for coastal aquaculture.
Onagawa Bay Monthly Survey on RV Suikoh
Most of our data were collected during the Onagawa Bay Monthly Survey on board RV Suikoh between March 2012 and January 2018. A total of 12 sampling stations (i.e., St.1–8, 11, 12, 16, and 17) were established to monitor multiple environmental parameters (Figure 1 and Table 1). Benthic and physical measurements were made at all 12 stations only in March 2012 (Supplementary Figure 1). Thereafter, benthic sampling was conducted mainly at St.1, 3, 4, 6, 8, 11, 12, 16, and 17 (nine stations) on a monthly basis between May 2012 and March 2014, which we reduced to every 2 months from March 2014 onward.
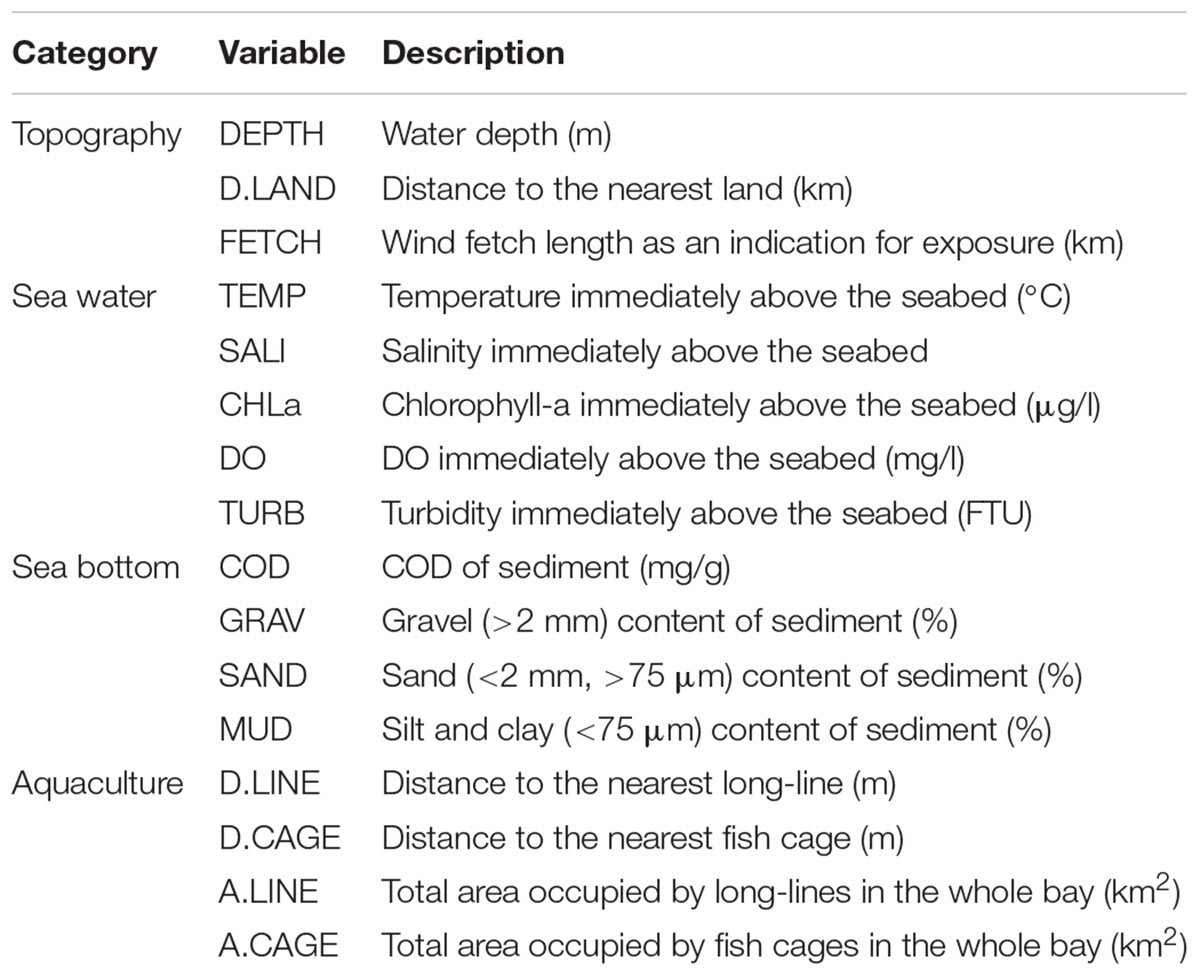
Table 1. Description of environmental variables used in this study.
We sampled a total of four sediment samples at each station using a Smith-McIntyre grab (sampling area: 0.05 m2). For benthic macrofauna, we sieved and merged three of the grab samples on a 1.0 mm mesh with filtered sea water on board. All organisms retained were preserved in 10% buffered formalin for subsequent sorting, species identification, counting, and biomass measurements. Species were identified to the lowest possible taxonomic level using a stereomicroscope and a compound microscope where necessary, expressing abundance and biomass (wet weight) as ind./m2 and g/m2, respectively. We then extracted subsamples of the top 5 and 1 cm of the sediment to determine particle size composition and chemical oxygen demand (COD), respectively. Particle size composition was determined using both dry sieving and sedimentation analysis and categorized into three size ranges defined here as “gravel” (GRAV: >2 mm), “sand” (SAND: <2 mm, >75 μm), and “mud” (MUD: <75 μm) (Table 1). COD (mg/g) was determined using a standardized solution of potassium permanganate as the oxidant (Table 1).
At each sampling station, we recorded profiles of water temperature (TEMP: °C), salinity (SALI), chlorophyll-a concentration (CHLa: μg/l), dissolved oxygen (DO: mg/l), and turbidity (TURB: FTU) using a CTD RINKO-Profiler (JFE Advantech Co., Ltd., Japan) including measurements immediately above the seabed (Table 1). Distance to the nearest land (km) (D.LAND) and wind fetch distance (km) (FETCH) were calculated as indicators of the exposure of coastal locations (Table 2). FETCH was determined as an average length (distance to the nearest land) of fetch vectors in 36 equiangular directions with a maximum distance set to 200 km if unobstructed by land, following Burrows et al. (2008) and Seers (2018).
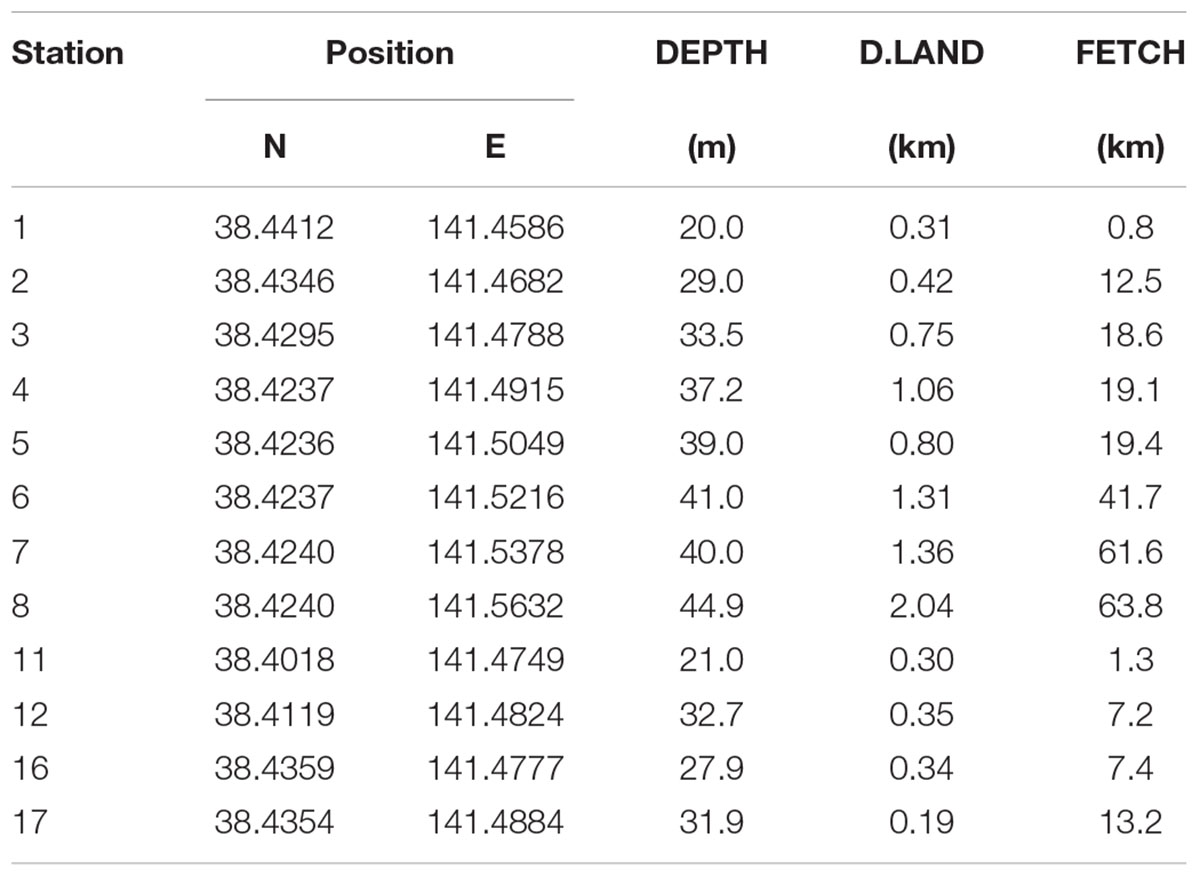
Table 2. Description of sampling stations for the Onagawa Bay Monthly Survey (DEPTH, D.LAND, and FETCH as in Table 1).
Aquaculture Facilities in Onagawa Bay
Aquaculture operations in Onagawa Bay commonly use two main methods. Hanging culture uses a long-line system to suspend cultured organisms such as oysters, scallops, and ascidians on vertical ropes, typically down to around 15–20 m in depth below surface floats, in contrast to floating fish cages used for farming salmonids. We digitized and mapped these floating aquaculture structures using time-series of high resolution satellite imagery to create distribution maps for the long-lines (polylines) and fish cages (polygons) for the whole of Onagawa Bay from 2011 March to 2017 March (Table 3). Each polyline represents a single unit of the long-line system which, in fact, comprises two parallel lines of the same length (typically ∼100 m), approximately 1.5 m apart and connected at regular intervals by floats and/or ropes. We estimated the sea surface area occupied by each long-line by creating a buffer of 0.75 m around each polyline and then computing the area of the buffer zone (polygon).
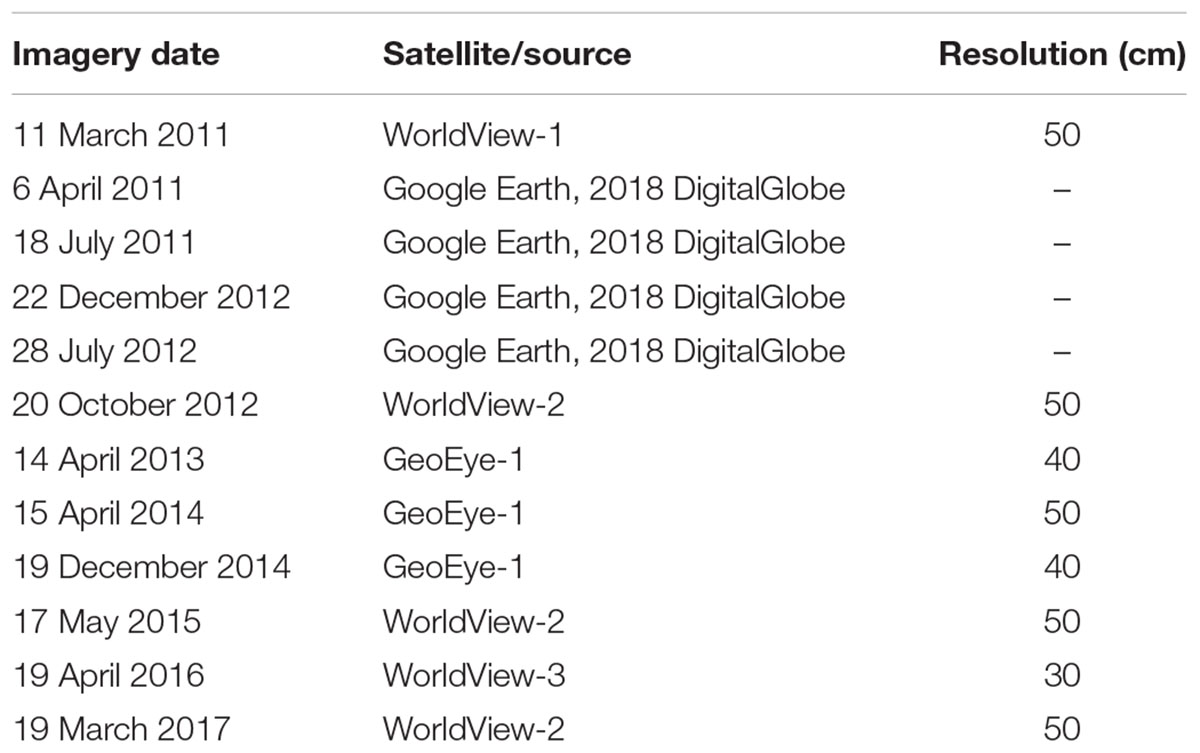
Table 3. A list of satellite data used in this study.
Data Analysis
We identified structural and spatio-temporal trends in the macrofauna data in Onagawa Bay using multivariate community analysis in PRIMER v6 (Clarke and Warwick, 2001). Following fourth-root transformation of macrofauna counts to down-weight the influence of highly abundant species, we performed cluster analysis (group-average linkage) on a resemblance matrix of the transformed data based on the Bray–Curtis similarity index. A similarity profile (SIMPROF) permutation test on the resemblance matrix identified statistically significant clusters (significance level, p < 0.01). SIMPER (similarity percentage) analysis then identified those species most responsible for the similarity within the groups determined by the cluster analysis.
We assessed general temporal trends by constructing time series for the 16 environmental variables (Table 1) and normalized them to generate a resemblance matrix based on Euclidean distance for conducting RELATE routines and BIO-ENV stepwise (BEST) analysis. RELATE routines examined potential differences in macrofaunal community structure between the clusters in relation to each of the 16 environmental variables. The BEST procedure examined rank correlations between the multivariate patterns of macrofauna and environmental factors to identify the subsets of variables that best explained the overall pattern. We then examined the biological metrics of each cluster group (i.e., abundance, biomass, species richness, and Shannon’s diversity index H′) using box plots. Further, based on the BEST procedures, we assessed those environmental variables that significantly explained the macrofaunal variation using the same approach.
In addition, we extracted a subset of external data collected before the 2011 disaster from annual measurements of warm drainage water from the Onagawa nuclear power plant (Miyagi Prefecture and Tohoku Electric Power Company, 2010, 2011, 2012). This program has monitored a wide range of physical and biological data in Onagawa Bay since 1981. The program conducted benthic surveys twice a year in February and August at 18 sampling stations, of which 5 sites, namely TE1, 4, 6, 8, and 18, were close to sampling stations of St.1, 17, 11, 6, and 8, respectively, in our study (Figure 1), reporting the following information: (1) total abundance of macrofauna (ind./m2); (2) species richness of macrofauna; (3) SAND (%); (4) MUD (%); (5) GRAV (%); and (6) COD (mg/g) (coding of environmental variables as in Table 1). The survey reports include details on sampling methods and protocols (Miyagi Prefecture and Tohoku Electric Power Company, 2010, 2011, 2012). We extracted data for August and February in each year from 2008 to 2011 (pre-tsunami: n = 6 per variable at TE1, 4, 6, 8, and 18), for comparison of mean values with our corresponding data for July and January from 2015 to 2018 in the present study (post-tsunami: n = 6 per variable at St.1, 17, 11, 6, and 8).
We constructed distribution maps for the aquaculture facilities using ESRI ArcGIS 10.5 and calculated values for FETCH using “fetchR” package (Seers, 2018). All the graphics relating to the multivariate analysis were constructed using R version 3.4.1 package (R Development Core Team, 2017).
Results
Benthic Macrofaunal Community Structure
We collected a total of 382 benthos samples and identified 492 species comprising 191 from the class Polychaeta (38.8%), 65 from the class Bivalvia (13.2%), 53 from the order Amphipoda (10.8%), 47 from the order Decapoda (9.6%), 46 from the class Gastropoda (9.3%), 21 from the phylum Echinodermata (4.3%), and 69 others (14.0%). Macrofaunal abundance, species richness, and Shannon index H′ were lowest soon after the 2011 disaster, but increased rapidly over subsequent years to peak values toward the end of the study period (Figures 2A,C,D). Macrofaunal biomass decreased slightly shortly after sampling began, but then increased toward the end of the study period (Figure 2B).
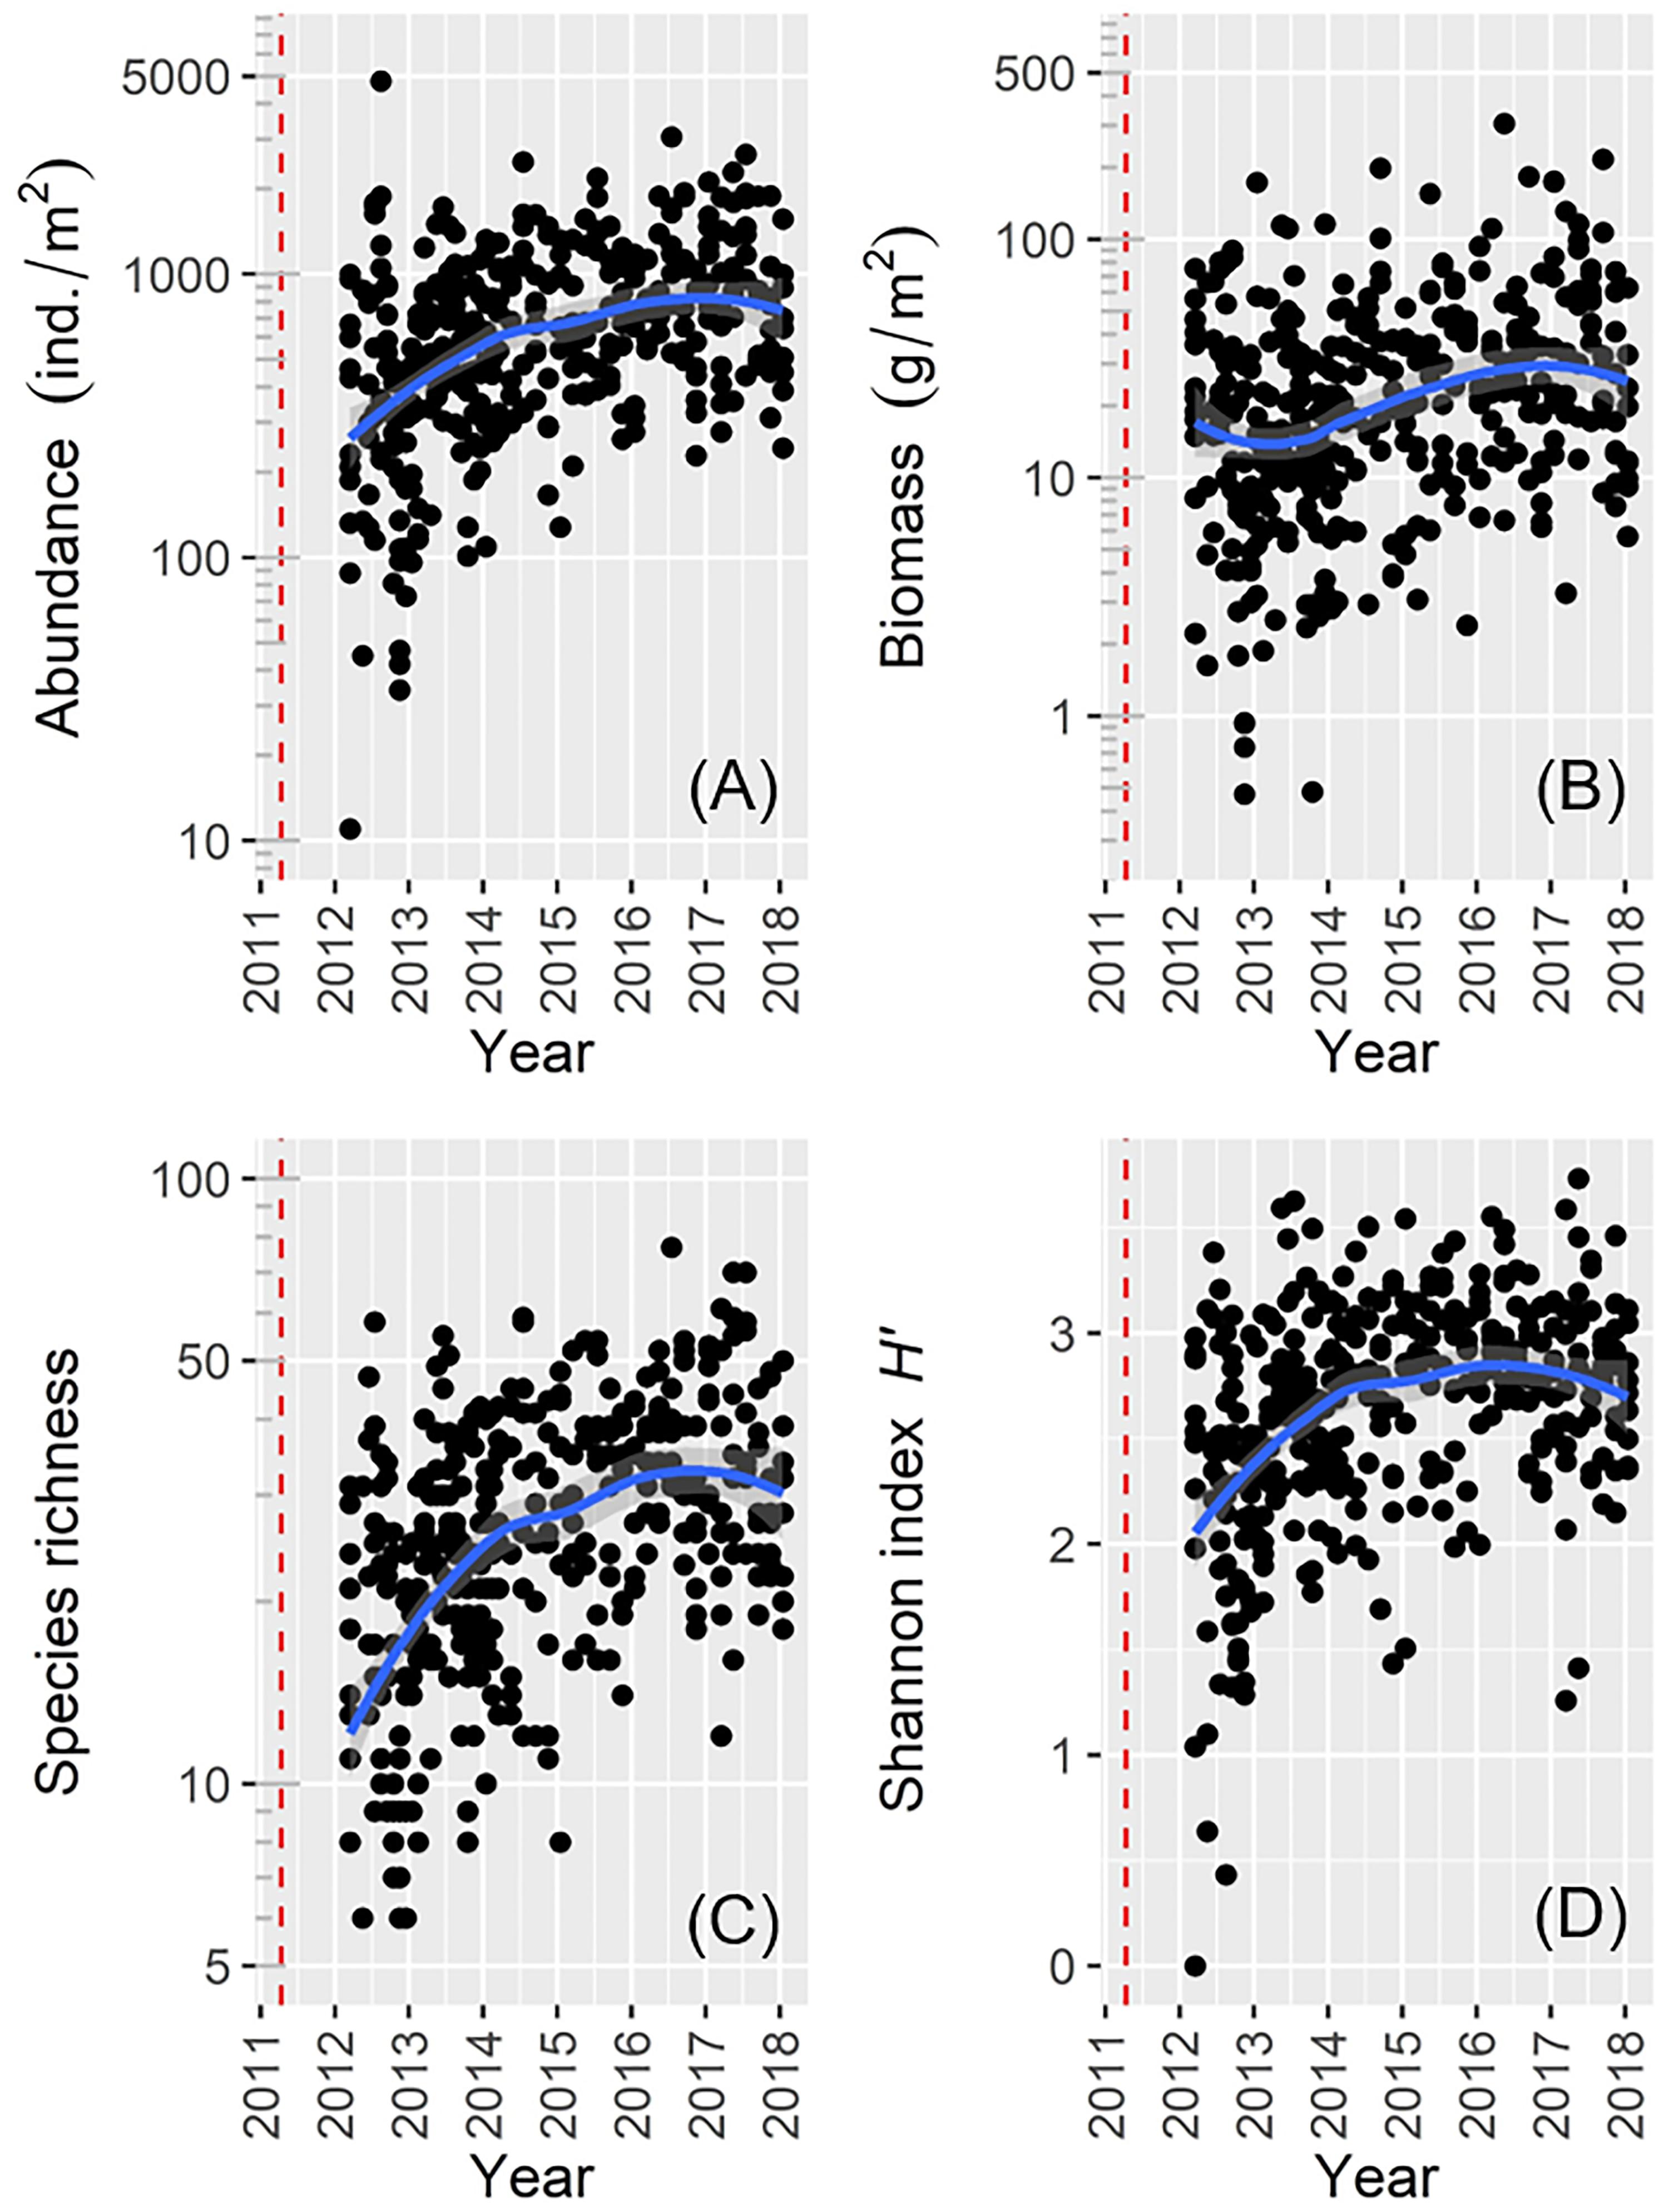
Figure 2. Scatter plots showing general temporal trends of macrofaunal data for: (A) abundance; (B) biomass; (C) species richness; (D) Shannon’s index H′ (the red dotted line denotes the date of the 2011 disaster).
Cluster analysis and a SIMPROF test revealed 11 distinctive macrofaunal groups (Groups A–K) and outliers (OUT) that further subdivided into 40 statistically significant groups (Figure 3). While Groups A, D, B, and G comprised only 5 (1.3%), 5 (1.3%), 7 (1.8%), and 8 (2.1%) of the samples, respectively, the majority of samples were categorized into K (100 samples: 26.2%), I (77 samples: 20.2%), H (50 samples: 13.1%), and C (43 samples: 11.3%) groupings (Figure 3). Spatio-temporal patterns in benthic groups appeared largely random during the first year (Groups A–H except for Group C) (Figure 4). SIMPER indicated lowest average similarities in Groups A, B, and D (32.4, 28.4, and 31.7%, respectively). Relatively few species, e.g., Paraprionospio coora (Polychaeta), Capitella sp. (Polychaeta), and Theora fragilis (Bivalvia), were predominantly responsible for similarity within these groups (Figure 5). Groups H–K then began to occur consistently over space and time from the second year onward (Figure 4). The highest average percent similarity occurred in Group K (45.3%) and, except for Group C, the number of species responsible for similarities generally increased from Group A toward Group K (Figure 5). Group C occurred almost exclusively in the outermost part of Onagawa Bay (St.8) and remained essentially unchanged from the beginning to the end of our study (Figure 4). Despite relatively low percent similarity (35.3%), Group C contained high numbers of species, including several crustaceans, e.g., Byblis japonicus (Amphipoda), Ampelisca naikaiensis (Amphipoda), and Iphinoe sagamiensis (Cumacea), that contributed to average similarity within this group (Figure 5).
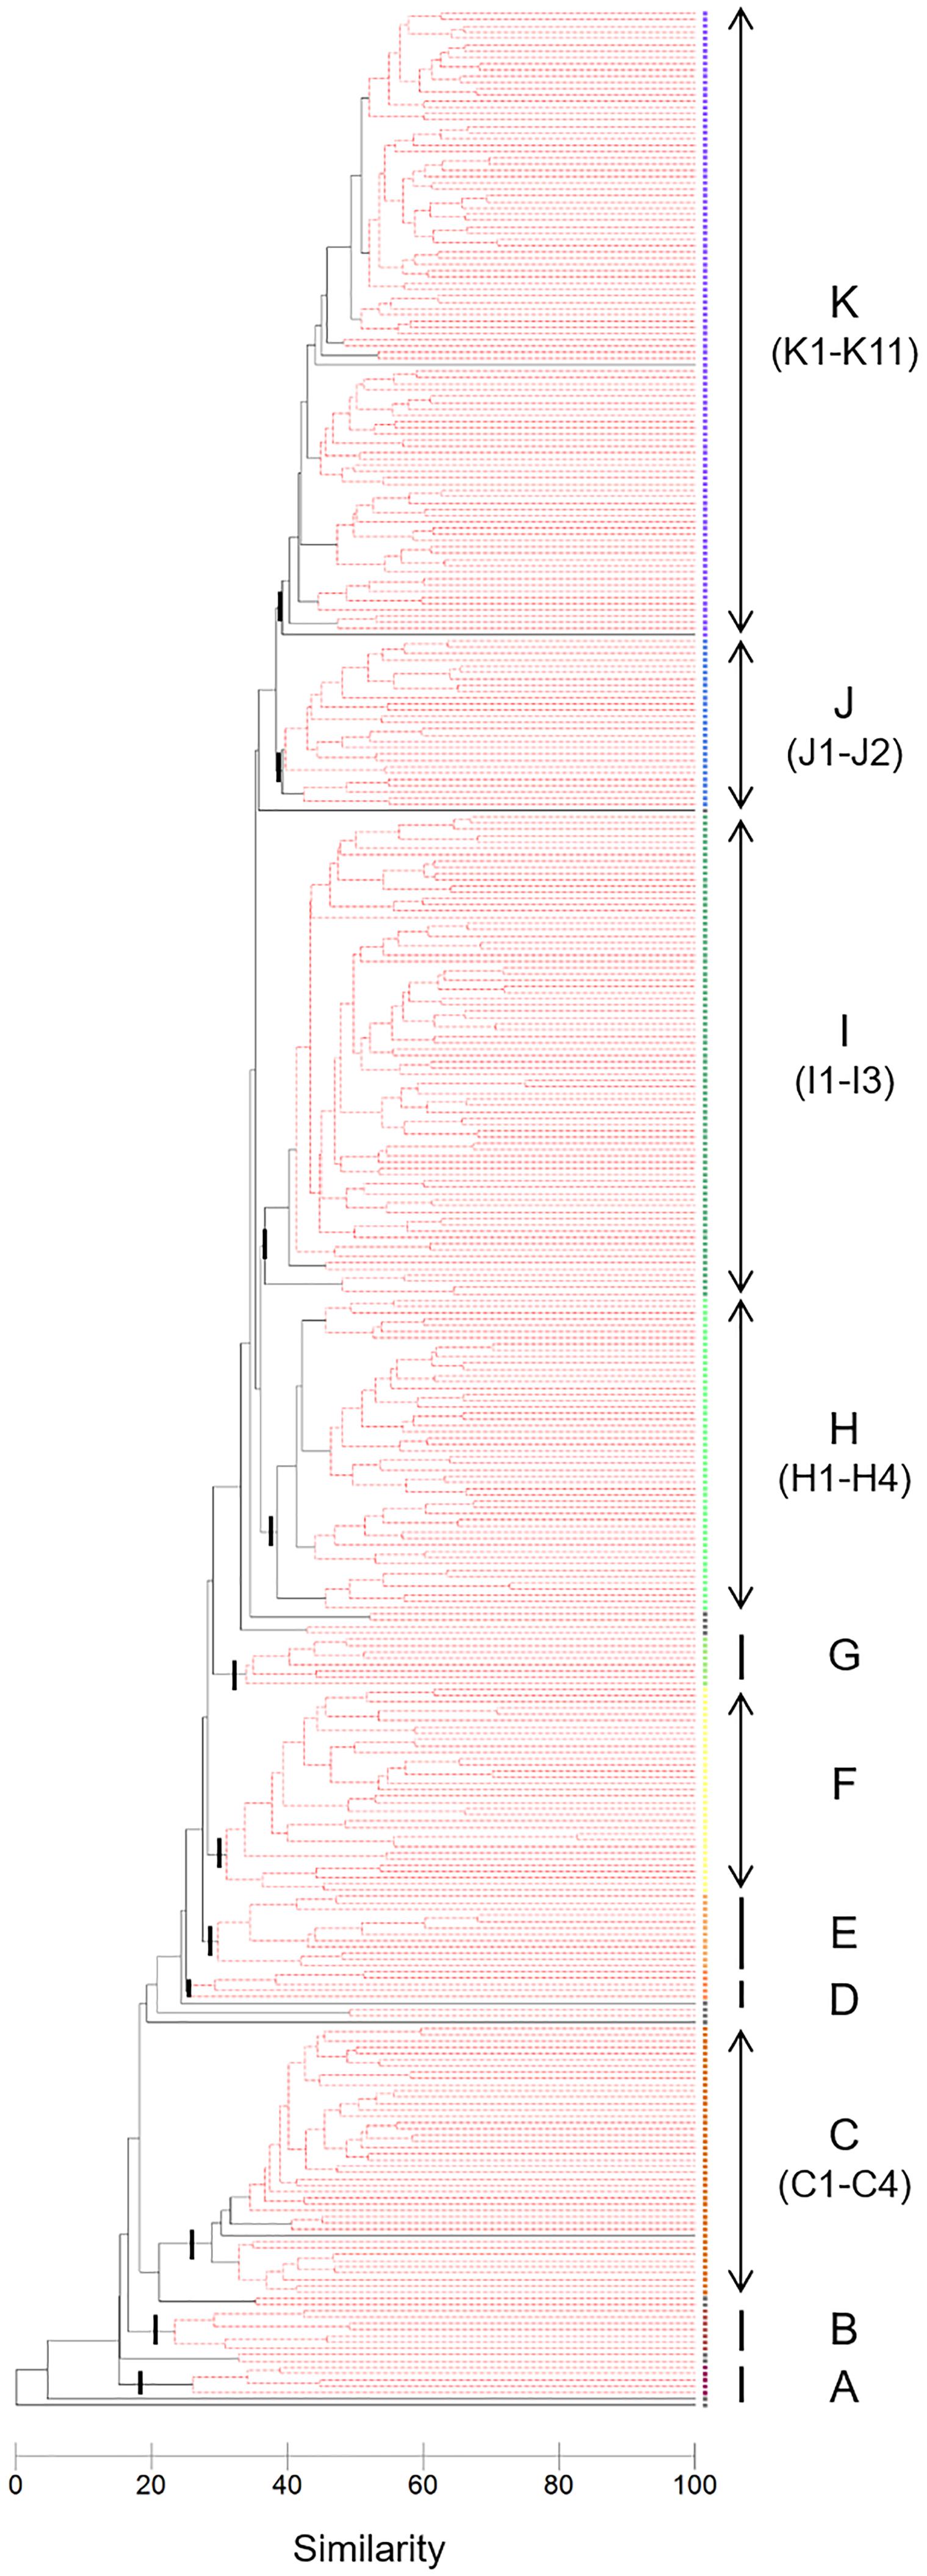
Figure 3. Dendrogram based on fourth-root transformation, Bray–Curtis similarity, and group-average clustering. The SIMPROF test identified 11 main clusters (A–K) with a total of 40 significant sub-divided groups (black branches, p < 0.01).
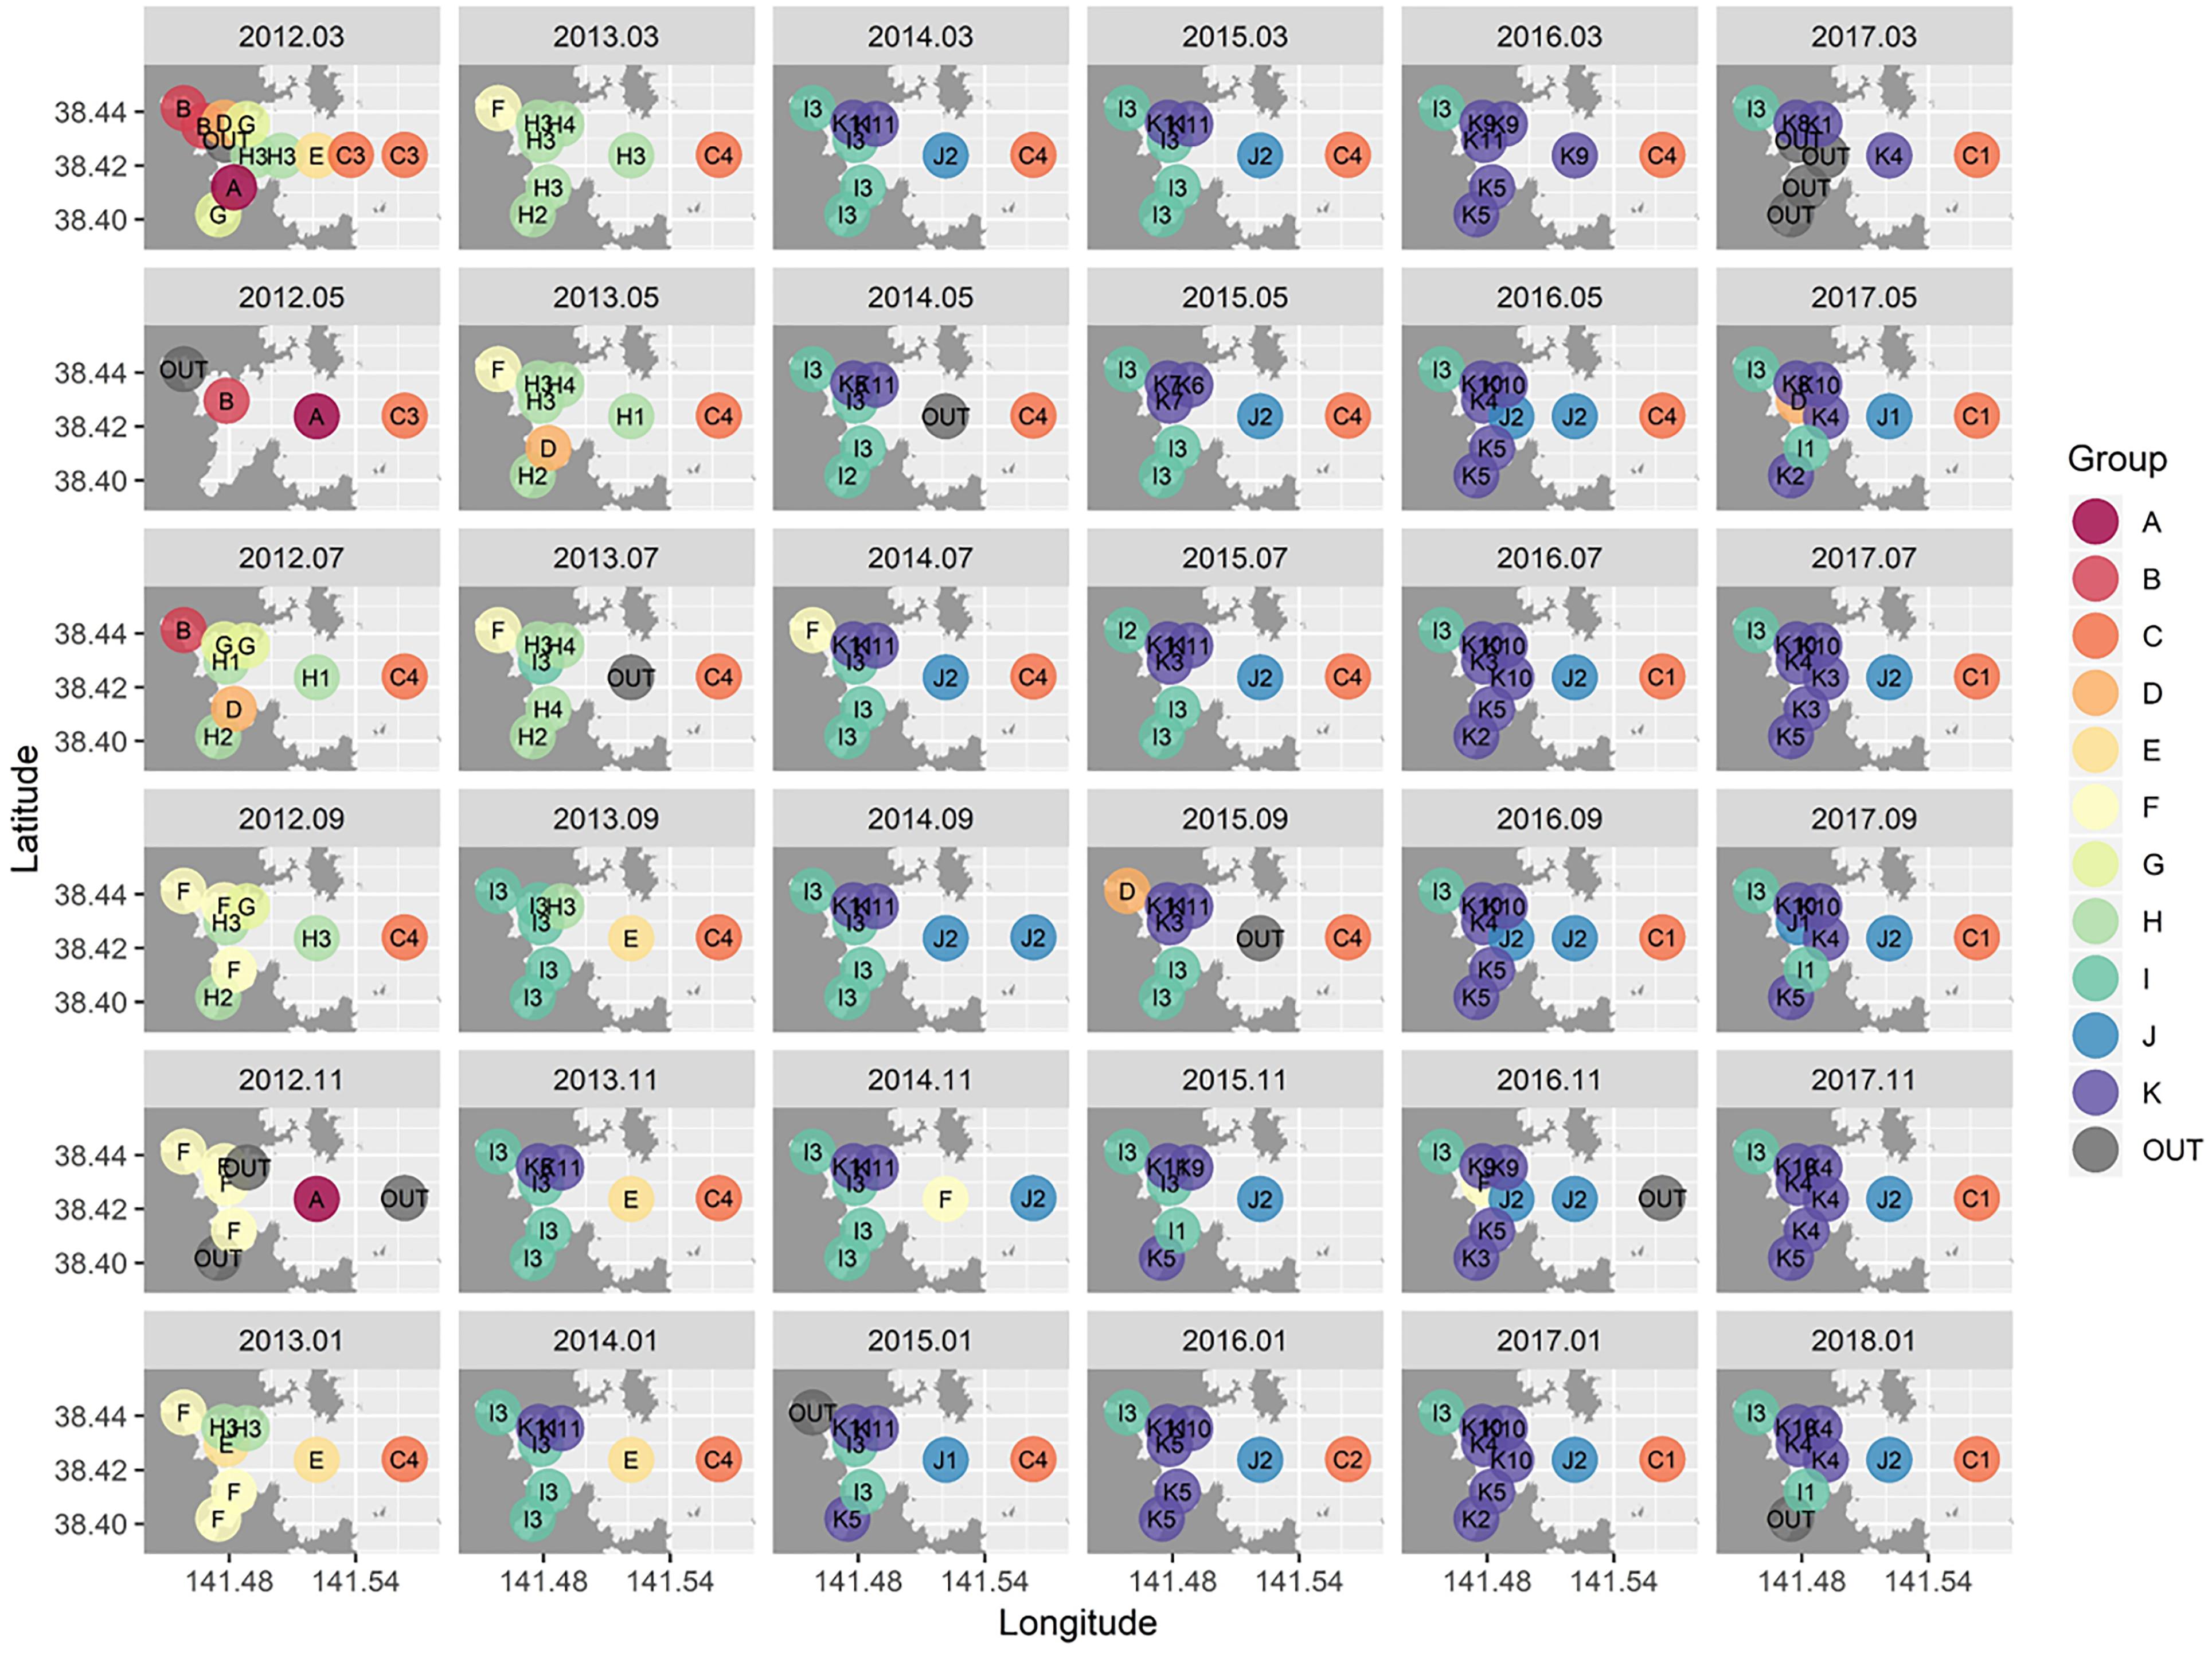
Figure 4. Spatio-temporal distribution maps for benthic macrofaunal community structure in Onagawa Bay from March 2012 (top-left corner) to January 2018 (bottom-right corner). The 11 main clusters (A–K) with a total of 40 significant sub-divided groups (labels in the maps) were identified based on the SIMPROF test (p < 0.01).
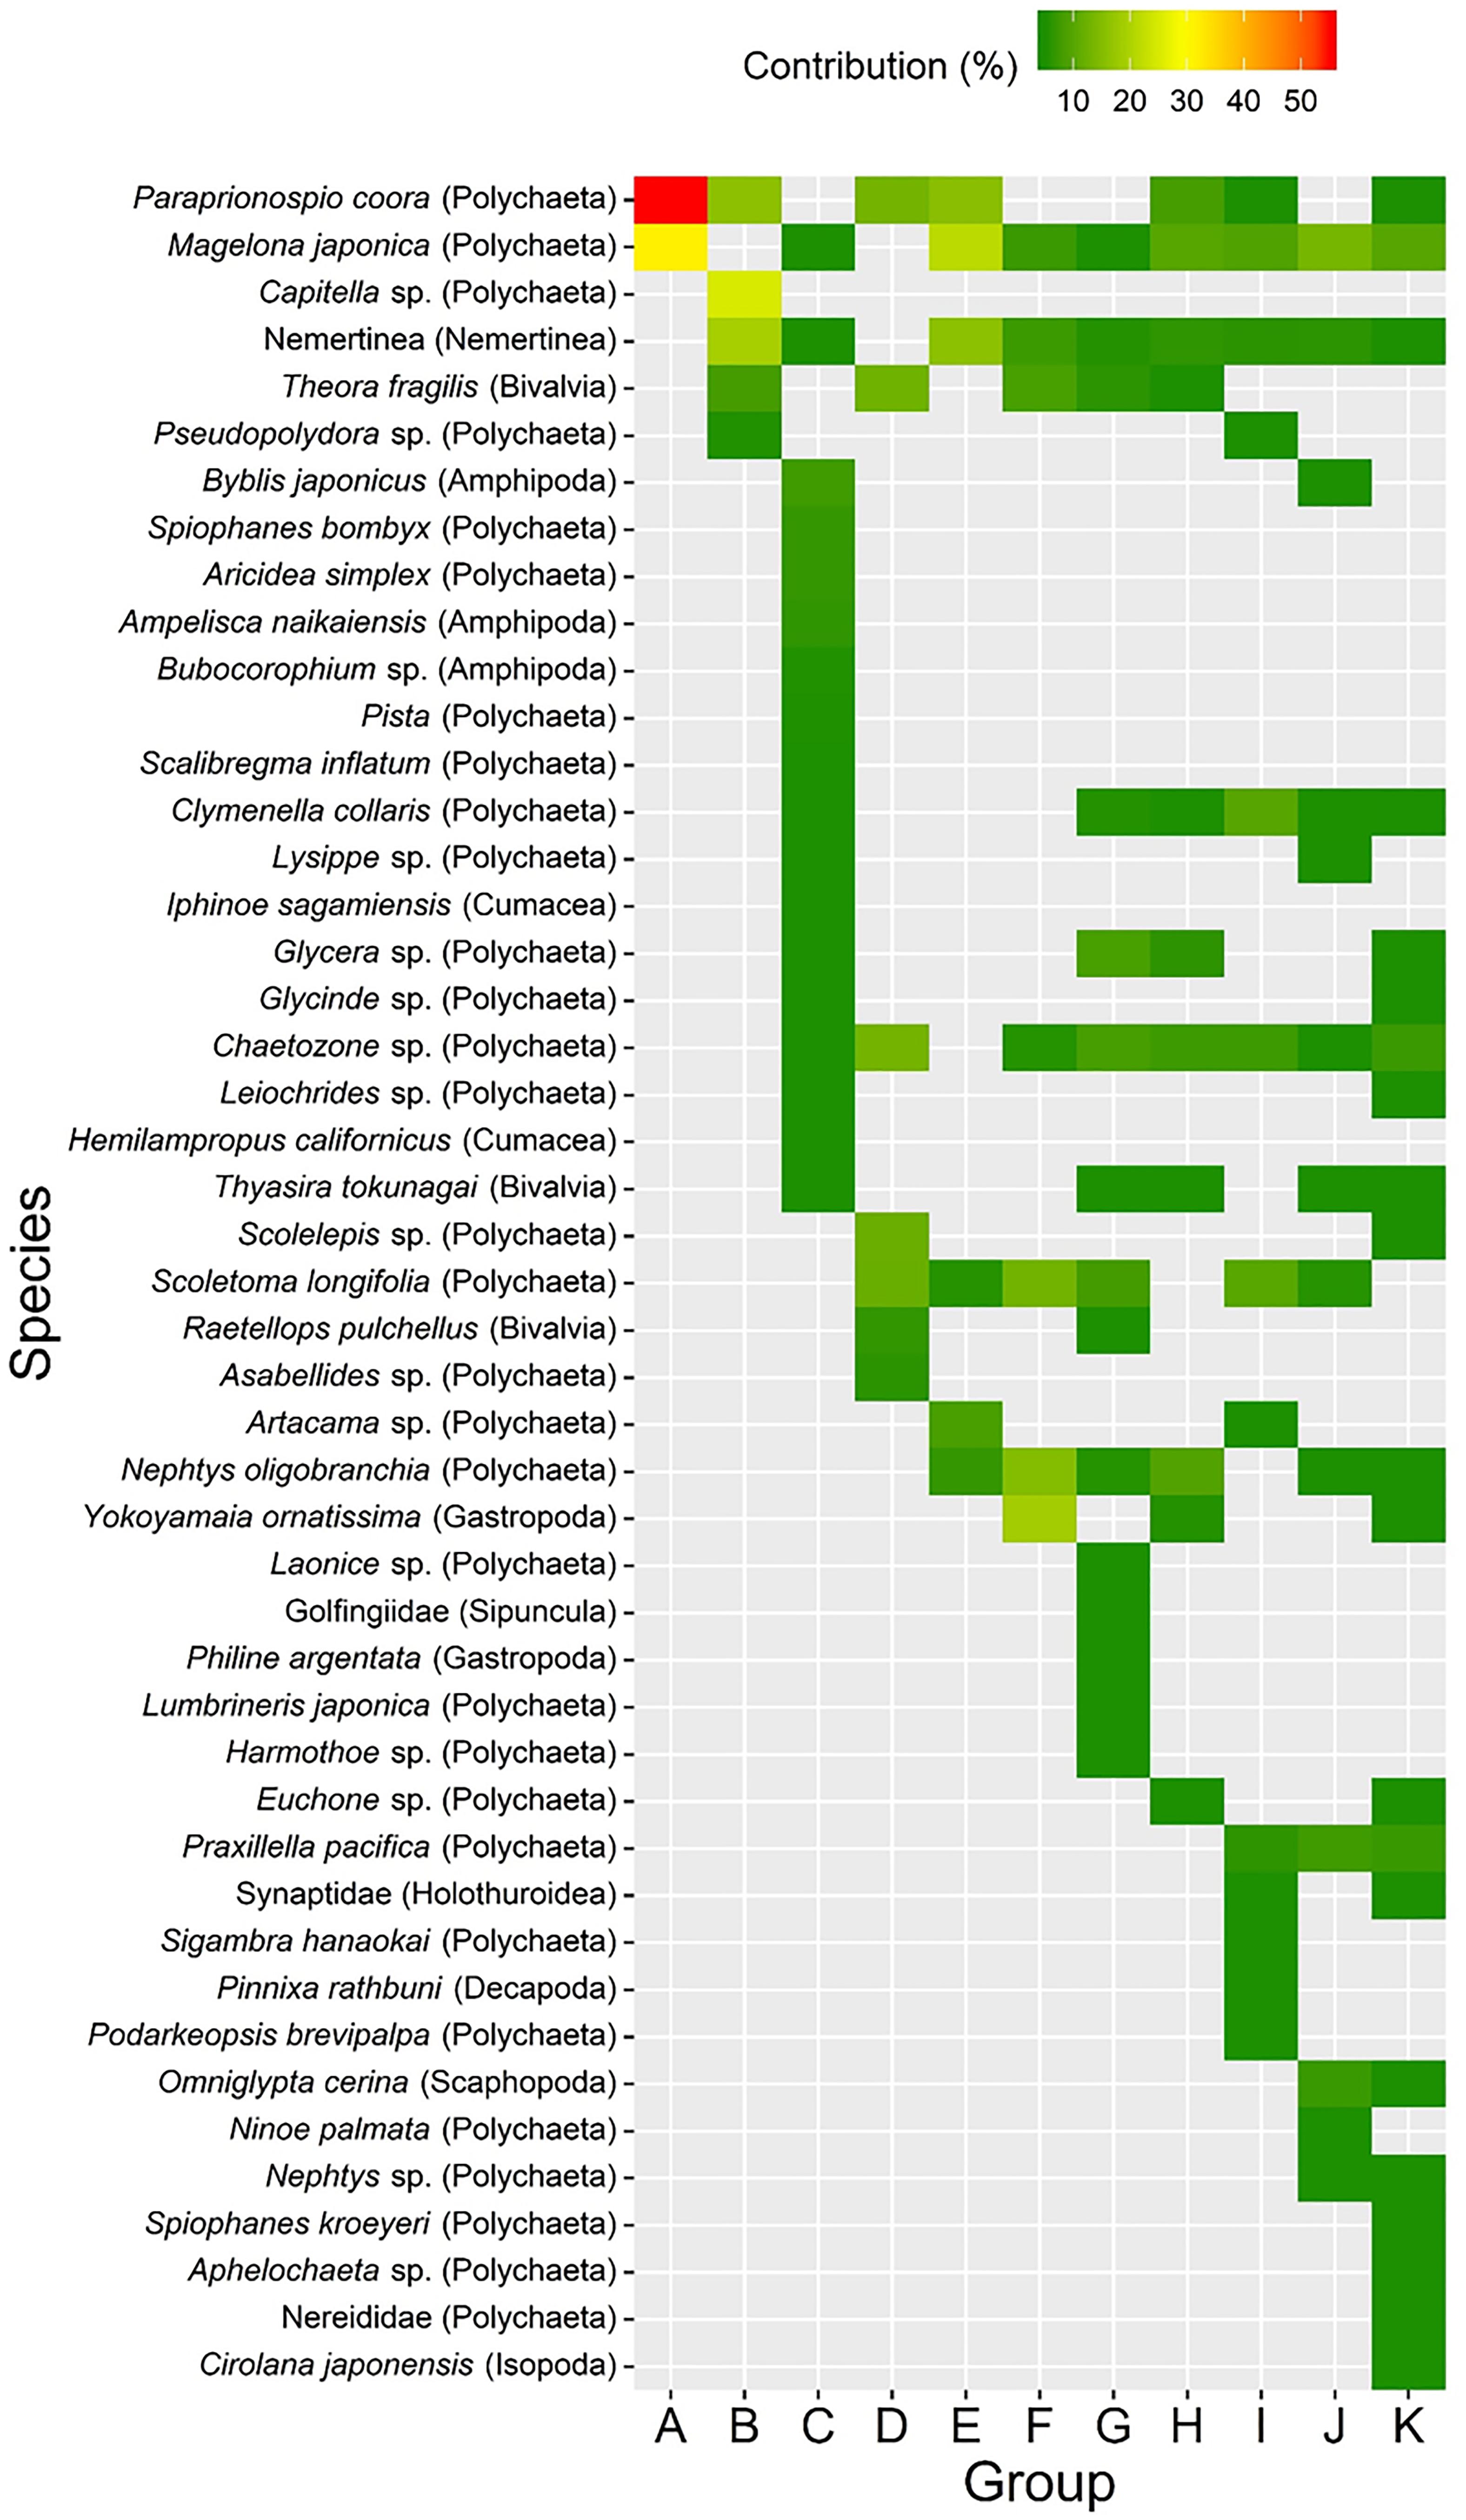
Figure 5. Results of SIMPER analysis showing percentage contributions of macrofaunal species that accounted for most of the similarity (>70%) within each of the 11 cluster groups (A–K).
Environmental Parameters
Temperatures (TEMP), chlorophyll-a concentration (CHLa), and DO clearly demonstrated an annual (seasonal) cycle at all nine stations (Figures 6A,C,D). TEMP varied little among stations (Figure 6A), whereas CHLa was disproportionately higher at times at several locations (e.g., St.1, 3, 12, and 17) (Figure 6C). Further, at St.1 only, summer minimum DO became much lower in recent years (Figure 6D). Values for both salinity (SALI) and turbidity (TURB) fluctuated between 33–34 and 0–10, respectively, although these ranges were exceeded in several instances (Figures 6B,E). COD and sediment fraction of both sand (SAND) and mud (MUD) varied distinctively among stations, with St.1 and St.8 often at opposite ends of the spectrum (Figures 6F,H,I). COD at St.1 was almost always the highest and St.8 the lowest, with some distinct peaks for most stations at the beginning and toward the end of the study period (Figure 6F). Sediment grain size at St.8 consistently contained a very high proportion of sand and little mud (Figures 6H,I). Nonetheless, a higher fraction of mud and lower fraction of sand characterized all stations at the beginning of our study, but stations gradually became increasingly sandy toward the end (Figures 6H,I). Relatively high fractions of gravel recurred at St.17 and, less frequently, at St.1 and 11 (Figure 6G).
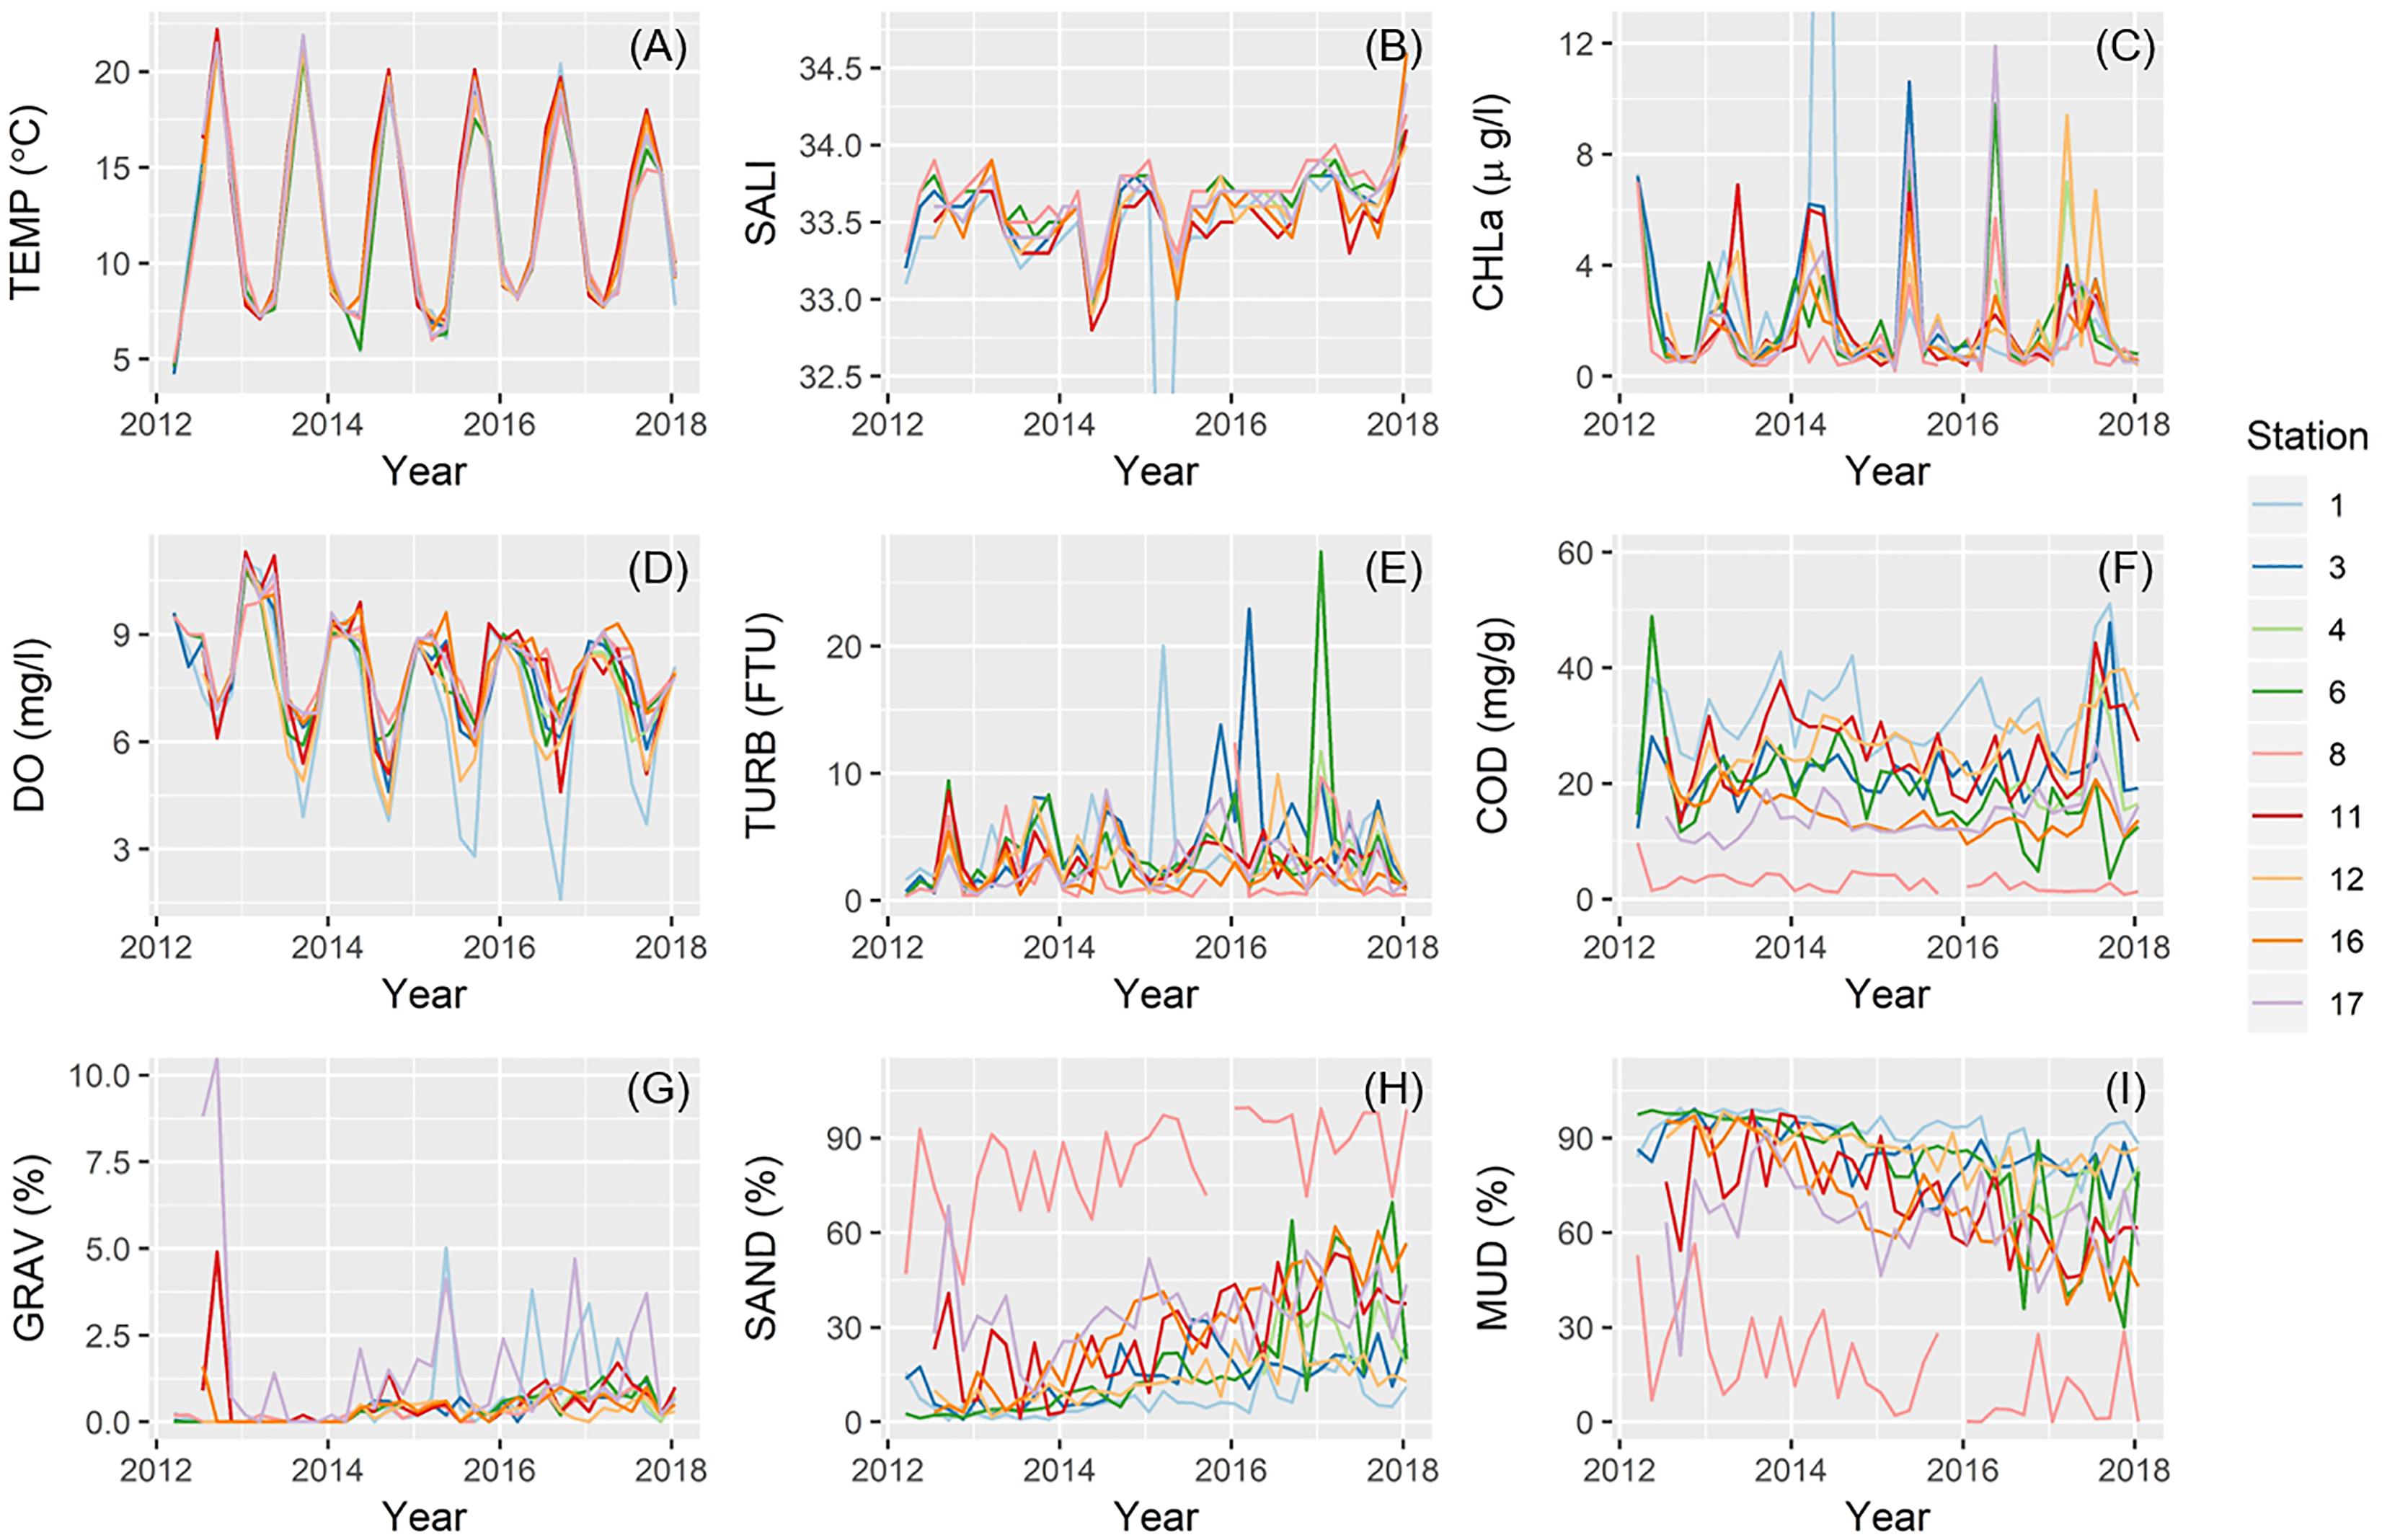
Figure 6. Temporal change in environmental parameters across sampling stations for: (A) temperature; (B) salinity; (C) chlorophyll-a concentration; (D) DO; (E) turbidity; (F) COD; (G) gravel content; (H) sand content; and (I) mud content.
Aquaculture Facilities in Onagawa Bay
In March 2011 (just before the 2011 disaster), the 1217 long-lines and 119 fish cages occurred mainly along low-energy coastal waters and inlets in Onagawa Bay (Figure 7A). After the complete removal of these facilities by the 2011 tsunami, 135 long-lines and 56 fish cages were re-constructed by February 2012 (Figures 7B,C), corresponding to 11.1 and 47.1% recovery, respectively (Figures 8A,B). By March 2017, the total surface area occupied by the long-lines and fish cages became 0.115 and 0.016 km2, i.e., 60.8 and 74.8% recovery, respectively (Figures 7D–H, 8C,D).
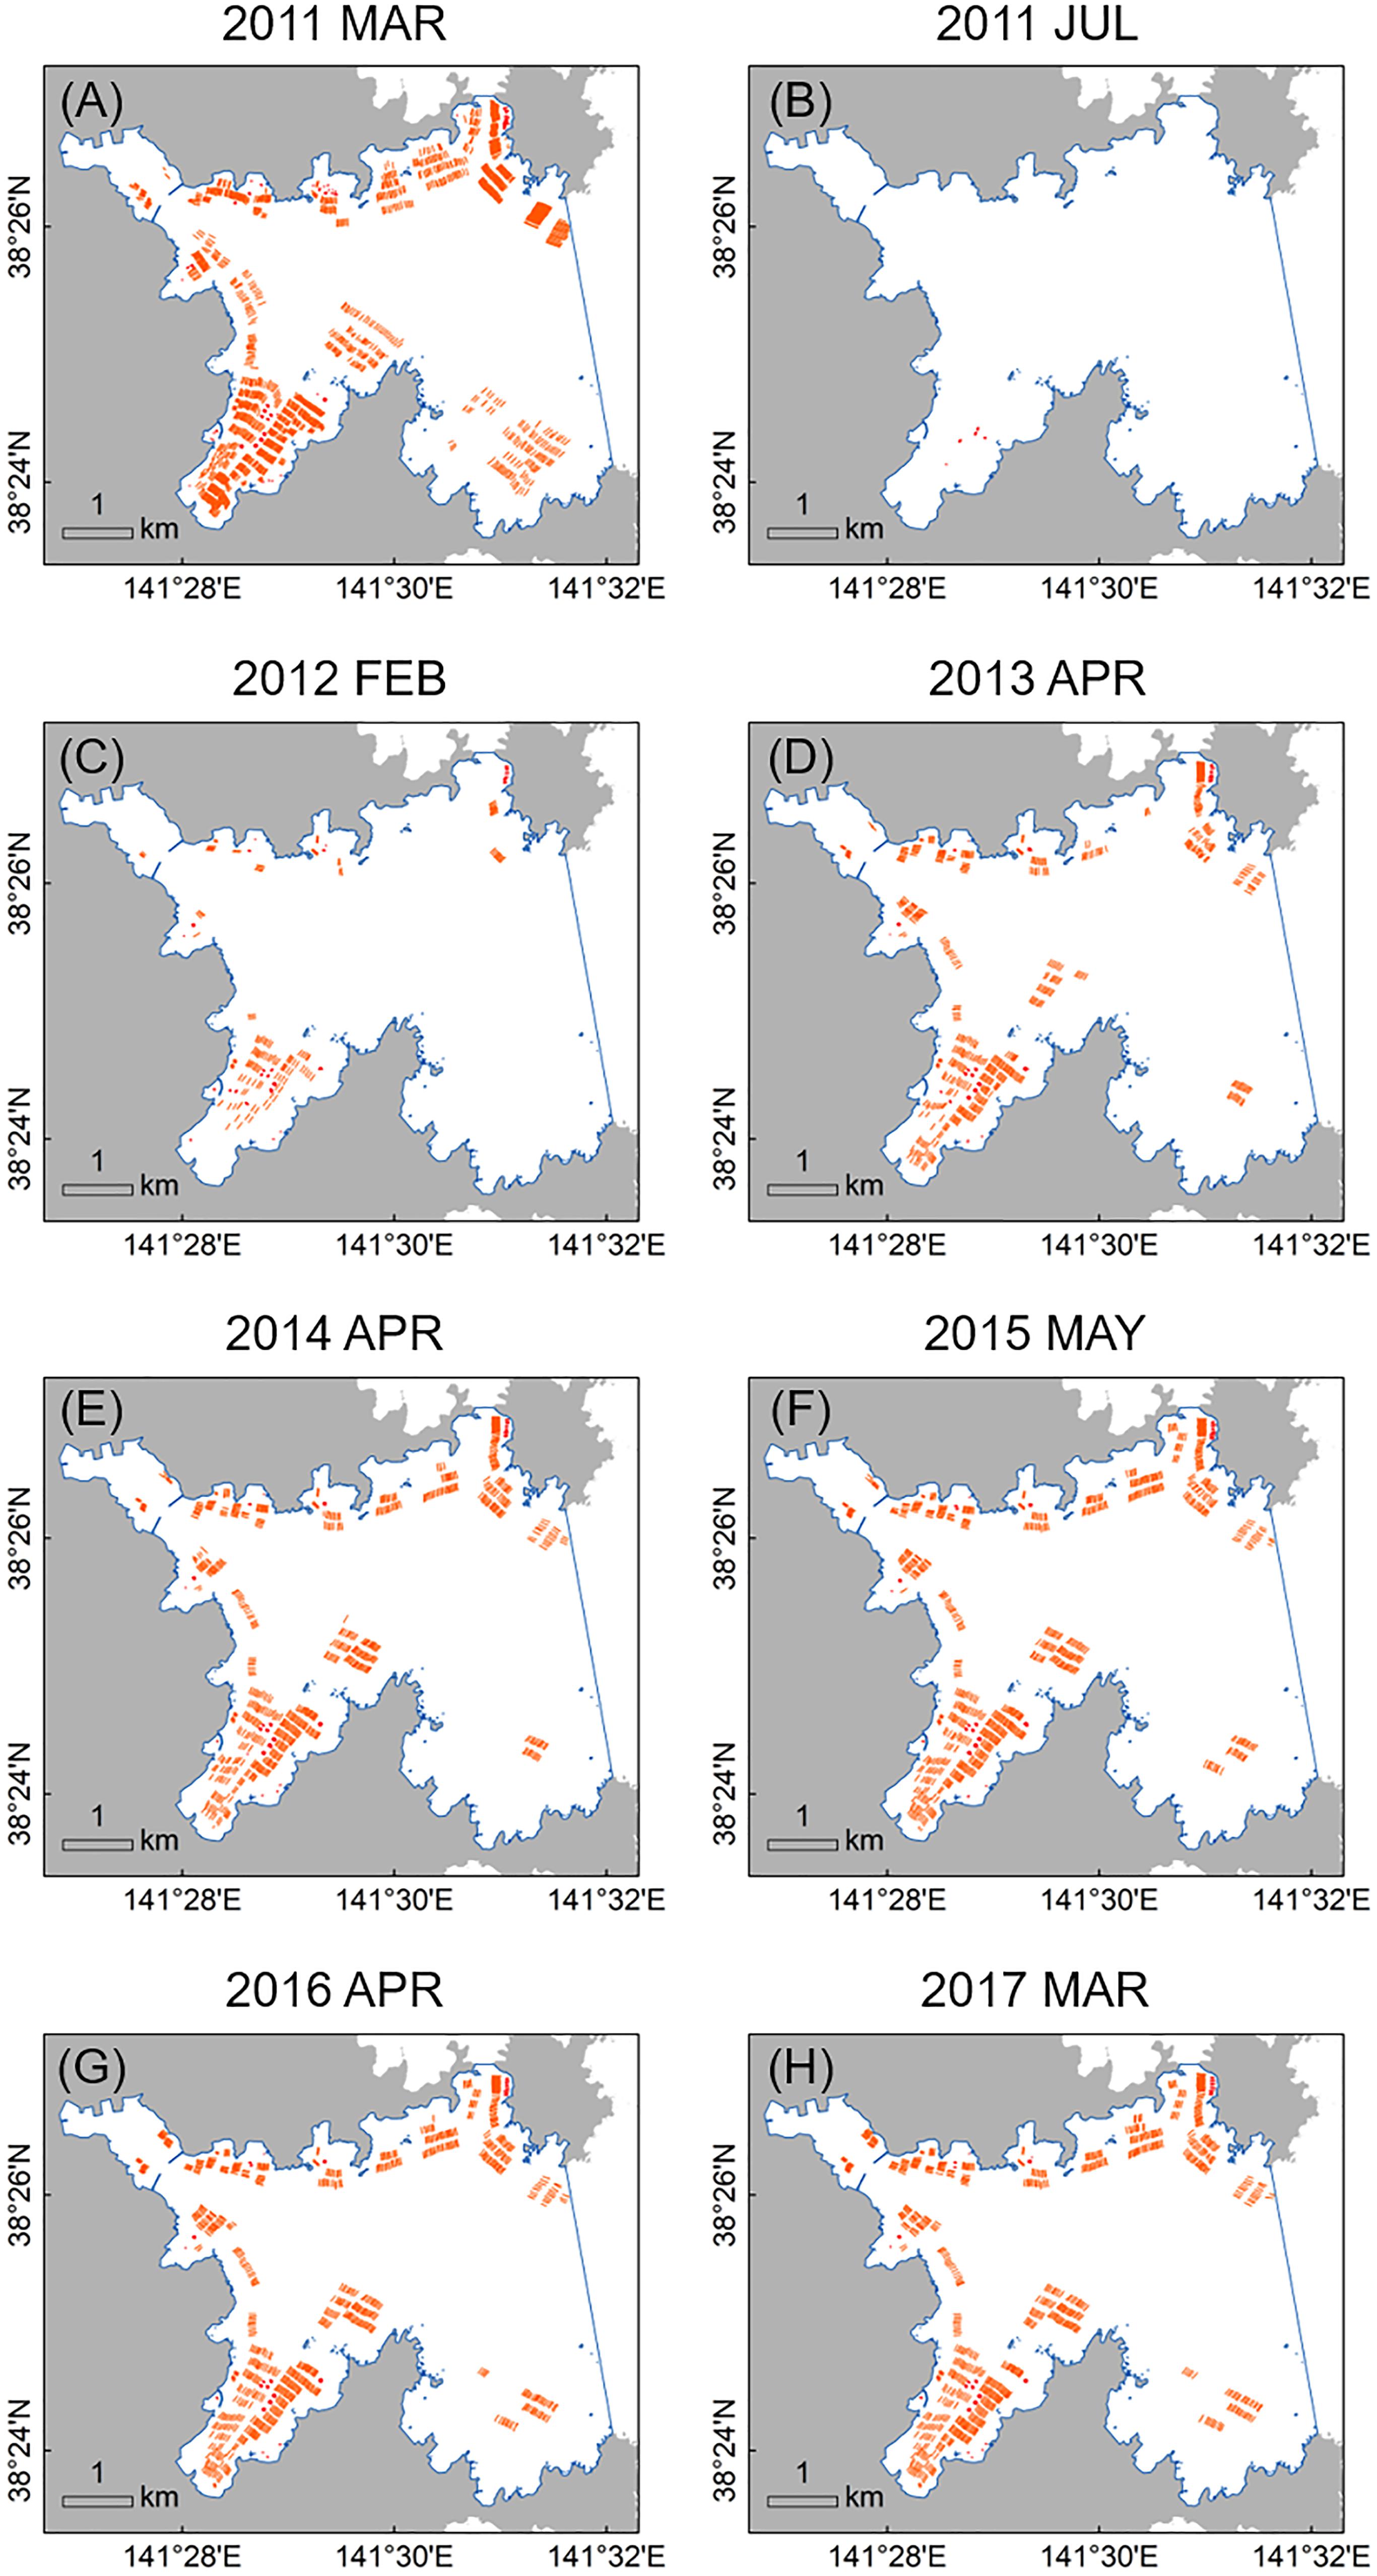
Figure 7. Time series of distribution maps for aquaculture facilities in Onagawa Bay (orange polylines and red polygons represent long-lines and fish cages, respectively, and blue solid line defines the boundary of Onagawa Bay for this study): (A) March 2011 (just before the 2011 earthquake and tsunami); (B) July 2011; (C) February 2012; (D) April 2013; (E) April 2014; (F) May 2015; (G) April 2016; and (H) March 2017.
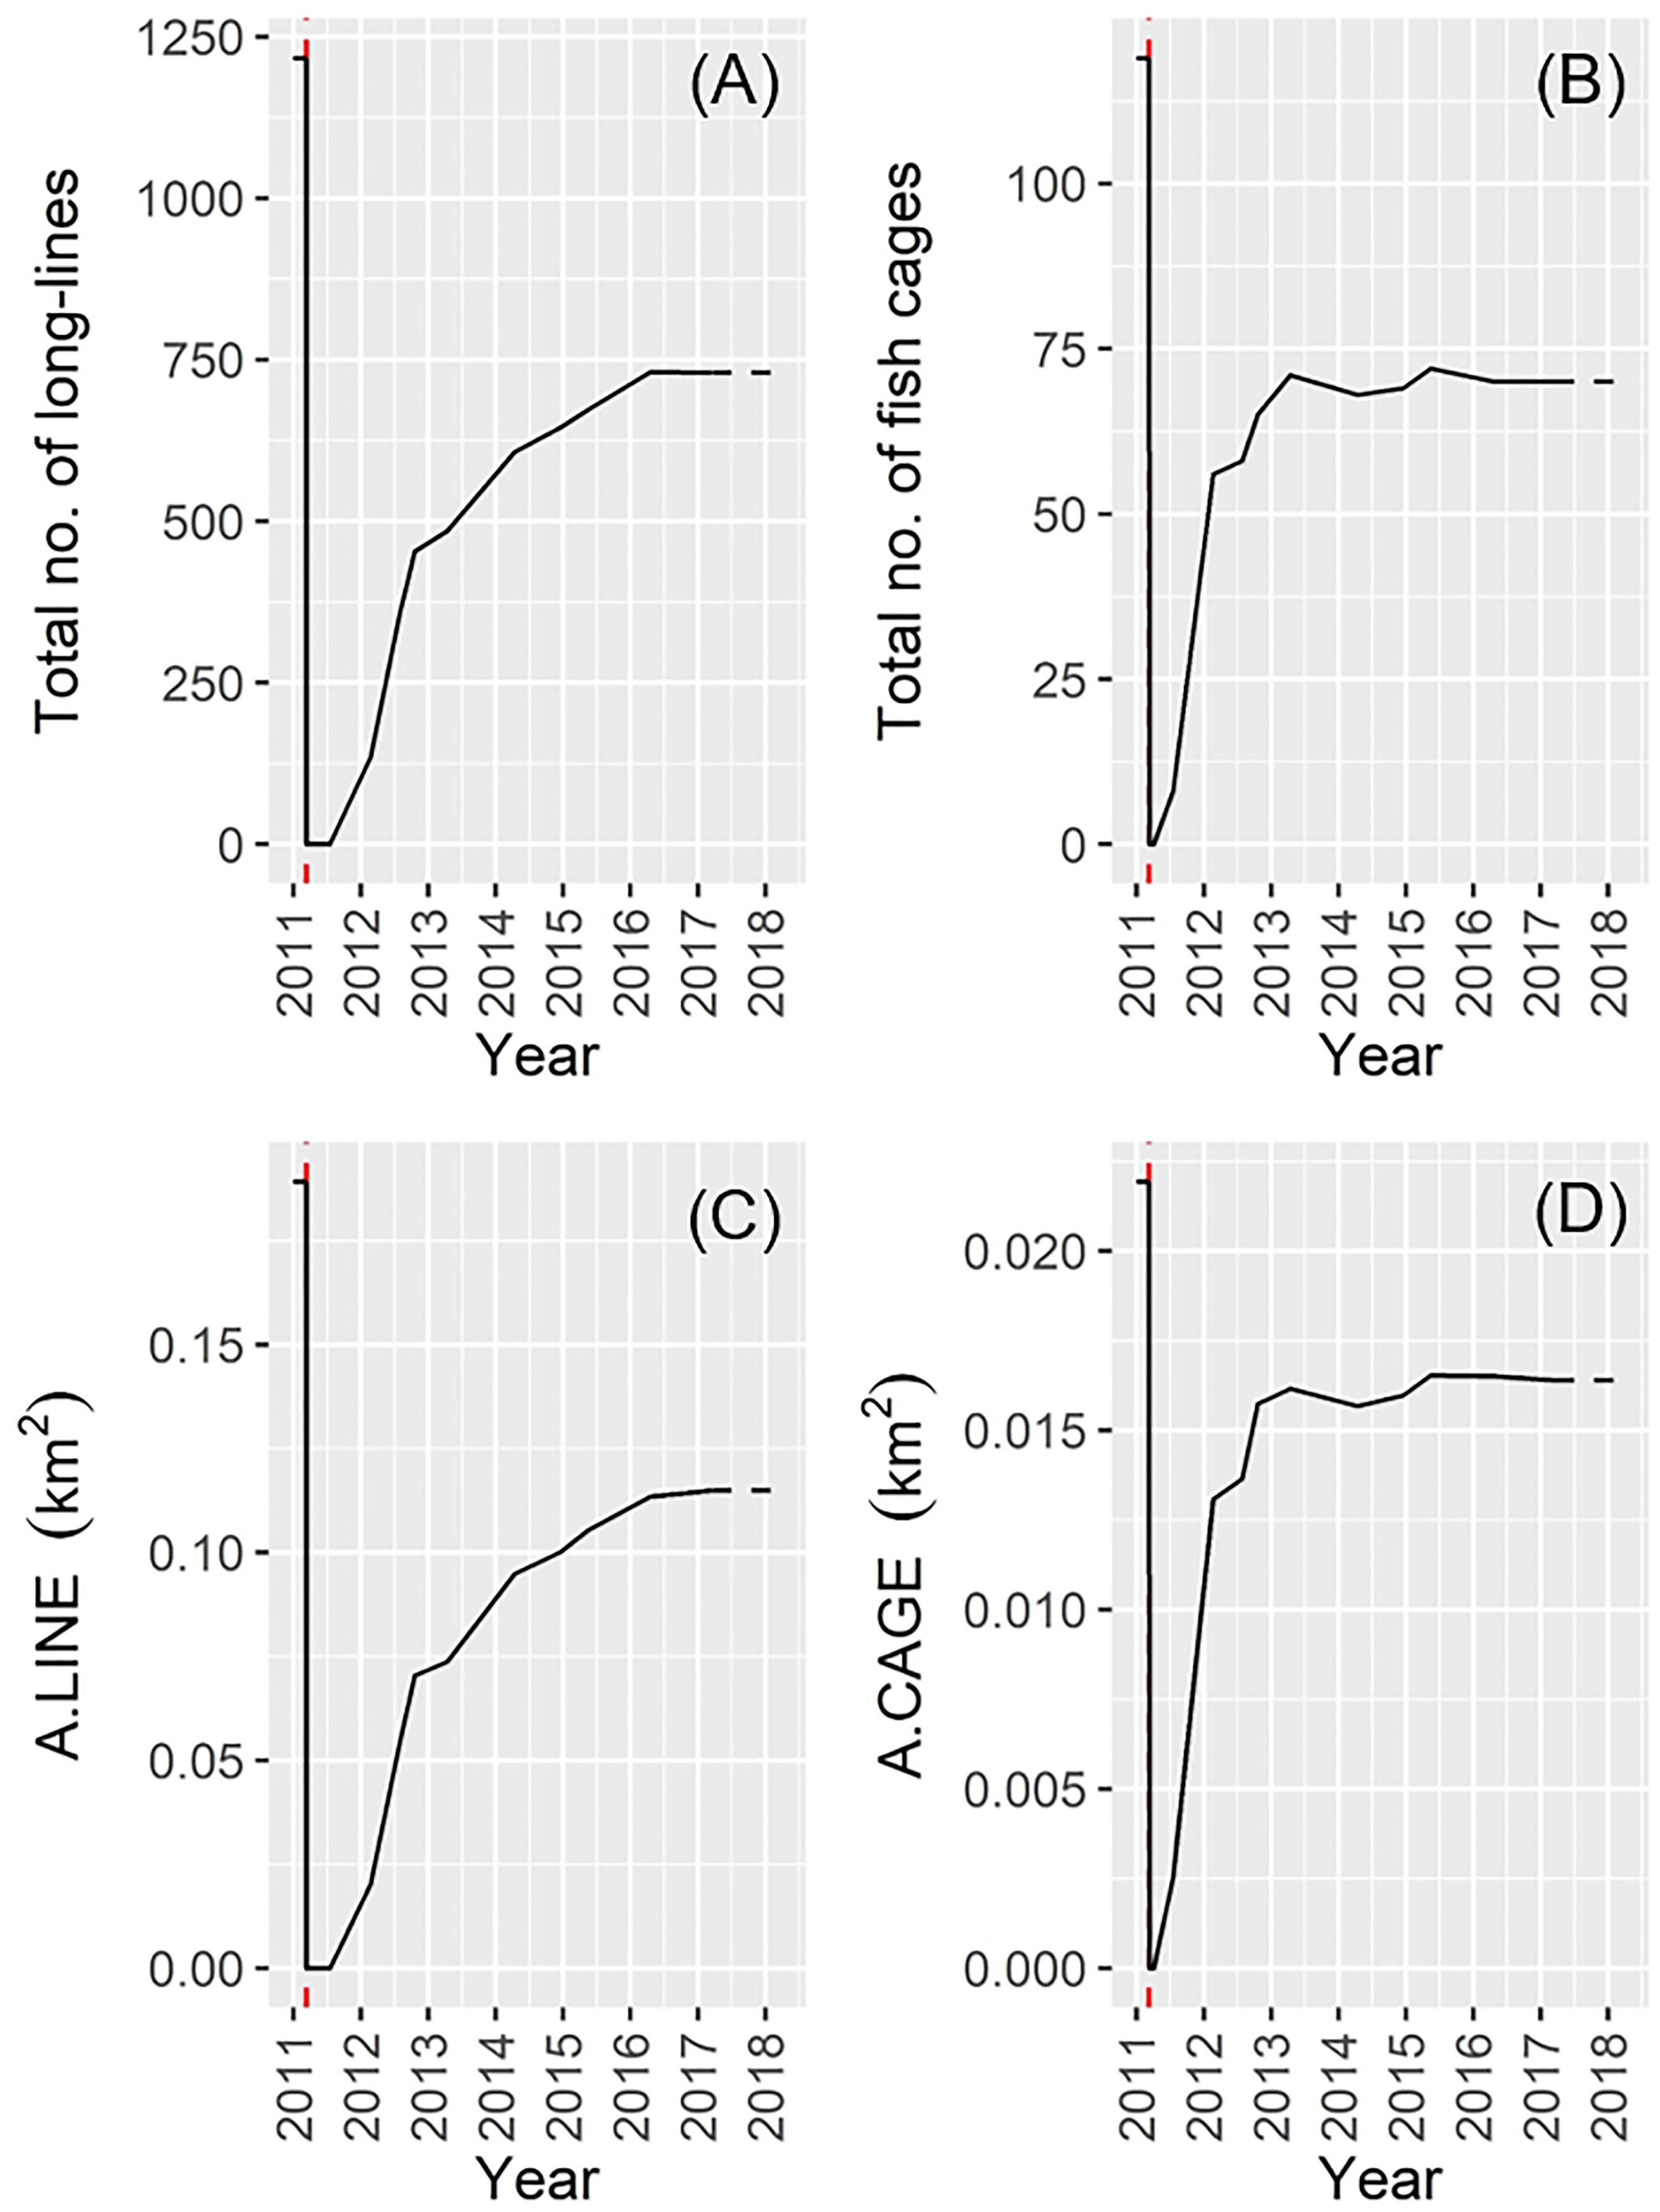
Figure 8. Change in the total number of: (A) long-lines; (B) fish cages, and changes in the total area of: (C) long-lines; (D) fish cages (the red dotted line denotes the date of the 2011 disaster). Satellite data for January 2018 were not available and the corresponding values were therefore assumed identical to those estimated in March 2017.
Macrofaunal Community Structure and Environmental Drivers
The RELATE tests showed that the macrofauna community resemblance matrix correlated most strongly with distance to the nearest long-line culture (D.LINE, ρ = 0.485, p < 0.001) followed by fetch length (FETCH, ρ = 0.476, p < 0.001) and distance to the nearest fish cage culture (D.CAGE, ρ = 0.464, p < 0.001) (Table 4). The other aquaculture-related variables, namely A.LINE and A.CAGE, also correlated significantly with macrofauna community structure (Table 4). D.LAND, sediment fraction of both sand (SAND) and mud (MUD), and water depth (DEPTH) also correlated significantly with the macrofauna resemblance matrix (Table 4). The BEST analysis showed that the combination of FETCH, SAND, and A.LINE produced the highest correlation, followed by FETCH, MUD, and A.LINE (Table 4). Although the variables of D.LINE, FETCH, D.CAGE, SAND, MUD, A.LINE, DEPTH, and A.CAGE, appeared repeatedly in the five best subsets selected in the BEST procedure, no other environmental parameters in Table 4 were selected in a single combination.
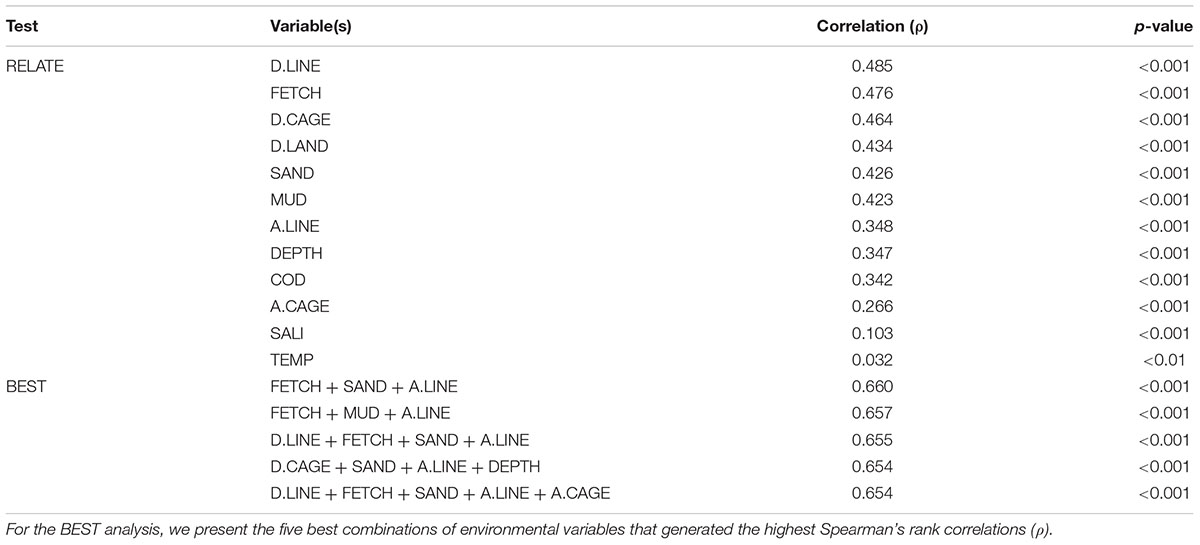
Table 4. Results of RELATE tests (upper 12 rows) and BIO-ENV stepwise (BEST) analysis (lower 5 rows) showing Spearman’s rank correlation coefficients (ρ) between benthic macrofaunal community structure and the environmental variables (coding of environmental variables as in Table 1).
We plotted values for macrofaunal abundance, biomass, species richness, and Shannon index H′ against cluster groups A–K identified by the SIMPROF test (Figures 9A–D). Groups C and G both showed markedly higher values for these biological metrics. Apart from these two groups, all biological metrics generally increased from Group A to Group K which also appeared to correspond to sampling date from the oldest to the newest (Figures 9A–D). In terms of proximity to the nearest aquaculture facilities, Group C mostly contained the farthest stations, whereas Group G stations occurred in closer proximity (Figures 9E,F). Apart from these groups, values for D.LINE and D.CAGE generally decreased from Group A to Group K with Group K associated with sites closest to the aquaculture facilities (Figures 9E,F). Groups C, I, J, and K tended to coincide with sites with increasing or highest cover of aquaculture facilities, whereas Groups A, B, and G characterized low aquaculture sites (Figures 9G,H). High fractions of sand characterized Group C and, to a lesser extent, Group G (Figures 9I,J). Apart from these two groups, values for SAND generally increased but MUD decreased from Group A to Group K, respectively, with Group K as somewhat intermediate (Figures 9I,J). Groups C and J were both significantly associated with exposed and deeper sites, whereas Group I was constrained to more sheltered and shallow locations (Figures 9K,L). Both Groups G and K were largely associated with stations with intermediate exposure (Figures 9K,L).
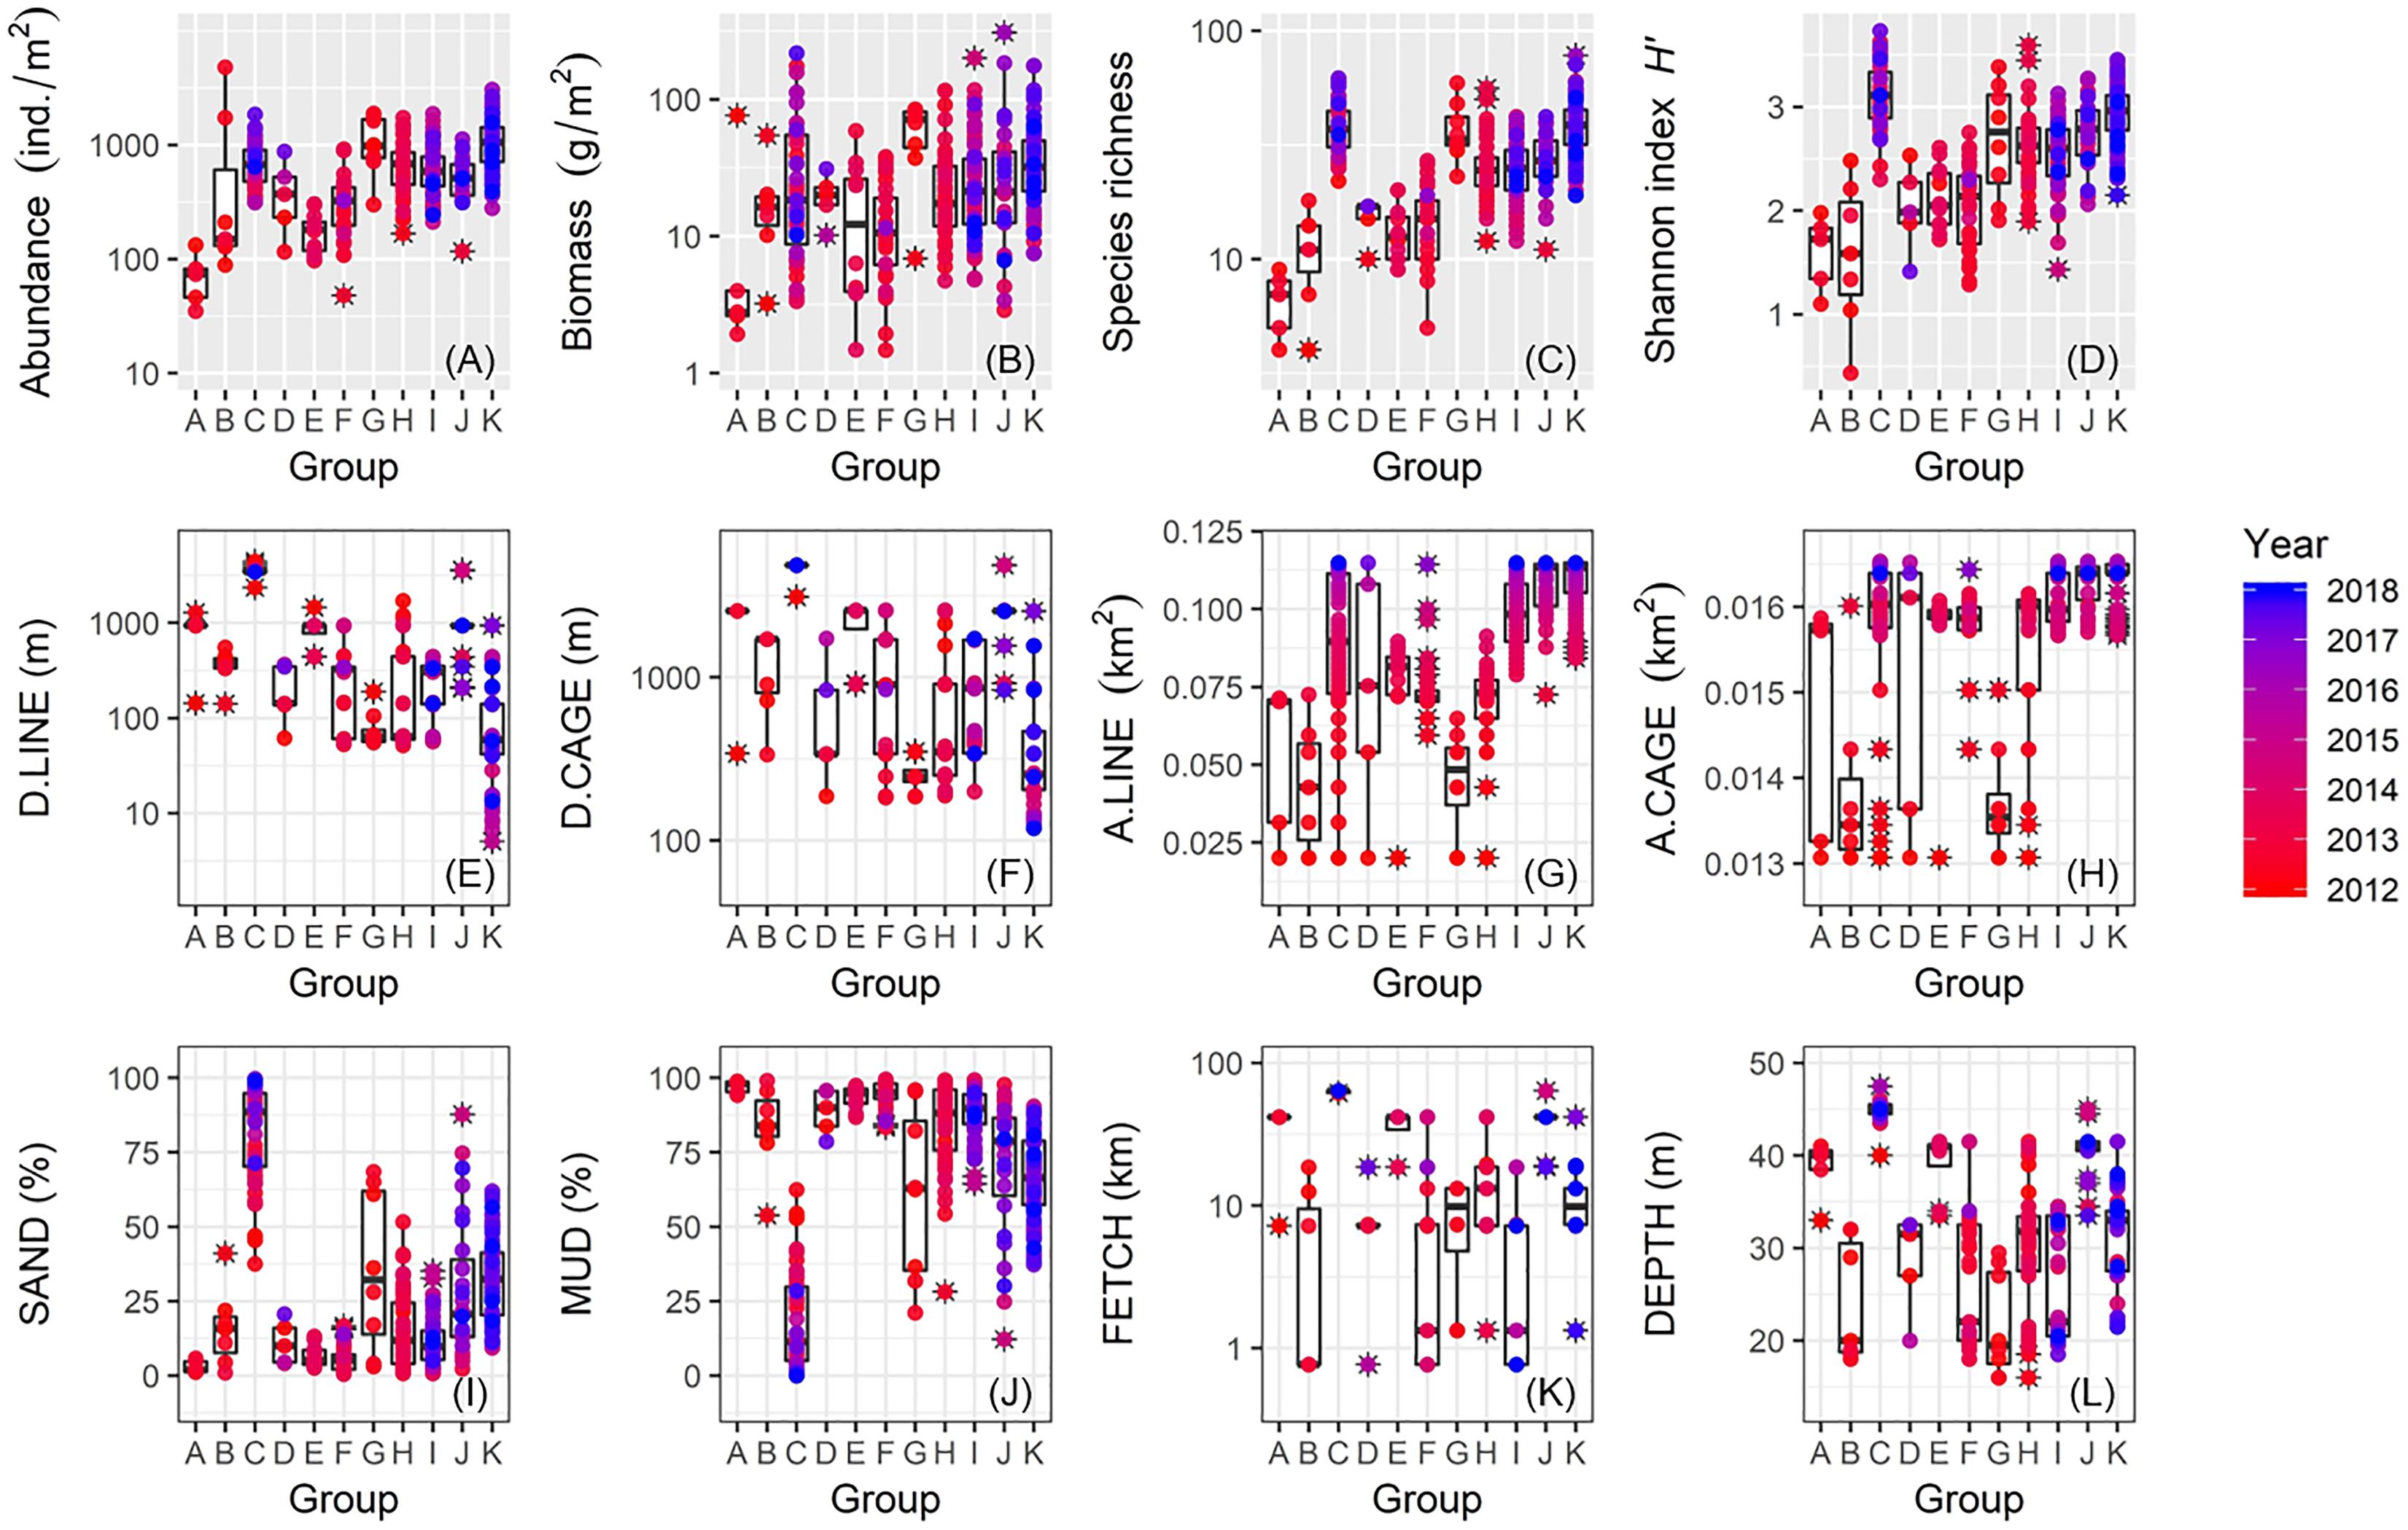
Figure 9. Box plots showing between-group comparisons of macrofauna and environmental data for: (A) abundance; (B) biomass; (C) species richness; (D) Shannon’s index H′; (E) D.LINE; (F) D.CAGE; (G) A.LINE; (H) A.CAGE; (I) SAND; (J) MUD; (K) FETCH; and (L) DEPTH (coding of environmental variables as in Table 1).
Finally, mean values for macrofaunal abundance and species richness between 2015 and 2018 did not differ significantly from before the 2011 disaster (2008–2011) at most of the sampling stations except for St.6/TE8 (Figures 10A,B). The mud fraction (MUD) became significantly higher for some stations after the 2011 tsunami (Figures 10C,D). The gravel fraction was substantially higher around St.17/TE4 before the 2011 disaster (Figure 10E), and values for COD were significantly higher around St.1/TE1 in more recent years compared to pre-2011 values.
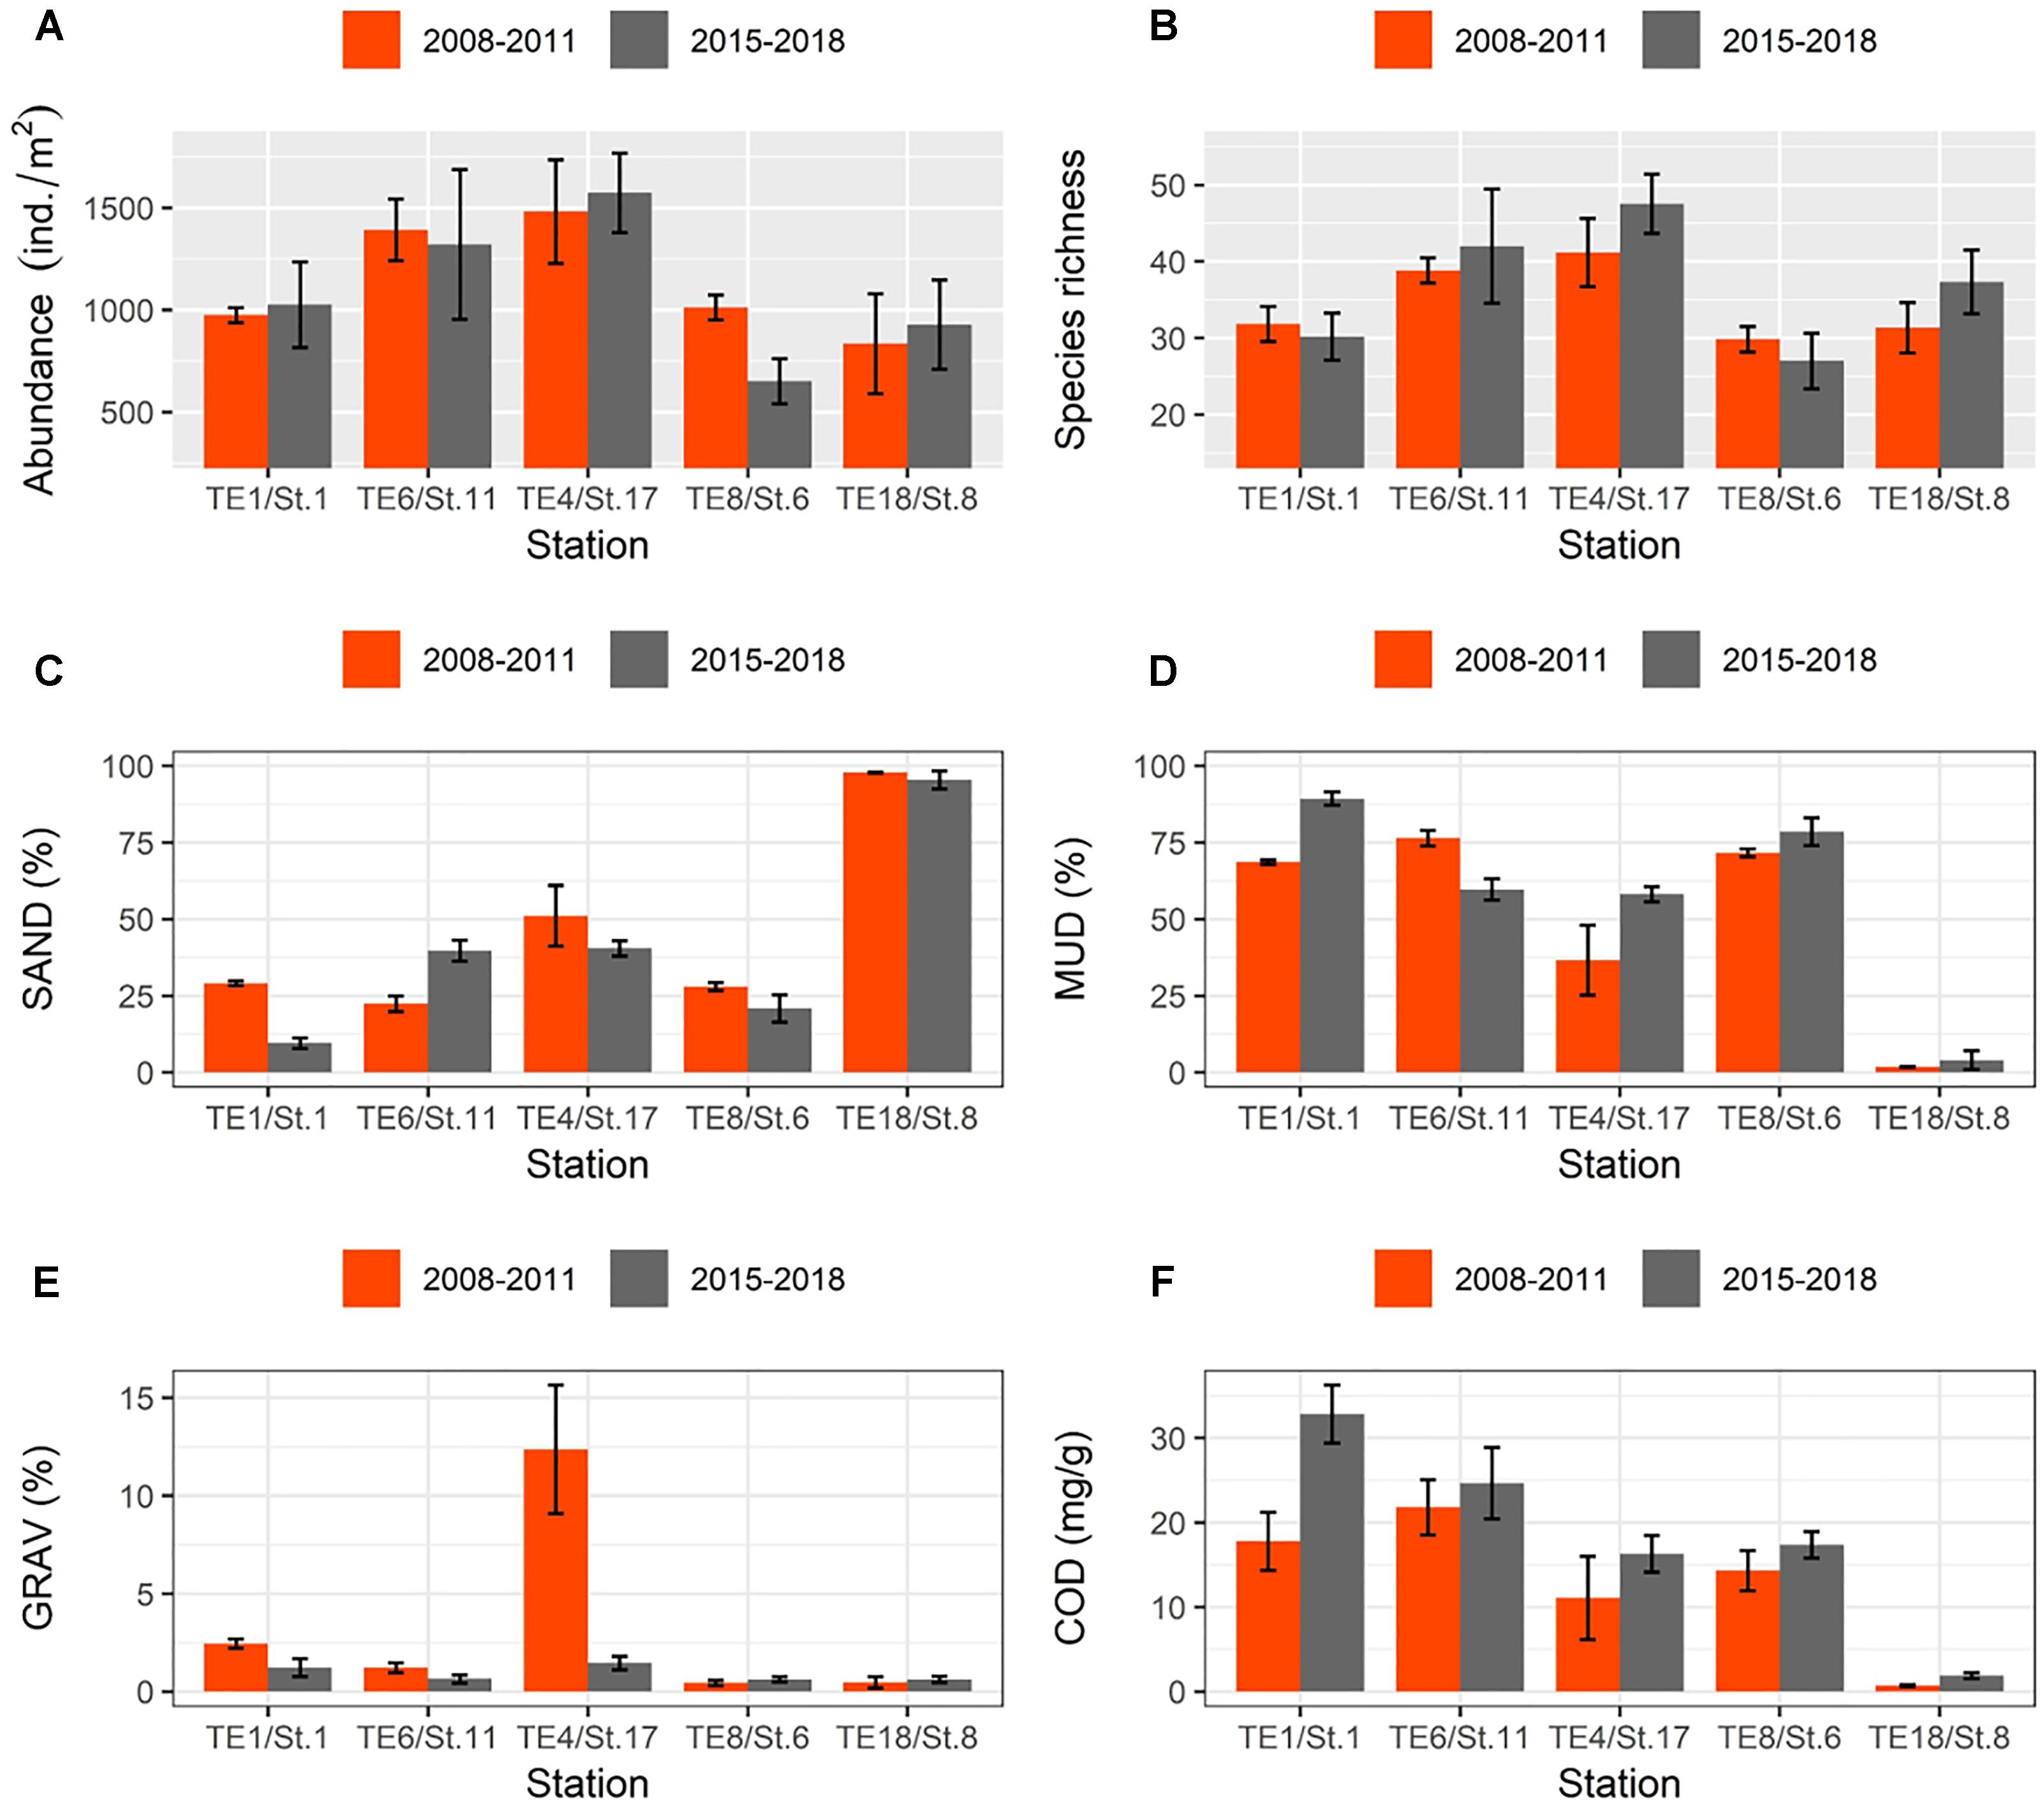
Figure 10. Bar graphs showing changes in mean values (±SE) of selected macrofaunal and environmental data taken “before” (orange bars) and “after” (gray bars) the 2011 disaster: (A) abundance; (B) species richness; (C) SAND; (D) MUD; (E) GRAV; and (F) COD (coding of environmental variables as in Table 1).
Discussion
Our multivariate assessment of benthic macrofaunal community structure following the 2011 Tohoku earthquake and tsunami showed general increases in macrofaunal abundance, biomass, and species diversity during the study period, indicating substantial recovery of seafloor biota and coastal environmental health within 7 years. These community changes correlated with a combination of both natural and anthropogenic factors, adding insights into the mechanisms of community recovery from a catastrophic event.
Of the 11 macrofaunal cluster groups identified, exceptionally high abundances, biomass, and species diversity characterized Groups C and G. Group C occurred almost exclusively at the outermost site of St.8, some distance offshore from the outer boundary of Onagawa Bay. Physical conditions at St.8, particularly sediment grain size and exposure, differed greatly from the sampling stations inside Onagawa Bay. High species diversity and higher proportions of crustaceans (including amphipods and cumaceans), polychaetes, and bivalves characterized Group C community structure; these taxa strongly resembled those typical of high-energy sandy bottom environments. Group C persisted at St.8 throughout our study, suggesting that St.8 could act as a reference site with minimal or negligible physical impacts of the 2011 tsunami and the re-establishing process of aquaculture facilities.
In contrast, Group G occurred only in the earliest stage of our study up until September 2012 and only in the presumably low-energy waters at St.11, 16, and 17. Despite their inshore locations, however, sediment granulometry in Group G varied, characterized by high fraction of sand, which was remarkably consistent with Group C at St.8. This resemblance suggests that Group G stations may also be hydrodynamically high-energy sites (Takahashi et al., 2017) that could favor establishment of rich macrofaunal communities. In addition, Group G occurred near sites where aquaculture facilities were first re-installed in Onagawa Bay. Long-lines and fish cages were both re-constructed at and expanded from these locations (i.e., around St.11, 16, and 17). Coastal aquaculture operations can alter pelagic–benthic energy fluxes, enhancing flux of organic matter to the bottom and altering local sediment characteristics and benthic community composition (Crawford et al., 2003). Environmental effects of shellfish and ascidian aquaculture on seafloor environments may differ from those associated with finfish culture in cages (Weise et al., 2009). Cultured shellfish and ascidians feed entirely on naturally occurring phytoplankton in the water column, and captured food and nutrients return to the environment as undigested waste or feces, which falls to the seafloor and may become important food source for benthic deposit feeders (Shumway et al., 2003; McKindsey et al., 2006). Chemicals and excess nutrients from food and feces associated with finfish farming may have similar effects but intense operations can also disturb benthic communities (Borja et al., 2009; Forchino et al., 2011; Tomassetti et al., 2016). For Group G, such organic enrichment generated by both types of aquaculture may have fuelled benthic recovery, particularly if benthic communities were impoverished from the immediate effects of the 2011 disaster via, e.g., vigorous influx of tsunami deposits/resuspended mud (Seike et al., 2013, 2016; Toyofuku et al., 2014; Kanaya et al., 2015) or spills of heavy oil/toxic chemicals (Abe et al., 2015). Group G occurred near the aquaculture facilities (D.LINE and A.LINE), likely explaining the markedly high abundance and biomass in this group.
One key finding of our study was that all the biological metrics for the cluster groups (i.e., abundance, biomass, species richness, and Shannon index H′) increased from Group A to Group K (except for Groups C and G). Comparison with the pre-tsunami data (2008–2011) confirmed that the benthic macrofaunal community largely recovered over the duration of this study. A combination of distance to or total area of the aquaculture facilities, wind/wave fetch length, and sediment granulometry best explained variability in macrofaunal community structure. D.LINE and D.CAGE generally decreased from Group A to Group K suggesting significant, positive effects of the physical presence of aquaculture facilities on benthic macrofaunal populations, acknowledging that aquaculture prior to the disaster may have altered the benthos relative to a pristine condition. A.LINE and A.CAGE generally increased from Group A to Group K suggesting that increasing extent of aquaculture facilities can also positively influence benthic macrofaunal populations. As of March 2017, the total surface area occupied by the long-lines and fish cages were 0.115 and 0.016 km2, representing only 0.42 and 0.06% of the total area of Onagawa Bay, respectively. However, recent studies suggest that bio-deposits produced from aquaculture operations can disperse and spread through the water column and thereby affect benthic community at a much broader spatial scale than the immediate vicinity of aquaculture facilities (up to several kilometers) (Borja et al., 2009; Weise et al., 2009; Yokoyama, 2010; Sarà et al., 2011). If sphere of influence extends distances of 50, 100, and 150 m from each of the long-lines as suggested, we estimate the potential footprint of aquaculture operations on the seafloor to be 4.70, 6.93, and 8.96 km2, or 17.3, 25.5, and 33.0% of the total area of Onagawa Bay, respectively. This estimate points to a need to assess accurately the spatial extent of benthic impact resulting from the re-establishment of aquaculture facilities and associated fishery operations in this region.
With respect to changes in macrofauna and sediment grain size following the earthquake, the sand fraction (SAND) and the mud fraction (MUD) clearly increased and decreased, respectively, from Group A to Group K. In estuarine and coastal soft-bottom habitats, sediment granulometry critically influences benthic macrofaunal community (e.g., Constable, 1999; Thrush et al., 2004; Anderson, 2008). The trend of gradually increasing sand and decreasing mud across Onagawa Bay over time suggests these granulometric changes also affected the dynamics of macrofaunal community structure. Before the 2011 disaster, the sand fractions were significantly higher at some stations prior to anomalous deposition of mud across the whole bay following vigorous erosion and deposition of fine-grained sediments associated with a strong tsunami-induced current (Seike et al., 2016). Abrupt increase in fine-grained sediment could adversely affect benthic community through smothering and clogging feeding structures of suspension-feeders (Thrush et al., 2004), which may have wiped out benthic communities immediately after the 2011 tsunami. Despite gradual decreases in mud fractions, the sand fractions have not yet returned to pre-tsunami levels at some locations. Different rates of removal of fine-grained sediments could reflect different hydrodynamic processes operating at different locations. Our study used wind fetch length (FETCH) as an indicator of exposure and our analysis indicated that Groups I and J were constrained to more sheltered (low-energy) and more exposed (high-energy) locations, respectively, whereas Group K occurred at locations of intermediate exposure (i.e., FETCH: Group J > Group K > Group I). However, the dominance of sand fractions associated with Group K > Group J > Group I suggests that hydrodynamics alone did not control changes in the sediment particle size composition. Links between sediment granulometry and benthic macrofaunal communities have yet to be fully critically evaluated because coastal aquaculture operations can enhance flux of organic matter to bottom sediments which may also alter local sediment characteristics (Crawford et al., 2003). Overall, the relative influence of hydrodynamic processes and the flux of organic matter generated from the aquaculture operations on local variation in sediments is unclear, pointing to a need for future research on how distribution of aquaculture operations relates to sediment characteristics of seafloor habitat and how other environmental parameters such as coastal topography and/or hydrodynamic processes influence benthic–pelagic dependencies across Onagawa Bay.
Our study demonstrated the primary importance of coastal aquaculture operations, along with sediment granulometry and coastal topography (exposure), in determining the occurrence and distribution of benthic macrofauna and thereby influencing recovery in abundance, biomass, and diversity of benthic community at an ecosystem-scale following even a catastrophic natural disaster such as the 2011 Tohoku earthquake and tsunami in Japan. The potential links between the extent of coastal aquaculture operations and spatio-temporal distributional responses of benthic macrofauna as demonstrated in our study illustrate the need to improve understanding of the influence of multiple coastal anthropogenic operations on the structure and dynamics of the marine bentho-pelagic interactions that, in turn, affect the functioning of the whole marine ecosystem. Application of such research to other locations can inform marine policy issues relating to post-tsunami and/or aquaculture operations.
Author Contributions
TF led the overall data analysis, writing of the paper, and the statistical analyses. AKi and KK coordinated the project and the survey. KK, TF, MK, YN, AKa, DT, YG, and HA performed the sampling at sea. KK, MK, and YN led the processing and management of the survey data. TF and KK led the analysis of the macrofauna and environmental data. HM, CY, and TF performed the analysis of the satellite imagery.
Funding
This study was performed as part of the “TEAMS” project and supported by grants-in-aid for scientific research by the Ministry of Education, Culture, Sports, Science, and Technology (MEXT/JSPS).
Conflict of Interest Statement
The authors declare that the research was conducted in the absence of any commercial or financial relationships that could be construed as a potential conflict of interest.
Acknowledgments
We thank the captain T. Hiratsuka and the crew members T. Kimura and Y. Suzuki of R/V Suikoh from Onagawa Field Centre, Graduate School of Agricultural Science, Tohoku University for invaluable supports in conducting the Onagawa Bay Monthly Survey. We would like to acknowledge IDEA Consultants, Inc. for supporting the sampling at sea, identifying species, and performing the laboratory analysis for the survey samples.
Supplementary Material
The Supplementary Material for this article can be found online at: https://www.frontiersin.org/articles/10.3389/fmars.2018.00535/full#supplementary-material
References
Abe, H., Kobayashi, G., and Sato-Okoshi, W. (2015). Impacts of the 2011 tsunami on the subtidal polychaete assemblage and the following recolonization in Onagawa Bay, northeastern Japan. Mar. Environ. Res. 112, 86–95. doi: 10.1016/j.marenvres.2015.09.011
Anderson, M. J. (2008). Animal-sediment relationships re-visited: characterising species’ distributions along an environmental gradient using canonical analysis and quantile regression splines. J. Exp. Mar. Biol. Ecol. 366, 16–27. doi: 10.1016/j.jembe.2008.07.006
Benn, A. R., Weaver, P. P., Billet, D. S., van den Hover, S., Murdock, A. P., Doneghan, G. B., et al. (2010). Human activities on the deep seafloor in the north east atlantic: an assessment of spatial extent. PLoS One 5:e12730. doi: 10.1371/journal.pone.0012730
Borja, A., Rodriguez, J. G., Black, K., Bodoy, A., Emblow, C., Fernandes, T. F., et al. (2009). Assessing the suitability of a range of benthic indices in the evaluation of environmental impact of fin and shellfish aquaculture located in sites across Europe. Aquaculture 293, 231–240. doi: 10.1016/j.aquaculture.2009.04.037
Burrows, M. T., Harvey, R., and Robb, L. (2008). Wave exposure indices from digital coastlines and the prediction of rocky shore community structure. Mar. Ecol. Prog. Ser. 353, 1–12. doi: 10.3354/meps07284
Clarke, K. R., and Warwick, R. M. (2001). Change in Marine Communities: an Approach to Statistical Analysis and Interpretation. Plymouth: Primer-E.
Constable, A. J. (1999). Ecology of benthic macro-invertebrates in soft-sediment environments: a review of progress towards quantitative models and predictions. Aust. J. Ecol. 24, 452–476. doi: 10.1046/j.1442-9993.1999.00977.x
Crawford, C. M., Macleod, C. K. A., and Mitchell, I. M. (2003). Effects of shellfish farming on the benthic environment. Aquaculture 224, 117–140. doi: 10.1016/S0044-8486(03)00210-2
Farmaki, E., Thomaidis, N., Pasias, I., Baulard, C., Papaharisis, L., and Efstathiou, C. (2014). Environmental impact of intensive aquaculture: investigation on the accumulation of metals and nutrients in marine sediments of greece. Sci. Total Environ. 485, 554–562. doi: 10.1016/j.scitotenv.2014.03.125
Foden, J., Rogers, S. I., and Jones, A. P. (2011). Human pressures on UK seabed habitats: a cumulative impact assessment. Mar. Ecol. Prog. Ser. 428, 33–47. doi: 10.3354/meps09064
Forchino, A., Borja, A., Brambilla, F., Rodriguez, J. G., Muxika, I., Terova, G., et al. (2011). Evaluating the influence of offshore cage aquaculture on the benthic ecosystem in Alghero Bay (Sardinia, Italy) using AMBI and M-AMBI. Ecol. Indic. 11, 1112–1122. doi: 10.1016/j.ecolind.2010.12.011
Gunderson, A. R., Armstrong, E. J., and Stillman, J. H. (2016). Multiple stressors in a changing world: the need for an improved perspective on physiological responses to the dynamic marine environment. Ann. Rev. Mar. Sci. 8, 357–378. doi: 10.1146/annurev-marine-122414-033953
Halpern, B. S., and Fujita, R. (2013). Assumptions, challenges, and future directions in cumulative impact analysis. Ecosphere 4:art131. doi: 10.1890/ES13-00181.1
Halpern, B. S., Walbridge, S., Selkoe, K. A., Kappel, C. V., Micheli, F., D’Agrosa, C., et al. (2008). A global map of human impact on marine ecosystems. Science 319, 948–952. doi: 10.1126/science.1149345
Kanaya, G., Suzuki, T., and Kikuchi, E. (2015). Impacts of the 2011 tsunami on sediment characteristics and macrozoobenthic assemblages in a shallow eutrophic lagoon, Sendai Bay, Japan. PLoS One 10:e135125. doi: 10.1371/journal.pone.0135125
Katsanevakis, S., Stelzenmüller, V., South, A., Sørensen, T. K., Jones, P. J. S., Kerr, S., et al. (2011). Ecosystem-based marine spatial management: review of concepts, policies, tools, and critical issues ocean. Coast. Manage. 54, 807–820. doi: 10.1016/j.ocecoaman.2011.09.002
Liess, M., Foit, K., Knillmann, S., Schäfer, R. B., and Liess, H. D. (2016). Predicting the synergy of multiple stress effects. Sci. Rep. 6:32965. doi: 10.1038/srep32965
Lomovasky, B. J., Firstater, F. N., Salazar, A. G., Mendo, J., and Iribarne, O. O. (2011). Macro benthic community assemblage before and after the 2007 tsunami and earthquake at Paracas Bay. Peru. J. Sea Res. 65, 205–212.
McCauley, D. J., Pinsky, M. L., Palumbi, S. R., Estes, J. A., Joyce, F. H., and Warner, R. R. (2015). Marine defaunation: animal loss in the global ocean. Science 347:1255641. doi: 10.1126/science.1255641
McKindsey, C. W., Anderson, M. R., Barnes, P., Courtenay, S., Landry, T., and Skinner, M. (2006). Effects of Shellfish Aquaculture on Fish Habitat. Ottawa: Canadian Science Advisory Secretariat Research Document 2006/011, Fisheries and Oceans.
Miyagi Prefecture and Tohoku Electric Power Company. (2010). Measurements of Warm Drainage Water of the Onagawa Nuclear Power Plant for Fiscal. (2008). Sendai: Miyagi Prefecture.
Miyagi Prefecture and Tohoku Electric Power Company. (2011). Measurements of Warm Drainage Water of the Onagawa Nuclear Power Plant for Fiscal. (2009). Sendai: Miyagi Prefecture.
Miyagi Prefecture and Tohoku Electric Power Company. (2012). Measurements of Warm Drainage Water of the Onagawa Nuclear Power Plant for Fiscal. (2010). Sendai: Miyagi Prefecture.
R Development Core Team. (2017). R: a Language and Environment for Statistical Computing. Vienna: R Foundation for Statistical Computing.
Sarà, G., Lo Martire, M., Sanfilippo, M., Pulicano, G., Cortese, G., Mazzola, A., et al. (2011). Impacts of marine aquaculture at large spatial scales: evidences from N and P catchment loading and phytoplankton biomass. Mar. Environ. Res. 71, 317–324. doi: 10.1016/j.marenvres.2011.02.007
Seers, B. (2018). fetchR: Calculate Wind Fetch. R Package Version 2.1-1. https://cran.r-project.org/package=fetchR.
Seike, K., Kitahashi, T., and Noguchi, T. (2016). Sedimentary features of Onagawa Bay, northeastern Japan after the 2011 off the Pacific coast of Tohoku earthquake: sediment mixing by recolonized benthic animals decreases the preservation potential of tsunami deposits. J. Oceanogr. 72, 141–149. doi: 10.1007/s10872-015-0297-1
Seike, K., Shirai, K., and Kogure, Y. (2013). Disturbance of shallow marine soft-bottom environments and megabenthos assemblages by a huge tsunami induced by the 2011 M9.0 Tohoku-oki earthquake. PLoS One 8:e65417. doi: 10.1371/journal.pone.0065417
Shumway, S. E., Davis, C., Downey, R., Karney, R., Kraeuter, J., Parsons, J., et al. (2003). Shellfish aquaculture–in praise of sustainable economies and environments. World Aquac. 34, 8–10.
Sohtome, T., Wada, T., Mizuno, T., Nemoto, Y., Igarashi, S., Nishimune, A., et al. (2014). Radiological impact of TEPCO’s fukushima dai-ichi nuclear power plant accident on invertebrates in the coastal benthic food web. J. Environ. Radioact. 138, 106–115. doi: 10.1016/j.jenvrad.2014.08.008
Takahashi, D., Kaneko, K., Gomi, Y., Minegishi, Y., Shoji, M., Endo, H., et al. (2017). Short-term flow fluctuations in Onagawa Bay, Japan, as revealed by long-term mooring observation. J. Oceanogr. 73, 67–86. doi: 10.1007/s10872-016-0360-6
Takami, H., Won, N. I., and Kawamura, T. (2013). Impacts of the 2011 mega-earthquake and tsunami on abalone Haliotis discus hannai and sea urchin strongylocentrotus nudus populations at Oshika Peninsula, Miyagi, Japan. Fish. Oceanogr. 22, 113–120. doi: 10.1111/fog.12008
Thrush, S. F., Hewitt, J. E., Cummings, V. J., Ellis, J. I., Haton, C., Lohrer, A., et al. (2004). Muddy waters: elevating sediment input to coastal and estuarine habitats. Front. Ecol. Environ. 2, 299–306. doi: 10.1890/1540-9295(2004)002[0299:MWESIT]2.0.CO;2
Thurber, A. R., Sweetman, A. K., Narayanaswamy, B. E., Jones, D. O. B., Ingels, J., and Hansman, R. L. (2014). Ecosystem function and services provided by the deep sea. Biogeosciences 11, 3941–3963. doi: 10.5194/bg-11-3941-2014
Tomassetti, P., Gennaro, P., Lattanzi, L., Mercatali, I., Persia, E., Vani, D., et al. (2016). Benthic community response to sediment organic enrichment by mediterranean fish farms: case studies. Aquaculture 450, 262–272. doi: 10.1016/j.aquaculture.2015.07.019
Tovar, A., Moreno, C., Manuel-Vez, M. P., and Garcia-Vargas, M. (2000). Environmental impacts of intensive aquaculture in marine waters. Water Res. 34, 334–342. doi: 10.1016/S0043-1354(99)00102-5
Toyofuku, T., Duros, P., Fontanier, C., Mamo, B., Bichon, S., Buscail, R., et al. (2014). Unexpected biotic resilience on the Japanese seafloor caused by the 2011 Tohoku-oki tsunami. Sci. Rep. 4:7517. doi: 10.1038/srep07517
Urabe, J., Suzuki, T., Nishita, T., and Makino, W. (2013). Immediate ecological impacts of the 2011 Tohoku earthquake tsunami on intertidal flat communities. PLoS One 8:e62779. doi: 10.1371/journal.pone.0062779
Weise, A. M., Cromey, C. J., Callier, M. D., Archambault, P., Chamberlain, J., and McKindsey, C. W. (2009). Shellfish-DEPOMOD: modelling the biodeposition from suspended shellfish aquaculture and assessing benthic effects. Aquaculture 288, 239–253. doi: 10.1016/j.aquaculture.2008.12.001
Whanpetch, N., Nakaoka, M., Mukai, H., Suzuki, T., Nojima, S., Kawai, T., et al. (2010). Temporal changes in benthic communities of seagrass beds impacted by a tsunami in the Andaman sea, Thailand. Estuar. Coast. Shelf Sci. 87, 246–252. doi: 10.1016/j.ecss.2010.01.001
Keywords: benthic macrofauna, coastal aquaculture, marine ecosystem ecology, environmental disturbance, 2011 Tohoku earthquake and tsunami, anthropogenic influence, spatio-temporal dynamics, Onagawa Bay
Citation: Fujii T, Kaneko K, Murata H, Yonezawa C, Katayama A, Kuraishi M, Nakamura Y, Takahashi D, Gomi Y, Abe H and Kijima A (2019) Spatio-Temporal Dynamics of Benthic Macrofaunal Communities in Relation to the Recovery of Coastal Aquaculture Operations Following the 2011 Great East Japan Earthquake and Tsunami. Front. Mar. Sci. 5:535. doi: 10.3389/fmars.2018.00535
Received: 31 August 2018; Accepted: 31 December 2018;
Published: 15 January 2019.
Edited by:
Paul Snelgrove, Memorial University of Newfoundland, CanadaReviewed by:
Joanne I. Ellis, King Abdullah University of Science and Technology, Saudi ArabiaJuan Moreira Da Rocha, Universidad Autónoma de Madrid, Spain
Copyright © 2019 Fujii, Kaneko, Murata, Yonezawa, Katayama, Kuraishi, Nakamura, Takahashi, Gomi, Abe and Kijima. This is an open-access article distributed under the terms of the Creative Commons Attribution License (CC BY). The use, distribution or reproduction in other forums is permitted, provided the original author(s) and the copyright owner(s) are credited and that the original publication in this journal is cited, in accordance with accepted academic practice. No use, distribution or reproduction is permitted which does not comply with these terms.
*Correspondence: Toyonobu Fujii, dG95b25vYnUuZnVqaWkuYThAdG9ob2t1LmFjLmpw