 Tatiana V. Viana1,2†
 Giovana O. Fistarol1†
 Michelle Amario1,2Rafael B. Menezes1Beatriz L. R. Carneiro1Daisyane M. Chaves1Paulo I. Hargreaves1
 Arthur W. Silva-Lima1Jean L. Valentin3
 Denise R. Tenenbaum1Edilson F. Arruda4Rodolfo Paranhos5
 Paulo S. Salomon1*
- 1Laboratório de Fitoplâncton Marinho, Departamento de Biologia Marinha, Instituto de Biologia, Universidade Federal do Rio de Janeiro, Rio de Janeiro, Brazil
- 2Programa de Pós-Graduação em Genética, Universidade Federal do Rio de Janeiro, Rio de Janeiro, Brazil
- 3Laboratório de Zooplâncton Marinho, Departamento de Biologia Marinha, Instituto de Biologia, Universidade Federal do Rio de Janeiro, Rio de Janeiro, Brazil
- 4Programa de Engenharia de Produção, Instituto Alberto Luiz Coimbra de Pós Graduação de Pesquisa de Engenharia, Universidade Federal do Rio de Janeiro, Rio de Janeiro, Brazil
- 5Laboratório de Hidrobiologia, Departamento de Biologia Marinha, Instituto de Biologia, Universidade Federal do Rio de Janeiro, Rio de Janeiro, Brazil
Cell concentrations of the potentially harmful raphidophyte Chattonella subsalsa Biecheler were quantified in surface waters of Guanabara Bay, a heavily eutrophicated estuarine system in tropical Brazil, from February 2014 to January 2018. Cells were imaged and quantified in live samples by means of an automated imaging system (FlowCam®). Bloom episodes (>0.1 × 10⁶ cells L−1) were observed in 37 samples, mostly in a shallow (<10 m) area with extremely high nutrient and organic matter loads (average total P = 19 μM and total N = 344 μM), intermediate salinity (average 24.5), and low water transparency (average Secchi depth = 0.54 m) due to continental runoff. Blooms in this area reached up to 13.3 × 10⁶ cells L−1. C. subsalsa cell concentration was correlated with parameters linked to eutrophication of the bay. On a monthly basis, C. subsalsa abundance was correlated with a period of positive Multivariated El Niño/Southern Oscilation Index (MEI) that lasted from the beginning of 2015 to mid-2016 (known as Godzilla El Niño), indicating a potential influence of regional climate on the occurrence of C. subsalsa. Notably, at least six fish kill episodes were reported in the Bay during this period which, added to the toxicity of C. subsalsa strains isolated from the bay to Artemia nauplia (48h-LC50 = 7.3 × 10⁶ cells L−1), highlights the threat that this HAB species poses to the environment. This is the first report of recurrent, massive C. subsalsa blooms in Guanabara Bay. Regardless of the influence of climatic forcing in favoring C. subsalsa development, reducing nutrient loads would be the best strategy to mitigate blooms of this and other potentially harmful algae in Guanabara Bay.
Introduction
Members of the genus Chattonella (Class Raphidophyceae) are successful, cosmopolitan microalgae commonly found in the plankton of coastal marine areas such as estuarine ecosystems. This group of photosynthetic protists has various characteristics (such as phenotypic plasticity, tolerance to a wide range of temperatures, capacity for diel vertical migrations, and mixotrophy) that allow them to thrive in eutrophicated coastal waters despite the changeable conditions of these environments (Paranhos and Mayr, 1993; Marshall and Hallegraeff, 1999; Chenna et al., 2003; Band-Schmidt et al., 2004; Handy et al., 2005; Hosoi-Tanabe et al., 2006; Imai and Yamaguchi, 2012; Klöpper et al., 2013). Besides, some species of Chattonella form toxic blooms with harmful effects to other marine organisms, especially fish. These traits make species of this genus a common target during monitoring studies in coastal marine areas (Khan et al., 1995; Imai and Yamaguchi, 2012).
Chattonella spp., as other raphidophytes, are unicellular, bi-flagellated protists, typically with gold-brown coloration due to the production of fucoxantin (Hallegraeff and Hara, 2003; Klöpper et al., 2013). Their morphological diversity, even among the same species, has made the use of molecular markers almost a requirement for its precise identification. The occurrence of mixotrophy has been described for this genus, which may confer a competitive advantage during nutrient shortage (Jeong et al., 2010). Furthermore, the species Chattonella antiqua, C. marina, C. ovata, and C. subsalsa have been described to form harmful algal blooms (HABs), and cause massive fish kills (Hiroishi et al., 2005; Imai et al., 2006; Imai and Yamaguchi, 2012). The mechanism of the fish kills is not yet fully understood. Studies have demonstrated the production of neurotoxins (brevetoxins), hemolytic substance, and also of reactive oxygen species (ROS) (Hallegraeff et al., 2004; Imai and Yamaguchi, 2012). Nevertheless, it seems that suffocation by physically clogging the gills is the ultimate cause of fish death, with production of ROS playing an important role (Marshall et al., 2003; Imai and Yamaguchi, 2012). Massive fish kills caused by Chattonella spp., with associated economic losses, have been described around the world (e.g., in Japan, India, Australia, USA) (Hallegraeff et al., 1998; Edvardsen and Imai, 2006; Imai et al., 2006; Lewitus et al., 2008; Imai and Yamaguchi, 2012).
Even though the genus Chattonella is found worldwide, its growth is affected by environmental factors such as temperature, salinity, nutrient concentrations, as well as by biotic factors such as competition, parasitism, and grazing. Different strains of Chattonella were shown to have different optimal temperature and salinity growth conditions (Nakamura and Watanabe, 1983; Nakamura et al., 1989; Marshall and Hallegraeff, 1999; Imai and Yamaguchi, 2012), although they can be found outside these optimal conditions in natural environments. It has been shown that Chattonella can form cysts, and, in temperate regions with wide seasonal variations in temperature and salinity, encystment may be used as a survival strategy (Nakamura et al., 1990; Edvardsen and Imai, 2006). Encystment may also allow bloom formation during the return of favorable conditions (Imai, 1989; Portune et al., 2009).
Guanabara Bay is a large, highly-eutrophicated bay on the southeast coast of Brazil. It is surrounded by eleven municipalities, including the worldwide known city of Rio de Janeiro. Along the years, the anthropogenic impacts in this environment have caused severe disturbances and changes in its waters and on the habitats around the bay. One of the most critical impacts is the increase in nutrient concentrations, which leads to high chlorophyll levels (e.g., it has been registered chlorophyll a concentrations as high as 483 mg m−3) (Paranhos et al., 2001). As a probable consequence of eutrophication, it has also been observed changes in the composition of the plankton community, with a shift toward a community dominated by more heterotrophic/mixotrophic organisms, and an increase in the frequency of HABs (Valentin et al., 1999; Santos et al., 2007; Fistarol et al., 2015; Odebrecht et al., 2018). Among the potentially harmful microalgae detected in Guanabara Bay are members of the genus Chattonella (Villac and Tenenbaum, 2010; Fistarol et al., 2015).
Although the occurrence of Chattonella spp. has been previously described in Brazil (Hallegraeff and Hara, 2003; Villac and Tenenbaum, 2010; Fistarol et al., 2015), including its presence as a member of the planktonic community in Guanabara Bay several decades ago (Valentin et al., 1999), there is a lack of systematic studies on the occurrence of blooms of these raphidophytes in the region. Due to its wide distribution and tolerance to different environmental conditions, added to the aforementioned records of the presence of Chattonella spp. in Brazilian waters, it is reasonable to assume that blooms of these raphidophytes in Guanabara Bay are more common than what has been hitherto documented in the literature.
In this study we present the results of an intense, 4-year monitoring program in Guanabara Bay that unveiled the occurrence of massive blooms of the raphidophyte Chattonella subsalsa in this environment. The taxonomic identity, tolerance to salinity and toxic potential of C. subsalsa was assessed by means of cultures established from cells isolated from the bay. The environmental drivers that favor the occurrence of C. subsalsa in Guanabara Bay are discussed.
Materials and Methods
Sampling
Plankton samples for quantification of C. subsalsa in Guanabara Bay were collected over a 4-year period, from January, 2014 to January, 2018 along four sampling series (A to D) (Figure 1). Each sampling series had a particular timespan, number of sampling locations and sampling frequency: (i) monthly samplings at two fixed locations (A1 and A2) from January, 2014 to December, 2015 and bimonthly samplings at the same locations from January, 2016 to January, 2018; (ii) monthly samplings at five fixed locations (B1 to B5) from October, 2014 to January, 2018; (iii) monthly samplings at 6 fixed locations (C1 to C6) from October, 2016 to January, 2018; (iv) weekly samplings at 4 fixed locations (D1 to D4) from March, 2017 to January, 2018. Samples for cell counts and chemical analyses were collected at the water surface with a bucket or a Niskin bottle. Immediately after sampling, aliquots of water were sieved through a 200 μm nylon mesh to remove large predators and stored cool in 2 to 5L plastic bottles until arrival to the laboratory. Samples for inorganic nutrient, total N and P, and chlorophyll a were stored in plastic bottles and kept on ice until being processed in the same day in the laboratory. Opportunity samples for cell counts only were collected off the fixed sampling locations when blooms were detected by discoloration of the water surface.
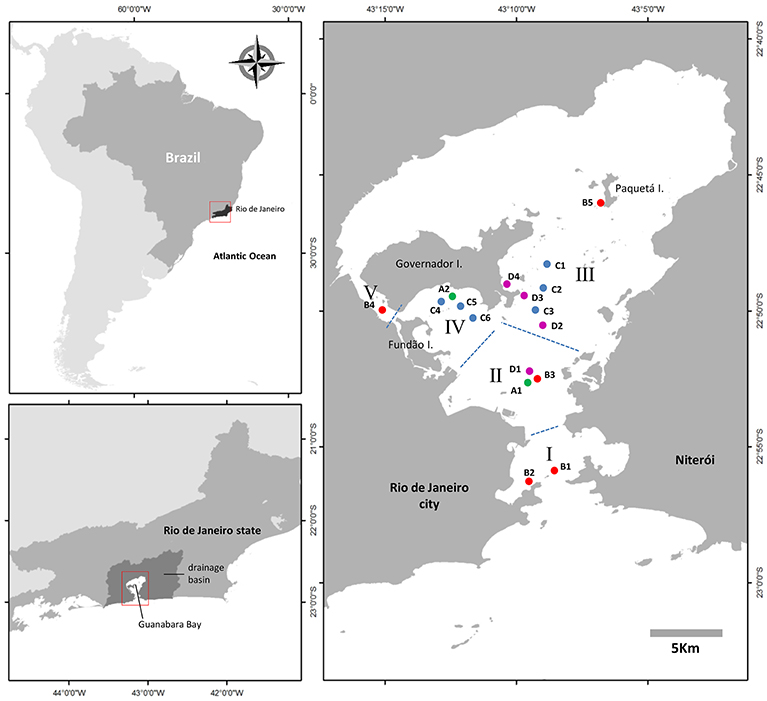
Figure 1. Map of Guanabara Bay showing the locations sampled in this study. Four sampling series (series A: green dots; series B: red dots; series C: blue dots; series D: magenta dots) were conducted from February, 2014 to January, 2018 to monitor C. subsalsa cell concentration in surface waters of the bay. Samples collected in series B were also analyzed for physical and chemical water parameters. Roman numbers represent zones within an eutrophication gradient from I (less impacted) to V (more impacted). See text for details on each sampling series.
Chattonella subsalsa Cell Counts and Morphology
Cell counts were done on live samples by means of an automated flow imaging microscopy system, FlowCam® (Fluid Imaging Technologies, Inc.), within 3 h after sampling. Samples brought from the field were further sieved through a 100 μm nylon mesh to remove large particles, thus preventing blockage of the capillary lines of the equipment. The FlowCam® was fitted with a 90 μm field-of-view flow-cell and a 10X magnification objective. Sample flow rate was set to 0.1 mL min−1. Samples were run for 20 min and imaged at 20 frames per second in auto-image mode with the threshold for acquisition set on an ESD (equivalent spherical diameter) value of 5 μm. Classification of C. subsalsa cells was done with the VisualSpreadsheeth® particle analysis software provided by the manufacturer of the FowCam® (Fluid Imaging Technologies, Inc.) based on a library of ca. five thousand C. subsalsa cells images selected from the Guanabara Bay database. A visual inspection was then performed by a human operator to correct for false positive and false negative errors by the software. C. subsalsa cell morphology was studied in live material following samplings in Guanabara Bay. A total of 1,776 sharp images from the FlowCam® displaying the cells from the dorso-ventral view were selected for measurements of cell length and width using the program VisualSpreadsheeth®. In all samples with detectable numbers of Chattonella cells they were also observed alive in the same day of sampling using an inverted microscope (Olympus IX70) equipped with a digital camera (Olympus XC-50). Morphology-based taxonomic identification was done based on the observations of live material in the microscope following Throndsen (1997) and Tomas et al. (2002).
Physical, Chemical, and Biological Water Parameters
Physical, chemical, and biological properties of the bay's water were assessed using standard oceanographic methods (Grasshoff et al., 1983; Parsons et al., 1984). Water temperature was measured with a YSI multiparameter sonde. Salinity was estimated chemically from chlorinity measurements. Water transparency was measured with a Secchi disk. Inorganic nutrients were analyzed as follow: ammoniacal nitrogen (the sum of N-NH3 + N-, referred to as ammonia) by indophenol; nitrite by diazotation; nitrate by reduction in a Cd-Cu column followed by diazotation; orthophosphate by reaction with ascorbic acid; silicate by reaction with molybdate. Total nitrogen was analyzed by nitrate determination after digestion with potassium persulfate, whereas total phosphorous was analyzed as phosphate after acid digestion. All nutrient analyses were performed in a Seal model AA3 AutoAnalyzer. Chlorophyll a analyses were performed after vacuum filtration (<25 cm of Hg) of water samples aliquots (minimum 250 mL) onto mixed cellulose esters membranes (Millipore HAWP 0.45 μm). Chlorophyll was extracted overnight in 90% acetone at 4°C and analyzed in a UV-VIS Perkin Elmer Lambda 20 spectrophotometer (Perkin Elmer, USA).
Climatological Data
Air temperature, wind speed, and pluviosity were obtained from a meteorological station located nearby sampling station B4 (Figure 1). Multivariated El Niño/Southern Oscillation (ENSO) Index, MEI (3-month running mean values) was obtained from the Earth System Research Laboratory database (National Oceanic and Atmospheric Administration—NOAA, https://www.esrl.noaa.gov/psd/data/climateindices/). MEI is determined as the first seasonally varying principal component of six atmospheric and oceanographic parameters (sea level air pressure, zonal, and meridional components of the surface wind, sea surface temperature, surface air temperature and cloudiness) in the tropical Pacific Ocean basin using data from the ICOADS (International Comprehensive Ocean-Atmosphere Data Set) (Wolter and Timlin, 1993, 1998). Negative values of the MEI represent the cold ENSO phase (La Niña) whereas positive MEI values represent the warm ENSO phase (El Niño).
Establishment of Chattonella subsalsa Cultures
Cultures of C. subsalsa were established from cells collected in Guanabara Bay in 2014 on sampling stations B4 and B5. Cells were picked with a capillary glass tube in an inverted microscope, transferred to sterile f/2 medium (Guillard, 1975) prepared with Guanabara Bay water with salinity adjusted to 20 and kept at 26°C, a photon flux of 50 μmoles photons m−2 s−1 (cool white fluorescent tubes) with a 14:10 ligh:dark cycle. After ca. 1 month, clonal cultures were established by single-cell sorting in a MoFlo® (Beckman-Coulter) flow cytometer (Fistarol et al., 2018). Four cultures established by this method were incorporated in the Culture Collection of Microorganisms at UFRJ (CCMR) under the collection codes CCMR0024, CCMR0025, CCMR0026, and CCMR0028. Cultures have since been maintained at the temperature and light regime as above by successive transfers to fresh medium on a monthly basis.
Growth Rates Estimates
C. subsalsa strains were grown in batch mode in f/2 medium prepared with Guanabara Bay water. Temperature and light regimes were as above. Strains were maintained in medium with salinity 20. Prior to the tests the salinity was gradually (1 salinity unit per day) adjusted toward salinity 10 and 30. None of the strains sustained growth during the salinity decrease. Strains that grew at salinity 30 were acclimated for 3 generations. Growth rates of each strain were then measured at salinity 20 and 30 in triplicate 500-mL florence flat-bottom borosilicate glass flasks containing 250 mL of f/2 medium prepared with Guanabara Bay water. Volumes of 5 mL were harvested from each flask every second day, fixed with a mixture of 1% paraformaldehyde, 1% glutaraldehyde, 30 mM HEPES and an amount of sucrose to match the osmotic pressure of the medium (Katano et al., 2009), and counted in the microscope at 20X magnification using Palmer-Maloney counting chambers. A minimum of 400 cells were counted in each sample. Specific growth rates were calculated as the slope of a least-squares regression line between the natural logarithm of cell concentration and time, with time as the abscissa, during the exponential growth phase (Guillard, 1973).
Toxicity Assays
The toxicity of two C. subsalsa strains (CCMR0024 and CCMR0026) kept in culture were accessed by exposing Artemia salina nauplia to live raphidophyte cells. Dried A. salina cysts were hatched in seawater with the salinity adjusted to 20. Artemia salina nauplia with 48 h of life after hatching were used in the tests. C. subsalsa strains were grown in 250 mL batch cultures under the conditions described above. Dilution series of C. subsalsa cells were prepared with cells harvested at late exponential phase by addition of fresh f/2 medium to achieve five concentrations ranging from 624 to 40,000 cells mL−1. Aliquots of 10 mL from each C. subsalsa cell dilution were added to quadruplicate vials containing 20 A. salina nauplia each, resulting in five concentrations ranging from 312 to 20,000 cells mL−1. The vials were incubated at the same conditions as the C. subsalsa cultures used for the tests. Artemia salina nauplia were observed after 48 h and scored as alive (motile) or dead (non-motile).
Molecular Characterization of Chattonella subsalsa
Cultures of C. subsalsa established from single cells collected in the bay were characterized by 18S rDNA sequencing. DNA extraction was done on a cell pellet collected from 500 μL of culture by CTAB and chloroform method (Rogers and Bendich, 1994). The small ribosomal subunit (SSU) was amplified by PCR with primers 1F (5'-AACCTGGTTGATCCTGCCAGT-3') and 1528R (5'-TGATCCTTCTGCAGGTTCACCTAC-3') (Klöpper et al., 2013). Amplification was performed in a Gene Amp 9,700 thermocycler in 25 μL reaction volumes containing 2.5 μL of a 10 μM solution of each primer, 1 μL of template DNA (50 ng), 12.5 μL of GoTaq® G2 Green Master Mix, and 6.5 μL of ddH2O. The thermal cycle consisted of an initial denaturation step at 95°C for 2 min., followed by 30 cycles of 95°C for 1.5 min., 55°C for 1 min., 72°C for 2 min., and a final extension at 72°C for 7 min. Aliquots of 5 μL of the PCR products were purified with 2 μL of Exosap-ITTM for 15 min. at 37°C and then 15 min. at 80°C. Sequencing was done using dye-terminator chemicals (BigDye® Terminator v3.1 Cycle Sequencing Kit) following the manufacturer's instructions and read in an ABI PRISM® 3500 Genetic Analyzer (Applied Biosystems). Sequencing primers were 528F (5′-GCGGTAATTCCAGCTCC AA-3′), 1055F (5′-GGTGGTGCATGGCCGTTCTT-3′), 536R (5′-AATTACCGCGGCKGCTGGCA-3′) and 1055R (5′-ACGGCCATGCACCACCACCCAT-3′) (Scholin et al., 1994; Klöpper et al., 2013). The sequences obtained were analyzed with the software Kodon v. 2.04 (Applied Maths). Their similarity with other published sequences was obtained using the BLASTn option in the GenBank database (https://www.ncbi.nlm.nih.gov). A phylogenetic reconstruction was done based on a sequence alignment conducted in Clustal (Higgins and Sharp, 1988; Chenna et al., 2003) including four C. subsalsa sequences obtained in this study and sequences from other 16 raphidophytes of the genera Chattonella and Heterosigma, the latter used as an outgroup. The evolutionary model was determined with ModelTest. The GTR+I+G was chosen and implemented in the phylogenetic reconstruction that was done by the Maximum-Likelihood method with 1,000 bootstrap replications using Mega7 (Kumar et al., 2016).
Statistical Analysis
A principal component analysis (PCA) was performed based on a correlation matrix with data from the 5 locations of the sampling series B (B1 to B5) using C. subsalsa cell concentration, chlorophyll a concentration, water temperature, salinity and transparency (Secchi depth), inorganic nutrient concentrations (orthophosphate, nitrite, nitrate, ammonia, and silicate), and total phosphorus and nitrogen concentrations as variables. Another PCA was conducted based on a correlation matrix using maximum monthly C. subsalsa cell concentrations for the whole bay, the Multivariated ENSO Index (MEI), average monthly air temperature, accumulated monthly pluviosity, and maximum monthly wind speed as variables. A multiple regression analysis was performed to test the correlation between maximum monthly C. subsalsa cell concentration over the whole bay and the climatological variables MEI, average monthly air temperature, accumulated monthly pluviosity, and maximum monthly wind speed.
For the laboratory growth experiments, an analysis of variance (ANOVA) followed by a Tukey HSD (honestly significant difference) test was done to check for differences among average C. subsalsa strains growth rates cultivated at different salinities. For the toxicity tests, the concentration of C. subsalsa cells causing 50% Artemia salina nauplia mortality within 48 h of exposure (48 h-LC50) was estimated by the Trimmed Spearman-Karber method with 95% confidence intervals (Hamilton et al., 1977).
Results
Physical and Chemical Characteristics of the Environment
Water quality parameters were measured during the monthly monitoring that took place from October 2014 to January 2018 at five fixed locations (sampling series B). Average salinity for this period was above 30 in the stations close to the bay's entrance and along the bays main channel, whereas in the shallow embayment, such as at station B4 (Figure 1), salinity was lower, averaging 25 with wide variation toward lower salinities (minimum of 14.6) (Figure 2A). Water temperature, on the other hand, was on average higher on station B4 (average 25°C) compared to the other stations (Figure 2B). Transparency, measured as Secchi disc depth, showed a strong variation across the bays axis, from ca. 3 m at the bay's entrance to < 1 m at station B4 (Figure 2C). Silicate increased from the entrance (stations B1 and B2) toward the inner parts of the bay, with the highest values (average 24 μM) at station B4 (Figure 2D). Average nitrate concentration was above 2 μM, except in station B4 (average 0.7 μM) with maxima in excess of 9.8 μM (Figure 2E). Nitrite concentrations ranged from 1.6 to 2.2 μM, increasing from the bay's entrance toward its inner parts (Figure 2F). Ammonia (Figure 2G) and orthophosphate (Figure 2H) were much higher at station B4 (>200 and >10 μM, respectively) that in other parts of the bay, as also observed for organic nitrogen (Figure 2I) and organic phosphorus (Figure 2J). Average chlorophyll a concentrations were high across the bay, increasing from the entrance to the inner parts, with extremely high values in excess of 500 μg L−1 at station B4 (average 110 μg L−1) (Figure 2K).
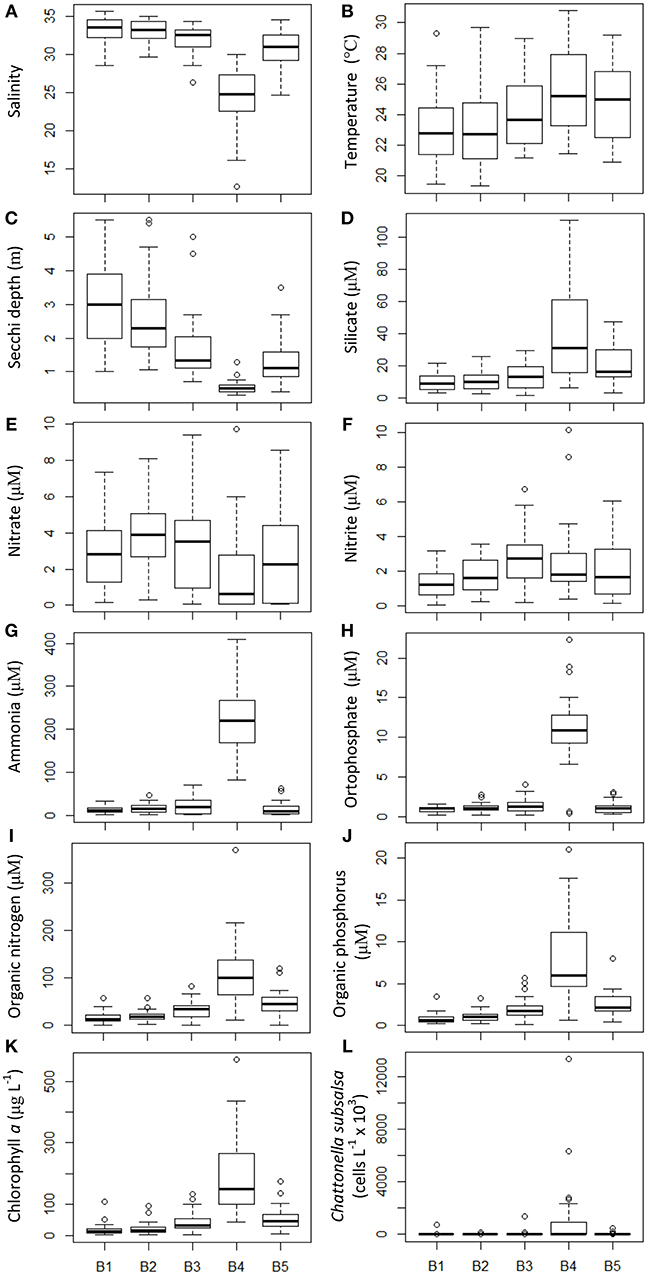
Figure 2. Physical and chemical water parameters and C. subsalsa cell concentration in five locations (B1 to B5, see map in Figure 1) in Guanabara Bay sampled on a monthly basis from October 2014 to January 2018. (A) salinity; (B) water temperature; (C) Secchi depth; (D) silicate; (E) nitrate; (F) nitrite; (G) ammonia; (H) orthophosphate; (I) organic nitrogen; (J) organic phosphorus; (K) chlorophyll a; (L) C. subsalsa cell concentration. The box plot shows mean (thick line inside the box), first and third quartiles (lower and upper box limits), standard deviation (whiskers) and outliers (open circles beyond the whiskers).
Climatology
The Multivariated El Niño Index (MEI) during the 4 years of the monitoring in Guanabara Bay (February 2014 to January 2018) showed a strong, positive phase that lasted from the end of 2014 to the first quarter of 2016, with the strongest positive period (MEI above +1) during the austral spring and summer of 2015–2016 (Figure 3B). Local monthly average air temperature (Figure 3C) ranged between 23°C during winters to ca. 29°C in the summers. Average maxima were close to 40°C in the summers whereas minima were ca. 16°C in winters. Average monthly rainfall (Figure 3D) was higher from December to March with peaks of 100 to 150 mm with exception of the summer 2015–2016 that showed levels up to 220 mm, coinciding with the strong positive MEI period.
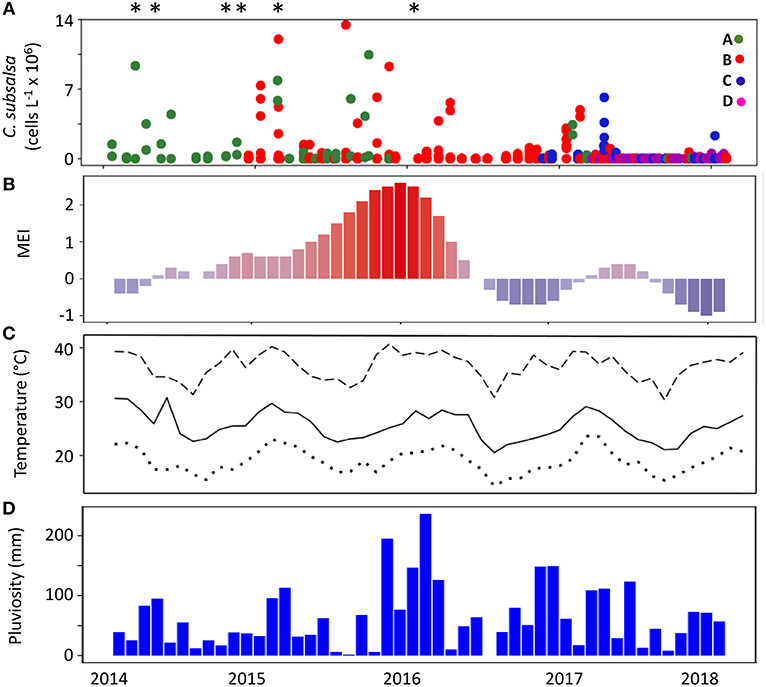
Figure 3. Concentration of C. subsalsa cells in Guanabara Bay and climatological parameters over a 4-year period (February, 2014 to January, 2018). (A) C. subsalsa cell concentration detected in samples from four monitoring series (A–D, see map in Figure 1 for details), *Fish-kills in Guanabara Bay reported in the local media; (B) Multivariate El Niño Index; (C) average (solid line), maximum (dashed line), and minimum (dotted line) monthly air temperature; (D) accumulated monthly pluviosity.
Chattonella Subsalsa Blooms
The analysis of 563 samples collected within the 4 sampling series (A to D) during the survey in Guanabara Bay from February 2014 to January 2018 showed a consistent occurrence of C. subsalsa cells above the detection limit of our technique using the FlowCam® (i.e., 0.00087 × 10⁶ cells L−1). Cell densities in excess of 13 × 106 cell L−1 were observed during massive blooms (Figure 2L, 3A and Table 1). A total of 37 samples had >0.1 × 10⁶ cell L−1 with 24 of those above 0.5 × 10⁶ cell L−1 (Table 1). Most of these high cell density events were observed within the zones IV and V (see map in Figure 1) that encompass stations A2, B4, C4, to C6 in the shallow arears south and west of the Governador Island. Station B4 alone (zone V) accounted for 42% (10 out of 24) of all records of C. subsalsa above 0.5 × 10⁶ cell L−1 (Table 1). The number of blooms and the maximum concentrations of C. subsalsa decreased consistently toward sampling stations within zones I to II, located on or near the bay's main channel (Figure 2L, Table 1). Fish-kills were reported in the local media at least on six occasions from April, 2014 to mid-January, 2016 (Figure 3A), mostly in the inner parts of the bay.
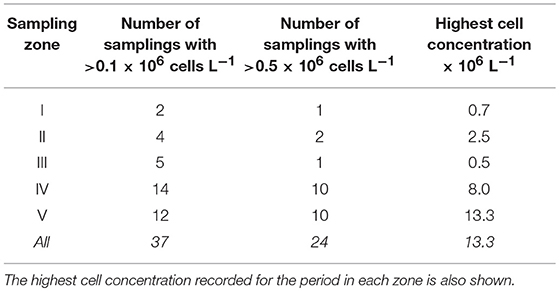
Table 1. Number of C. subsalsa blooms with >0.1 × 10⁶ cells L−1 and >0.5 × 10⁶ cells L−1 in five zones of Guanabara Bay as shown in the map of Figure 1.
Chattonella Morphology and Molecular Characterization
Live Chattonella cells from Guanabara Bay were analyzed in the microscope and in the FlowCam® in all samples where cells were detectable. A set of 1,776 cells measured in the images from the FlowCam® were 34.9 ± 4.5 μm (mean ± SD) long and 20.1 ± 3.1 μm (mean ± SD) wide (Table 2). Cells appeared pyriform, often elongated, with roundish, golden to brownish chloroplasts densely packed filling up nearly the whole cell (Figure 4). Cell surface often appeared lumpy with chloroplasts protruding to form an irregular surface. Two flagella emerging from a subapical groove were visible in the microscope. A hyaline, tail-like protrusion at the posterior end of the cells, one of the hallmarks of C. subsalsa Biecheler (Tomas et al., 2002), was often observed both in the microscope and in the FlowCam® images (Figure 4).
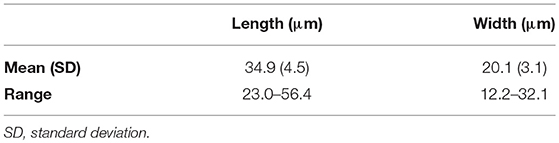
Table 2. Linear dimensions of C. subsalsa from Guanabara Bay based on 1,776 images of live cells obtained with the FlowCam®.
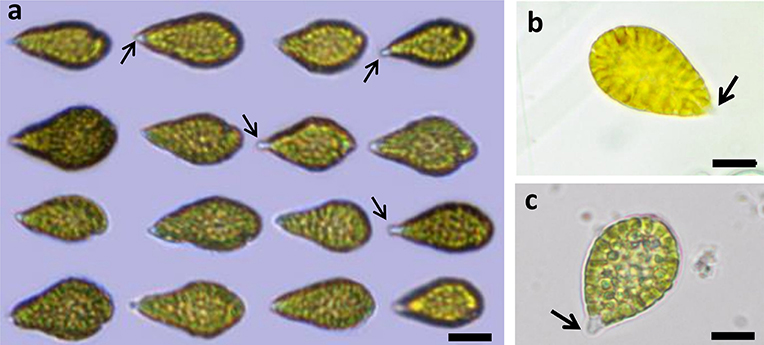
Figure 4. Live C. subsalsa cells from plankton samples collected in Guanabara Bay. (a) Live cells imaged by the FlowCam® (b,c) Live cells observed in an inverted mircroscope at 40X magnification. The hyaline, tail-like protrusion at the posterior end of the cells typical of C.subsalsa can be seen (arrows). Scale: a: 10 μm, b and c: 20 μm.
Sequencing of the 18S rDNA gene from the four Chattonella isolates produced 701 nt. long, identical sequences. The sequences are deposited in the GenBank database (National Center for Biotechnology Information, NCBI) under accession numbers MK217469, MK217470, MK217471, and MK217472. A BLASTn search showed that the sequences were 100% similar to sequences of C. subsalsa. In a phylogenetic reconstruction (Figure 5) with other raphidophytes, 18S rDNA sequences from the four Guanabara Bay isolates clustered together with other C. subsalsa sequences with 97% bootstrap support, as a sister group to a cluster containing C. marina var. antiqua and C. minima. The Chattonella genus cluster was separated from the other raphytophyte genus, Heterosigma, with 99% bootstrap support.
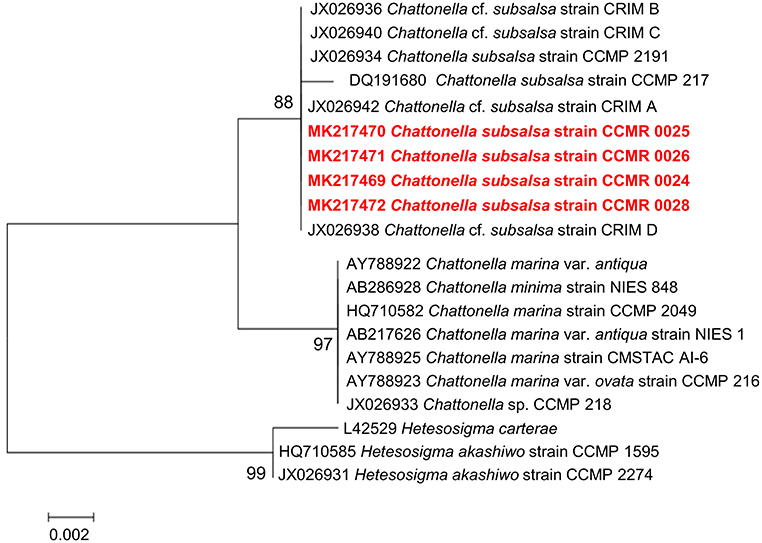
Figure 5. Phylogenetic reconstruction of C. subsalsa strains isolated from Guanabara Bay (red, boldface font) and other raphidophytes based on 18S rDNA sequences. The evolutionary history was inferred by using the Maximum Likelihood method based on the Tamura-Nei model. A discrete Gamma distribution was used to model evolutionary rate differences among sites [5 categories (+G, parameter = 0.1000)]. The tree is drawn to scale, with branch lengths measured in the number of substitutions per site. The analysis involved 20 nucleotide sequences. All positions containing gaps and missing data were eliminated. There were a total of 699 positions in the final dataset. Evolutionary analyses were conducted in MEGA7.
Growth Rates of C. subsalsa Cultures
The four C. subsalsa strains isolated from Guanabara Bay grew well when inoculated in f/2 medium with salinity 20 and 30 (Figure 6). Attempts to grow the strains in salinity 10 and in freshwater failed. Growth rates (μ) ranged from 0.23 ± 0.06 d−1 (mean ± SD) for strain CCMR0025 up to 0.81 ± 0.04 d−1 (mean ± SD) for strain CCMR0026, at salinity 20. Average growth rate for all four strains was 0.50 ± 0.23 d−1 (mean ± SD) when growing in salinity 20 and 0.54 ± 0.10 d−1 (mean ± SD) in salinity 30. Strain CCMR0025 grew significantly faster at salinity 30, whereas strain CCMR0026 grew significantly faster at salinity 20. The other two strains grew equally fast at both salinities (Figure 6; Table S1).
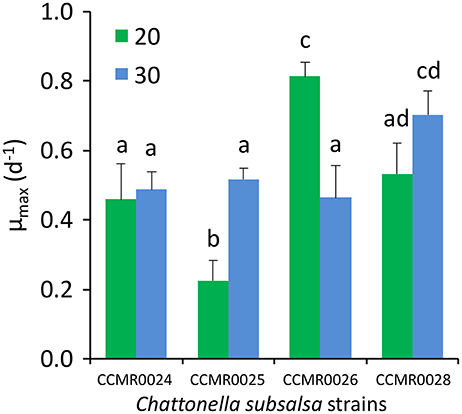
Figure 6. Maximum growth rate of four C. subsalsa strains isolated from Guanabara Bay cultivated in two salinities (20 and 30). Values are average of triplicate cultures for each salinity. Different letters above the bars indicate significant differences in growth rate according to an ANOVA with Tukey's HSD post-hoc test (p < 0.05). Whiskers: 1SD.
Toxicity of C. subsalsa Cultures
The C. subsalsa strains CCMR0024 and CCMR0026 were both equally toxic to Artemia salina nauplia. The LC50-48h was 7.5 × 10⁶ cells L−1 (95% CI: 4.7 × 10⁶ to 11.9 × 10⁶ cells L−1) for strain CCMR0024 and 7.3 × 10⁶ cells L−1 (95% CI: 4.5 to 11.7 × 106× 106 cells L−1) for strain CCMR0026.
Influence of Water Parameters and Climatology on C. subsalsa Cell Concentrations
A total of 163 samples collected during the survey in Guanabara Bay (sampling series B) were used in a PCA to check the influence of local environmental variables on the occurrence of C. subsalsa (Figures 7A,B; Table S2). The first and second components explained 71% of the variance. The first component was negatively correlated (factor-variable correlation <-0.5) with C. subsalsa cell concentration (−0.53), chlorophyll (−0.88), phosphate (−0.87), organic phosphorus (−0.86), total phosphorus (−0.97), ammonium (−0.86), organic nitrogen (−0.85), total nitrogen (−0.94), and silicate (−0.67), and positively correlated (factor-variable correlation >0.5) with salinity (0.83) and water transparency (0.66). The second component was negatively correlated with nitrite (−0.84) and nitrate (−0.79) concentrations and positively correlated with water temperature (0.56). Samples collected at station B4 (shallow enclosed area of the bay) clustered together separated from the others (main channel of the bay) (Figure 7B). A second PCA was done to check the influence of climatological variables on C. subsalsa cell concentrations (Figures 7C,D; Table S3). The two first components explained 67% of the variance. In this case, the first component was negatively correlated (factor-variable correlation < -0.5) with average monthly air temperature (−0.88) and maximum monthly wind speed (−0.82). The second component was negatively correlated with maximum monthly C. subsalsa cell concentrations (−0.56) and the MEI (−0.88) (Figure 7C; Table S3). Accumulated monthly pluviosity, despite being closely associated with MEI and C. subsalsa in the diagram of the two first components (Figure 7C), was only weakly correlated to the first (−0.38) and the second (−0.31) components (Table S3). Samples collected in summer and spring formed a cluster apart from samples taken in autumn and winter, influenced by the variables average monthly air temperature and maximum wind speed of component 1 (Figure 7D). The multiple regression analysis between monthly maximum C. subsalsa cell concentrations and climatological variables showed significant correlation only between C. subsalsa concentration and MEI (Pearson's r = 0.36; p = 0.007) (Table S4).
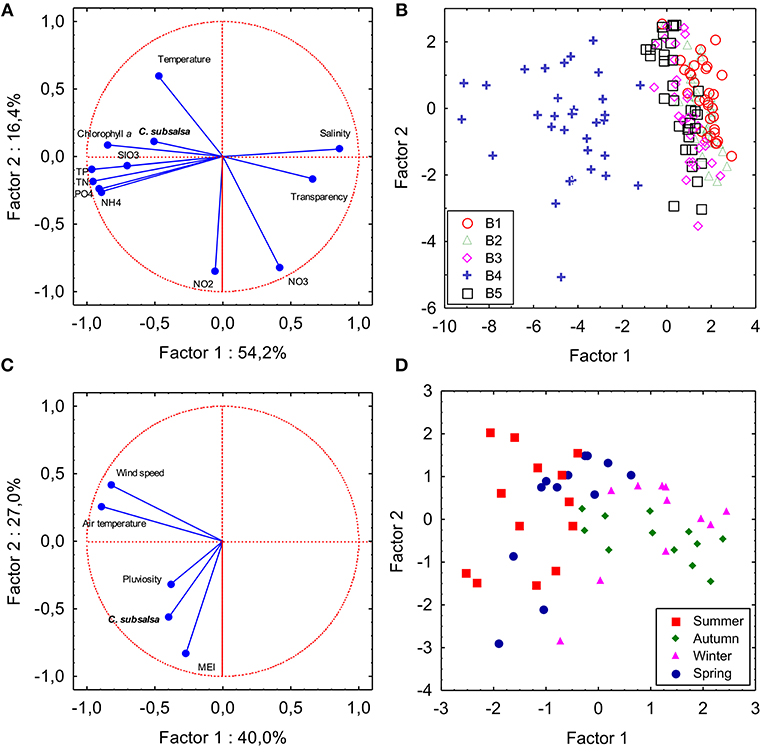
Figure 7. Principal component analysis. Plots showing variables and samples plotted on the two first components axes. (A,B) PCA based on a correlation matrix of C. subsalsa cell concentration and water physical and chemical variables of 163 samples collected in five locations in Guanabara Bay (series B). SIO3: silicate; PO4: orthophosphate; NH4: ammonia; NO2: nitrite; NO3: nitrate; TP: total phosphorus; TN: total nitrogen. (C,D) PCA based on a correlation matrix of monthly C. subsalsa maximum cell concentration and climatological variables from February, 2014 to January, 2018. MEI: Multivariate El Niño Index. Sampling season is indicated in the samples coordinates plot.
Discussion
Frequency and magnitude of harmful algal blooms in aquatic environments result from a combination of factors. Cultural eutrophication and climate-induced changes in physical and chemical properties of coastal ecosystems are major drivers of a global increase of such blooming events (Burkholder et al., 2006; Heisler et al., 2008). Raphidophytes such as the genus Chattonella thrive in nutrient-enriched waters during warm periods (Onitsuka et al., 2015). Their ability to perform mixotrophy by the uptake of dissolved organic compounds as well as particles such as bacteria make them good competitors as eutrophication increases (Burkholder et al., 2008; Jeong et al., 2010). Our four-year monitoring unveiled a consistent presence of C. subsalsa in the surface waters of Guanabara Bay, with recurrent blooming events at very high concentrations. Although the genus Chattonella has been previously reported as a component of the bay's phytoplankton community (Valentin et al., 1999; Villac and Tenenbaum, 2010; Odebrecht et al., 2018) even in bloom conditions (Sevrin-Reyssac et al., 1979), this is the first systematic, long-term survey that shows its regular presence and blooming frequency in this important and heavily impacted estuarine system.
Guanabara Bay's poor water quality and high pollution levels, especially due to high loads of untreated urban waste from its drainage basin is well-known and acknowledged as one of the main environmental issues in the highly populated metropolitan area of Rio de Janeiro city (Paranhos et al., 1998; Fistarol et al., 2015). High chlorophyll levels normally found in the bay are evidence of its high primary productivity and the occurrence of algal blooms (Fistarol et al., 2015; Oliveira et al., 2016). During our survey of series B (five stations), chlorophyll concentrations in excess of 100 μgL−1 were registered several times. Remarkably, little is known of the identity of the causative microalgae blooming in the bay's waters. The nearby coastal area of the Atlantic Ocean and other estuarine systems north and southward from the Guanabara Bay entrance, notably the Rodrigo de Freitas Lagoon, characterized by high nutrient levels and very limited water exchange with the ocean, have recurrent blooms of harmful species, including the fish-killer raphidophyte Heterosigma akashiwo, with multiple records of massive fish-kills (Branco et al., 2014; Castro et al., 2016).
The time-span, spatial coverage and high number of samplings (>500 in total) conducted in this study was crucial to construct a clear picture of the main areas of the bay where C. subsalsa is more abundant, i.e., the shallow enclosed areas west of the main channel nearby Governador Island (zones IV and V, Figure 1, Table 1). This was also the area with the highest levels of nutrients, as well as organic P and N, and chlorophyll a concentrations, and the lowest water transparency, and therefore this region is classified as hypereutrophic (Ryding and Rast, 1989; Fistarol et al., 2015). Autotrophic biomass production is directly linked to the availability of light (Cadée and Hegeman, 1979; Joint and Pomroy, 1981; Pennock and Sharp, 1986). The contribution of nutrients and organic matter tends to decrease water transparency in coastal areas (Cloern, 1987; Gameiro et al., 2011). Light is likely a limiting factor for autotrophic growth in the shallow areas of Guanabara Bay around zone IV and V as Secchi depth was often <1 m, mainly during the rainy season (spring and summer). During periods of light limitation, C. subsalsa may utilize mixotrophy as this nutritional strategy may be triggered not only by nutrients limitation, but also by light shortage (Nygaard and Tobiesen, 1993; Jones, 1994, 2000; Jeong et al., 2010). The PCA with C. subsalsa concentration and water quality properties corroborates this observation as C. subsalsa was correlated with the component that represents eutrophication caused by freshwater discharges into the bay (low salinity, low transparency, high P, and N organic loads, high phosphate and ammonia). The occurrence of C. subsalsa in other sampling areas along the main axis of the central channel (zones I, II and III) was much lower and is probably the result of transport of cells from the shallow areas by tidal currents that penetrate the bay from the entrance in the south and reach up to the area around station B5, nearby Paquetá Island, in the north portion of the bay (Kjerfve et al., 1997). The area around station B4 is, therefore, a source of C. subsalsa that, on occasions, might be detected in bloom concentrations as far as the bay entrance (zone I). Similarly, the shallow areas north of the Governador Island that are also nutrient-rich (Mayr et al., 1989; Kjerfve et al., 1997; Fistarol et al., 2015) might also be suitable for C. subsalsa blooms formation. As this area was not covered by our monitoring, this remains as a hypothesis to be investigated in future studies.
Members of the genus Chattonella are known to be euryahaline (Khan et al., 1995; Strom et al., 2013) which is well in line with our observation of growth by the four C. subsalsa strains in both salinity 20 and 30. This phenotypical plasticity of C. subsalsa is an important trait for its success in a highly variable environment influenced by the tide as the Guanabara Bay (Paranhos and Mayr, 1993). The fact that C. subsalsa isolated from the bay grew well in both conditions, albeit significant differences in two of the four strains, indicates that salinity is not the limiting factor for the occurrence of the species and that low hydrodynamics and excess of nutrient and organic matter in the enclosed areas offer a suitable niche for the species to bloom. Moreover, the relatively high growth rates of most strains tested in this study highlights the potential of C. subsalsa to rapidly develop blooms when environmental conditions are suitable. An average specific growth rate of 0.5 d−1, as measured for our strains , equals a doubling time of 1.3 d, which is fast enough to overcome flushing by the tides, since it takes ca. 11 days to renew 50% of the water in the bay (Kjerfve et al., 1997). Also, this half-residence time is an average for the whole bay. Water renewal in areas of more restricted circulation, as around station B4, is likely to be longer.
Perhaps one of the most striking features of the C. subsalsa concentration time-series produced here is the observation that blooms were more frequent during the positive MEI period, which also coincided with a slightly high rainfall period in the bay area. Accordingly, the PCA based on climatological data associated C. subsalsa abundance with positive MEI, whereas local temperature and wind speed had less contribution in explaining the blooms. Average monthly pluviosity, although correlated with the same principal component as C. subsalsa and MEI, indicating that these variables may change together, was not significantly correlated to monthly maximum C. subsalsa cell concentrations in the multiple regression analysis. Nevertheless, the PCA performed with individual sampling locations water parameters indicated that C. subsalsa concentration is higher in areas of the bay with low salinity and high nutrient loads. Thus, it was reasonable to expect some positive effect of periods of higher pluviosity on the occurrence of blooms due to an increase in riverine discharge that carries more nutrients into the bay. Such effect may not have been fully captured in our analysis due to the temporal and spatial scales of pluviosity and C. subsalsa cell concentrations of our dataset. Also, a possible time lag in the response of the raphidophyte growth to precipitation might have contributed to this lack of correlation. A more comprehensive time series analysis of pluviosity over the entire bay's drainage basin and C. subsalsa concentrations is necessary to clarify such causal relationship. Periods of El Niño (the positive phase of the ENSO phenomenon, thus positive MEI) are marked by an increase in average precipitation and also in the frequency and intensity of extreme rainfall events in the south and southeastern regions of South America, including the borderline of the tropical belt (22.79°S) where Guanabara Bay is located (Grimm and Tedeschi, 2009). Conditions for C. subsalsa bloom development are strongly linked to nutrient discharged into the bay, which is driven by factors that influence pluviosity, e.g., regional climatic setups that are governed by cyclic, global climatic phenomenon with rather irregular decadal frequency such as the ENSO. The influence of climate-induced changes in coastal ecosystems as promoter of more frequent and intense HABs is well-acknowledged (Edwards et al., 2006; Onitsuka et al., 2015). Extreme El Niño events are expected to occur twice as often in a scenario of global temperature increase of 1.5°C (Wang, 2017), which will likely increase even more the frequency of C. subsalsa blooms in Guanabara Bay.
The occurrence of Chattonella species in coastal waters is a nuisance mostly due to their high fish-killing potential (Marshall et al., 2003). C. subsalsa strains isolated from Guanabara Bay were lethally toxic to brine shrimp nauplia at cell concentrations of 7.4 × 10⁶ cells L−1 which is less than the highest natural levels found in this environment. Harmful effects of Chattonella on fish can be elicited at cell densities as low as 0.1 x10⁶ cells L−1 (Imai et al., 2006). Mortality to brine shrimp, although not a direct measure of ichthyotoxicity, demonstrates a toxic potential by Guanabara Bay's C. subsalsa cultures. Brine shrimp is commonly used as test organism to screen the toxic potential of microalgae and cyanobacteria (Lincoln et al., 2008) and also respond to the presence of ichthyotoxic species as shown during blooms of Prymnesium parvum in a brackish lake in Finland (Lindholm et al., 1999). The toxic potential of our strains, added to repeated reports of fish-kills during the period when C. subsalsa blooms were more frequent and intense in the bay, highlight the threat posed by this microalga to the bay's fish communities. Brevoortia aurea, known as Brazilian menhaden, is the main fish species affected during mass mortalities observed in the bay (Fistarol et al., 2015). A more robust causal relationship between the occurrence of C. subsalsa blooms and fish-kills in this environment awaits further investigation as the occurrence of harmful algae during fish kills does not necessarily reflect a cause-and-effect relationship (Lewitus et al., 2003). Water samples might be collected too long after fish kills to assess whether mortality is associated with phycotoxins, or a more general effect e.g. oxygen depletion and suffocation. The scale of sampling might also be inadequate to register the exact conditions of the bloom at the onset or during fish-kills. Also, it is important to notice that this hypereutrophic estuary harbors other potential fish-killing microalga e.g., the dinoflagellate Karlodinium venificum and the raphidophyte Heterosigma akashiwo (Fistarol et al., 2015; Higashi et al., 2017). However, during the four-year monitoring neither genera were found as a major phytoplankter in our samples. Likewise, Chattonella cell morphology detected throughout our monitoring was consistent with C. subsalsa (Throndsen, 1997; Tomas et al., 2002) across sampling points and over time. Moreover, our molecular characterization corroborates the morphology of the raphidophyte as C. subsalsa. We thus conclude that although other raphidophytes do occur in Guanabara Bay (Higashi et al., 2017) it seems that the dominant member of the group in this estuary is C. subsalsa.
A recent and exhaustive review on the occurrence of HABs along the Brazilian coast from 2006 to 2016 (Castro et al., 2016) did not report blooms in Guanabara Bay, despite the extremely high chlorophyll biomass normally found in its waters (Mayr et al., 1989; Kjerfve et al., 1997; Oliveira et al., 2016). Our monitoring focusing on a single HAB species unveiled several blooms over a relatively short period of time. Recurrent, massive HAB events seem to be a neglected subject in Guanabara Bay research programs. Potentially toxic blooms of C. subsalsa in Guanabara Bay are nourished by a heavy load of nutrients of riverine origin. Global climatic drivers such as the ENSO and its influence on regional climate result in periods of more favorable conditions for bloom formation. As seen in other coastal areas worldwide (e.g., Imai et al., 2006) reducing organic matter and inorganic nutrient inputs to Guanabara Bay is paramount to mitigate C. subsalsa blooms and its harmful effects.
Author Contributions
PS designed and coordinated the study. TV, GF, and PS wrote the manuscript. DT and AS-L revised the paper. RM did the field sampling. RM, MA, and TV processed field samples for cell counts. BC and DC performed laboratory experiments. PH was responsible for DNA sequencing. TV, GF, AS-L, JV, and EA contributed to data analyses. RP contributed with data and logistic support for field sampling.
Conflict of Interest Statement
The authors declare that the research was conducted in the absence of any commercial or financial relationships that could be construed as a potential conflict of interest.
Acknowledgments
We thank the Brazilian research council Conselho Nacional de Desenvolvimento Científico e Tecnológico, CNPq (grants 477429/2012-2 to PS, 441215/2017-3 to JV, and 311075/2018-5 to EA), and the Rio de Janeiro state research council, FAPERJ (grants E26/202.911/2018 to PS, E26/111.584/2014 to JV, and E-26/202.789/2015 to EA) for funding. This study was financed in part by the Coordenação de Aperfeiçoamento de Pessoal de Nível Superior-Brasil (CAPES)-Finance Code 001. TV thanks CNPq and CAPES for PhD scholarships. GF thanks CNPq for the postdoctoral scholarship (150206/2018-6).
Supplementary Material
The Supplementary Material for this article can be found online at: https://www.frontiersin.org/articles/10.3389/fmars.2019.00085/full#supplementary-material
References
Band-Schmidt, C. J., Morquecho, L., Hernández-Becerril, D. U., Reyes-Salinas, A., and Bravo-Sierra, E. (2004). Raphidophyceans on the coasts of Mexico. Hydrobiologia 515, 79–89. doi: 10.1023/B:HYDR.0000027320.00977.8b
Branco, S., Menezes, M., Alves-de-Souza, C., Domingos, P., Schramm, M. A., and Proença, L. A. O. (2014). Recurrent blooms of Heterosigma akashiwo (Raphidophyceae) in the Piraquê Channel, Rodrigo de Freitas Lagoon, Southeast Brazil. Braz. J. Biol. 74, 529–537. doi: 10.1590/bjb.2014.0074
Burkholder, J. M., Dickey, D. A., Kinder, C. A., Reed, R. E., Mallin, M. A., McIver, M. R., et al. (2006). Comprehensive trend analysis of nutrients and related variables in a large eutrophic estuary: a decadal study of anthropogenic and climatic influences. Limnol.Oceanogr. 51, 463–487. doi: 10.4319/lo.2006.51.1_part_2.0463
Burkholder, J. M., Glibert, M. P., and Skelton, H. M. (2008). Mixotrophy, a major mode of nutrition for harmful algal species in eutrophic waters. Harmful Algae 8, 77–93. doi: 10.1016/j.hal.2008.08.010
Cadée, G. C., and Hegeman, J. (1979). Phytoplankton primary production, chlorophyll and composition in an inlet of the western Wadden Sea (Marsdiep). Neth. J. Sea Res., 13, 224–241. doi: 10.1016/0077-7579(79)90004-8
Castro, N. O., Domingos, P., and Moser, G. A. O. (2016). National and international public policies for the management of harmful algal bloom events. A case study on the Brazilian coastal zone. Ocean Coast. Manage. 128, 40–51. doi: 10.1016/j.ocecoaman.2016.04.016
Chenna, R., Sugawara, H., Koike, T., Lopez, R., Gibson, T. J., Higgins, D. G., et al. (2003). Multiple sequence alignment with the Clustal series of programs. Nucl. Acids Res. 31, 3497–3500. doi: 10.1093/nar/gkg500
Cloern, J. E. (1987). Turbidity as a control on phytoplankton biomass and productivity in estuaries. Cont. Shelf Res. 7, 1367–1381. doi: 10.1016/0278-4343(87)90042-2
Edvardsen, B., and Imai, I. (2006). The ecology of harmful flagellates within Prymnesiophyceae and Raphidophyceae, in Ecology of Harmful Algae, ed E. Granéli (Berlin: Springer Verlag), 67–79.
Edwards, M., Johns, D. G., Leterme, S. C., Svendsen, E., and Richardon, A. J. (2006). Regional climate change and harmful algal blooms in the northeast Atlantic. Limnol. Oceanogr. 51, 820–829. doi: 10.4319/lo.2006.51.2.0820
Fistarol, G. O., Coutinho, F. H., Moreira, A. P. B., Venas, T., Cánovas, A., de Paula, S. E. M. Jr., et al. (2015). Environmental and Sanitary Conditions of Guanabara Bay, Rio de Janeiro. Front. Microbiol. 6:1232. doi: 10.3389/fmicb.2015.01232
Fistarol, G. O., Hargreaves, P. I., Walter, J. M., Viana, T. V., Gomes, P. D. F., Lourenço, et al. (2018). Rapid isolation of culturable microalgae from a tropical shallow lake system. J. Appl. Phycol. 30 1807–1819. doi: 10.1007/s10811-018-1404-7
Gameiro, C., Zwolinski, J., and Brotas, V. (2011). Light control on phytoplankton production in a shallow and turbid estuarine system. Hydrobiologia 669:249. doi: 10.1007/s10750-011-0695-3
Grasshoff, K., Erhardt, M., and Kremling, K. (1983). Methods of Seawater Analysis. Weinheim: Verlag Chemie.
Grimm, A. M., and Tedeschi, R. G. (2009). ENSO and extreme rainfall events in South America. J. Climate 22, 1589–1609. doi: 10.1175/2008JCLI2429.1
Guillard, R. R. L. (1973). Division rates, in Handbook of Phycological Methods: Culture Methods and Growth Measurements, ed J. R. Stein (Cambridge: Cambridge University Press), 289–312.
Guillard, R. R. L. (1975). Culture of phytoplankton for feeding marine invertebrates, in Culture of Marine Invertebrate Animals, eds W. L. Smith and M. H. Chanley (New York, NY: Plenum Press), 26–60.
Hallegraeff, G. M., Anderson, D. M., Cembella, A. D., and Enevoldsen, H. O. (2004). Manual on Harmful Marine Microalgae. Paris: UNESCO.
Hallegraeff, G. M., and Hara, Y. (2003). Taxonomy of harmful marine raphidophytes, in Manual on Harmful Marine Microalgae, eds G. M. Hallegraeff, D. M. Anderson, A. D. Cembella, and H. O. Enevoldsen, (Paris: International Oceanographic Commission), 511–522.
Hallegraeff, G. M., Munday, B. L., Banden, D. G., and Whitney, P. L. (1998). Chattonella marina raphidophyte bloom associated with mortality of cultured bluefin tuna (Thunnus maccoyii) in South Australia, in Harmful Microalgae, VIII Conference on Harmful Algae, Vigo (International Oceanographic Commission of UNESCO), 1–5.
Hamilton, M. A., Russo, R. C., and Thurston, R. V. (1977). Trimmed Spearman-Karber method for estimating median lethal concentrations in toxicity bioassays. Environ. Sci. Technol. 11, 714–719. doi: 10.1021/es60130a004
Handy, S. M., Coyne, K. J., Portune, K. J., Demir, E., Doblin, M. E., Hare, C. E., et al. (2005). Evaluating vertical migration behavior of harmful raphidophytes in the Delaware Inland Bays utilizing quantitative real-time PCR. Aquat. Microb. Ecol. 40, 121–132. doi: 10.3354/ame040121
Heisler, J., Glibert, P. M., Burkholder, J. M., Anderson, D. M., Cochlan, W., Dennison, W. C., et al. (2008). Eutrophication and harmful algal blooms: a scientific consensus. Harmful Algae 8, 3–13. doi: 10.1016/j.hal.2008.08.006
Higashi, A., Nagai, S., Salomon, P. S., and Ueki, S. (2017). A unique, highly variable mitochondrial gene with coding capacity of Heterosigma akashiwo, class Raphidophyceae. J. Appl. Phycol. 29, 2961–2969. doi: 10.1007/s10811-017-1142-2
Higgins, D. G., and Sharp, P. M. (1988). CLUSTAL: a package for performing multiple sequence alignment on a microcomputer. Gene 73, 237–244. doi: 10.1016/0378-1119(88)90330-7
Hiroishi, S., Okada, H., Imai, I., and Yoshida, T. (2005). High toxicity of the novel bloom-forming species Chattonella ovata (Raphidophyceae) to cultured fish. Harmful Algae 4, 783–787. doi: 10.1016/j.hal.2004.12.008
Hosoi-Tanabe, S., Otake, I., and Sako, Y. (2006). Phylogenetic analysis of noxious red tide flagellates Chattonella antiqua, C. marina, C. ovata, and C. verruculosa (Raphidophyceae) based on the rRNA gene family. Fish. Sci. 72, 1200–1208. doi: 10.1111/j.1444-2906.2006.01277.x
Imai, I. (1989). Cyst formation of the noxious red tide flagellate Chattonella marina (Raphidophyceae) in culture. Mar. Biol. 103, 235–239. doi: 10.1007/BF00543353
Imai, I., and Yamaguchi, M. (2012). Life cycle, physiology, ecology and red tide occurrences of the fish-killing raphidophyte Chattonella. Harmful Algae 14, 46–70. doi: 10.1016/j.hal.2011.10.014
Imai, I., Yamaguchi, M., and Hori, Y. (2006). Eutrophication and occurrences of harmful algal blooms in the Seto Inland Sea, Japan. Plankton Benthos Res. 1, 71–84. doi: 10.3800/pbr.1.71
Jeong, H. J., Seong, K. A., Kang, N. S., Yoo, Y. D., Nam, S. W., Park, J. Y., et al. (2010). Feeding by raphidophytes on the cyanobacterium Synechococcus sp. Aquat. Microb. Ecol. 58, 181–195. doi: 10.3354/ame01354
Joint, I. R., and Pomroy, A. J. (1981). Primary production in a turbid estuary. Estuar. Coastal Shelf S. 13, 303–316. doi: 10.1016/S0302-3524(81)80028-X
Jones, R. I. (1994). Mixotrophy in planktonic protists as a spectrum of nutritional strategies. Marine Microbial Food Webs 8, 87–96.
Jones, R. I. (2000). Mixotrophy in planktonic protists: an overview. Freshwater Biol. 45, 219–226. doi: 10.1046/j.1365-2427.2000.00672.x
Katano, T., Yoshida, M., Lee, J., Han, M. S., and Hayami, Y. (2009). Fixation of Chattonella antiqua and C. marina (Raphidophyceae) using Hepes-buffered paraformaldehyde and glutaraldehyde for flow cytometry and light microscopy. Phycologia 48, 473–479. doi: 10.2216/08-102.1
Khan, S., Arakawa, O., and Onoue, Y. (1995). Effects of physiological factors on morphology and motility of Chattonella antiqua (Raphidophyceae). Bot. Mar. 38, 347–354. doi: 10.1515/botm.1995.38.1-6.347
Kjerfve, B., Ribeiro, C. H. A., Dias, G. T. M., Filippo, A. M., and Quaresma, V. S. Q. (1997). Oceanographic characteristics of an impacted coastal bay: Baía de Guanabara, Rio de Janeiro, Brazil. Cont. Shelf Res. 17, 1609–1643. doi: 10.1016/S0278-4343(97)00028-9
Klöpper, S., John, U., Zingone, A., Mangoni, O., Kooistra, W. H. C. F., and Cambella, A. (2013). Phylogeny and morphology of a Chattonella (Raphidophyceae) species from the Mediterranean Sea: what is C. subsalsa? Eur. J. Phycol. 48, 79–92. doi: 10.1080/09670262.2013.771412
Kumar, S., Stecher, G., and Tamura, K. (2016). MEGA7: molecular evolutionary genetics analysis version 7.0 for bigger datasets. Mol. Biol. Evol. 33, 1870–1874. doi: 10.1093/molbev/msw054
Lewitus, A. J., Brock, L. M., Burke, M. K., DeMattio, K. A., and Wilde, S. B. (2008). Lagoonal stormwater detention ponds as promoters of harmful algal blooms and eutrophication along the South Carolina coast. Harmful Algae 8, 60–65. doi: 10.1016/j.hal.2008.08.012
Lewitus, A. J., Schmidt, L. B., Mason, L. J., Kempton, J. W., Wilde, S. B., Wolny, J. L., et al. (2003). Harmful algal blooms in South Carolina residential and golf course ponds. Popul. Environ. 24, 387–414. doi: 10.1023/A:1023642908116
Lincoln, R. A., Strupinski, K., and Walker, J. M. (2008). The use of Artemia nauplii (brine shrimp larvae) to detect toxic compounds from microalgal cultures. Pharm. Biol. 34, 384–389. doi: 10.1076/phbi.34.5.384.13255.
Lindholm, T., Öhman, P., Kurki-Helasmo, K., Kincaid, B., and Meriluoto, J. (1999). Toxic algae and fish mortality in a brackish-water lake in Åland, SW Finland. Hydrobiologia 397, 109–120.
Marshall, J. A., and Hallegraeff, G. M. (1999). Comparative ecophysiology of the harmful alga Chattonella marina (Raphidophyceae) from South Australian and Japanese waters. J. Plankton Res. 21, 1809–1822. doi: 10.1093/plankt/21.10.1809
Marshall, J. A., Nichols, P. D., Hamilton, B., Lewis, R. J., and Hallegraeff, G. M. (2003). Ichthyotoxicity of Chattonella marina (Raphidophyceae) to damselfish (Acanthochromis polycanthus): the synergistic role of reactive oxygen species and free fatty acids. Harmful Algae 2, 273–281. doi: 10.1016/S1568-9883(03)00046-5
Mayr, L. M., Tenenbaum, D. R., Villac, M. C., Paranhos, R., Nogueira, C. R., Bonecker, S. L., et al. (1989). Hydrobiological characterization of Guanabara Bay, in Coastlines of Brazil, eds O. Maggon and C. Neves (NewYork, NY: American Society of Civil Engineers), 124–138.
Nakamura, Y., Takashima, J., and Watanabe, M. (1989). Chemical environment for red tides due to Chattonella antiqua. J. Oceanogr. Soc. Japan 45, 116–128. doi: 10.1007/BF02302618
Nakamura, Y., Umemori, T., Watanabe, M., Kulis, D. M., and Anderson, D. M. (1990). Encystment of Chattonella antiqua in laboratory cultures. J. Oceanogr. Soc. Japan, 46, 35–43. doi: 10.1007/BF02124813
Nakamura, Y., and Watanabe, M. M. (1983). Growth characteristics of Chattonella antiqua. Part 1. Effects of temperature, salinity, light intensity and pH on growth. J. Oceanogr. Soc. Japan 39, 110–114. doi: 10.1007/BF02070796
Nygaard, K., and Tobiesen, A. (1993). Bacterivory in algae: a survival strategy during nutrient limitation. Limnol. Oceanogr. 38, 273–279. doi: 10.4319/lo.1993.38.2.0273
Odebrecht, C., Villac, M. C., Abreu, P. C., Haraguchi, L., Gomes, P. D. F., and Tenenbaum, D. R. (2018). Flagellates versus diatoms: phytoplankton trends in tropical and subtropical estuarine-coastal ecosystems in Plankton Ecology of the Southwestern Atlantic, eds M. Hoffmeyer, M. Sabatini, F. Brandini, D. Calliari, and N. Santinelli (Cham: Springer), 249–267. doi: 10.1007/978-3-319-77869-3_12
Oliveira, E. N., Fernandes, A. M., Kampel, M., Cordeiro, R. C., Brandini, N., Vizon, S. B., et al. (2016). Assessment of remotely sensed chlorophyll-a concentration in Guanabara Bay, Brazil. J. Appl. Remote Sens. 10, 026003–026001. doi: 10.1117/1.JRS.10.026003
Onitsuka, G., Aokim, K., and Shimizu, M. (2015). Meteorological conditions preceding Chattonella bloom events in the Yatsushiro Sea, Japan, and possible links with the East Asian monsoon. Fish. Sci. 81, 123–130. doi: 10.1007/s12562-014-0812-0
Paranhos, R., Andrade, L., Mendonça-Hagler, L. C., and Pfeiffer, W. C. (2001). Coupling bacterial density with activity in a tropical polluted coastal bay, in Aquatic Microbial Ecology in Brazil, Vol. 9, eds B. M. Faria, V. Farjalla, and F. A. Esteves (Rio de Janeiro: Serie Oecologia Brasiliensis), 119–132.
Paranhos, R., and Mayr, L. M. (1993). Seasonal patterns of temperature and salinity in Guanabara Bay, Brazil. Fresenius Environ. Bull. 2, 647–652.
Paranhos, R., Pereira, A. P., and Mayr, L. M. (1998). Diel variability of water quality in a tropical polluted bay. Environ. Monit. Assess. 50, 131–141. doi: 10.1023/A:1005855914215
Parsons, T. R., Maita, Y., and Lalli, C. (1984). A Manual of Chemical and Biological Methods for Seawater Analysis. New York, NY: Pergamon Press.
Pennock, J. R., and Sharp, J. H. (1986). Phytoplankton production in the Delaware Estuary: temporal and spatial variability. Mar. Ecol. Prog. Ser. 34, 143–155. doi: 10.1016/0272-7714(87)90156-9
Portune, K. J., Coyne, K. J., Hutchins, D. A., Handy, S. M., and Cary, S. C. (2009). Germination of Heterosigma akashiwo and Chattonella subsalsa (Raphidophyceae) cysts in Delaware's Inland Bays, DE. Aquat. Microb. Ecol. 55, 229–239. doi: 10.3354/ame01292
Rogers, S. O., and Bendich, A. J. (1994). Extraction of total cellular DNA from plants, algae and fungi, in Plant Molecular Biology Mannual, eds S. B. Gelvin and R. A Schilperoort (Netherlands: Springer), 183–190. doi: 10.1007/978-94-011-0511-8_12
Ryding, S.-O., and Rast, W. (1989). The Control of Eutrophication of Lakes and Reservoirs. Paris: UNESCO and The Parthenon Publishing Group.
Santos, V. S., Villac, M. C., Tenenbaum, D. R., and Paranhos, R. (2007). Auto- and heterotrophic nanoplankton and filamentous bacteria of Guanabara Bay (RJ, Brazil): estimates of cell/filament numbers versus carbon content. Braz. J. Oceanogr. 55, 133–143. doi: 10.1590/S1679-87592007000200006
Scholin, C. A., Herzog, M., Sogin, M., and Anderson, D. M. (1994). Identification of group- and strain-specific genetic markers for globally distributed Alexandrium (Dinophyceae) II. Sequence analysis of a fragment of the LSU rRNA gene. J. Phycol. 30: 999–101. doi: 10.1111/j.0022-3646.1994.00999.x
Sevrin-Reyssac, J., Machado, M. C., Schutze, M. L. M., Ribas, S. G., Costa de Lima, I., Lima, C. A., et al. (1979). Biomasse et production du phytoplancton de la baie de Guanabara (État de Rio de Janeiro, Brésil) et du secteur óceanique adjacent. Variations de mai à juillet 1978. B. Mus. Natl. Hist. Nat. 4, 329–354.
Strom, S. L., Harvey, E. L., Frederickson, K. A., and Menden-Deuer, S. (2013). Broad salinity tolerance as a refuge from predation in the harmful raphidophyte alga Heterosigma akashiwo (Raphidophyceae). J. Phycol. 49, 20–31. doi: 10.1111/jpy.12013
Throndsen, J. (1997). The planktonic marine flagellates, in Identifying Marine Phytoplankton, ed C. R. Thomas, (San Diego, CA: Academic Press), 591–729.
Tomas, C. R., Bridgers, A. M., and Smith, M. D. (2002). Chattonella subsalsa Biecheler. North Carolina Sea Grant. Marine Phytoplankton Identification Series. UNC-SG-02-04.
Valentin, J. L., Tenenbaum, D. R., Bonecker, A. C., Bonecker, S. L. C., Nogueira, C. R., and Villac, M. C. (1999). O Sistema Planctônico da Baía de Guanabara: Síntese do Conhecimento. Ecologia de Ambientes Costeiros do Estado do Rio de Janeiro. Series Oecologia Brasiliensis. Rio de Janeiro, 7, 35–59.
Villac, M. C., and Tenenbaum, D. R. (2010). The phytoplankton of Guanabara Bay, Brazil: I. historical account of its biodiversity. Biota Neotrop. 10, 271–293. doi: 10.1590/S1676-06032010000200030
Wang, G. (2017). Continued increase of extreme El Niño frequency long after 1.5°C warming stabilization. Nat. Clim. Change 7, 568–572. doi: 10.1038/nclimate3351
Wolter, K., and Timlin, M. S. (1993). Monitoring ENSO in COADS with a seasonally adjusted principal component index, in Proceedings of the 17th Climate Diagnostics Workshop, Norman, OK, NOAA/NMC/CAC, NSSL, Oklahoma Climate Survey, CIMMS and the School of Meteorology, University of Oklahoma: Norman, OK, 52–57.
Keywords: Chattonella subsalsa, Guanabara Bay, eutrophication, harmful algae, climate, MEI
Citation: Viana TV, Fistarol GO, Amario M, Menezes RB, Carneiro BLR, Chaves DM, Hargreaves PI, Silva-Lima AW, Valentin JL, Tenenbaum DR, Arruda EF, Paranhos R and Salomon PS (2019) Massive Blooms of Chattonella subsalsa Biecheler (Raphidophyceae) in a Hypereutrophic, Tropical Estuary—Guanabara Bay, Brazil. Front. Mar. Sci. 6:85. doi: 10.3389/fmars.2019.00085
Received: 03 September 2018; Accepted: 13 February 2019;
Published: 13 March 2019.
Edited by:
Juan Jose Dorantes-Aranda, University of Tasmania, AustraliaReviewed by:
Tomoyuki Shikata, National Research Institute of Fisheries and Environment of Inland Sea (FEIS), JapanKathryn Coyne, University of Delaware, United States
Copyright © 2019 Viana, Fistarol, Amario, Menezes, Carneiro, Chaves, Hargreaves, Silva-Lima, Valentin, Tenenbaum, Arruda, Paranhos and Salomon. This is an open-access article distributed under the terms of the Creative Commons Attribution License (CC BY). The use, distribution or reproduction in other forums is permitted, provided the original author(s) and the copyright owner(s) are credited and that the original publication in this journal is cited, in accordance with accepted academic practice. No use, distribution or reproduction is permitted which does not comply with these terms.
*Correspondence: Paulo S. Salomon, cHNzYWxvbW9uQGdtYWlsLmNvbQ==
†These authors have equally contribution to this work