 Gavin Fay
 Geret DePiper
 Scott Steinback
 Robert J. Gamble
 Jason S. Link
- National Marine Fisheries Service, Woods Hole, MA, United States
Modeling tools that can demonstrate possible consequences of strategies designed to operationalize ecosystem-based fisheries management (EBFM) should be able to address tradeoffs over a wide suite of considerations representing the scope of marine management objectives. Coupled ecological-economic modeling, where models for ecological and economic subsystems are linked through their inputs and outputs, allows for quantification of such tradeoffs. Here, we link the harvest output from fishery management scenarios implemented in an end-to-end ecosystem model (Atlantis) to an input–output regional economic model for the Northeast United States to calculate changes in socio-economic indicators, including the consequences of management action for regional sales, wages, and employment. We implement three simple scenarios (maintain, decrease, or increase current fishing effort), and compare model-projected values for systematic and sector-specific indicators. Systematic indicators revealed different ecological and economic outcomes, with large ecological responses and clear tradeoffs among the catch and biomass of species groups. Economic indicators for the region responded similarly to fishery yield; however, changes in total sales did not match those in landed catch. Under increased fishing effort, a lower proportional increase in sales relative to total landed catch arose due to increased yield from lower value species groups. Average fisheries income changed little among scenarios, but was highest when effort was maintained at current levels, likely a reflection of fleet and catch stability. Our results serve to demonstrate that consequences of management may be felt disproportionately among species through the region and across different fisheries sectors. With our coupled modeling approach of passing Atlantis ecosystem model outputs to an input–output economic model, we were able to assess effects of fisheries management across a broader suite of indicators that have relevance for policymakers across multiple objectives.
Introduction
The need for ecosystem-based fisheries management (EBFM) is well established, with a focus on managing the indirect effects of fishing across a broad set of ecological and societal factors under both tactical and strategic decision-making. While much progress has been made toward implementing EBFM, much work remains (Pitcher et al., 2009; Hilborn, 2011; Marshall et al., 2018). Evaluating options for implementing EBFM requires a better understanding of the links between marine ecosystems, the goods and services humans derive from them, and the effects of both environmental and human pressures on these ecosystems and services (e.g., Marasco et al., 2007; Link, 2010; Kruse et al., 2012). Further, the performance of management options must be tested with respect to operational objectives that encompass both ecological and socioeconomic goals accounting for these links and pressures. It is necessary therefore to explore a range of outputs across many management scenarios when assessing indicators of management performance.
A range of ecosystem models have been developed to address the needs of EBFM (e.g., Plagányi, 2007). Many of these models have had an ecological focus, or have only evaluated economic effects for single industry sectors (commonly a single commercial fishery). Integrated economic-ecological frameworks (e.g., Arrow et al., 1995) that extend the bioeconomic approach and include models for both human economies and ecosystem dynamics offer the potential to provide critically required decision support when assessing the value of marine ecosystems (Jin et al., 2012). Some of these modeling tools have begun to be used in a management strategy evaluation (MSE; Bunnefeld et al., 2011) framework to address tradeoffs among management objectives in an ecosystem context (e.g., McDonald et al., 2008; Plagányi et al., 2013; Fulton et al., 2014). MSE has also been applied to quantify the economic risk of alternative fisheries management strategies (e.g., Little et al., 2013). Developing methods to quantify the effect of fisheries management strategies on a suite of ecosystem services is a recognized component of integrated ecosystem assessments (IEAs; Levin et al., 2009). IEAs are a recognized means for integrating and using information to implement EBFM, and modeling is a key part of them.
Atlantis (Fulton et al., 2011) is an end-to-end ecosystem model that was designed to quantify tradeoffs between economic, ecological, and societal management goals. Atlantis is well suited to evaluate ecosystem-based management strategies because it couples biophysical models of the ecological system to models for human activities (such as fishing) and incorporates models for the steps, procedures, and tools of the management decision process. Fulton et al. (2014) used Atlantis to compare the performance of fisheries management strategies against a broad range of societal indicators for a multispecies fishery in Southeast Australia. Kaplan and Leonard (2012) coupled an Atlantis model for the California Current ecosystem to a regional economic model for the United States west coast to illustrate the direct and indirect effects of alternative groundfish management strategies. This analysis extended many typical fisheries bioeconomic modeling approaches by considering industry sectors that support or are influenced by changes in fishery production, such as industry suppliers, employment, or even household spending. While an Atlantis model for the Northeast United States exists (Link et al., 2010) and has been used to assess ecological responses to management strategies (Fay et al., 2017; Olsen et al., 2018), this model has not yet been used to assess economic indicators for the region.
The Northeast United States large marine ecosystem (LME) has supported economically important fisheries for hundreds of years (Link et al., 2011a). For example, 2012 gross nominal revenue in the Northeast United States Multispecies Groundfish Fishery was $305.5 million (Murphy et al., 2014). Bioeconomic analyses for the region have rarely focused on system-level objectives. Most models estimating the economic effects of fisheries management strategies in the Northeast United States have focused on a particular fishery and the direct impact of policy on fishermen. Examples include models for scallops (Harksever et al., 2000; Valderrama and Anderson, 2007; Hart, 2009), lobsters (Acheson and Reidman, 1982; Holland, 2011), and silver hake (Thunberg et al., 1998). Although some papers look at multiple species simultaneously, they tend to consider a subset of species of commercial and conservation interest and most have not taken an overall perspective of the effects of changes in fishery production on the larger economy in the Northeast United States (e.g., Kirkley et al., 2011; Lehuta et al., 2014; Scheld and Anderson, 2014). Hoagland et al. (2005) (see also Steinback and Thunberg, 2006) constructed a model for the coastal economy of the Northeast United States and estimated that the activity of United States marine sectors in the Northeast Shelf LME accounted for 10% of the total gross state product for the region. However, the contribution of fisheries to these grosses was low (2%). Consideration of marine sectors as a portfolio of economic activities, as well as risk related to variance of expected returns from a set of individual fish stocks via portfolio analysis, also offers opportunity for integrating economic considerations into marine management and evaluation of risk (e.g., Edwards et al., 2004; Jin et al., 2016; Link, 2018).
Dynamically interacting models of economic and ecological processes might best account for feedbacks and interactions between changes in fishery production, ecosystem state, and economic variables. Constructing such models is, however, time and data-intensive, requiring parameterization of behavioral models that include relationships between economic variables and human decision processes and necessitate a substantially reduced number of economic sectors for modeling purposes (e.g., van Putten et al., 2012). In a simpler approach, input–output models allow for coupling of ecological and economic models by quantifying both the direct and indirect economic impacts of changes in harvest rates derived from the ecological model. Input–output models for fisheries have been used at the single species (e.g., Northeast United States Atlantic herring; Kirkley et al., 2011), species groups (United States West Coast groundfish; PFMC, 2015), and ecosystem levels (United States West Coast; Kaplan and Leonard, 2012; PFMC, 2015). When applied at the ecosystem level, this approach can be used to evaluate system-wide tradeoffs across ecological, economic, and social management objectives.
Here we link the harvest from a marine ecosystem model for the Northeast United States continental shelf to an input–output regional economic model for the Northeast United States. We calculate changes in socio-economic indicators (such as jobs and earnings) and compare these changes to values of ecological indicators from the ecosystem model. We use the coupled models to explore the ecological and economic consequences of three simple fishing effort scenarios initialized to the historical range of these data with variable fishing scenarios projected over a 10 year period. A baseline scenario reflects historical conditions where fishing effort during this period was substantially lower than in previos years. This is compared with two alternative scenarios where a change in effort was implemented. In particular, we wanted to quantify the effects of changes in fishing fleet sector landings associated with these effort changes on the regional economy.
Materials and Methods
This section briefly summarizes both the ecosystem and economic models, describes model coupling, and outlines the fishing scenarios tested. Rather than provide full details of model descriptions (which are referenced elsewhere), we focus on relevant details for the model coupling.
Marine Ecosystem Model: Atlantis-NEUS
Atlantis is an end-to-end marine ecosystem model that has been applied to multiple marine systems globally (Fulton et al., 2011; Weijerman et al., 2016). Atlantis consists of biophysical, fishing dynamics, management, and assessment sub-models, and is intended to be a strategic tool for comparing the performance of management strategies under alternative scenarios (i.e., MSE; Bunnefeld et al., 2011; Fulton et al., 2014). Atlantis-NEUS, the application of Atlantis to the Northeast United States marine ecosystem (Link et al., 2010, 2011b, covers the continental shelf from the Gulf of Maine to Cape Hatteras (Figure 1), and is resolved into 22 spatial regions, each of which is further resolved by depth. Physical parameters and flows in the system are modeled in Atlantis-NEUS using output from a regional ocean model. The biogeochemical-based ecological model of Atlantis-NEUS consists of 45 functional groups, 24 of which are vertebrates. The exploitation sub-model of Atlantis-NEUS consists of 18 fishing fleets that are combinations of fishing gears and target species. The model was tuned to data from the Northeast United States from 1963–2004, primarily using information from the biannual Northeast Fisheries Science Center (NEFSC) bottom trawl survey (Azarovitz, 1981; NEFC, 1998), and the NEFSC commercial fisheries database (NEFSC unpublished data). Full technical details of the Atlantis-NEUS model can be found in Link et al. (2011b), and a more comprehensive summary of model details, calibration procedure, and key scenarios can be found in Link et al. (2010). Model runs to 2014 using the predictive scenario capability of Atlantis have been compared to data from 2005–2014 documenting model skill for those species groups that formed the focus of model calibration (Olsen et al., 2016).
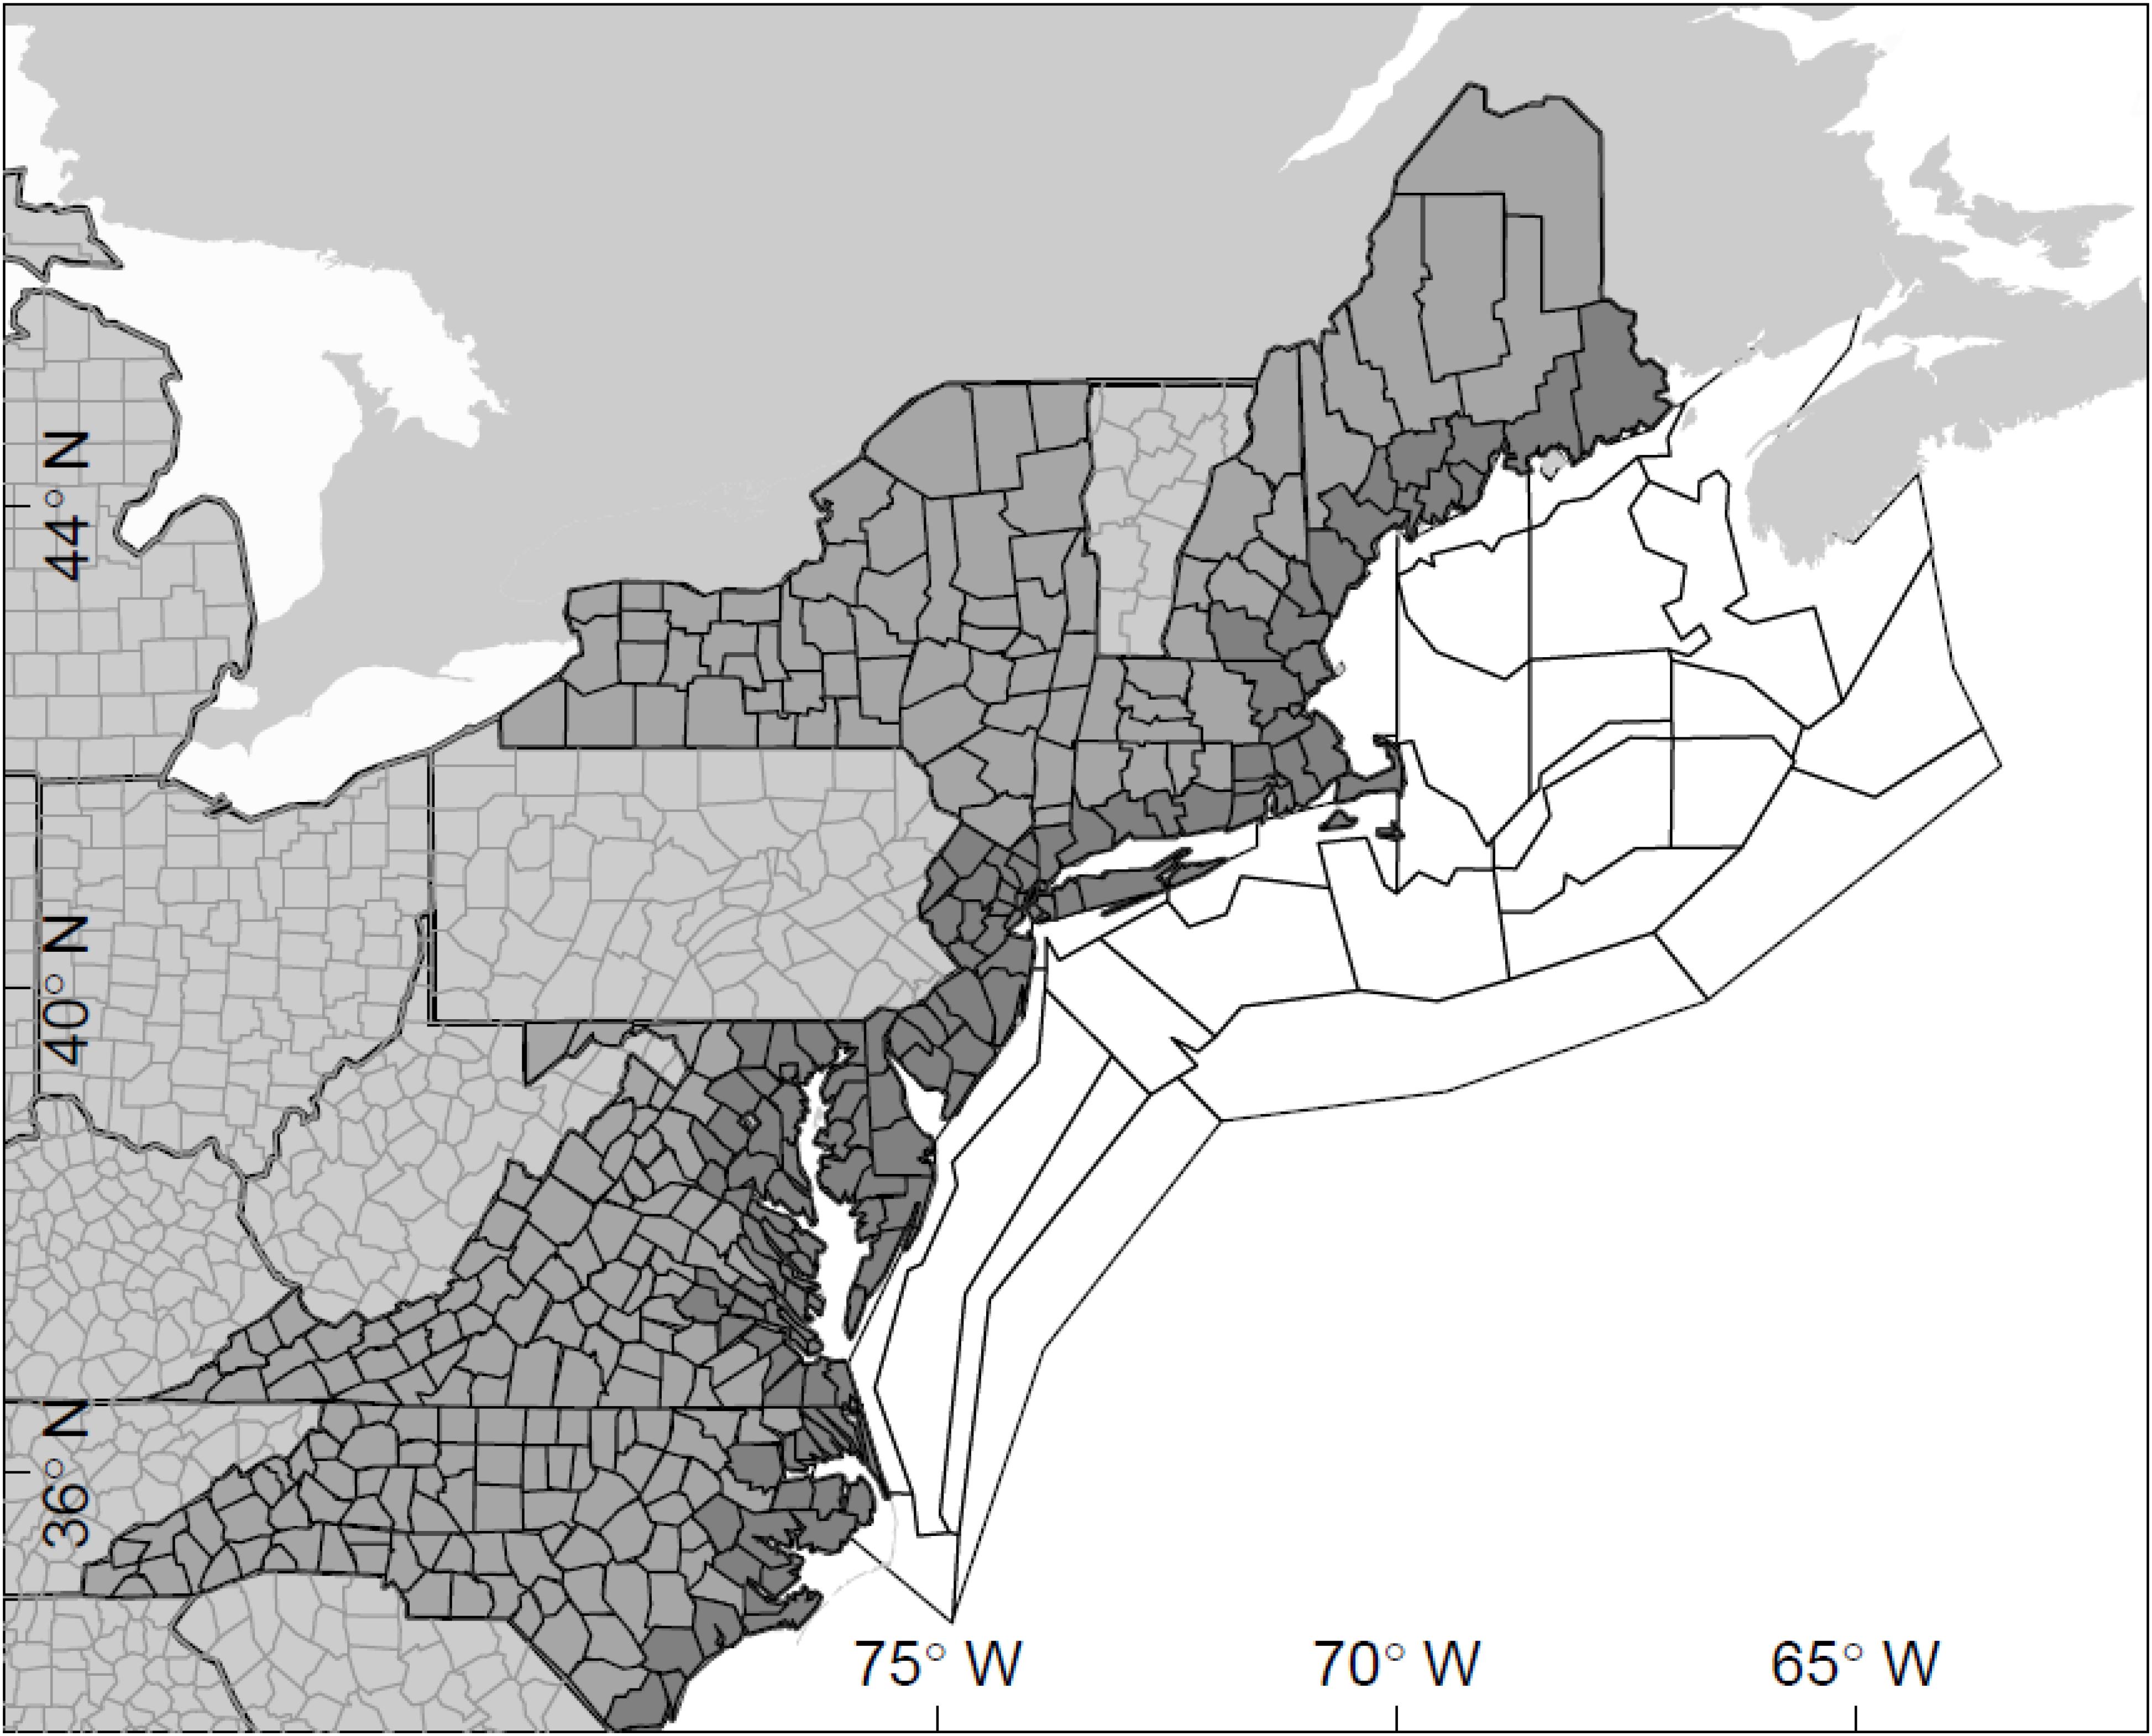
Figure 1. Map showing spatial structure of Atlantis-NEUS (white polygons) and the NERIOM models (coastal counties shaded in dark gray, coastal states light gray).
Economic Model: Northeast Region Input–Output Model (NERIOM)
The input–output economic model Northeast Region input–output model (NERIOM; Steinback and Thunberg, 2006) was used to quantify the regional economic effects of changes in commercial fishing landings. The NERIOM model was developed from the IMPLAN Pro system (IMPLAN Group LLC), which is based on the general Leontief approach to input/output modeling (Leontief, 1951). The NERIOM model translates seafood sector revenue to supporting industries’ sales, income, and employment. NERIOM can assess the impacts of management alternatives on the entire Northeast Region’s economy and on the economies of 24 specific sub-regions (Figure 1) that represent semi self-sufficient fishing areas with similar economic networks and attributes.
Commercial fishing activities are grouped into 18 distinct gear sectors (Table 1). Changes in output (e.g., sales) for the fisheries harvesting sectors associated with the fisheries management scenarios are obtained from changes in landings for each sector from the Atlantis model, using a landings-weighted average price per species group. The estimated direct changes in gross revenues for harvesters are then tracked backward to bait and ice suppliers, gear and vessel repair shops, gas stations, and the host of other service and goods providers servicing fishermen through the NERIOM multipliers. Additionally, forward-linked effects on fish exchanges/auctions, wholesale seafood dealers, and seafood processors are estimated, including the multiplier effects of their suppliers. We acknowledge the assumptions of this approach regarding fixed inputs. However, recent years of data used to inform the parameterization of NERIOM (matching the scenario period), and the scenarios we examine are from the same time period, rather than some long-term future projection during which assumptions about prices and inputs would be more tenuous, may make this less of a concern.
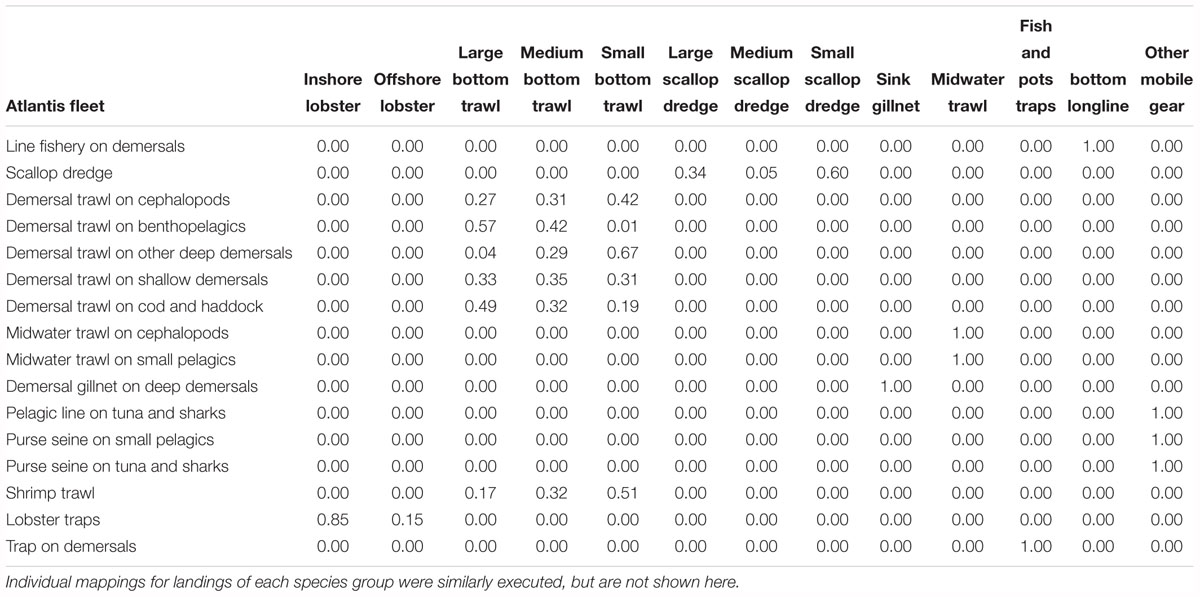
Table 1. Proportion of total landings (across all species groups) from Atlantis fleets allocated to NERIOM fleets for the baseline scenario.
Coupling Atlantis-NEUS Outputs to NERIOM
Linking the ecosystem and economic models required mapping fisheries landings by Atlantis fleets and spatial regions to NERIOM fleets and regions. Bottom trawl and scallop dredge fleets in NERIOM are defined by vessel size, with the small boat fleet encapsulating vessels < 50 ft, the medium boat fleet falling between 50 and 70 ft, and large boat fleet ≥ 70 ft. Further, the lobster pot fleet in NERIOM is delineated by inshore and offshore components. These delineations are made to reflect the substantially different economic production functions associated with each type of vessel. In Atlantis, fleets are based on gear type and target species groups. We mapped landings between Atlantis and NERIOM at the species level by calculating an average proportion of catch for each species in the NEFSC commercial fisheries databases that was taken by each NERIOM vessel/gear category during the years 2007–2011. Table 1 summarizes the proportional amount of landed catch for each Atlantis fleet that was transferred to each of the NERIOM fleets using this approach. The mapping differs substantially depending on the species and gear being considered. For example, total haddock landings by bottom trawl are historically distributed such that 85, 13, and 2% are associated with the large, medium, and small bottom trawl vessels, respectively, whereas the distribution of Atlantic cod landings by bottom trawl are 48, 32, and 20%, respectively, for the large, medium, and small vessel segments of the fleet. Our mapping explicitly accounts for such differences.
Fishing effort within Atlantis-NEUS is not directly associated with ports because a distance-to-port-based fleet dynamics model is not implemented in the effort scenarios used. The distribution of fishing effort for each fleet is allocated spatially in the Atlantis-NEUS model according to prescribed distributions (that can change over time) to be characteristic of the historical data. NERIOM requires input by state (and specific ports), which can be calculated by allocating proportions of the landings to the primary ports designated within Atlantis-NEUS. We allocated landings to ports within Atlantis by assuming that the landings of each fleet by spatial box could be assigned to ports based on the distance of the centroid of the box to the ports. The proportion pij of an Atlantis box’s landings assigned to a particular port was then:
where Di,j is distance (from the centroid) of box j to port i and N is the number of ports active for each fleet in the Atlantis model. We tested the sensitivity of the assumption for this relationship by also calculating landings by port assuming inverse distance (rather than inverse squared distance). While the values for the landings by port changed slightly, these did not impact results qualitatively.
The ports defined within Atlantis and the regions modeled in NERIOM differ, meaning that landings were again mapped between the two models. Supplementary Table S1 presents the mapping of Atlantis ports and NERIOM fleets to NERIOM regions. Port to region mapping was conducted through a hierarchical assignment algorithm. The first step assigned ports to the region of the Northeast coast in which they fell based off the original county definitions used to classify regions in the NERIOM model. For example, the Atlantis port of Chatham, MA, United States, naturally maps to the Cape and Islands region of NERIOM, while Gloucester, MA, United States, maps directly to the Gloucester, North Shore region. The second step in the algorithm then attributed landings to regions within the NERIOM model that had no corresponding port of landing in Atlantis. For example, landings to the port of Atlantic City were allocated to New York. Although this allocation may in some instances be questionable, the inverse distance squared function that allocated landings from Atlantis boxes to ports is also an approximation. At the Northeast Region level, sub-regional differences between observed and modeled landings are not large enough to have measurable effect on the NERIOM estimates of economic impacts. To better reflect recent patterns of landings, the final step of the port to region mapping re-allocated landings from regions with no recent history of specific fleet activity to nearby regions that have had landings from that fleet.
Scenarios and Evaluation
We use the coupled models to explore the ecological and economic consequences of three simple fishing effort scenarios initialized to cover the historical range of these data (1964–2004). We then started variable fishing scenarios projected for the period 1995–2014, and focused our reporting on results for the final 5 years of that time period.
Three fisheries management scenarios were considered in Atlantis to evaluate the effects of changes in landings on the regional economy: (1) a base scenario of fishing effort for 1995–2014 fixed at levels consistent with observed data for the Northeast United States from 1995–2004, (2) a reduced effort scenario where the fishing effort for 1995–2014 was halved for all Atlantis fleets compared to the base scenario values, and (3) an increased effort scenario where fishing effort for 1995–2014 was twice that in the base scenario (again, for all fleets). We selected the fixed effort scenario (described in Link et al., 2011b) as the base scenario since this more closely represents the observed dynamics of some major invertebrate fisheries that are economically important in the region than alternatives available for the Atlantis-NEUS model. We chose the multiplicative, cross-fleet effort scenarios as alternatives to the base to quantify economic effects that bracket common and reasonable large-scale changes in fisheries operations which have been observed. While more complicated fisheries management scenarios could be envisaged, these simple scenarios provide an easy way to demonstrate economic impacts at the regional level. Scenarios where the magnitude of the effect size on fishing effort was even greater (e.g., fishing effort five or one-fifth times that of the base scenario) were run during exploratory analyses but are not reported here for ease of presentation.
The landings for the final 5 years of the Atlantis simulations were averaged and used as inputs to NERIOM. As NERIOM is a static model, this provided one way to moderate some of the inter-annual variability in landings within the analysis. For each of the three Atlantis scenarios, biomass and landings by species group were recorded, in addition to a set of ecological indicators that capture fundamental features of marine ecosystems related to fishery exploitation (e.g., Shin et al., 2010). Output from NERIOM is summarized in terms of effects on sales, income, and employment, both at the regional level and by individual sector. In our analyses, we focus on the changes in quantities of interest under the reduced and increased fishing effort scenarios relative to those obtained from the base scenario rather than the absolute values for metrics.
Results
Scenario Results: Ecological Indicators
A large biological response was seen under the reduced effort scenario, with increases in biomass for many species groups associated with up to 50% reductions in the catch of many fish and invertebrate groups (Figure 2). These responses were variable, with large increases in biomass (>50% over base) for scallops, white hake, bluefish, benthopelagics, monkfish, cod, and silver hake, and modest increases (<20%) for many other targeted fish. Decreases in catch under the reduced effort scenario were not necessarily associated with increases in biomass, with very small changes in biomass (in some cases decreases) for lower trophic level groups, mainly as a result of increased predation pressure from the increased biomass of other piscivores (Figure 2). The increased fishing effort scenario resulted in increases in the catch of many species groups (Figure 2), with >100% increases in the catch of herring, mesopelagics, anadromous small pelagics (e.g., alewives and shad), and cephalopods. Catch declined under this scenario for a few species (notably cod and silver hake). These tradeoffs among species’ yield resulted in an increase in total catch from the system over the baseline, but only of 47% (i.e., doubling effort did not double overall yield, Figure 3). In general, species groups that showed large increases in biomass under the reduced effort scenario compared to the base showed large decreases in biomass under the increased effort scenario (Figure 2A; e.g., Atlantic cod, silver hake, scallops, bluefish, small pelagics).
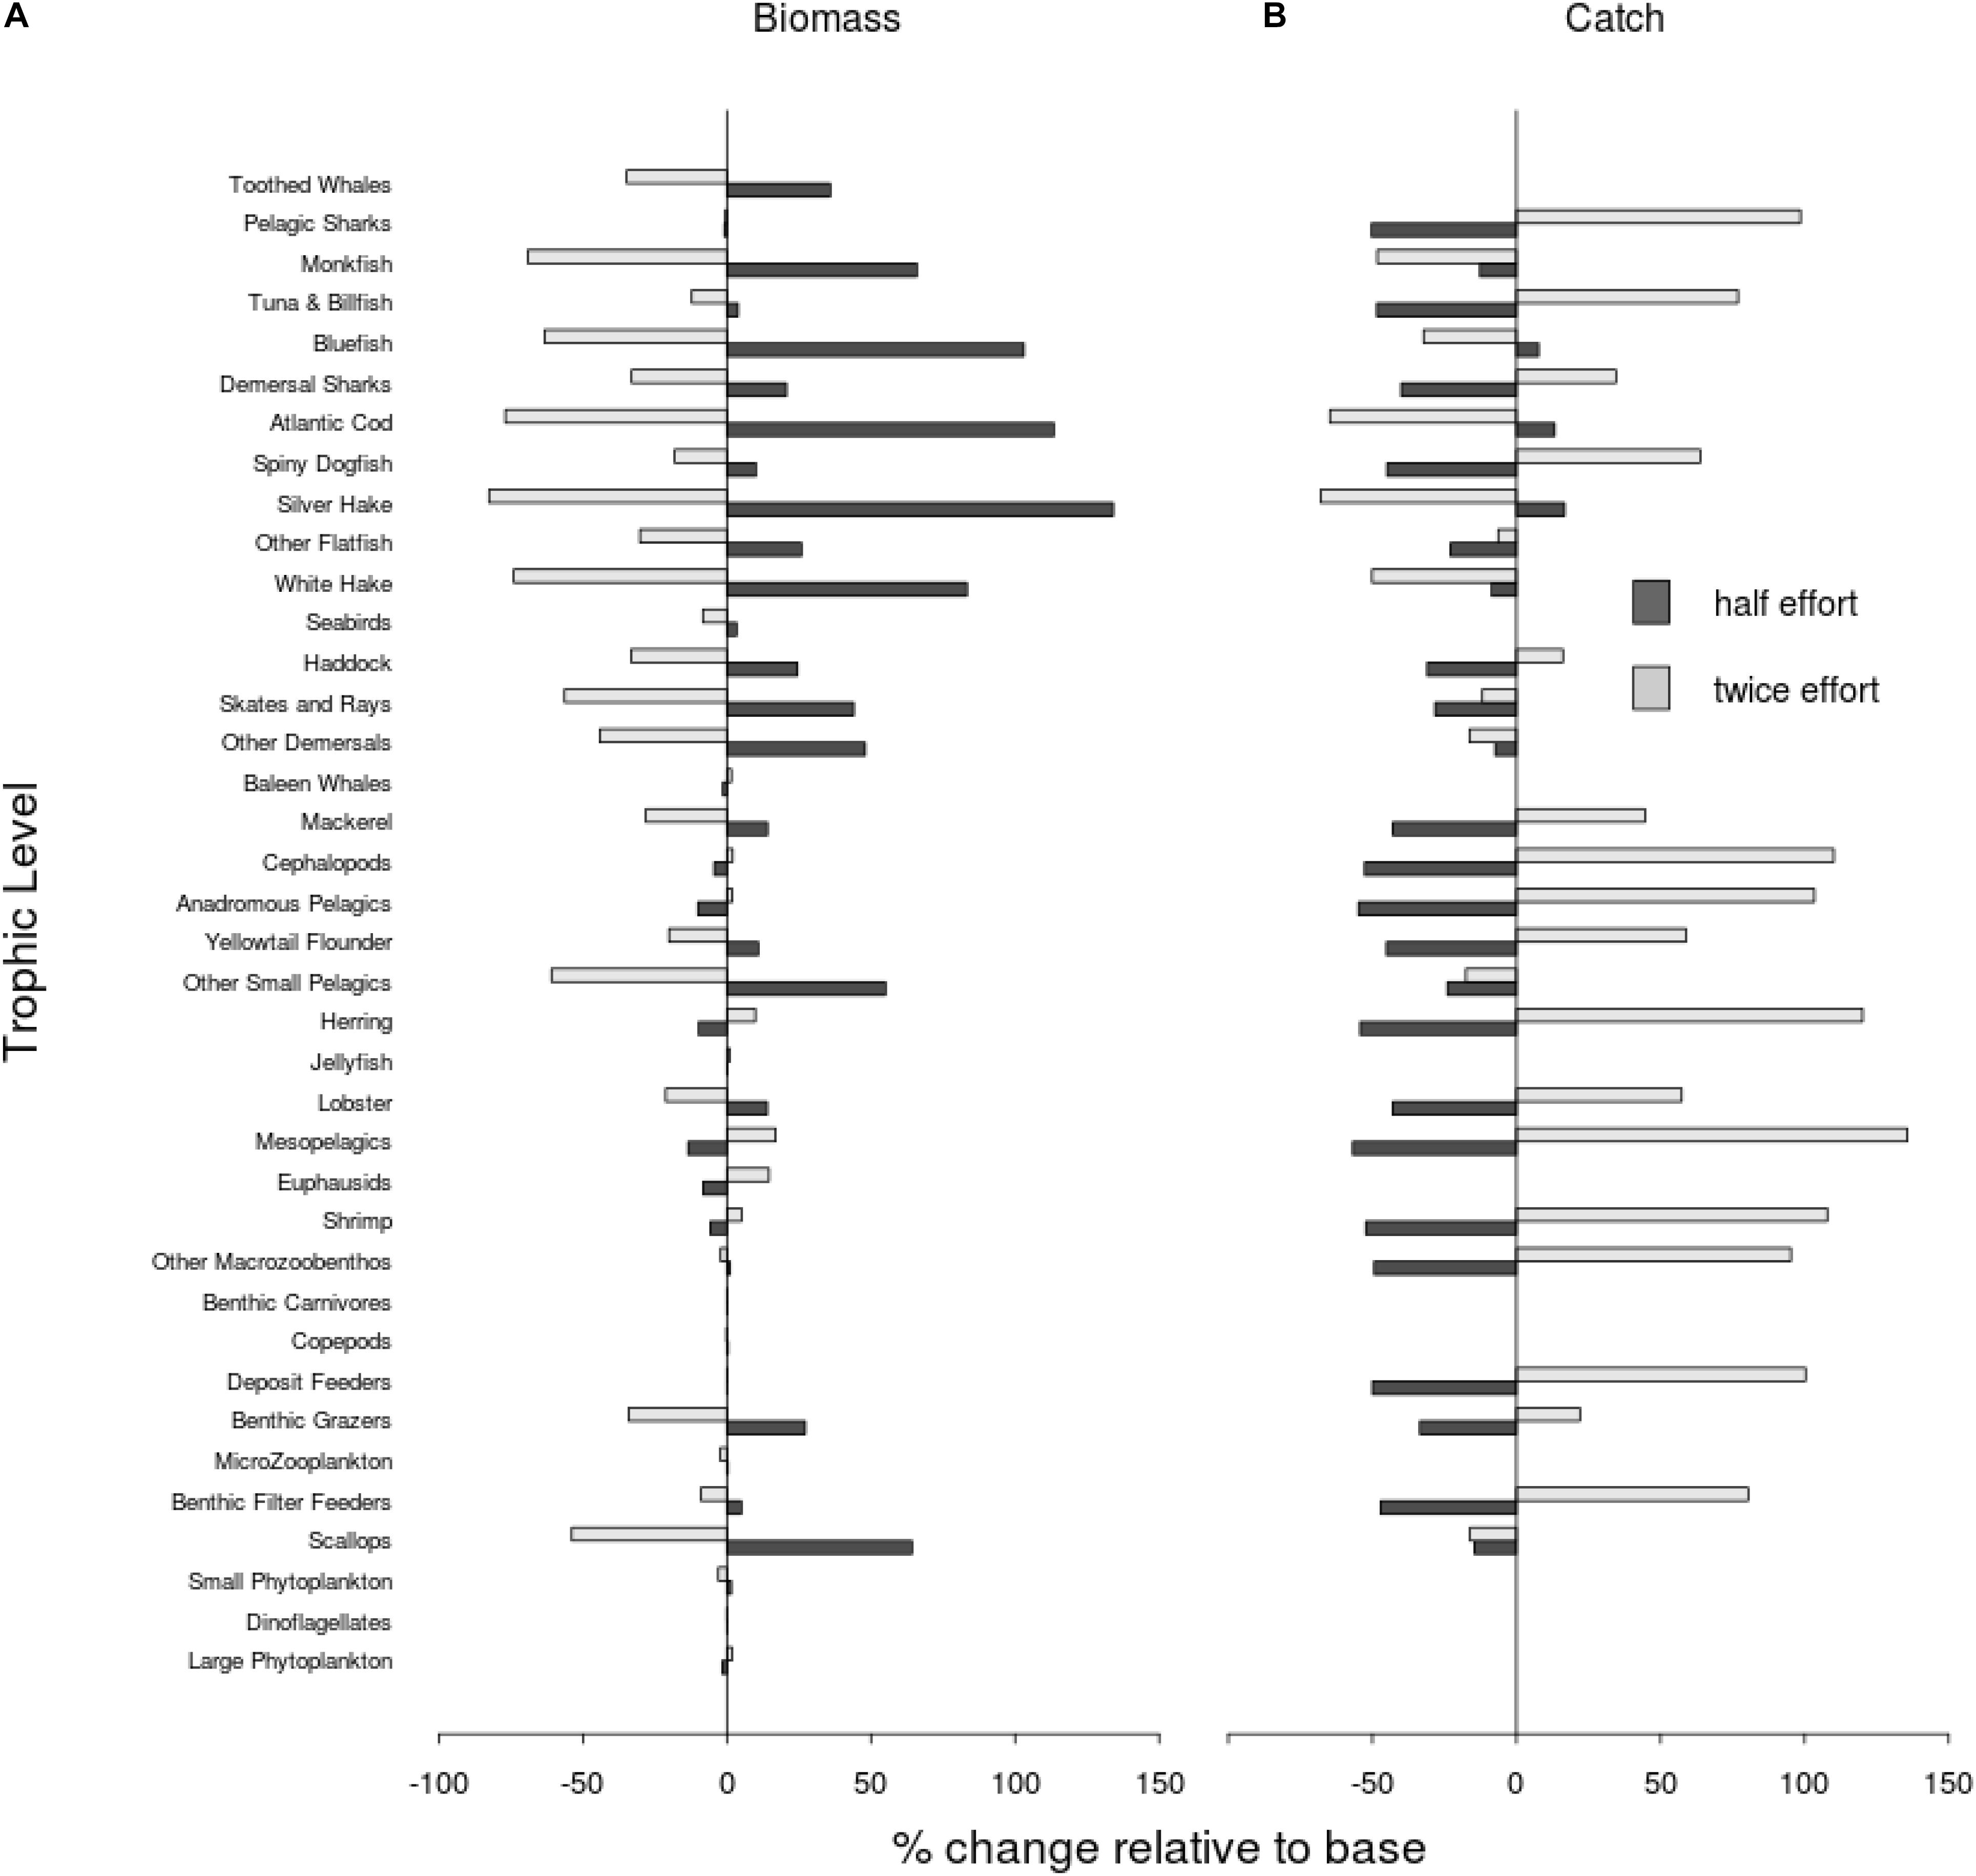
Figure 2. Changes to the (A) biomass and (B) catch of individual Atlantis species groups for the reduced and increased fishing effort scenarios compared to the baseline. Species groups are arranged vertically by trophic level with lower trophic level groups at the bottom.
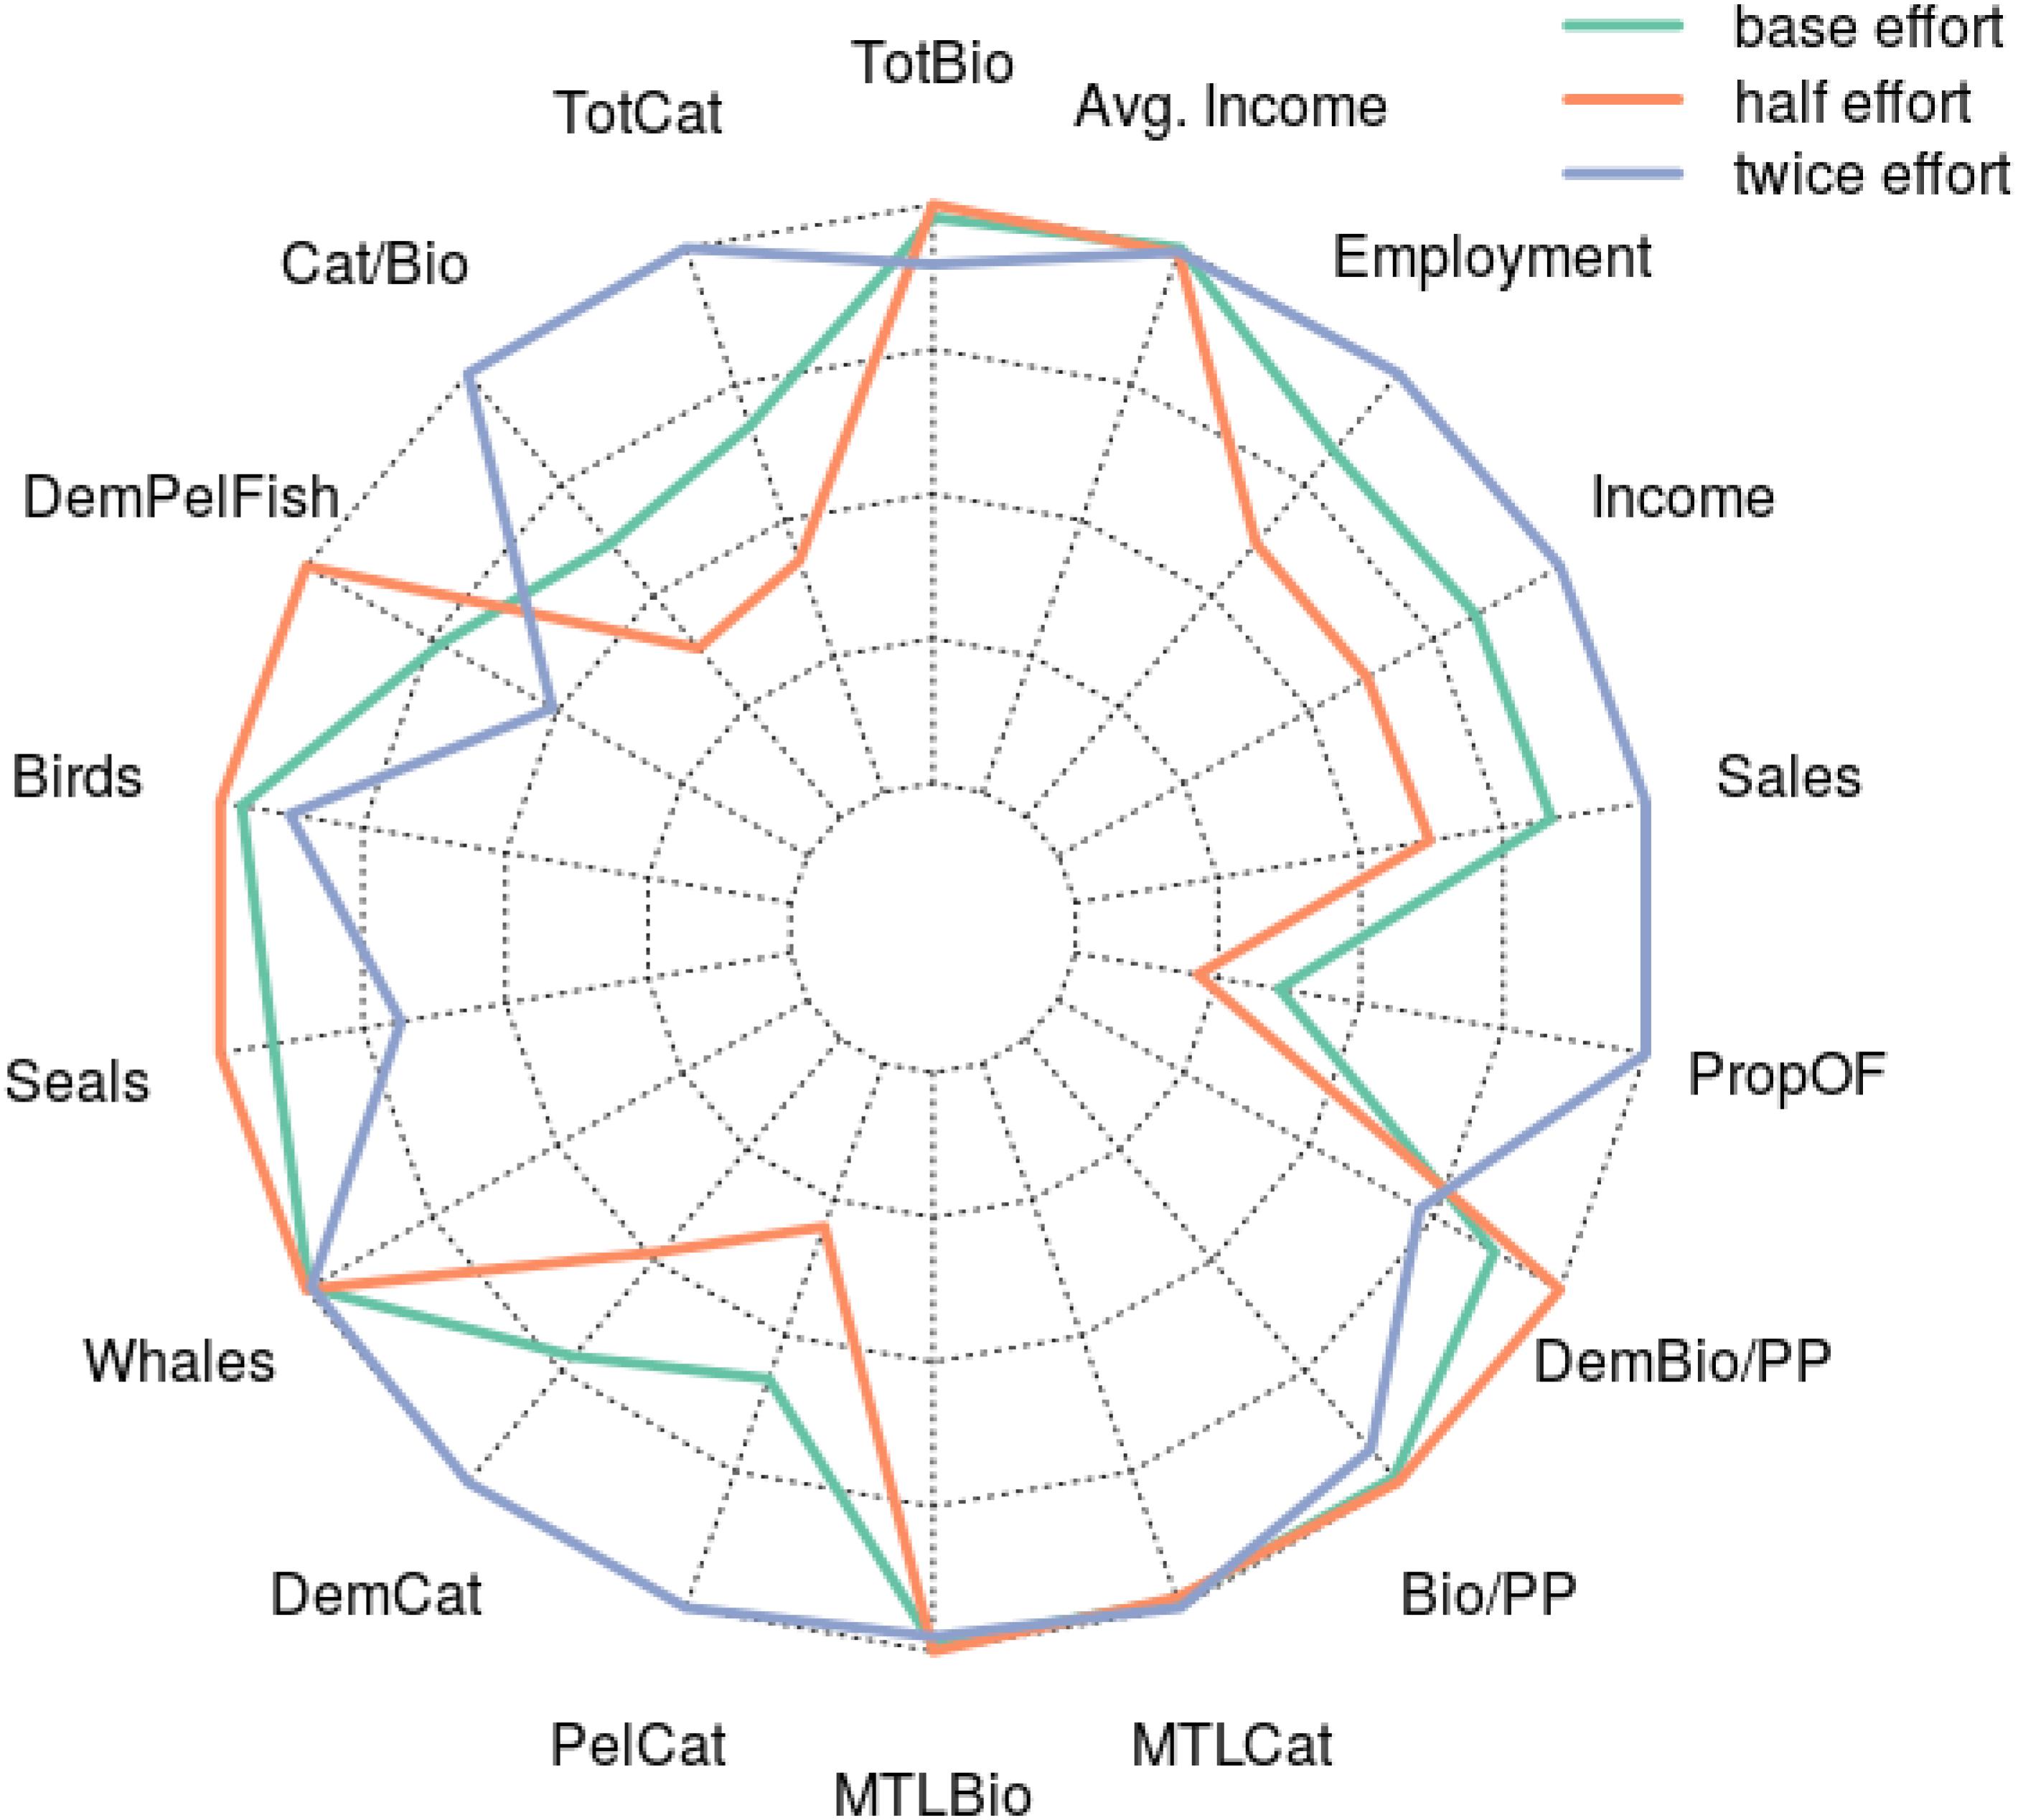
Figure 3. Levels of response for ecological and economic indicators to the three fishing effort scenarios. Ecological indicators are the average value from the terminal 5 years of the run, the period used to calculate the economic indicators. TotBio = total biomass, Prop OF = proportion overfished, DemBio/PP = demersal fish biomass relative to primary production, Bio/PP = total biomass relative to primary production, MTLCat = mean trophic level of catch, MTLBio = mean trophic level of biomass, PelCat = pelagic catch, DemCat = demersal catch, DemPelFish = demersal to pelagic fish ratio, CatBio = catch to biomass ratio, and TotCat = total catch.
The effects of the changed effort scenarios are also seen at the system level. Total catch reduced to 64% of that in the baseline scenario under the reduced effort scenario (Figure 3). While the effect on total ecosystem biomass was much smaller than this, the fish community was impacted with a decrease in the ratio of demersal to pelagic fish under the doubled effort scenario and a concurrent increase in this indicator for the reduced effort scenario (Figure 3). Threatened and protected species were affected by the changes to fishing, with the biomass of seals and birds being reduced in the increased fishing effort scenario (Figure 3). A larger number of species groups were observed to fall below commonly used management reference points in the increased fishing effort scenario. The proportion of species groups deemed to be overfished (i.e., biomass was less than half the estimated BMSY) increased by a factor of three under the doubled effort scenario compared to the baseline, with 40% of species groups considered overfished in the increased fishing effort scenario (Figure 3, “PropOF”). The system-wide exploitation rate (total catch/total biomass) increased from 6 to 10% under the increased effort scenario, with the yield from the system exceeding 16% of total primary production (Figure 3). As described at the species level, changes in catch were more prominent for pelagic groups than demersals, with total catch from pelagics having a higher magnitude of change than that of demersals under both increased and decreased effort scenarios.
Scenario Results: Economic Indicators
Forcing the changes in landings from the Atlantis model to the NERIOM model had large and variable effects on sales for the fishing sectors (Figure 4). Under the reduced effort scenario, sales for many sectors decreased up to 50% (Figure 4A), though the scallop dredge and bottom trawl sectors had decreases smaller than this. In contrast, large increases (e.g., >50%) in sales for only some sectors (lobster traps, small dredge, and surf clam/ocean quahog dredge) were observed under the increased effort scenario over baseline. This translated to a disproportionate effect on the sales from seafood processing, seafood dealers, and fish exchanges/auctions, with 30–50% reductions in value under the reduced effort scenario but less than 20% increases under the increased effort scenario. Consequently, overall economic indicators for the region responded similarly, with total sales being reduced by 26% under the reduced effort scenario and increasing 19% over base under the increased effort scenario. Similar effects were seen with respect to total income and total employment for the entire Northeast Region, resulting in very small changes to overall average fisheries income (total income/total employment, Figure 3). Although the magnitude of the differences was small, average incomes under both the increased and decreased effort scenarios were lower than that in the baseline. The average income for the fishing sectors was 60% that of all sectors included in the analysis. Average incomes for the fishing sectors were also less than the baseline in the changed effort scenarios ($491 less per year than baseline for the increased effort, and $833 less per year than baseline for the decreased effort scenario).
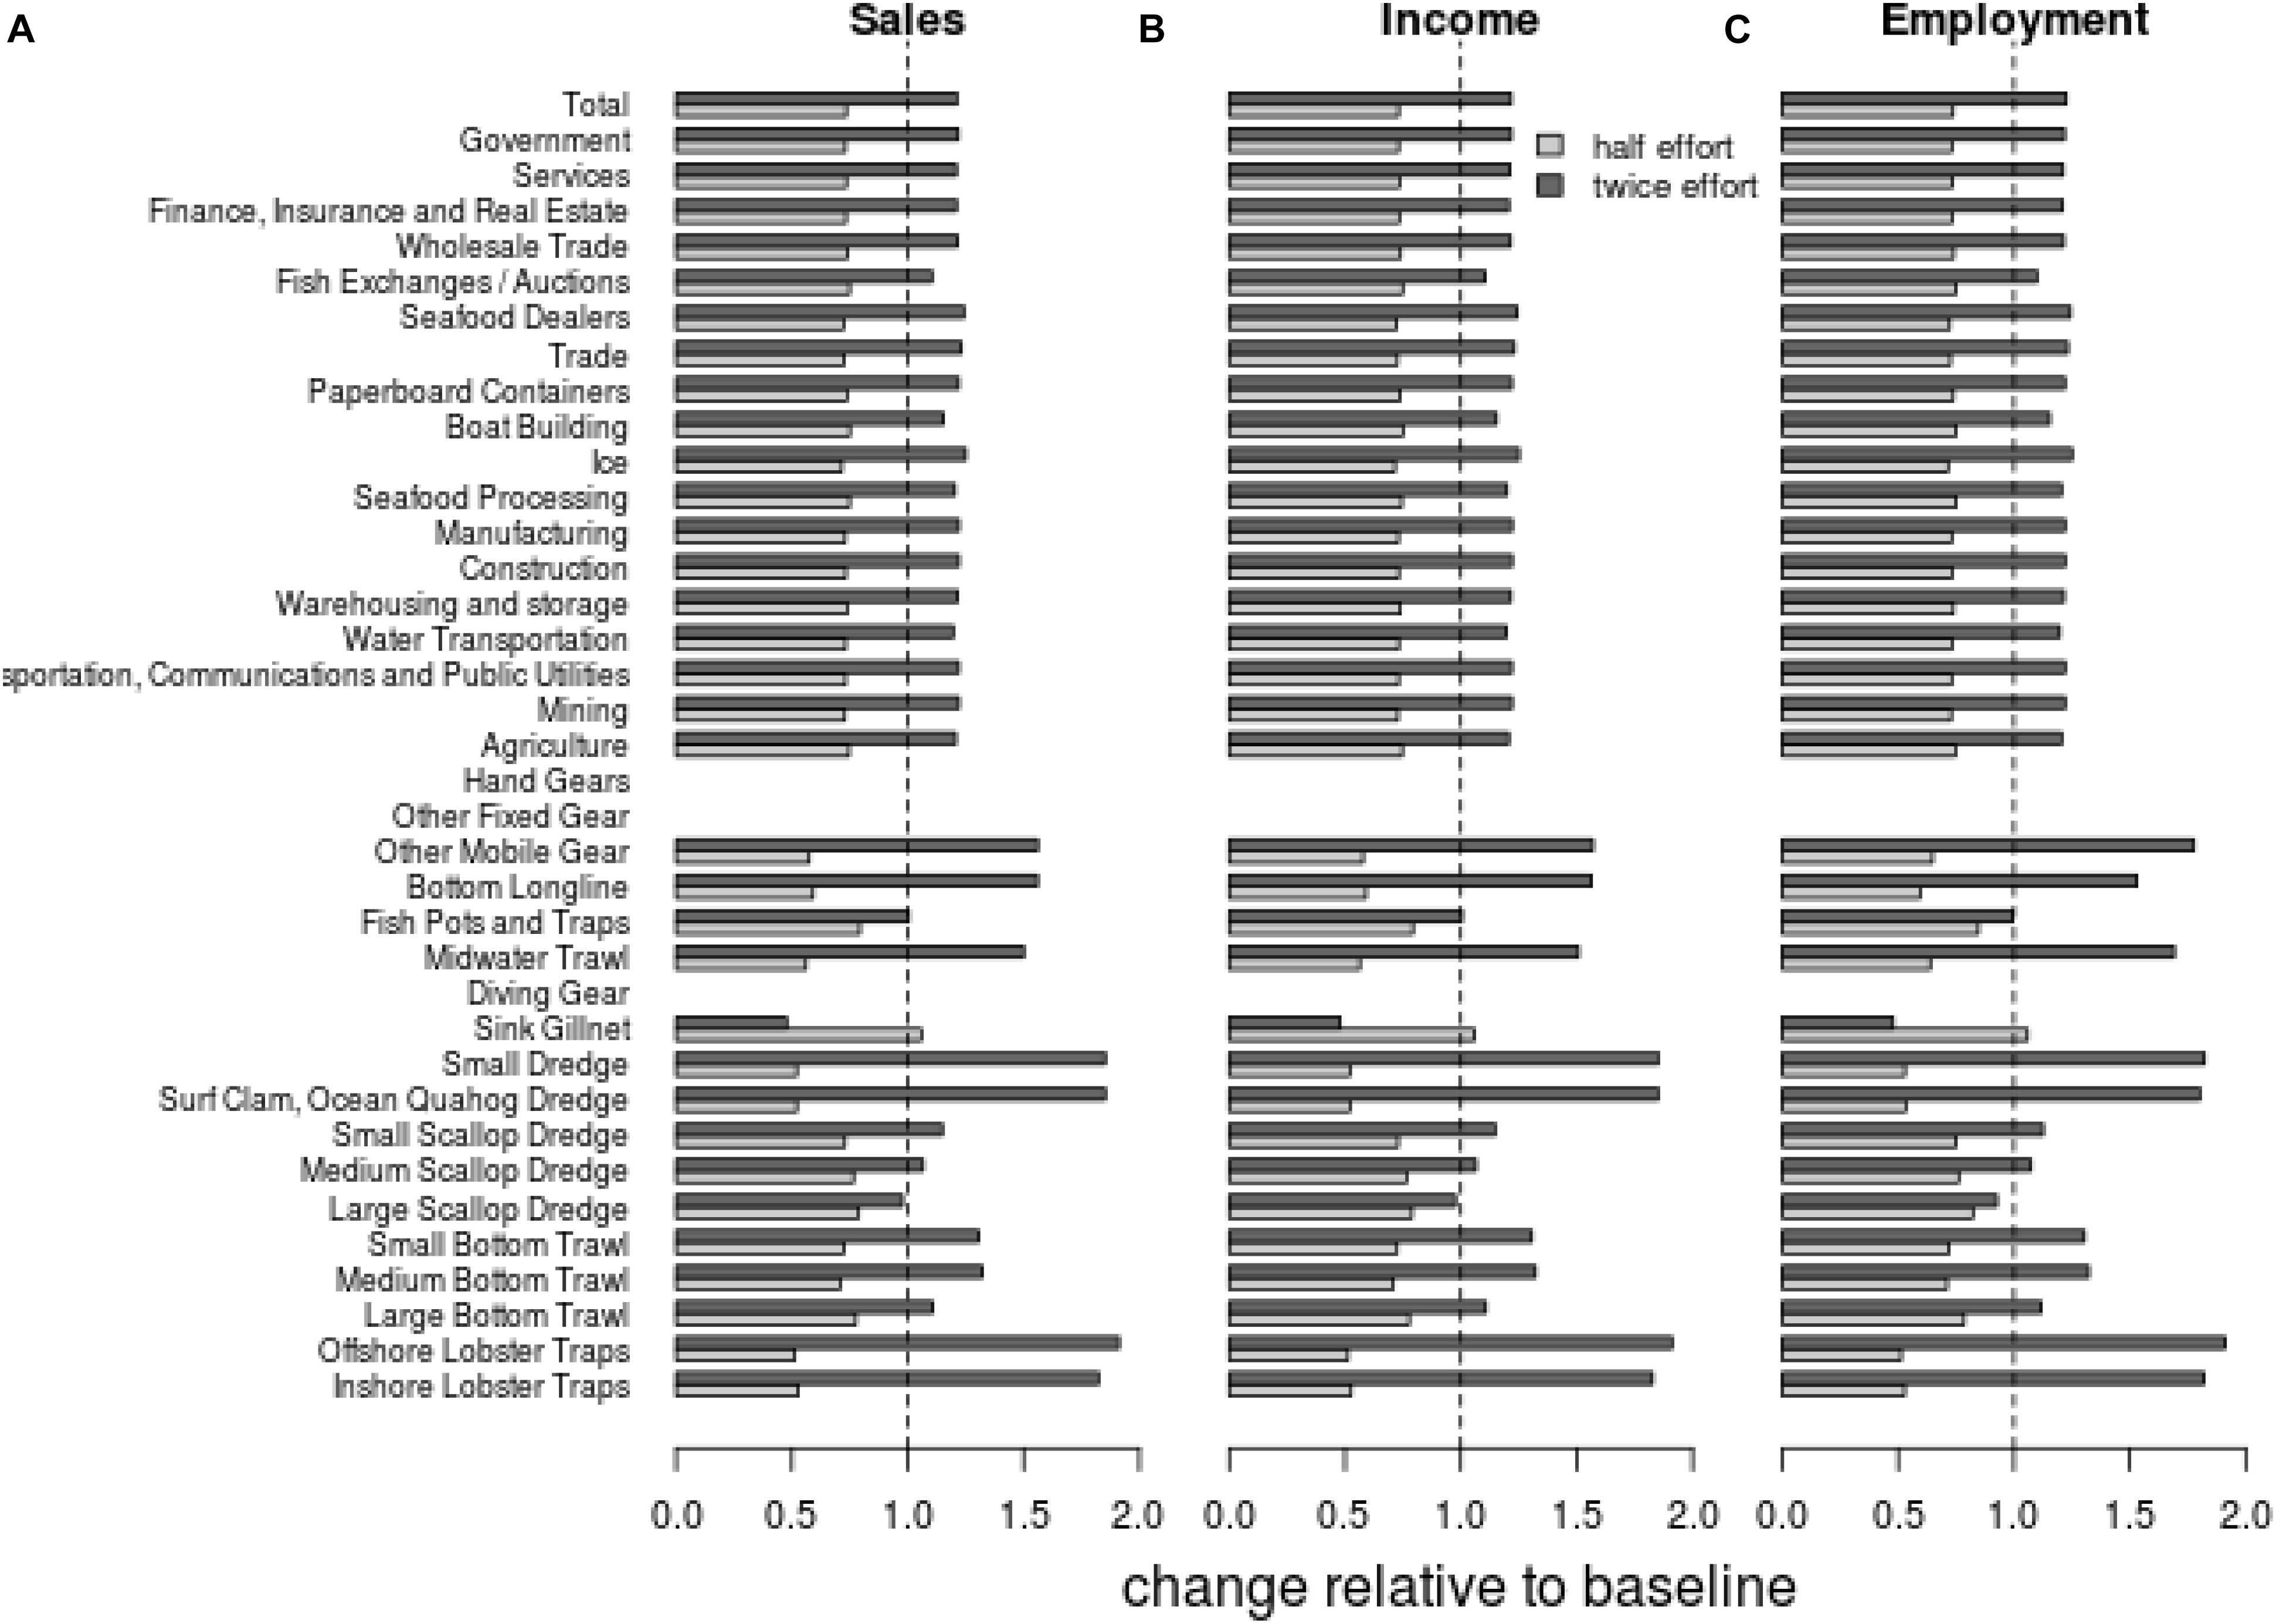
Figure 4. Percent changes in total northeast regional (A) sales ($), (B) income ($), and (C) employment (#’s) by NERIOM industry sector for the reduced and increased fishing scenarios relative to the baseline.
The number of jobs for some of the fishing sectors was more sensitive to the increased effort scenario than total sales (e.g., hand/mobile gear, demersal longline, midwater trawls, Figure 4). There were distinct regional differences in the magnitudes of effects for the changed effort scenarios, reflecting the differences in species and fleets associated with the various ports. Most notably, the changes in sales and employment for the scallop dredge sectors that occurred during the changed effort scenarios were completely a result of changes to the New England economy, with very small changes to these sectors in the Mid-Atlantic (Figures 5, 6). In contrast, decreases in total sales from the midwater trawl sector under the decreased effort scenario were driven by changes in New England, but increases in sales from this sector under the increased effort scenario were due to increases in the Mid-Atlantic (Figures 5, 6). Because some of the nuances of these changes are associated with the assumptions made when mapping fleets to ports, we do not overly highlight these and instead focus on system-wide indicators that are more robust. However, these results serve to demonstrate that the consequences of management scenarios for individual sectors may be felt disproportionately through the region in addition to across sectors, an issue of importance to managers.
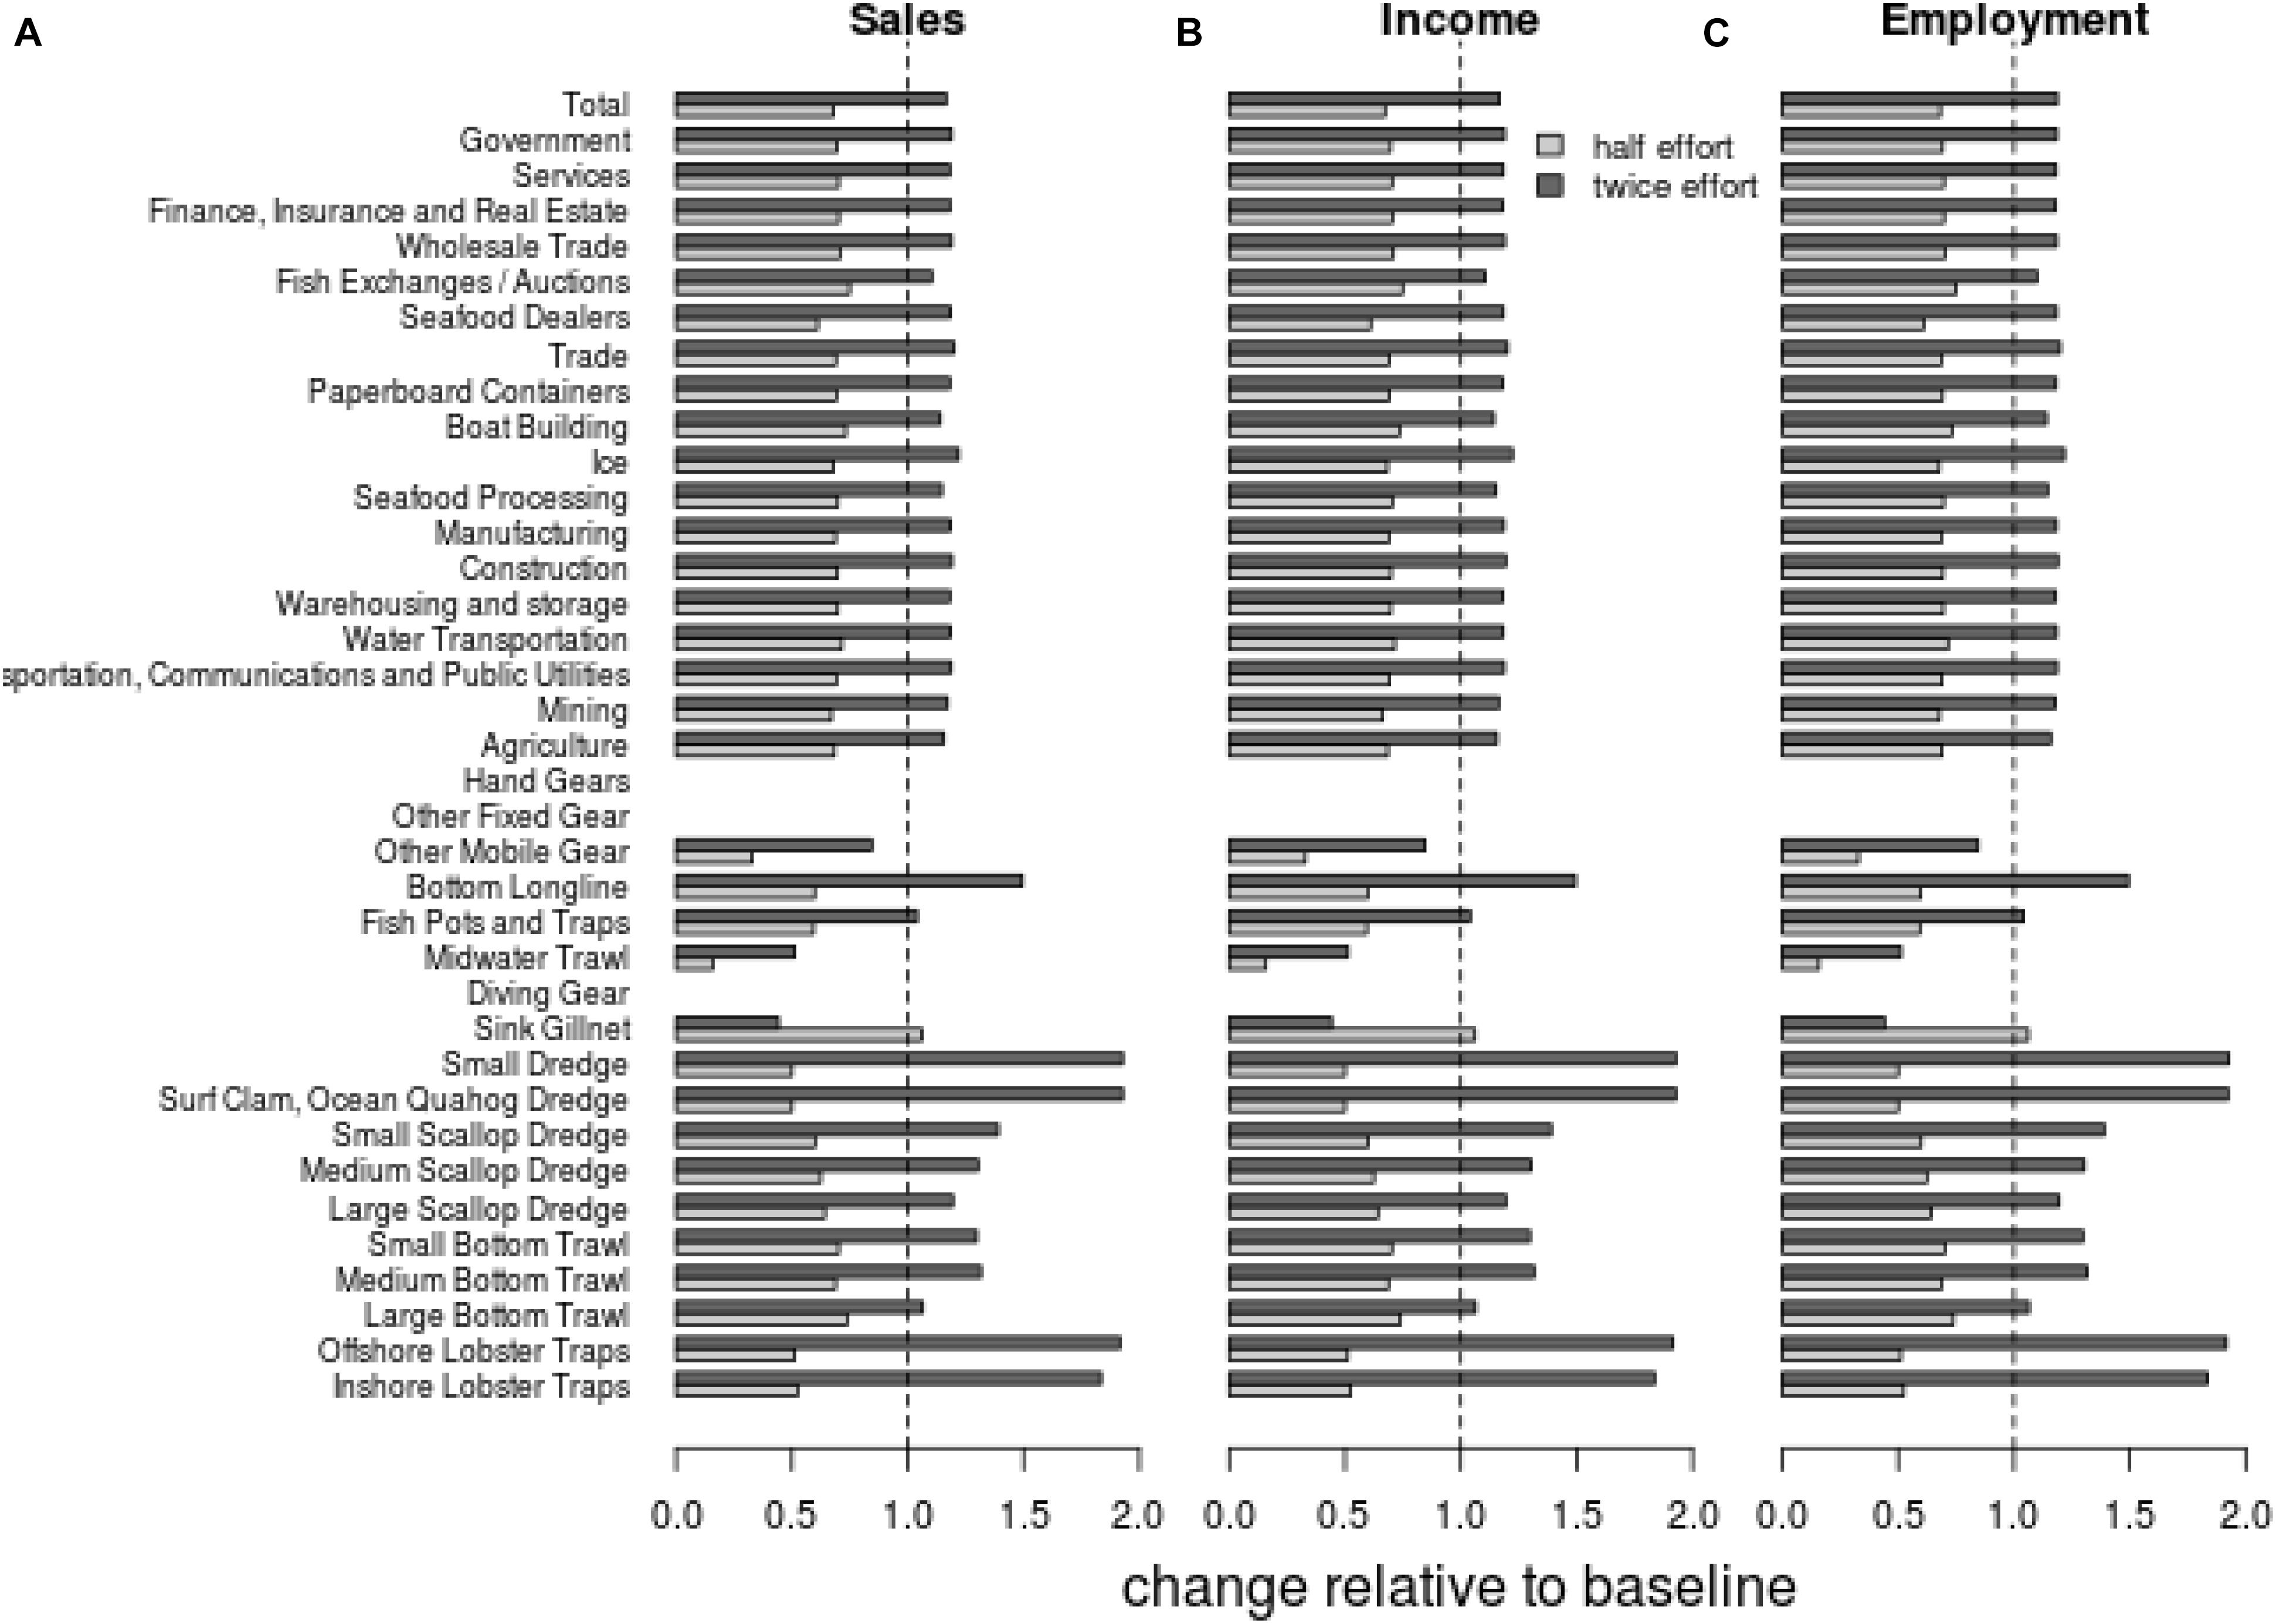
Figure 5. Percent changes in New England sub-regional (A) sales ($), (B) income ($), and (C) employment (#’s) by NERIOM industry sector for the reduced and increased fishing scenarios relative to the baseline.
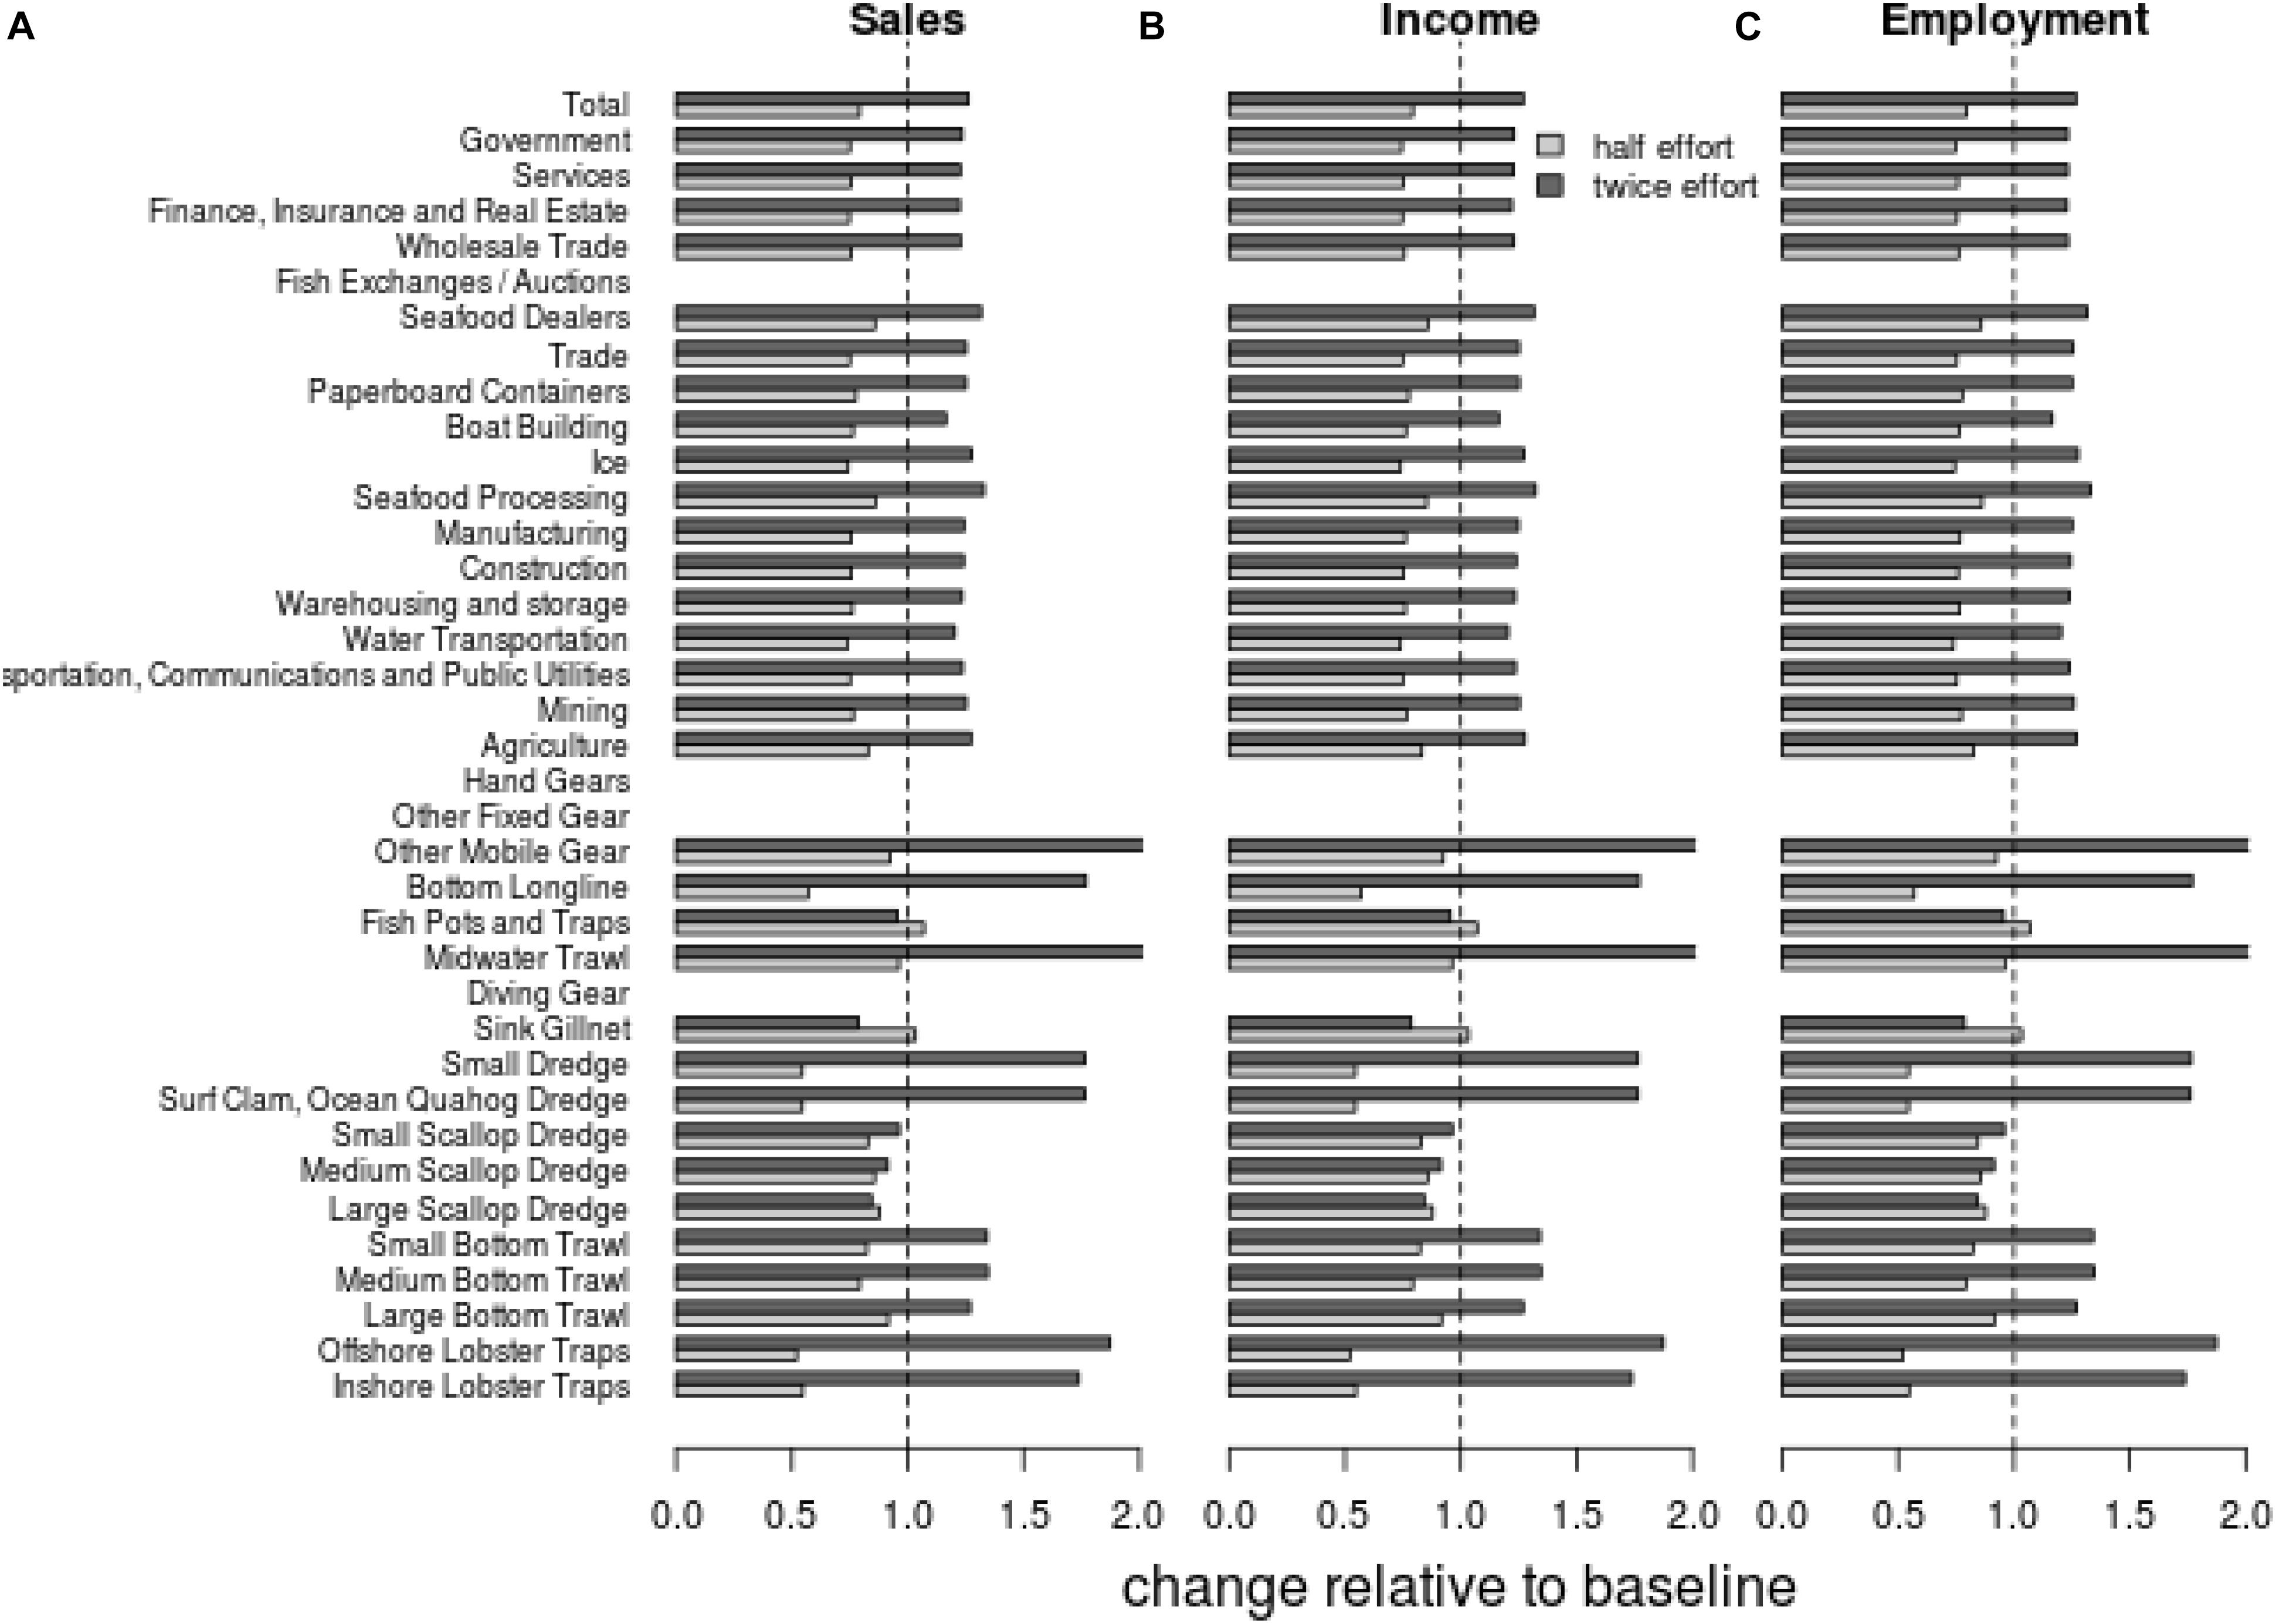
Figure 6. Percent changes in Mid-Atlantic sub-regional (A) sales ($), (B) income ($), and (C) employment (#’s) by NERIOM industry sector for the reduced and increased fishing scenarios relative to the baseline.
The changes to economic indicators from NERIOM are consistent with the changes in landed catch from the Atlantis model. Under the decreased effort scenario, the reduction in total catch from the baseline scenario means there is less demand from seafood processors and traders for goods and services required to handle the catch. Similarly, the increase in total catch from the increased effort scenario provides more business for seafood processors and subsequently more demand for industries supplying these sectors. However, the proportional increase in sales under the increased fishing effort scenario (+19%) does not match the increase in total landed catch (+46%), as increases in yield under this scenario are generally for lower value species groups. Taking the fishing fleet sectors alone, the economic system consequences mirror those of the regional indicators shown in Figure 3, even though individual sectors showed more varied responses to the scenarios and by region (Figure 4).
Discussion
We linked the output of a marine ecosystem model to a regional economic model for the Northeast United States, and estimated the impacts of simple management strategies on both ecological and economic indicators. The value of using a coupled modeling approach to quantify these effects is that it is possible (a) to make use of extant tools facilitating relatively rapid analysis and (b) to retain the detail associated with both the ecological and economic systems. Such detail is often lost when using a single model approach that bridges across disciplines and spatial and temporal scales (e.g., Fulton, 2010). Coupling existing models, even in a one-way fashion as we did here, greatly facilitates the simultaneous consideration of multiple management objectives.
A key element of ecosystem-based management of marine resources is the development of analytical tools for quantifying tradeoffs associated with human activities (Leslie and McLeod, 2007; Link, 2010). We quantified tradeoffs among ecological groups associated with alternative fishing scenarios, with shifts in ecosystem composition and resulting changes to both magnitude and composition of landed catch. Under our increased effort scenario, the total amount of fisheries landings increased (but not linearly with effort), leading to a higher proportion of species groups overfished compared to the baseline and reduced effort scenarios. At the system level, our increased fishing effort scenario increased sales, income, and employment, yet there was very little change to the average income. This implies that the dynamics of the entire ecological and economic system may have some inherent stability despite individual taxa or fleet dynamics (Link, 2018). Our analyses suggest that the economic impacts of fishing scenarios on individual industry sectors, particularly harvesting sectors, can be large and variable even though system level properties were predictable and robust. These large, systemic effects were observed even during the relatively short time period for our model projections; consequences would potentially be amplified if viewing these scenarios over the long term. This highlights the need to consider relative resilience of individual system components in addition to systematic indicators when evaluating management strategy performance.
There was a disproportionate effect of the fishing scenarios on the ecological versus economic components of the modeling framework. While the economic indicators tracked in the direction expected (increased landed catch led to more dollars and jobs, decreased landed catch resulted in less value and fewer jobs), the magnitude of the change at the system level was not the same as for the ecological system. For the increased fishing effort scenario, economic gains were smaller than the ecological losses in terms of proportionality, with this scenario appearing to have greater magnitude of effects on the biological system. In this scenario, values for ecological indicators approached threshold values known to be associated with perturbed systems (e.g., Shin et al., 2010; Large et al., 2013; Pranovi et al., 2014). There are also undoubtedly threshold values in economic indicators that would define departure from safe operating space (e.g., levels of revenue from a sector that would force it to go out of business), which would also constrain the feasibility of management options. However, these thresholds have not yet been fully developed. Although welfare analysis would be necessary to understand optimal tradeoffs, this analysis suggests some potential for gains from management regimes aimed at system stability (Link, 2018).
These disproportionate impacts pose questions as to what policy objectives to prioritize. The primary economic impacts associated with the fishing effort scenarios were on the fishery sectors, with smaller impacts on jobs and earnings at the scale of the Northeast United States, consistent with the results of Kaplan and Leonard (2012). Our coupled model is a tool to at least address quantitatively what the changes associated with alternative actions are for different sectors, which seems preferable to ignoring such questions and tradeoffs even though they exist. Undoubtedly, these questions and tradeoffs are being made, even if implicitly (e.g., Stephenson et al., 2017). Consequently, this tool can help elicit policy priorities and the viability (or not) of actions given constraints of satisfying management objectives, which would include societal goals such maintaining employment in individual business sectors. Clearly quantifying the tradeoffs among a range of objectives (by using MSE) will be critical for advancing EBFM implementation.
Input–output models can be useful to elucidate a broad suite of system dynamics and impacts, with considerable detail on linkages among industries. The spatial resolution of the NERIOM model provides information at scales relevant to fisheries management decision-making in the Northeast United States, although we mainly focused on the larger regional scale here. Because the input–output analysis is static, there is no feedback mechanism from the economic back to the ecological sub-model. For example, the model does not include market corrections such as price changes or behavioral responses to changes in supply, even though both economic theory and empirical analysis (e.g., Lee and Thunberg, 2013) suggest these might occur. Effects are best interpreted as the immediate/short-term impacts of the change being analyzed. Dynamic economic models, such as computable general equilibrium models (CGE; e.g., Jin et al., 2012) can model behavioral responses to changes in the economy. A dynamic economic model feeding back into the ecosystem model might also enable investigation of non-linear effects such as regional sectors going out of business, or redistribution of fishing effort and associated employment and investment as a result of changes in seafood supply, be it due to fluctuations in biomass or changes in spatial availability of various fished species. Other, related methods to estimate the value of ecosystem goods and services with respect to ecosystem status in response to human use in a particular sector (e.g., Costanza et al., 1997) have their place. Other ecosystem goods and services could be derived from the modeling approach highlighted here (e.g., recreational opportunities and ecotourism). And it would certainly be plausible to pair the tradeoff analyses presented here with those obtained from other modeling approaches that might better represent other ecosystem goals (e.g., non-market value of taxa such as charismatic megafauna, biodiversity, etc.). We thus reiterate the important role of multidisciplinary datasets, multi-model inference, and multiple modeling objectives in tradeoff analysis that inform management. We also acknowledge that other, prior studies focused only on one species or one fleet and/or sub-region have indeed shown the benefits of using the input–output approach (e.g., Briggs et al., 1982; Steinback, 1999, 2004; Kirkley et al., 2011) that was then expanded to consider other factors. Of particular emphasis here is that, although it could always be expanded, we contrasted the responses of an entire system simultaneously, ensuring consistency in the treatment of ecosystem dynamics across a range of ecosystem goods and services.
We applied blanket multipliers to fishing effort across all fishing fleets in our scenarios. By presenting these results, it is not our intent to suggest that one should double fishing effort to increase catch (indeed the ecological costs associated with this are at odds with current fisheries policy objectives). Nor do we suggest that halving effort would not affect the economy (although our results suggest the cumulative impacts of doing so are disproportionately lower). Tradeoffs between conservation objectives and economic impacts were apparent, but these were non-linear. Rather, our scenarios provide some contrast for identifying non-linearities and second order, trickle-through effects that would have not otherwise been identified, highlighting why this type of coupled full system modeling needs to be done. Kaplan and Leonard (2012) considered a set of more plausible management options associated with some specific objectives, and Fulton et al. (2014) specifically included a stakeholder scoping process when developing objectives and management scenarios to evaluate. Alternative management scenarios that varied the level of change to mortality or fishing effort across fishing fleets and/or species groups could be applied to see what the tradeoffs of these management actions are. While additional detail may be required to focus on some combinations of management action and indicators of performance (for ecological, economic, and societal objectives), our scenarios show that impacts do transfer and that these are not always linear or straightforward. Further, the tools to conduct such detailed analysis are extant for this region, and are growing around the world, highlighting the development of such MSE tools to explore a range of tradeoffs among various management objectives.
An advantage of our approach is that it is able to incorporate complexities of both ecological and economic system components and generally affords the ability to test management options (e.g., via MSE; Punt et al., 2016), particularly noting a range of responses across a suite of performance measures. A large number of performance measures have been suggested and used for MSE (Punt, 2017). Ideally these ought to reflect the full set of management objectives against which performance of options needs to be compared, which includes societal objectives. Thus, the combination of ecological and economic indicators is sorely needed. Summarizing results using integrative, systematic metrics rather than analyzing at the individual species or fishing fleet level makes it easier to visualize quantities and tradeoffs that appropriately reflect larger scale, strategic goals for management (e.g., Shin et al., 2010; Coll et al., 2016). Indicators reflecting performance with respect to societal objectives of fisheries are also increasingly available and calculated at a range of cultural and governance scales (e.g., Melnychuk et al., 2012; Colburn et al., 2016; Costello et al., 2016). Coupled modeling approaches provide a formal means of calculating values for economic indicators of changes associated with human and environmental pressures within frameworks typically used to derive indicators quantifying biological management performance. Our approach thus offers opportunity to extend the range of performance measures considered when evaluating the effects of management strategies that extend beyond fishing (though that was the focus of our analyses). Including the indicators derived from this coupled approach into the performance measures considered in a more formal MSE that includes feedbacks from human system of activities and management decisions on socio-ecological system dynamics is a natural extension of this work.
Coupled ecological-economic models can help to identify system-level responses to management alternatives in a manner otherwise impractical. The coupled approach presented here has the detail necessary to identify which fleets and communities warrant additional investigation through more refined modeling to more rigorously assess changes in welfare and benefits. Our results show how information on both the economic and ecological consequences of alternative management actions can more clearly illustrate benefits and pitfalls of alternative management options. As we continue to implement EBFM, it is the judicious use of extant tools as noted herein that will escalate broader, systematic management and serve to better identify the management choices needed.
Data Availability
The datasets generated for this study are available on request to the corresponding author.
Author Contributions
GF, RG, and JL ran the ecological model. GD and SS ran the economic model. GF and GD coupled model outputs. JL and GF conceptualized the work. GF, JL, and GD wrote the initial draft. All authors contributed to subsequent drafts. JL procured funding.
Funding
JL obtained a Fisheries and the Environment project to support GF for part of this work.
Conflict of Interest Statement
The authors declare that the research was conducted in the absence of any commercial or financial relationships that could be construed as a potential conflict of interest.
Acknowledgments
We thank Sarah Gaichas and Scott Large for their good advice in discussions leading up to this manuscript. The manuscript was improved following the helpful comments of Cam Ainsworth, Isaac Kaplan, and the reviewers.
Supplementary Material
The Supplementary Material for this article can be found online at: https://www.frontiersin.org/articles/10.3389/fmars.2019.00133/full#supplementary-material
References
Acheson, J. M., and Reidman, R. (1982). Biological and economic effects of increasing the minimum legal size of American lobster in Maine. Trans. Am. Fish. Soc. 111, 1–12. doi: 10.1577/1548-8659(1982)111<1:BAEEOI>2.0.CO;2
Arrow, K., Bolin, B., Costanza, R., Dasgupta, P., Folke, C., Holling, C., et al. (1995). Economic growth, carrying capacity, and the environment. Science 268, 520–521. doi: 10.1126/science.268.5210.520
Azarovitz, T. (1981). “A brief historical review of the Woods Hole Laboratory trawl survey time series,” in Bottom Trawl Surveys, Vol. 58, eds W. G. Doubleday and D. Rivard (Ottawa, ON: Canadian Special Publication Fisheries and Aquatic Sciences), 273.
Briggs, H., Townsend, R., and Wilson, J. (1982). An input–output analysis of Maine’s fisheries. Mar. Fish. Rev. 44, 1–7.
Bunnefeld, N., Hoshino, E., and Milner-Gulland, E. J. (2011). Management strategy evaluation: a powerful tool for conservation? Trends Ecol. Evol. 26, 441–447. doi: 10.1016/j.tree.2011.05.003
Colburn, L. L., Jepson, M., Weng, C., Seara, T., Weiss, J., and Hare, J. A. (2016). Indicators of climate change and social vulnerability in fishing dependent communities along the Eastern and Gulf Coasts of the United States. Mar. Policy 74, 323–333. doi: 10.1016/j.marpol.2016.04.030
Coll, M., Shannon, L. J., Kleisner, K. M., Juan-Jordá, M. J., Bundy, A., Akoglu, A. G., et al. (2016). Ecological indicators to capture the effects of fishing on biodiversity and conservation status of marine ecosystems. Ecol. Indic. 60, 947–962. doi: 10.1016/j.ecolind.2015.08.048
Costanza, R., d’Arge, R., De Groot, R., Faber, S., Grasso, M., Hannon, B., et al. (1997). The value of the world’s ecosystem services and natural capital. Nature 387, 253–260. doi: 10.1038/387253a0
Costello, C., Ovando, D., Clavelle, T., Strauss, C. K., Hilborn, R., Melnychuk, M. C., et al. (2016). Global fishery prospects under contrasting management regimes. Proc. Natl. Acad. Sci. U.S.A. 113, 5125–5129. doi: 10.1073/pnas.1520420113
Edwards, S. F., Link, J. S., and Rountree, B. P. (2004). Portfolio management of wild fish stocks. Ecol. Econ. 49, 317–329. doi: 10.1016/j.ecolecon.2004.04.002
Fay, G., Link, J. S., and Hare, J. A. (2017). Assessing the effects of ocean acidification in the Northeast United States using an end-to-end marine ecosystem model. Ecol. Modell. 347, 1–10. doi: 10.1016/j.ecolmodel.2016.12.016
Fulton, E. A. (2010). Approaches to end-to-end ecosystem models. J. Mar. Syst. 81, 171–183. doi: 10.1016/j.jmarsys.2009.12.012
Fulton, E. A., Link, J. S., Kaplan, I. C., Savina-Rolland, M., Johnson, P., Ainsworth, C., et al. (2011). Lessons in modelling and management of marine ecosystems: the Atlantis experience. Fish Fish. 12, 171–188. doi: 10.1111/j.1467-2979.2011.00412.x
Fulton, E. A., Smith, A. D., Smith, D. C., and Johnson, P. (2014). An integrated approach is needed for ecosystem based fisheries management: insights from ecosystem-level management strategy evaluation. PLoS One 9:e84242. doi: 10.1371/journal.pone.0084242
Harksever, D., Hart, D., and Wang, S. (2000). “A bio-economic analysis of an area rotational management program in the U.S. Atlantic sea scallop fishery,” in Proceedings of the Tenth Biennial Conference of the International Institute of Fisheries Economics & Trade: Macrobehavior and Macroresults, (Corvallis, OR: International Institute for Fisheries Economics and Trade).
Hart, D. R. (2009). Improving utilization of the Atlantic sea scallop resource: an analysis of rotational management of fishing grounds: comment. Land Econ. 85, 378–382. doi: 10.3368/le.85.2.378
Hilborn, R. (2011). Future directions in ecosystem based fisheries management: a personal perspective. Fish. Res. 108, 235–239. doi: 10.1016/j.fishres.2010.12.030
Hoagland, P., Jin, D., Thunberg, E., and Steinback, S. (2005). “Economic activity associated with the northeast shelf large marine ecosystem: application of an input–output approach,” in Sustaining Large Marine Ecosystems: The Human Dimension, eds T. Hennessey and J. Sutinen (New York, NY: Elsevier Science), 157–179.
Holland, D. (2011). Optimal intra-annual exploitation of the Maine lobster fishery. Land Econ. 87, 699–711. doi: 10.3368/le.87.4.699
Jin, D., DePiper, G., and Hoagland, P. (2016). Applying portfolio management to implement ecosystem-based fishery management (EBFM). North Am. J. Fish. Manag. 36, 652–669. doi: 10.1080/02755947.2016.1146180
Jin, D., Hoagland, P., Dalton, T. M., and Thunberg, E. M. (2012). Development of an integrated economic and ecological framework for ecosystem-based fisheries management in New England. Prog. Oceanogr. 102, 93–101. doi: 10.1016/j.pocean.2012.03.007
Kaplan, I. C., and Leonard, J. (2012). From krill to convenience stores: forecasting the economic and ecological effects of fisheries management on the United States West Coast. Mar. Policy 36, 947–954. doi: 10.1016/j.marpol.2012.02.005
Kirkley, J. E., Walden, J., and Fare, R. (2011). A general equilibrium model for Atlantic herring (Clupea harengus) with ecosystem considerations. ICES J. Mar. Sci. 68, 860–866. doi: 10.1093/icesjms/fsr023
Kruse, G. H., Browman, H. I., Cochrane, K. L., Evans, D., Fletcher, W. J., Jamieson, G. S., et al. (2012). “Steps for future progress in ecosystem-based fisheries management: what’s next?,” in Global Progress in Ecosystem-Based Fisheries Management, eds G. H. Kruse, H. I. Browman, K. L. Cochrane, D. Evans, G. S. Jamieson, P. A. Livingston, et al. (Alaska Sea Grant: University of Alaska Fairbanks), doi: 10.4027/gpebfm.2012.019
Large, S. I., Fay, G., Friedland, K. D., and Link, J. S. (2013). Defining trends and thresholds in responses of ecological indicators to fishing and environmental pressures. ICES J. Mar. Sci. 70, 755–767. doi: 10.1093/icesjms/fst067
Lee, M., and Thunberg, E. M. (2013). An inverse demand system for New England groundfish: welfare analysis of the transition to catch share management. Am. J. Agric. Econ. 95, 1178–1195. doi: 10.1093/ajae/aat061
Lehuta, S., Holland, D. S., and Pershing, A. J. (2014). Investigating interconnected fisheries: a coupled model of the lobster and herring fisheries in New England. Can. J. Fish. Aquat. Sci. 71, 272–289. doi: 10.1139/cjfas-2013-0185
Leslie, H. M., and McLeod, K. L. (2007). Confronting the challenges of implementing marine ecosystem-based management. Front. Ecol. Environ. 5, 540–548. doi: 10.1890/060093
Leontief, W. W. (1951). Input-output economics. Sci. Am. 185, 15–21. doi: 10.1038/scientificamerican1051-15
Levin, P. S., Fogarty, M. J., Murawski, S. A., and Fluharty, D. (2009). Integrated ecosystem assessments: developing the scientific basis for ecosystem-based management of the ocean. PLoS Biol. 7:e1000014. doi: 10.1371/journal.pbio.1000014
Link, J. (2010). Ecosystem-Based Fisheries Management: Confronting Tradeoffs. Cambridge: Cambridge University Press. doi: 10.1017/CBO9780511667091
Link, J. S. (2018). System level optimal yield: increased value, less risk, improved stability, and better fisheries. Can. J. Fish. Aquat. Sci. 75, 1–16. doi: 10.1139/cjfas-2017-0250
Link, J. S., Bundy, A., Overholtz, W. J., Shackell, N., Manderson, J., Duplisea, D., et al. (2011a). Ecosystem-based fisheries management in the Northwest Atlantic. Fish Fish. 12, 152–170. doi: 10.1098/rsos.170215
Link, J. S., Gamble, R. J., and Fulton, E. A. (2011b). NEUS–Atlantis: Construction, Calibration, and Application of an Ecosystem Model with Ecological Interactions, Physiographic Conditions, and Fleet Behavior. Available at: http://nefsc.noaa.gov/publications/tm/tm218/
Link, J. S., Fulton, E. A., and Gamble, R. J. (2010). The northeast United States application of ATLANTIS: a full system model exploring marine ecosystem dynamics in a living marine resource management context. Prog. Oceanogr. 87, 214–234. doi: 10.1016/j.pocean.2010.09.020
Little, L. R., Parslow, J., Fay, G., Grafton, R. Q., Smith, A. D., Punt, A. E., et al. (2013). Environmental derivatives, risk analysis, and conservation management. Conserv. Lett. 7, 196–207. doi: 10.1111/conl.12041
Marasco, R. J., Goodman, D., Grimes, C. B., Lawson, P. W., Punt, A. E., and Quinn, T. J. II (2007). Ecosystem-based fisheries management: some practical suggestions. Can. J. Fish. Aquat. Sci. 64, 928–939. doi: 10.1139/f07-062
Marshall, K. N., Levin, P. S., Essington, T. E., Koehn, L. E., Anderson, L. G., Bundy, A., et al. (2018). Ecosystem-based fisheries management for social–ecological systems: renewing the focus in the United States with next generation fishery ecosystem plans. Conserv. Lett. 11:e12367. doi: 10.1111/conl.12367
McDonald, A. D., Little, L. R., Gray, R., Fulton, E., Sainsbury, K. J., and Lyne, V. D. (2008). An agent-based modelling approach to evaluation of multiple-use management strategies for coastal marine ecosystems. Math. Comput. Simul. 78, 401–411. doi: 10.1016/j.matcom.2008.01.039
Melnychuk, M. C., Essington, T. E., Branch, T. A., Heppell, S., Jensen, O. P., Link, J. S., et al. (2012). Can catch share fisheries better track management targets? Fish Fish. 13, 267–290. doi: 10.1111/j.1467-2979.2011.00429.x
Murphy, T., Kitts, A., Records, D., Demarest, C., Caless, D., Walden, J., et al. (2014). 2012 Final Report on the Performance of the Northeast Multispecies (Groundfish) Fishery (May 2012 – April 2013). Available at: https://www.nefsc.noaa.gov/publications/crd/crd1401/
NEFC (1988). An Evaluation of the Bottom Trawl Survey Program of the Northeast Fisheries Science Center. NOAA Tech Memo: NMFS-F/NEC-52. Woods Hole, MA: Northeast Fisheries Center.
Olsen, E., Fay, G., Gaichas, S., Gamble, R., Lucey, S., and Link, J. S. (2016). Ecosystem model skill assessment: yes we can! PLoS One 11:e0146467. doi: 10.1371/journal.pone.0146467
Olsen, E., Kaplan, I. C., Ainsworth, C., Fay, G., Gaichas, S., Gamble, R., et al. (2018). Ocean futures under ocean acidification, marine protection, and changing fishing pressures explored using a worldwide suite of ecosystem models. Front. Mar. Sci. 5:64. doi: 10.3389/fmars.2018.00064
PFMC (2015). Harvest Specifications and Management Measures for 2015-2016 and Biennial Periods Thereafter. Portland, OR: Pacific Fishery Management Council, 1089.
Pitcher, T. J., Kalikoski, D., Short, K., Varkey, D., and Pramod, G. (2009). An evaluation of progress in implementing ecosystem-based management of fisheries in 33 countries. Mar. Policy 33, 223–232. doi: 10.1016/j.marpol.2008.06.002
Plagányi, É. E. (2007). Models for an Ecosystem Approach to Fisheries. FAO Fisheries Technical Paper No. 477. Rome: FAO, 108.
Plagányi,ÉE., van Putten, I., Hutton, T., Deng, R. A., Dennis, D., Pascoe, S., et al. (2013). Integrating indigenous livelihood and lifestyle objectives in managing a natural resource. Proc. Natl. Acad. Sci. U.S.A. 110, 3639–3644. doi: 10.1073/pnas.1217822110
Pranovi, F., Libralato, S., Zucchetta, M., and Link, J. S. (2014). Biomass accumulation across trophic levels: analysis of landings for the Mediterranean Sea. Mar. Ecol. Prog. Ser. 512, 201–216. doi: 10.3354/meps10881
Punt, A. E. (2017). Strategic management decision-making in a complex world: quantifying, understanding, and using trade-offs. ICES J. Mar. Sci. 74, 499–510. doi: 10.1093/icesjms/fsv193
Punt, A. E., Butterworth, D. S., Moor, C. L., De Oliveira, J. A., and Haddon, M. (2016). Management strategy evaluation: best practices. Fish Fish. 17, 303–334. doi: 10.1111/faf.12104
Scheld, A. M., and Anderson, C. M. (2014). Market effects of catch share management: the case of New England multispecies groundfish. ICES J. Mar. Sci. 7, 1835–1845. doi: 10.1093/icesjms/fsu001
Shin, Y. J., Shannon, L. J., Bundy, A., Coll, M., Aydin, K., Bez, N., et al. (2010). Using indicators for evaluating, comparing, and communicating the ecological status of exploited marine ecosystems. 1. The IndiSeas project. ICES J. Mar. Sci. 67, 686–691. doi: 10.1093/icesjms/fsp273
Steinback, S. R. (1999). Regional economic impact assessments of recreational fisheries: an application of the IMPLAN modeling system to marine party and charter boat fishing in Maine. North Am. J. Fish. Manag. 19, 724–736. doi: 10.1577/1548-8675(1999)019<0724:REIAOR>2.0.CO;2
Steinback, S. R. (2004). Using ready-made regional input-output models to estimate backward-linkage effects of exogenous output shocks. Rev. Reg. Stud. 34, 57–71.
Steinback, S. R., and Thunberg, E. M. (2006). Northeast Region Commercial Fishing Input-Output Model. Woods Hole, MA: U.S. Dept. of Commerce.
Stephenson, R. L., Benson, A. J., Brooks, K., Charles, A., Degnbol, P., Dichmont, C. M., et al. (2017). Practical steps toward integrating economic, social and institutional elements in fisheries policy and management. ICES J. Mar. Sci. 74, 1981–1989. doi: 10.1093/icesjms/fsx057
Thunberg, E. M., Helser, T. E., and Mayo, R. K. (1998). Bioeconomic analysis of alternative selection patterns in the United States Atlantic silver hake fishery. Mar. Resour. Econ. 13, 51–74. doi: 10.1086/mre.13.1.42629218
Valderrama, D., and Anderson, J. L. (2007). Improving utilization of the Atlantic sea scallop resource: an analysis of rotational management of fishing grounds. Land Econ. 83, 86–103. doi: 10.3368/le.83.1.86
van Putten, I. E., Kulmala, S., Thébaud, O., Dowling, N., Hamon, K. G., Hutton, T., et al. (2012). Theories and behavioural drivers underlying fleet dynamics models. Fish Fish. 13, 216–235. doi: 10.1111/j.1467-2979.2011.00430.x
Keywords: Atlantis, ecosystem modeling, bioeconomic modeling, tradeoff analysis, input–output models, ecosystem-based management
Citation: Fay G, DePiper G, Steinback S, Gamble RJ and Link JS (2019) Economic and Ecosystem Effects of Fishing on the Northeast US Shelf. Front. Mar. Sci. 6:133. doi: 10.3389/fmars.2019.00133
Received: 11 October 2018; Accepted: 04 March 2019;
Published: 22 March 2019.
Edited by:
Cecilie Hansen Eide, Norwegian Institute of Marine Research (IMR), NorwayReviewed by:
Donald F. Boesch, University of Maryland Center for Environmental Science (UMCES), United StatesXiutang Yuan, National Marine Environmental Monitoring Center, China
Copyright © 2019 Fay, DePiper, Steinback, Gamble and Link. This is an open-access article distributed under the terms of the Creative Commons Attribution License (CC BY). The use, distribution or reproduction in other forums is permitted, provided the original author(s) and the copyright owner(s) are credited and that the original publication in this journal is cited, in accordance with accepted academic practice. No use, distribution or reproduction is permitted which does not comply with these terms.
*Correspondence: Jason S. Link, SmFzb24uTGlua0Bub2FhLmdvdg==
†Present address: Gavin Fay, Department of Fisheries Oceanography, School for Marine Science and Technology, University of Massachusetts Dartmouth, New Bedford, MA, United States