 Sean R. Anderson
 Elizabeth L. Harvey
- 1Skidaway Institute of Oceanography, University of Georgia, Savannah, GA, United States
Rates of microzooplankton grazing and phytoplankton growth are seldom measured with respect to time, yet such estimates may better reflect temporal variability in coastal phytoplankton communities and offer insight into mechanisms that control populations. To assess seasonal patterns in rates, we performed 41, weekly dilution experiments over a full year in the Skidaway River Estuary (GA), measuring rates of phytoplankton growth, microzooplankton grazing, and viral lysis based on total chlorophyll and group-specific abundances (Synechococcus spp., picoeukaryotes, and nanoeukaryotes). Seasonal variability in microzooplankton grazing (0–2.11 day-1) and phytoplankton growth rates (-0.3–2.43 day-1) was observed, with highest values typically recorded in summer and lowest in winter. Grazing pressure was strongest in winter-spring, as phytoplankton accumulation rates were often negative (-0.16–0.28 day-1). Rates varied similarly over seasons for chlorophyll, pico-, and nanoeukaryotes, while rates on Synechococcus spp. were rarely significant in dilutions and did not follow seasonal trends. Few experiments (7%) yielded significant rates of viral lysis. While temperature was an important predictor of phytoplankton rates via PLS analysis, temperature exhibited stronger linearity with growth rates (R2 = 0.46–0.56) compared to grazing rates (R2 = 0.11–0.27), which were more likely driven by observed seasonal shifts in plankton community composition (e.g., fall diatom blooms). Establishing temporal rate measurements is critical to identify factors that drive phytoplankton growth and mortality and accurately predict shifts in phytoplankton population dynamics and food web processes within marine systems.
Introduction
The fate of phytoplankton populations largely depends on the balance between growth and mortality, which can determine the productivity of a marine system, as well as the availability and cycling of carbon and nutrients (Steinberg and Landry, 2017). The bulk of phytoplankton production in the global oceans is consumed daily by microzooplankton (60–70%), which represent a diverse assemblage of 20–200 μm herbivorous grazers (Sherr and Sherr, 2007; Schmoker et al., 2013). Microzooplankton are important in marine food webs, as they can ingest a wide range of autotrophic prey (cyanobacteria to chain-forming diatoms), grow at rates on par with their prey, and contribute to the transfer of organic biomass to higher trophic levels (Sherr et al., 2003; Calbet and Saiz, 2005; Steinberg and Landry, 2017). Despite the well-understood ecological impact of microzooplankton grazing (Calbet and Landry, 2004), limited temporal resolution in grazing rates has made it difficult to identify drivers of grazing pressure. Yet, knowledge of what drives trends in microzooplankton grazing is essential for accurate model predictions of phytoplankton population dynamics (Li et al., 2011) and related shifts in trophic activity and biogeochemical cycling.
Compared to an extensive collection of spatial grazing rate data (>100 studies from polar to tropical regions; Schmoker et al., 2013), only a handful of studies have consistently measured microzooplankton grazing rates over an annual cycle at monthly (Calbet et al., 2008; Gutiérrez-Rodríguez et al., 2011) to weekly intervals (Kim et al., 2007; Lawrence and Menden-Deuer, 2012). Such efforts have revealed seasonality in microzooplankton grazing (and phytoplankton growth), typically associated with shifts in plankton community composition, though temperature has also emerged as a potential driver of grazing rates (Rose and Caron, 2007; Calbet et al., 2008; Lawrence and Menden-Deuer, 2012; Zhou et al., 2015). Evidence supports temperature as a reliable predictor of phytoplankton growth (Eppley, 1972; Bissinger et al., 2008), while the relationship between temperature and microzooplankton herbivory remains uncertain. For instance, the average grazing impact at temperatures <5°C is often lower than the global average (i.e., <67%; Caron et al., 2000; Calbet et al., 2011), yet grazing rates of 0.5 day-1 have been recorded under these conditions. This suggests that microzooplankton can remove primary production even at near-freezing temperatures (Lawrence and Menden-Deuer, 2012; Sherr et al., 2013; Menden-Deuer et al., 2018). Likewise, temperatures >15°C may not always translate in higher grazing rates, due in part to complex feeding interactions (e.g., grazer–prey selectivity) that may mask temperature effects (Kimmance et al., 2006; Chen et al., 2012). To better address the complexities in what drives microzooplankton grazing, it is therefore necessary to employ temporal sampling strategies and rate measurements that encompass a wide range of environmental conditions.
Given the strong temporal variability in environmental and biological processes in coastal environments, like estuaries, these systems are ideal for examining drivers of microzooplankton grazing (Cloern and Jassby, 2010; Blauw et al., 2012; Lawrence and Menden-Deuer, 2012). Seasonal changes in primary production, phytoplankton biomass, and community composition, including episodic bloom events (e.g., chain-forming diatoms), are commonplace in estuaries (Cloern et al., 2014; Carstensen et al., 2015; Cloern, 2018). Further, the magnitude or duration of a seasonal phytoplankton bloom can depend on shifting abiotic (e.g., temperature and nutrients) or biotic processes (e.g., grazing and viral lysis; Cloern et al., 2014; Tsai et al., 2015). Ultimately, temporal patterns in production can have globally relevant consequences for carbon cycling, as estuaries act to mediate land-sea fluxes of dissolved inorganic and organic matter (DIM and DOM; Bittar et al., 2016). Despite the importance of microzooplankton in consuming estuarine production (Calbet and Landry, 2004), trends in grazing, including potential biochemical drivers of grazing pressure, have been poorly resolved over seasonal cycles. Incorporation of microzooplankton grazing rates on these time scales will help to resolve estimates of annual productivity, phytoplankton biomass accumulation, and compositional shifts that occur within coastal areas.
To explore temporal rate dynamics, we performed 41, weekly to bi-weekly dilution experiments over an annual cycle in the Skidaway River Estuary (GA, United States), measuring rates of phytoplankton growth, microzooplankton grazing, and viral lysis for bulk chlorophyll and specific phytoplankton groups (Synechococcus spp., pico-, and nanoeukaryotes). Recently, these methods were used to measure phytoplankton rates over the tidal cycle in the estuary (see Anderson et al., 2018), though seasonal patterns in rates remain unclear. Previous long-term sampling in the estuary has revealed significant seasonal and interannual variability in many surface-layer properties like temperature, nutrients, dissolved and particulate organic carbon (DOC and POC), chlorophyll, and plankton biomass (Verity, 2002a,b; Verity and Borkman, 2010; Bittar et al., 2016). Such environmental and biological measurements were included in our weekly sampling to establish possible drivers of growth and grazing rates over the year. Determining drivers of population rates, especially microzooplankton grazing, will allow for more accurate predictions of primary productivity, trophic transfer, and biogeochemical cycling within marine systems and inform future climate scenarios.
Materials and Methods
Water Sampling
Over a full year (February 21, 2017 to February 21, 2018), 41 weekly dilution experiments were conducted using surface water (1 m) from the Skidaway River Estuary, which is a well-mixed and highly productive subtropical system accessible by dock at the Skidaway Institute of Oceanography (31°99″N, 81°02″W). Dilutions were always performed at high tide, which allowed for temporal comparison between dates and minimized strong tidal effects previously observed in the estuary (see Anderson et al., 2018). Tide height predictions were taken from a nearby station (NOAA ID: TEC3411); semidiurnal tides in the estuary consistently ranged between 2 and 3 m and sampling dates rarely coincided with spring or neap tides. Sampling varied due to tide schedule, either occurring at the first high tide in the morning (near or after sunrise) or the subsequent high tide in the afternoon (see Supplementary Table 1). Solar radiation data was collected at a nearby land-based site on Skidaway Island (University of Georgia Weather Network). Surface water temperature, salinity, and dissolved oxygen were measured using a YSI probe (YSI 600 QS).
On each experimental day, single water samples (60 ml) were filtered through a 0.2 μm filter into acid-washed bottles and stored at -20°C for nutrient analysis. Dissolved nutrients (NO3, NH4, PO4, and SiO4) were measured following standard colorimetric protocols at the UGA Stable Isotope Laboratory using a Technicon AutoAnalyzer unit (SEAL Analytical). Particulate organic carbon (POC) and nitrogen (PON) were also measured each week by filtering single surface water samples (100 ml) onto pre-combusted 0.7 μm GF/F filters (stored at -20°C). Prior to analysis, filters were dried at 60°C for 24 h and packed into tin cups (Costech); combusted GF/F filters were used as blanks (Bittar et al., 2016). Concentrations of POC and PON were obtained using a Thermo Flash elemental analyzer (Bittar et al., 2016). Samples for nutrients and particulate organic matter were not taken for the first 2–3 weeks of sampling (see Supplementary Table 2).
Modified Dilution Method
Phytoplankton growth, microzooplankton grazing, and viral-induced mortality rates were measured using a modified dilution technique (Landry and Hassett, 1982; Evans et al., 2003). We employed a two-point modification of the method using whole seawater (WSW) and a diluted fraction of 20% WSW (Worden and Binder, 2003; Landry et al., 2008; Lawrence and Menden-Deuer, 2012). The use of an abbreviated dilution approach has been shown to yield rate estimates that are accurate to a traditional gradient (Worden and Binder, 2003; Strom and Fredrickson, 2008) and reliable to non-linearity in grazing (Chen, 2015; Morison and Menden-Deuer, 2017).
Diluent preparation was similar across the 41 sampling days. Due to time constraints, grazer-free and virus-free diluents were always prepared a day earlier than the start of each experiment. At high tide, 12–14 l of WSW was collected from the estuary and screened through 200-μm Nitex mesh to limit retention of larger mesozooplankton grazers (e.g., copepods). The entire volume of WSW was then gravity filtered through a 0.45 μm filter (PALL AcropakTM Supor®membrane capsule) which represented grazer-free diluent. Half of the grazer-free diluent (∼6 l) was then passed through a tangential flow filtration unit (TFF; Millipore) with a 30-kilodalton filter size, creating virus-free diluent. Diluent carboys were kept overnight at 18°C in the dark to mitigate bacteria or viral growth (verified by flow cytometry) and were acclimated to an appropriate temperature prior to dilution experiments.
The following day (time zero = T0), fresh WSW was collected at high tide as described above and combined with grazer- and virus-free diluents at a proportion of 20% WSW. The 20% dilutions and 100% WSW treatments were gently siphoned into triplicate 1.2-l bottles and amended with nutrients (10 μM NO3 + 1.1 μM PO4; Bittar et al., 2016). Additional triplicate 100% WSW bottles were prepared without nutrients to check for effects of nutrient limitation. On each sampling day, 12 total bottles were incubated for 24 h in a clear, 300-l tank situated on a nearby dock. The tank was maintained at ambient water temperature using flow-through from the estuary. A HOBO data logger and screen mesh were used to replicate in situ light intensity. Natural movement of the dock kept the bottles in the tank well-mixed over the incubation period.
Estimation of Phytoplankton Growth and Mortality
Extracted chlorophyll and group-specific phytoplankton abundances (via flow cytometry) were measured at the start of each experiment (T0) and after 24 h (T24) and used to quantify daily phytoplankton growth and mortality rates. For chlorophyll, triplicate 50–100 ml samples were filtered onto 25 mm 0.7 μm GF/F filters, extracted in the dark at room temperature for 12–24 h in 91% ethanol, and measured on a Turner AU10 fluorometer (Jespersen and Christoffersen, 1987; Graff and Rynearson, 2011). Triplicate 5 ml samples were preserved for flow cytometry with 0.5% glutaraldehyde (final concentration), frozen at -80°C, and later analyzed on a Guava flow cytometer (Millipore) to measure phytoplankton abundances. Three major phytoplankton groups, (Synechococcus spp., picoeukaryotes, and nanoeukaryotes) were distinguished based on plots of forward scatter vs. orange or red fluorescence. Apparent growth rates (k; day-1) were calculated using the equation:
where t is the incubation time (day-1) and P0 and Pt represent initial or final concentrations of chlorophyll or phytoplankton abundance in triplicate bottles.
Given the application of the two-point method with a low dilution level (20% WSW), microzooplankton grazing rates (g; day-1) were calculated with the equation:
where kd and k1 are the apparent growth in the 20% or 100% WSW treatments and x is the exact factor of dilution (Landry et al., 1984; Morison and Menden-Deuer, 2017). Accordingly, the instantaneous phytoplankton growth rate was calculated as μ = g + k1 (Landry et al., 2008). Values of μ represent k1 in bottles without nutrient additions to control for effects of nutrient limitation, though rates were also calculated using k1 from nutrient-amended bottles (μn; day-1). To assess phytoplankton nutrient limitation, paired t-tests (p < 0.05) were performed between μ and μn and ratios of μ/μn were calculated, with lower ratios indicative of stronger nutrient limitation (Landry et al., 1995; Kim et al., 2007). Net phytoplankton accumulation rate (r; day-1), which describes the relationship between μ and g, was inferred from the above equations and is equal to the value of k1.
For cases where no grazing was measured, which occurred when apparent growth was not significantly different between the two dilution levels (t-test, p < 0.05) or when the growth in the 100% WSW was higher (e.g., positive slope), grazing rates were recorded as zero (Strom and Fredrickson, 2008; Anderson et al., 2018; Menden-Deuer et al., 2018). Negative grazing rates were observed for Synechococcus spp. (49% of experiments), but not for total chlorophyll. Insignificant grazing rates that were set to zero were still included in all downstream statistical analyses. When grazing was zero, the accumulation rates were assumed to be equal to μ, unless viral-induced mortality rates (v; day-1) were measured and accounted for in accumulation. Rates from the virus-free treatment represented total mortality and viral-induced mortality rates were estimated as the difference between total mortality and microzooplankton grazing rates (Evans et al., 2003).
Differences in average phytoplankton rates (μ, g, r, and μ/μn) between seasons were examined for all phytoplankton groups using a one-way ANOVA with post hoc Bonferroni analysis (p < 0.05). Seasons corresponded to the astronomical Northern Hemisphere calendar year and began on the following days: winter = December 21; spring = March 20; summer = June 21; fall = September 23. To assess the relative importance of environmental and biological factors in predicting temporal growth and grazing rates, a partial least-squares (PLS) regression was applied using the R package pls (Mevik and Wehrens, 2007). Briefly, PLS is a dimensional analysis approach (similar to PCA) that determines the linear relationship between a set of predictor variables (x) and a single response variable (y), and in our case, was chosen to mitigate collinearity of the predictor variables (Godhe and McQuoid, 2003; Eriksson et al., 2006). Two separate models were run using the predictor variables and either chlorophyll-based growth or grazing rates. All variables were log-transformed prior to analysis and thereafter standardized by centering and scaling to unit variance (Eriksson et al., 2006). After initial validation, a 3-component model was used for grazing and growth as the response variable, which captured 50 and 59% of the variance in the predictor variables. Variable influence on the projection (VIP) was determined for each predictor variable, with VIP values >1 considered more important to the PLS model (Eriksson et al., 2006). Linear regression analyses (Model 1) were performed using GraphPad Prism 7 software to further quantify relationships between rates and specific predictors found to be important in respective PLS models.
Plankton Biomass and Community Composition
The relative abundance and biomass of the 20–200 μm plankton assemblage was measured via an automated FlowCam (Fluid Imaging Technologies, Scarborough, Maine). Samples were not taken on 3 days (March 16, May 16, and August 30), resulting in biomass data for 38 of 41 experiments. At T0 and T24, 100–200 ml samples of 100% WSW were collected, fixed in buffered formalin (final concentration 1%), and stored at 4°C (Poulton, 2016). Fixed samples were prefiltered through 200 μm mesh and analyzed (duplicate 10 ml runs) on Autoimage mode using a 300-μm flow cell and a flow rate of 2 ml min-1 (Poulton, 2016). Duplicate runs were pooled for each experiment, resulting in ∼27,000 images captured per sample on average. Based on previously curated library sets, diatoms and microzooplankton grazers were grouped to finest possible taxonomic resolution (often genus level). Group-specific counts were converted to abundance using the volume analyzed and the efficiency of particle capture (39.7%), which accounts for cells outside the flow cell (Poulton, 2016). Chain-forming diatoms were counted and sized as one cell.
Biovolume was estimated using cellular length and width measurements from the FlowCam, along with the closest geometric formula for diatom and microzooplankton groups (Hillebrand et al., 1999). Biovolume was converted to carbon biomass (μg C L-1) using conversion equations (Menden-Deuer and Lessard, 2000). Abundances of the <20 μm phytoplankton groups counted via flow cytometry (Synechococcus spp., pico-, and nanoeukaryotes) were also converted to carbon biomass using conservative literature conversion factors (see Anderson et al., 2018 and references therein).
To evaluate shifts in community composition over the year, the multivariate statistics package PRIMER Version 7 (Clarke and Gorley, 2015) was used. Initially, carbon biomass from FlowCam (genus level diatoms and microzooplankton) and flow cytometry groups were log-transformed to reduce bias of highly abundant taxa; total chlorophyll concentration was also included. A Bray–Curtis similarity matrix was generated using transformed biomass and non-metric multidimensional scaling (NMDS) was performed to visualize the relationship between plankton communities on different days throughout the year. To capture week-to-week variability, samples were classified by date, though seasonal shifts in composition were examined using the above-mentioned seasonal delineations (see section “Estimation of Phytoplankton Growth and Mortality”). Significant differences in total composition between seasons was tested using analysis of similarity (ANOSIM), which computes a global R statistic (range from 1 to -1), with values of R that approach 1 indicative of high similarity within and dissimilarity between seasons (Clarke and Warwick, 2001). Similarity of percentages (SIMPER) was also performed to examine how much (percentage) each plankton group contributed to the average sample similarity or dissimilarity between seasons (Clarke and Warwick, 2001).
Results
Environmental Conditions in the Estuary
Annual variability was observed in surface temperature (6.15–31.23°C), salinity (22.68–31.14), and solar radiation (0.86–22.34 MJ m-2), all reaching highest values in late spring and summer (Figure 1A and Supplementary Table 1). Concentrations of dissolved NO3 (0.01–1.77 μM) and SiO4 (18.38–139.24 μM) were highest in the summer, while NH4 (0–4.99 μM) peaked in fall-winter and PO4 (0.36–0.82 μM) remained stable over the year (Figure 1B and Supplementary Table 2). Measurements of N:P ratio (1.18–10.77; often < 5), dissolved oxygen (4.2–21.67 mg L-1), POC (32.21–154.27 μM C L-1), and PON (5.93–21.08 μM N L-1) fluctuated on weekly scales over the year and did not exhibit seasonal signals (Supplementary Tables 1, 2). Total chlorophyll a concentration (<200 μm) exhibited a narrow range over the year (1.32–6.39 μg L-1), though weekly variability in chlorophyll was stronger in spring-summer compared to fall-winter (Figure 1C and Supplementary Table 1).
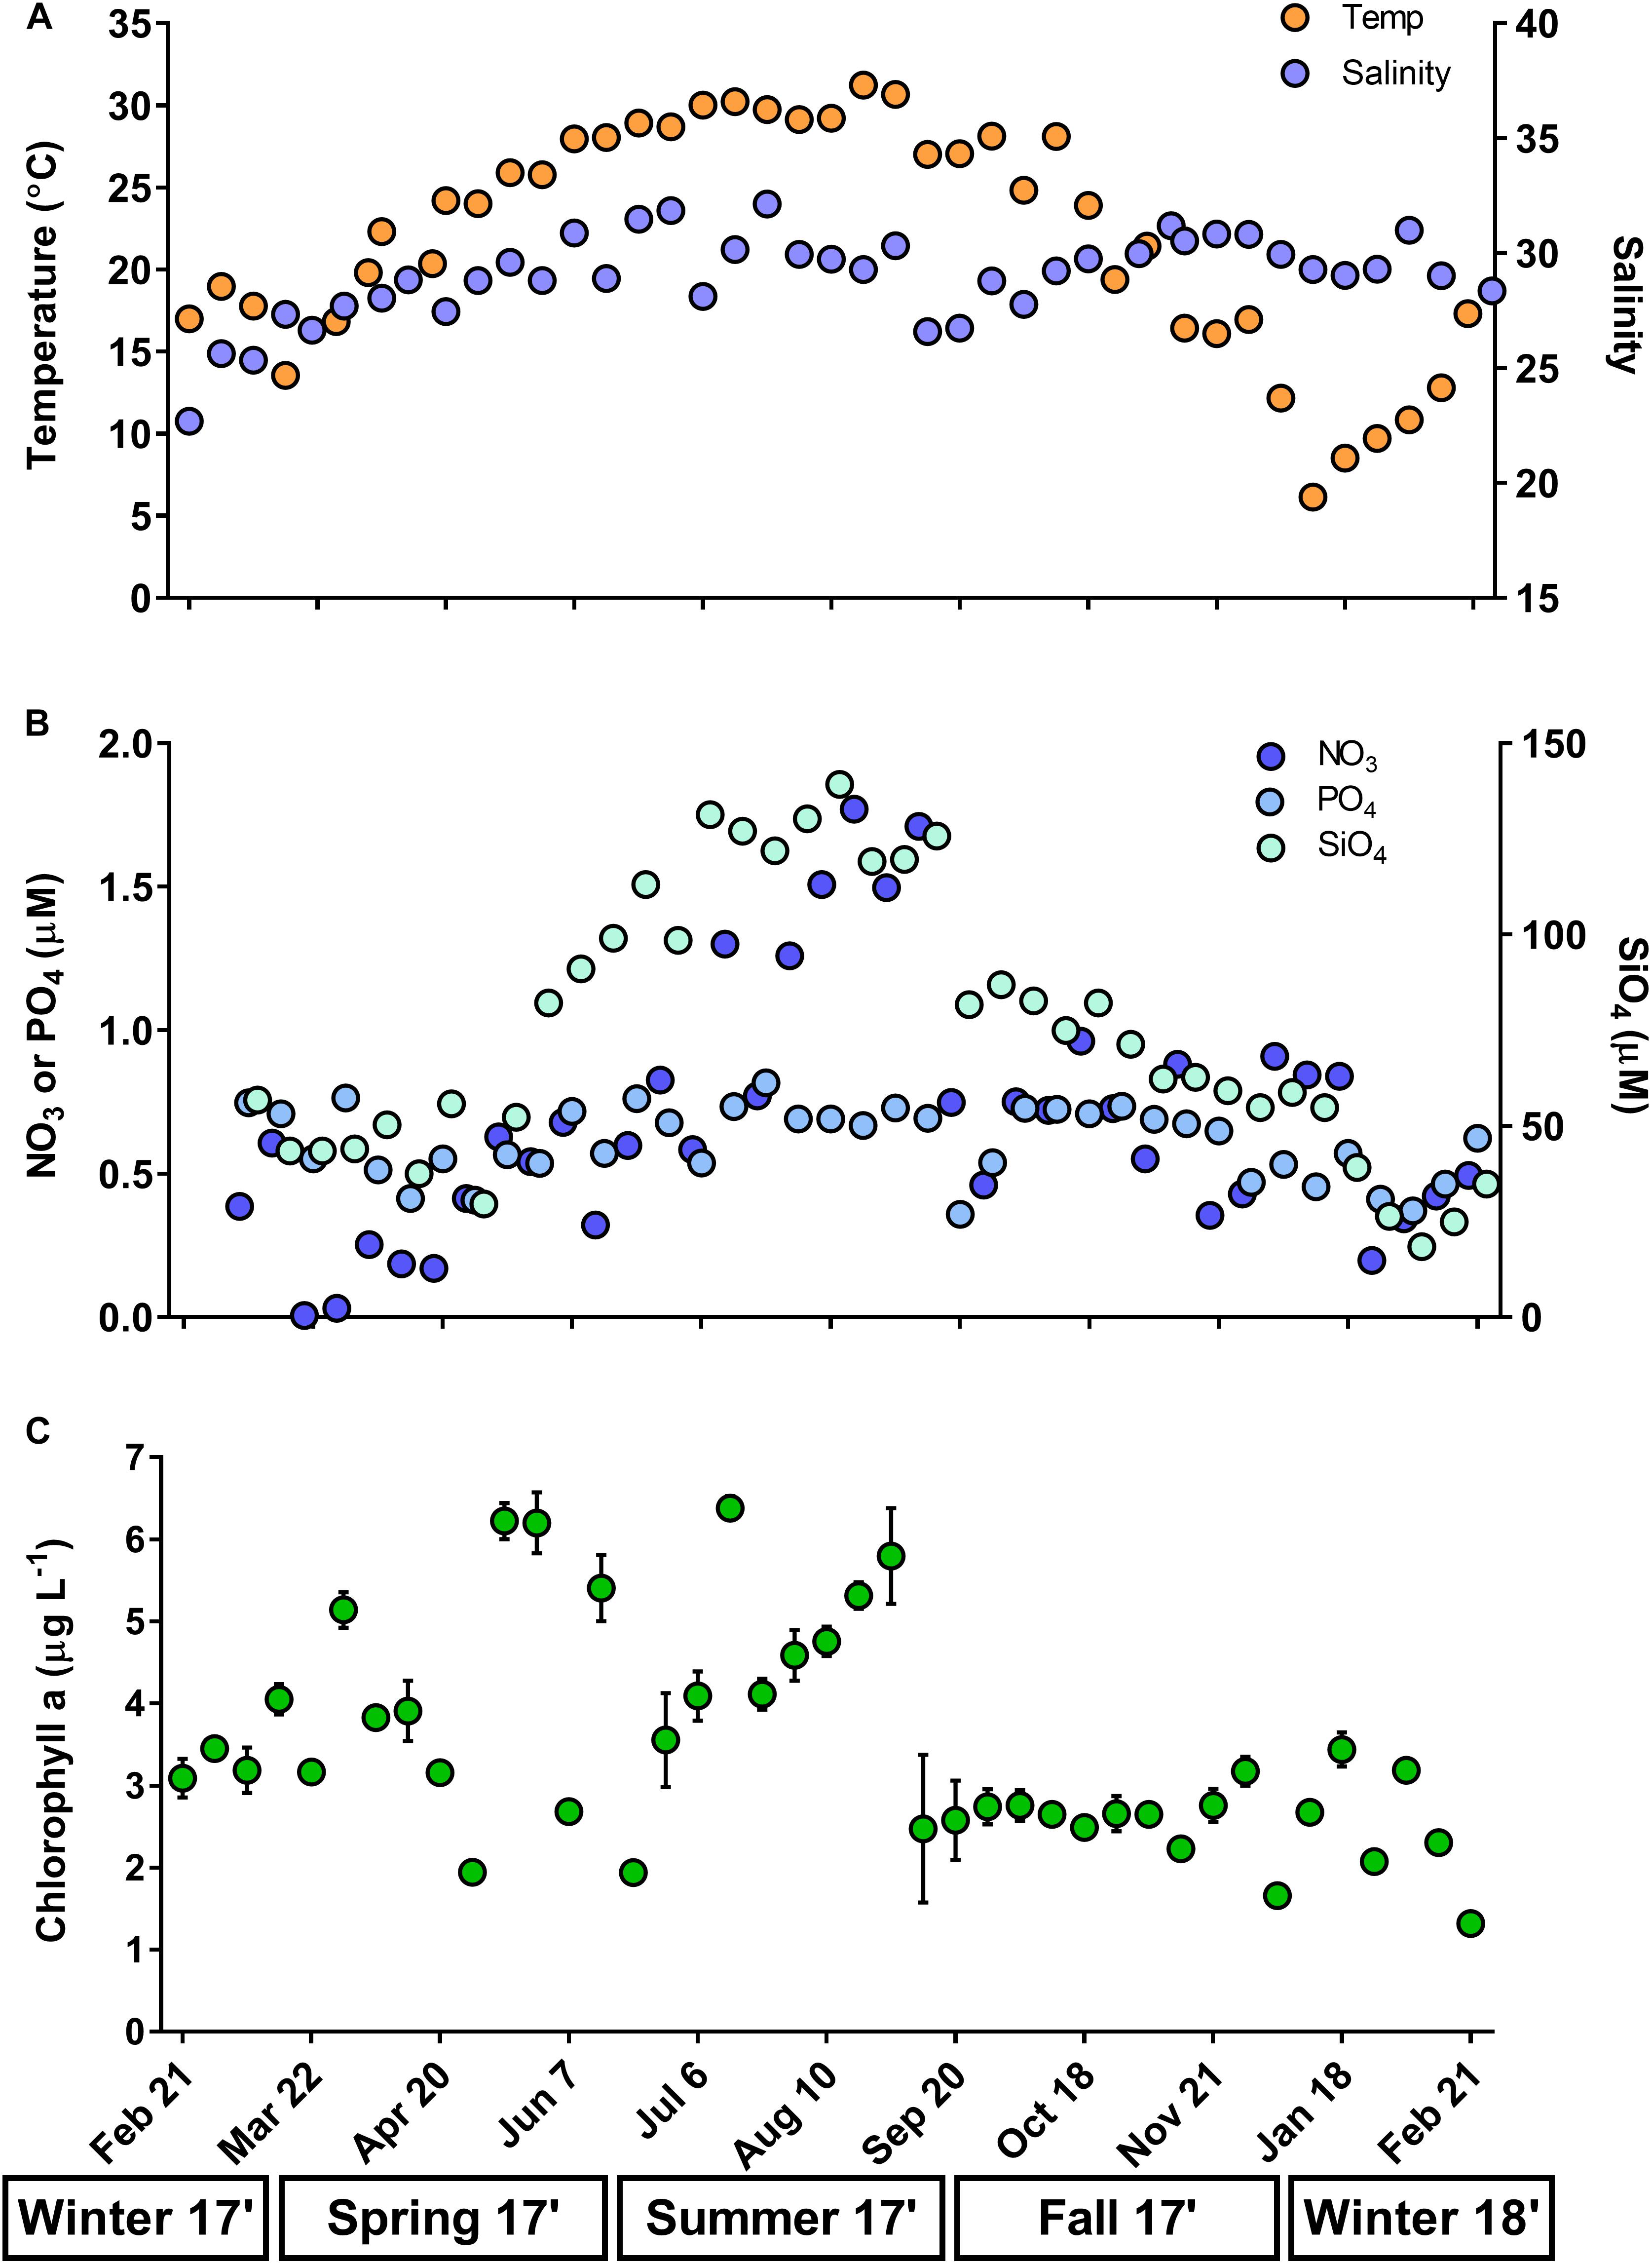
Figure 1. Surface water temperature and salinity (A), dissolved inorganic nutrients (μM; nitrate, NO3; phosphate, PO4; silicate, SiO4; B), and chlorophyll a (μg L-1; C) at time zero (T0) of each weekly experiment. Error associated with chlorophyll represent ± 1 standard deviation of the triplicate sample mean. Temperature, salinity, and nutrients represent single replicates. Seasons are below x-axis.
Phytoplankton and Microzooplankton Biomass and Composition
Biomass estimates for phytoplankton and microzooplankton varied over an annual cycle in the estuary (Figure 2A). Total biomass in winter-spring was often <400 μg C L-1, while biomass in late summer-fall was marked by high weekly variability and reached a maximum of ∼1700 μg C L-1 (Figure 2A). Biomass of combined <20 μm phytoplankton was stable over the year, ranging from 17.99 to 126.02 μg C L-1, whereas diatom biomass greatly varied (5.04–697.25 μg C L-1) and the presence of chain-forming taxa (e.g., Chaetoceros and Skeletonema) accounted for a high proportion of total biomass on days in late summer-fall (Figures 2A,B). Commonly observed microzooplankton included the mixotrophic dinoflagellate Akashiwo sanguinea (1.26–579.76 μg C L-1) and heterotrophic dinoflagellates (0–431.2 μg C L-1), both of which contributed most to total biomass on days in spring and fall (Figure 2A). Commonly identified diatoms included other chain-forming groups like Thalassiosira and Guinardia, as well as solitary groups such as Coscinodiscus, Ditylum, Nitzschia, and unidentified benthic diatoms. Heterotrophic dinoflagellates were represented by Gyrodinium and Gymnodinium-like cells and Protoperidinium; identified ciliates consisted of aloricated and loricated types.
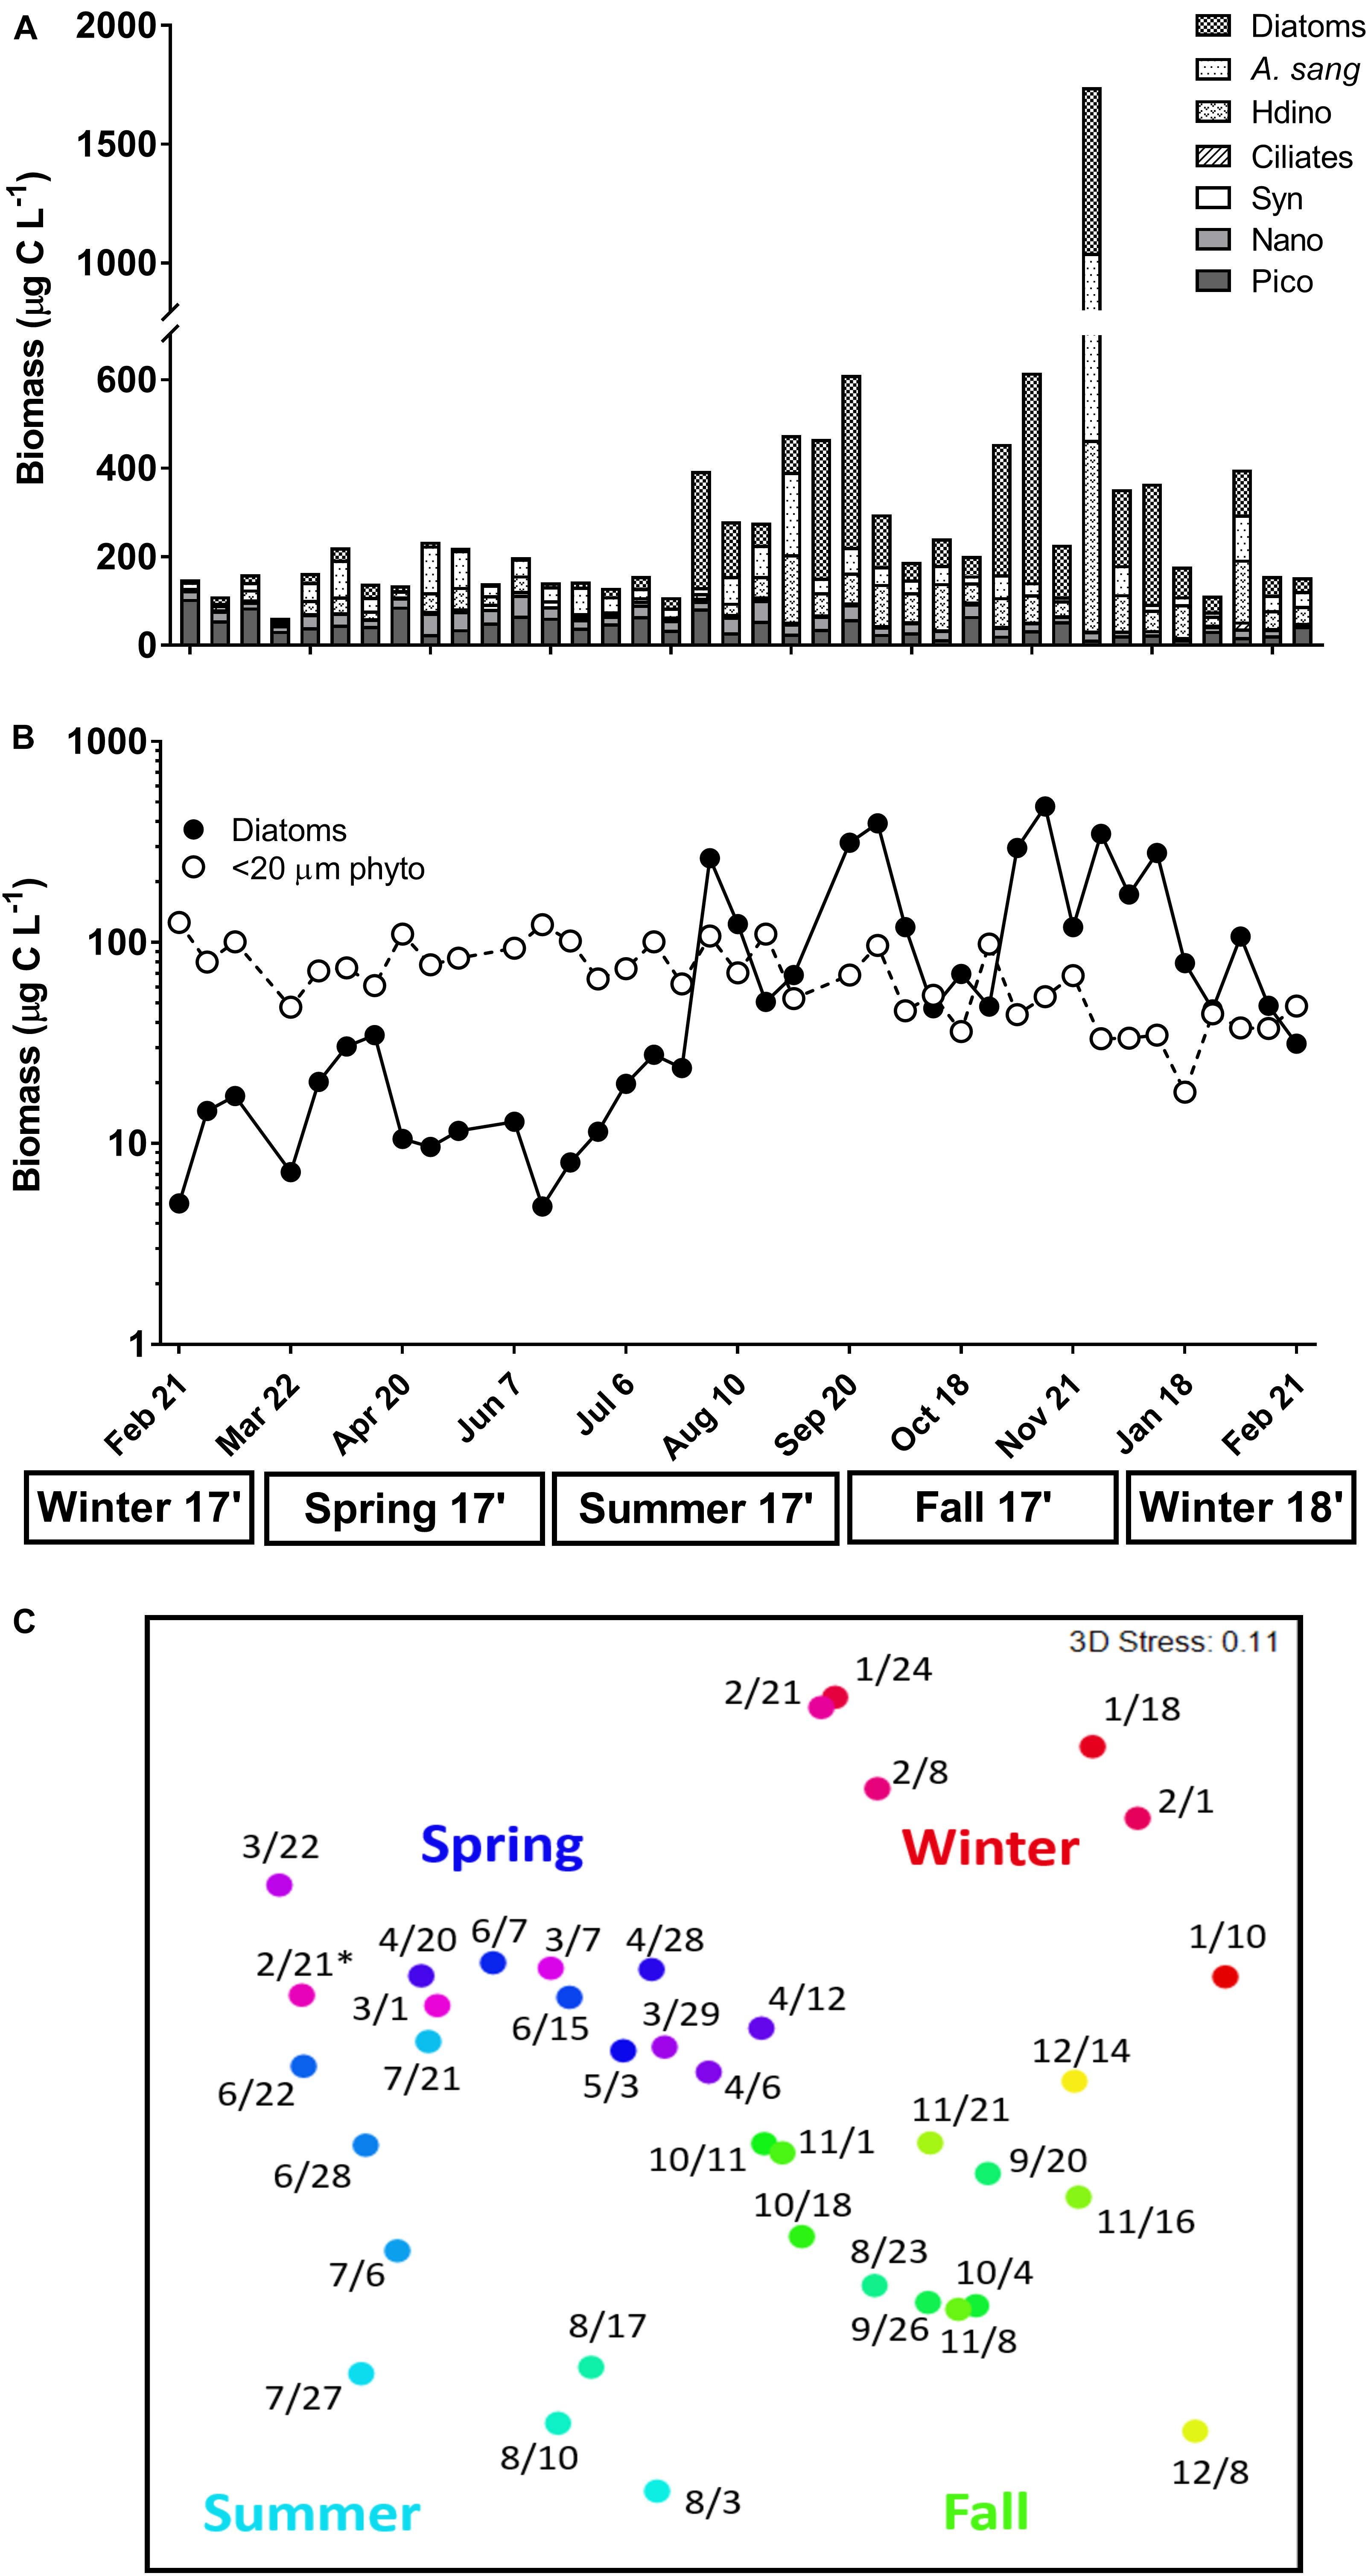
Figure 2. (A) Carbon biomass (μg C L-1) of plankton groups measured via FlowCam [diatoms; Akashiwo sanguinea (A. sang); heterotrophic dinoflagellates (Hdino); ciliates] and flow cytometry [Synechococcus spp. (Syn); Nanoeukaryotes (Nano); Picoeukaryotes (Pico)] at the start of each weekly experiment. (B) Log-transformed biomass of <20 μm combined phytoplankton (Syn, Nano, Pico; open symbols) versus diatoms (closed symbols). (C) Non-multidimensional scaling (NMDS) of total plankton composition on each sampling day (month/day) using log-transformed carbon biomass from (A). A color gradient based on day of year (red = winter; purple = spring; blue = summer; green = fall) was applied to observe weekly and seasonal differences in composition. Asterisk above 2/21 indicates first sampling day in 2017. Seasons are listed below the x-axis.
Seasonal shifts in plankton composition were revealed via NMDS analysis of biomass estimates (Figure 2C). Significant differences in community composition were identified between all seasons (ANOSIM R = 0.48, p < 0.01, Supplementary Table 3). However, fall-winter and spring-fall communities were most different from each other (R = 0.64, 0.61, p < 0.01, Supplementary Table 3), with most dissimilarity due to changes in Chaetoceros biomass between seasons (SIMPER 29.66 and 33.47%, Supplementary Table 4). Seasonal shifts in composition were less pronounced between winter–spring and spring–summer, likely due to the importance of smaller scale (e.g., weekly) variability in composition during these transitions (Figure 2C and Supplementary Table 3). Changes in A. sanguinea biomass contributed most to the differences in composition between winter–spring (20.09%) and spring–summer (21.75%, Supplementary Table 4).
Phytoplankton Rate Estimates
Similar annual trends were observed for phytoplankton growth and microzooplankton grazing rates based on bulk chlorophyll (μ = -0.3–1.61 day-1; g = 0–2.11 day-1, Figure 3A), picoeukaryotes (μ = -0.01–2.43 day-1; g = 0–1.72 day-1, Figure 3B), and nanoeukaryotes (μ = -0.3–2.18 day-1; g = 0–1.72 day-1, Figure 3C). Grazing rates were significantly higher than zero for total chlorophyll in 66% of experiments (Supplementary Table 5), while significant rates were measured in 61 and 32% of experiments for pico- and nanoeukaryotes, respectively (Supplementary Tables 6, 7). Grazing rates on chlorophyll and picoeukaryotes were similar in spring (0.64 and 0.59 day-1) and summer (∼0.69 day-1; ANOVA, p > 0.05), though grazing rates in summer were significantly higher than fall (0.08 and 0.18 day-1) or winter (0.37 and 0.23 day-1; ANOVA, p < 0.01, Figures 3A,B). Grazing rates on nanoeukaryotes were significantly different between winter (0.07 day-1) and spring (0.4 day-1; ANOVA, p = 0.01, Figure 3C). Phytoplankton growth rates for all groups were significantly higher in summer (1.22–1.78 day-1) relative to any other season (ANOVA, p < 0.002, Figures 3A–C). Viral-induced mortality rates were observed twice over the year for chlorophyll (0.17 and 0.52 day-1, Supplementary Table 5), in three experiments for picoeukaryotes (0.28–0.52 day-1, Supplementary Table 6), and in four experiments for nanoeukaryotes (0.13–0.96 day-1, Supplementary Table 7). Unlike other phytoplankton groups, grazing rates on Synechococcus spp. were rarely significant (12%), and growth rates were mostly negative through the year (Supplementary Figure 1 and Supplementary Table 8). Viral lysis rates of Synechococcus spp. were detected in four experiments (0.29–0.57 day-1, Supplementary Table 8).
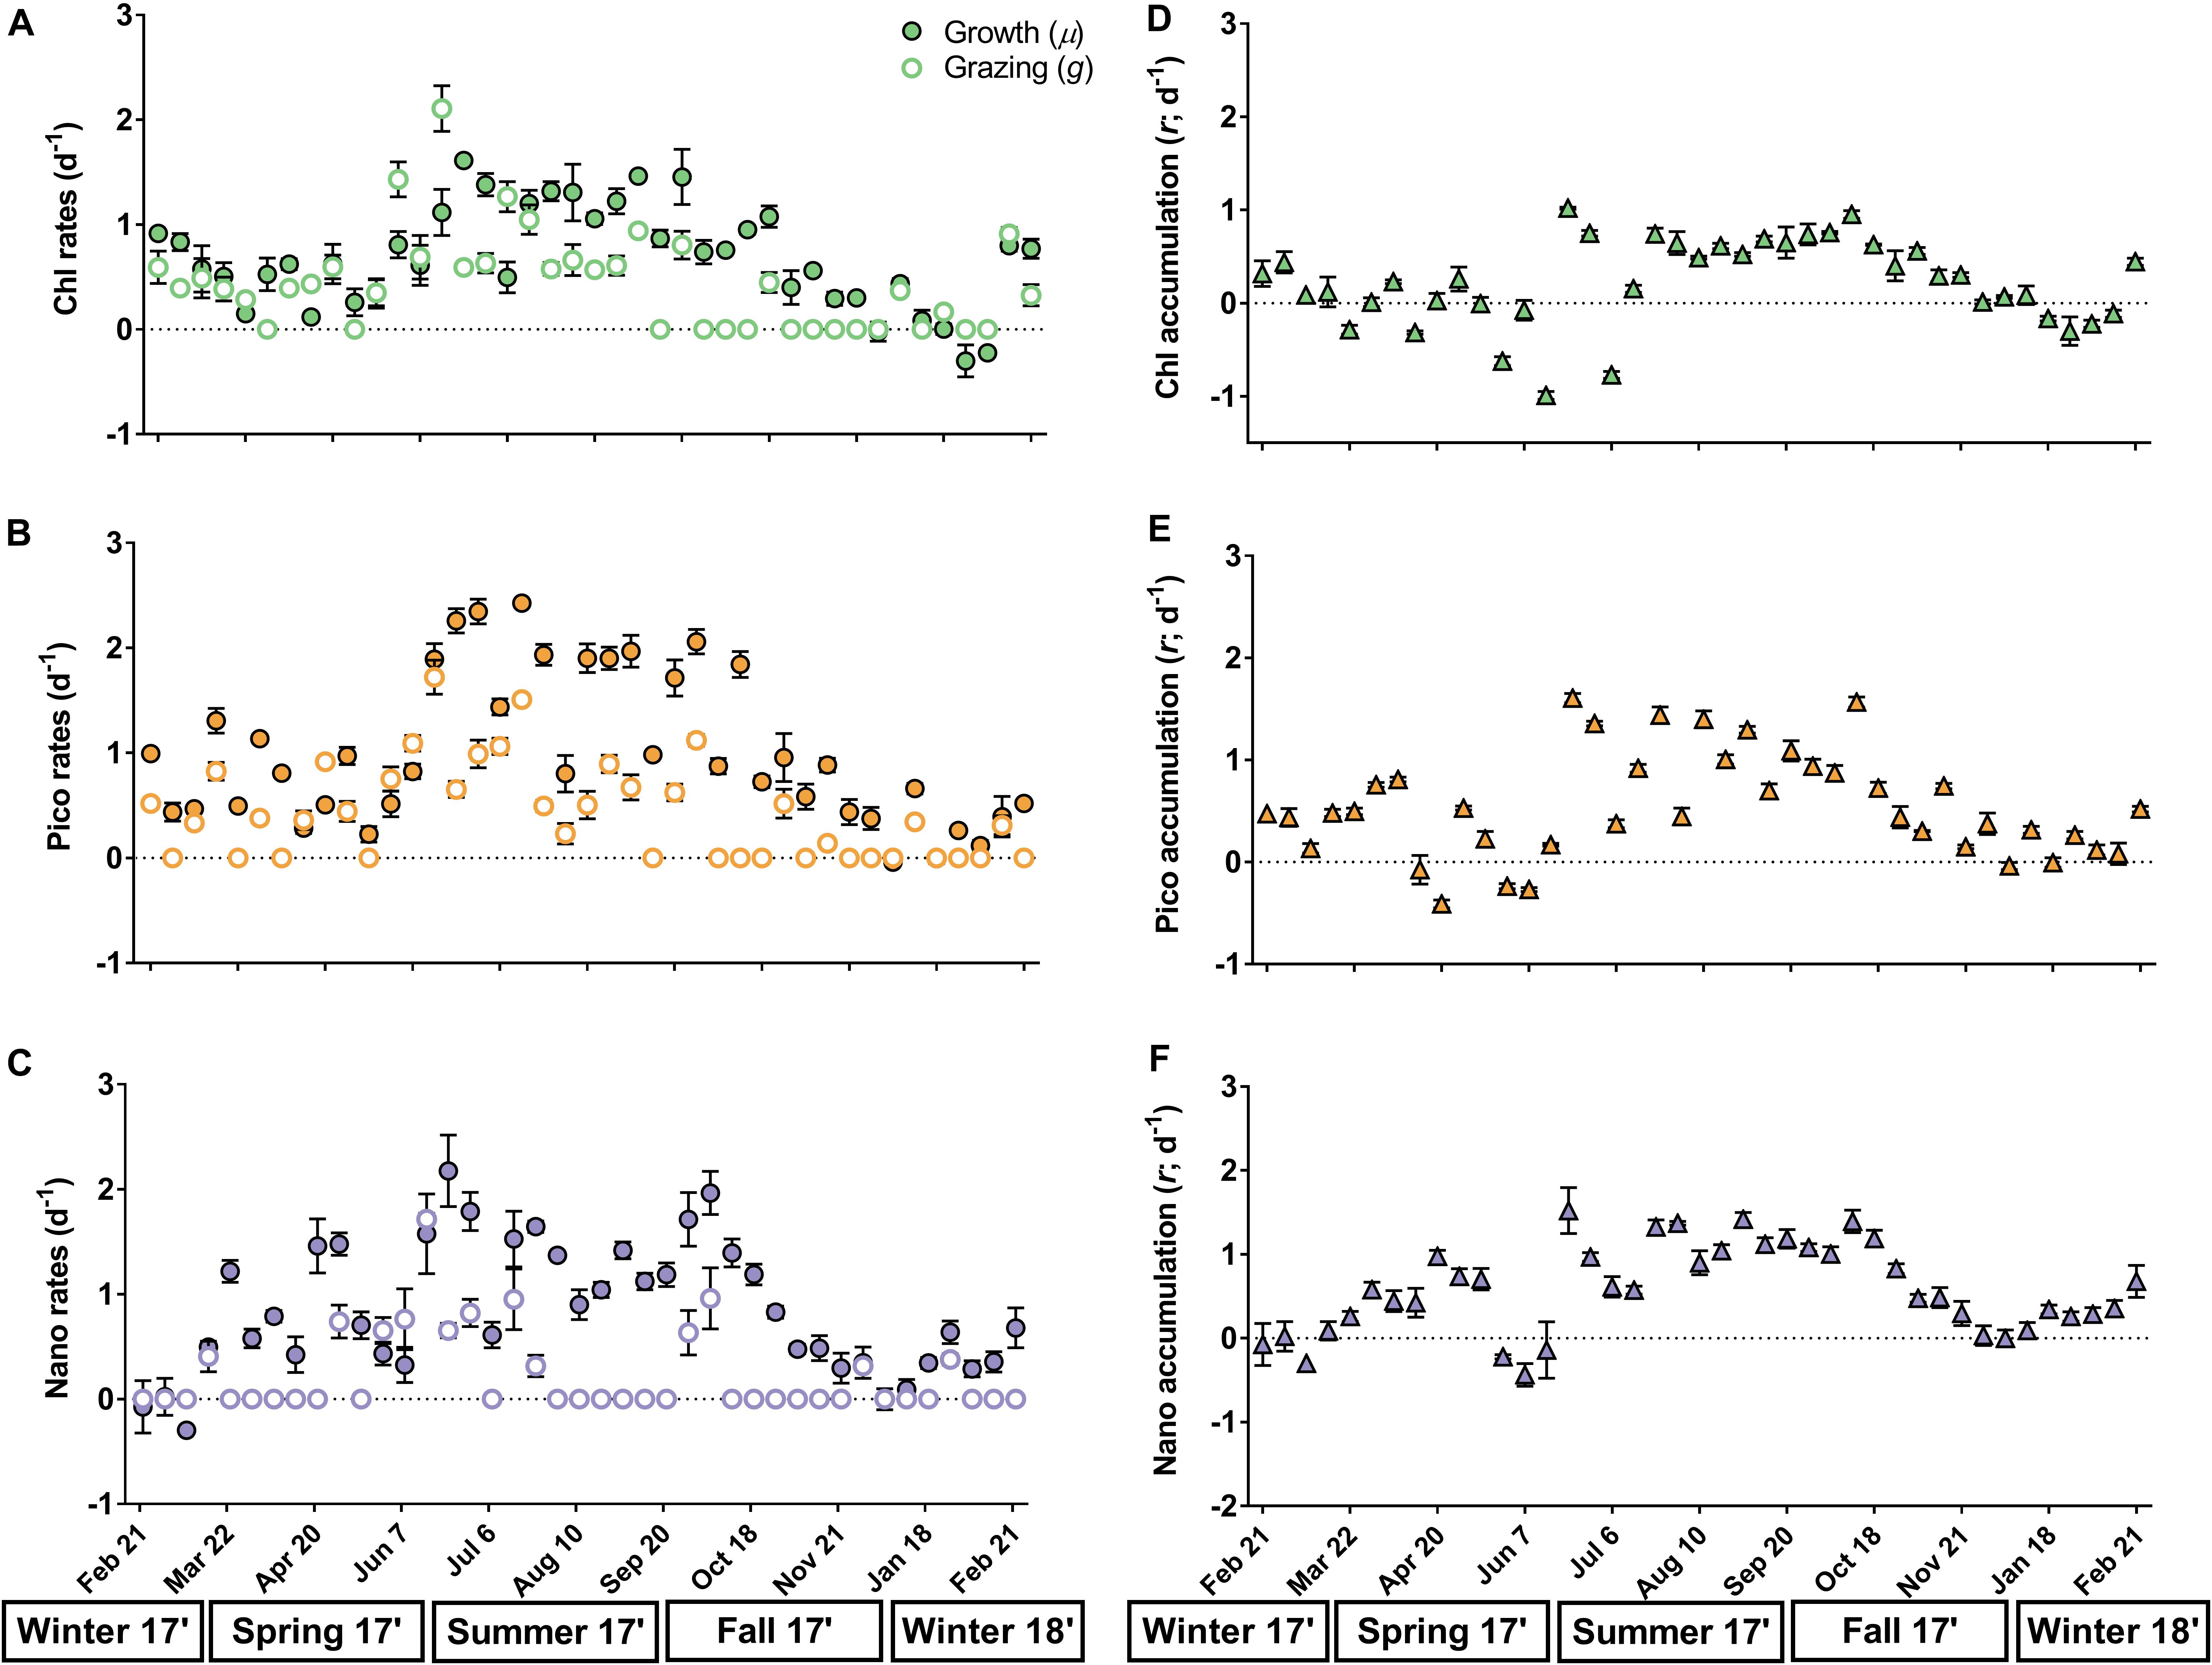
Figure 3. Rates (day-1) of instantaneous phytoplankton growth (μ; open circles), microzooplankton grazing (g; closed circles), and net accumulation (r; closed triangles) measured each week based on total chlorophyll (A,D; green), picoeukaryotes (B,E; orange), and nanoeukaryotes (C,F; purple). Seasons are shown below the x-axis. Error bars represent one standard deviation of the mean and small error is contained within symbols. Grazing rates equal to zero (dotted line) were not significant from zero (p < 0.05).
Phytoplankton accumulation rates (μ-g) ranged from -0.99 to 1.61 day-1 and exhibited remarkable similarity over an annual cycle for chlorophyll, picoeukaryotes, and nanoeukaryotes (Figures 3D–F and Supplementary Tables 5–7). For all phytoplankton groups, net accumulation was significantly higher in summer–fall (0.48–1.09 day-1) compared to winter-spring (-0.16–0.28 day-1; ANOVA, p < 0.003), with negative accumulation common in the spring (Figures 3D–F). Phytoplankton growth rates in nutrient-amended treatments (μn) were significantly higher than in non-amended treatments (μ) in 68% of experiments for chlorophyll and in 41 and 32% for pico- and nanoeukaryotes, respectively (t-test, p < 0.05, Supplementary Tables 5–7). Growth ratios (μ/μn) had a similar annual range across all phytoplankton groups (-0.47–1.45; Figure 4), except for three unusually negative or positive ratios (e.g., -31.55) that occurred at random in pico- and nanoeukaryotes. Due to strong weekly variability in spring and winter there were no significant differences in μ/μn among seasons for any phytoplankton group (ANOVA, p > 0.05, Figure 4). However, μ/μn frequently approached a 1:1 ratio in summer–fall, whereas ratios decreased in winter–spring (Figure 4).
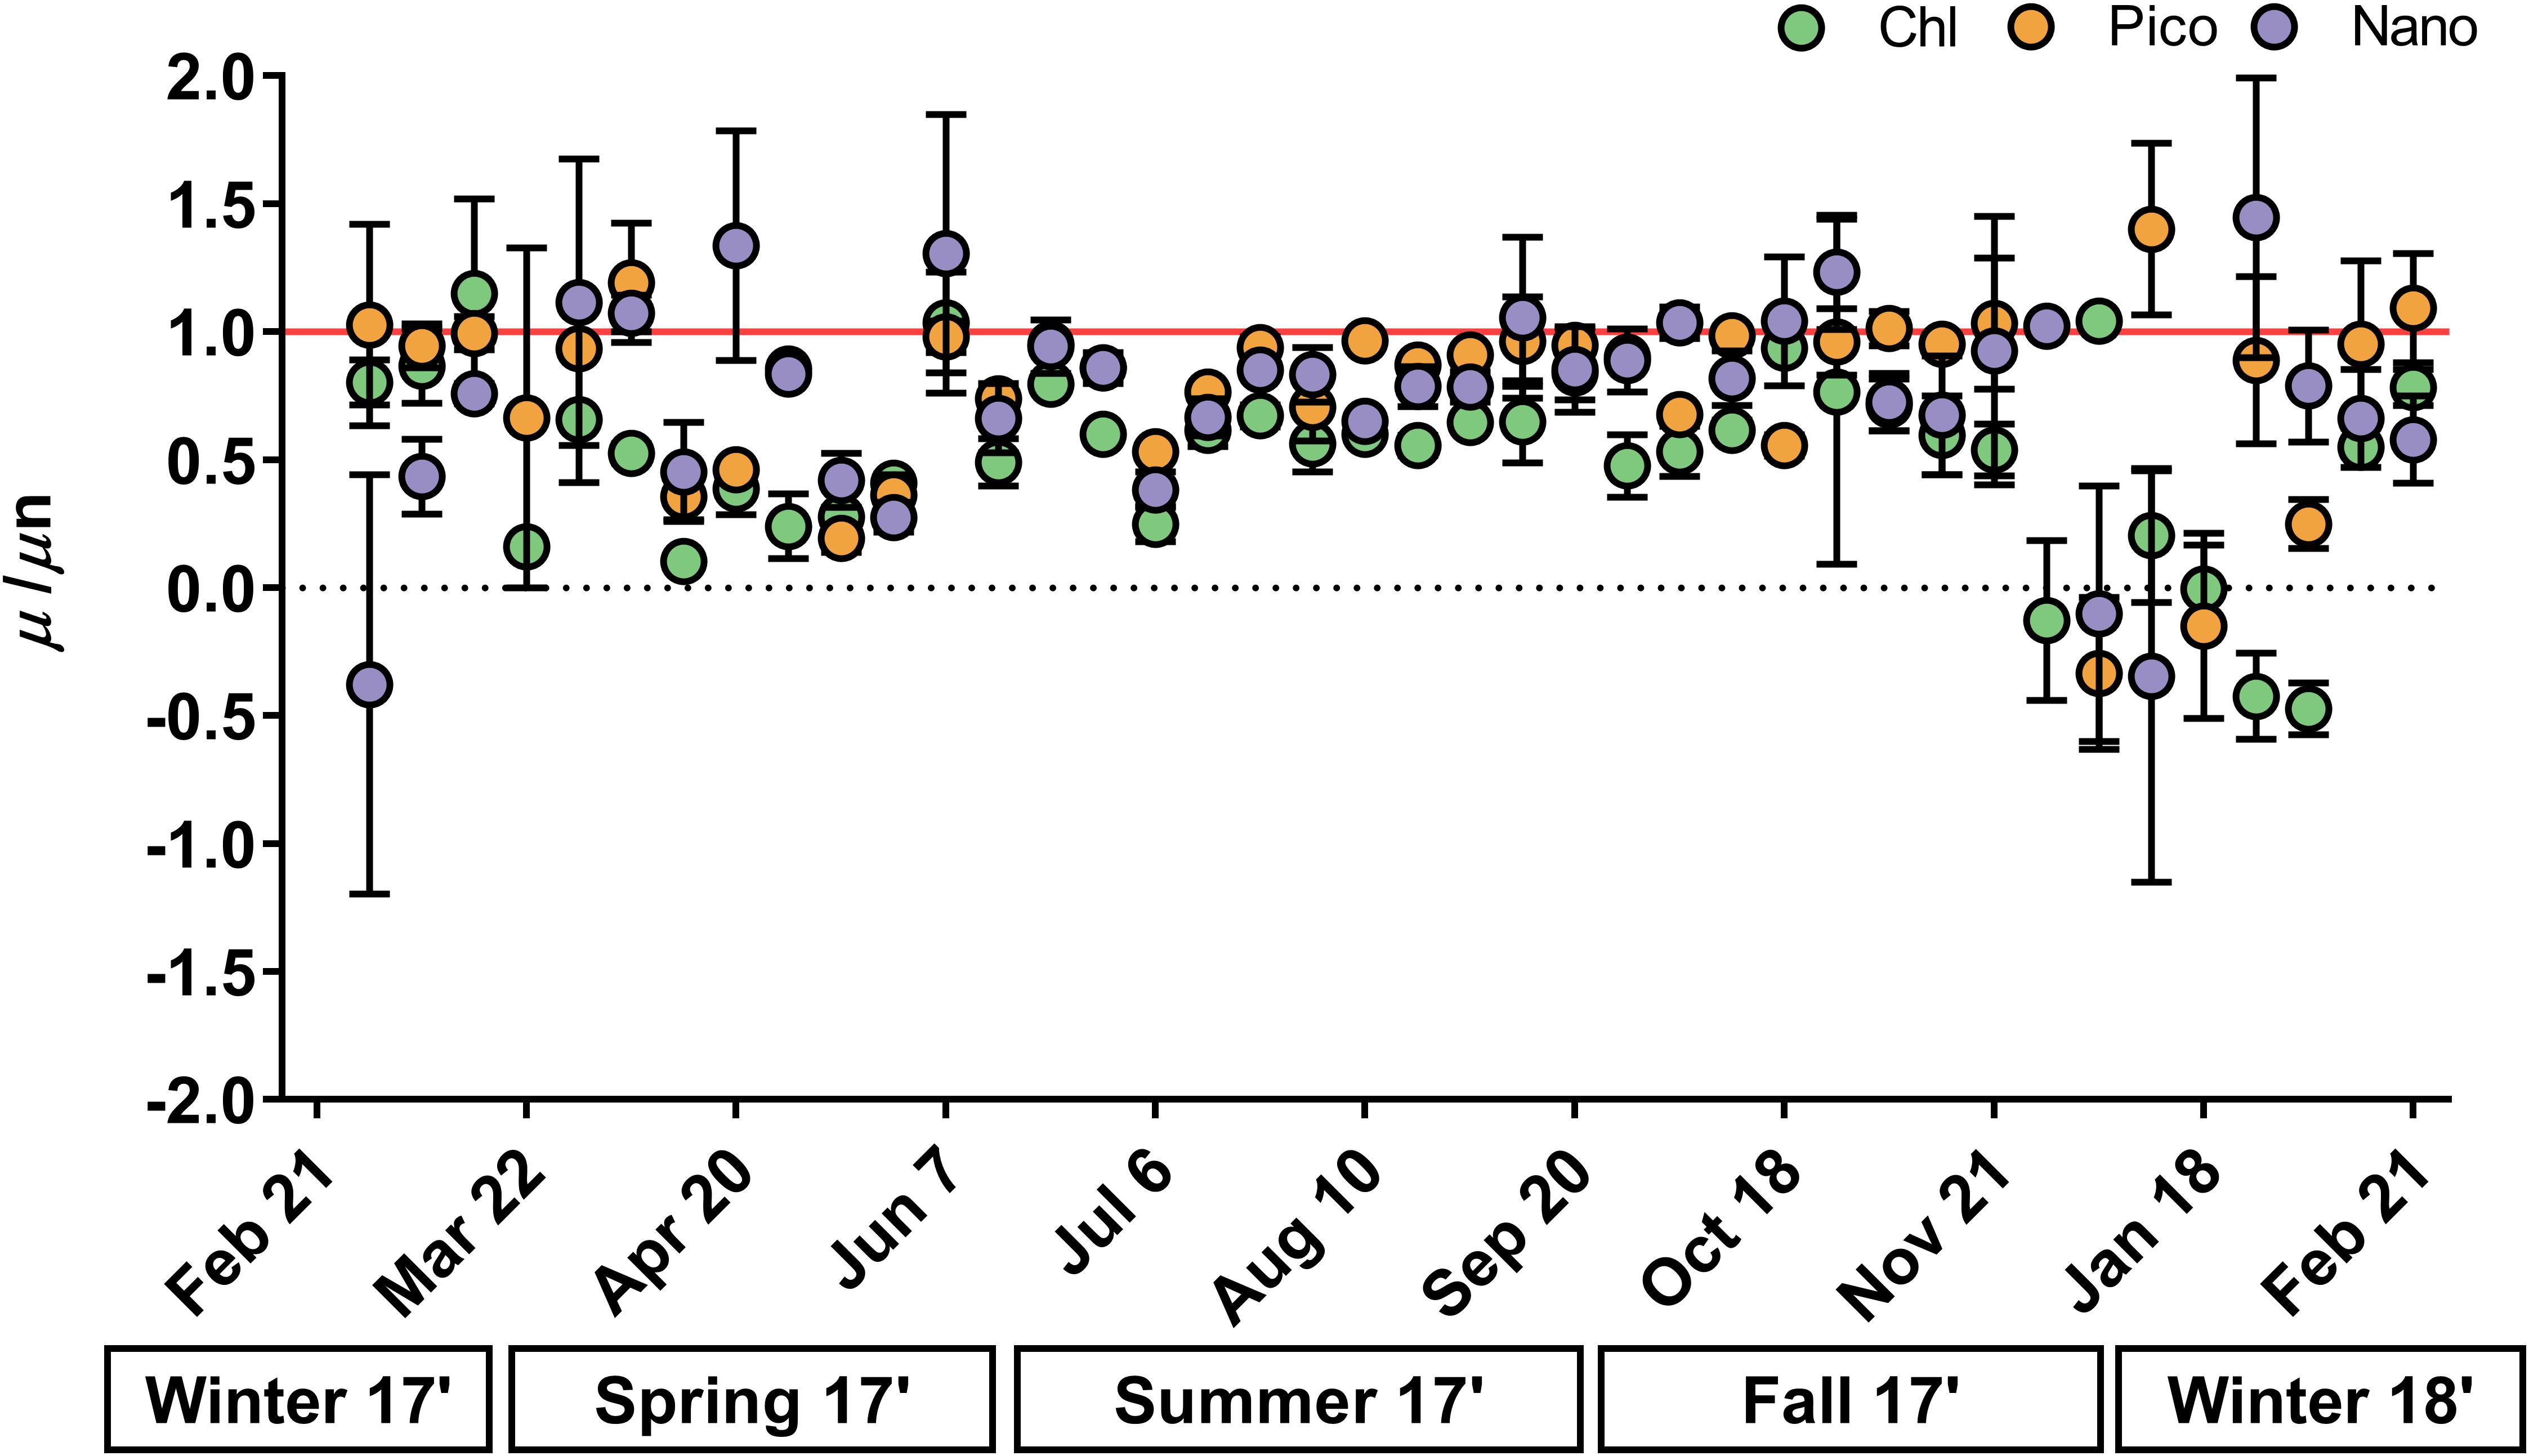
Figure 4. Ratio of instantaneous phytoplankton growth versus nutrient-amended growth rates (μ/μn) measured each week for chlorophyll (green), picoeukaryotes (orange), and nanoeukaryotes (purple). Seasons are below x-axis. Red line indicates 1:1 growth ratio, with smaller values indicating enhanced phytoplankton nutrient limitation. Error bars represent one standard deviation of the mean. Ratios >2 or –2 were measured once for picoeukaryotes (12/18) and twice for nanoeukaryotes (1/18, 3/22) and were excluded (see Supplementary Tables 4, 5).
Environmental and Biological Drivers of Rates
Partial least-squares regression was used to reveal potential drivers of rates. Among all predictor variables tested, surface water temperature (VIP = 1.75) and dissolved nutrients (VIP = 1.01–1.79) were most important in explaining chlorophyll-based growth rates and were positively correlated to growth (Supplementary Table 9). A significant linear relationship was observed between temperature and growth rates for all phytoplankton groups (R2 = 0.46–0.56, p < 0.001, Figure 5A and Supplementary Table 10), which confirmed PLS model predictions. Single linear relationships between dissolved nutrients and growth rates spanned a wide range of variation and were typically weaker compared to temperature (R2 = 0.04–0.56, p < 0.05, Supplementary Table 10). PLS analysis with grazing rates were also well-explained by temperature (VIP = 1.2), though additional predictor variables were important such as dissolved nutrients (SiO4, PO4, NH4,VIP = 1.01–1.43), solar radiation (VIP = 1.3) and POC (VIP = 1.12, Supplementary Table 9). Unlike growth rates, temperature was not linearly related to microzooplankton grazing rates across phytoplankton groups (R2 = 0.11–0.27, p < 0.05, Figure 5B). Additional predictor variables exhibited poor and often insignificant (p > 0.05) linear relationships with microzooplankton grazing rates (R2 = 0.01–0.27, Supplementary Table 11), likely related to estimates of zero grazing in late summer–fall.
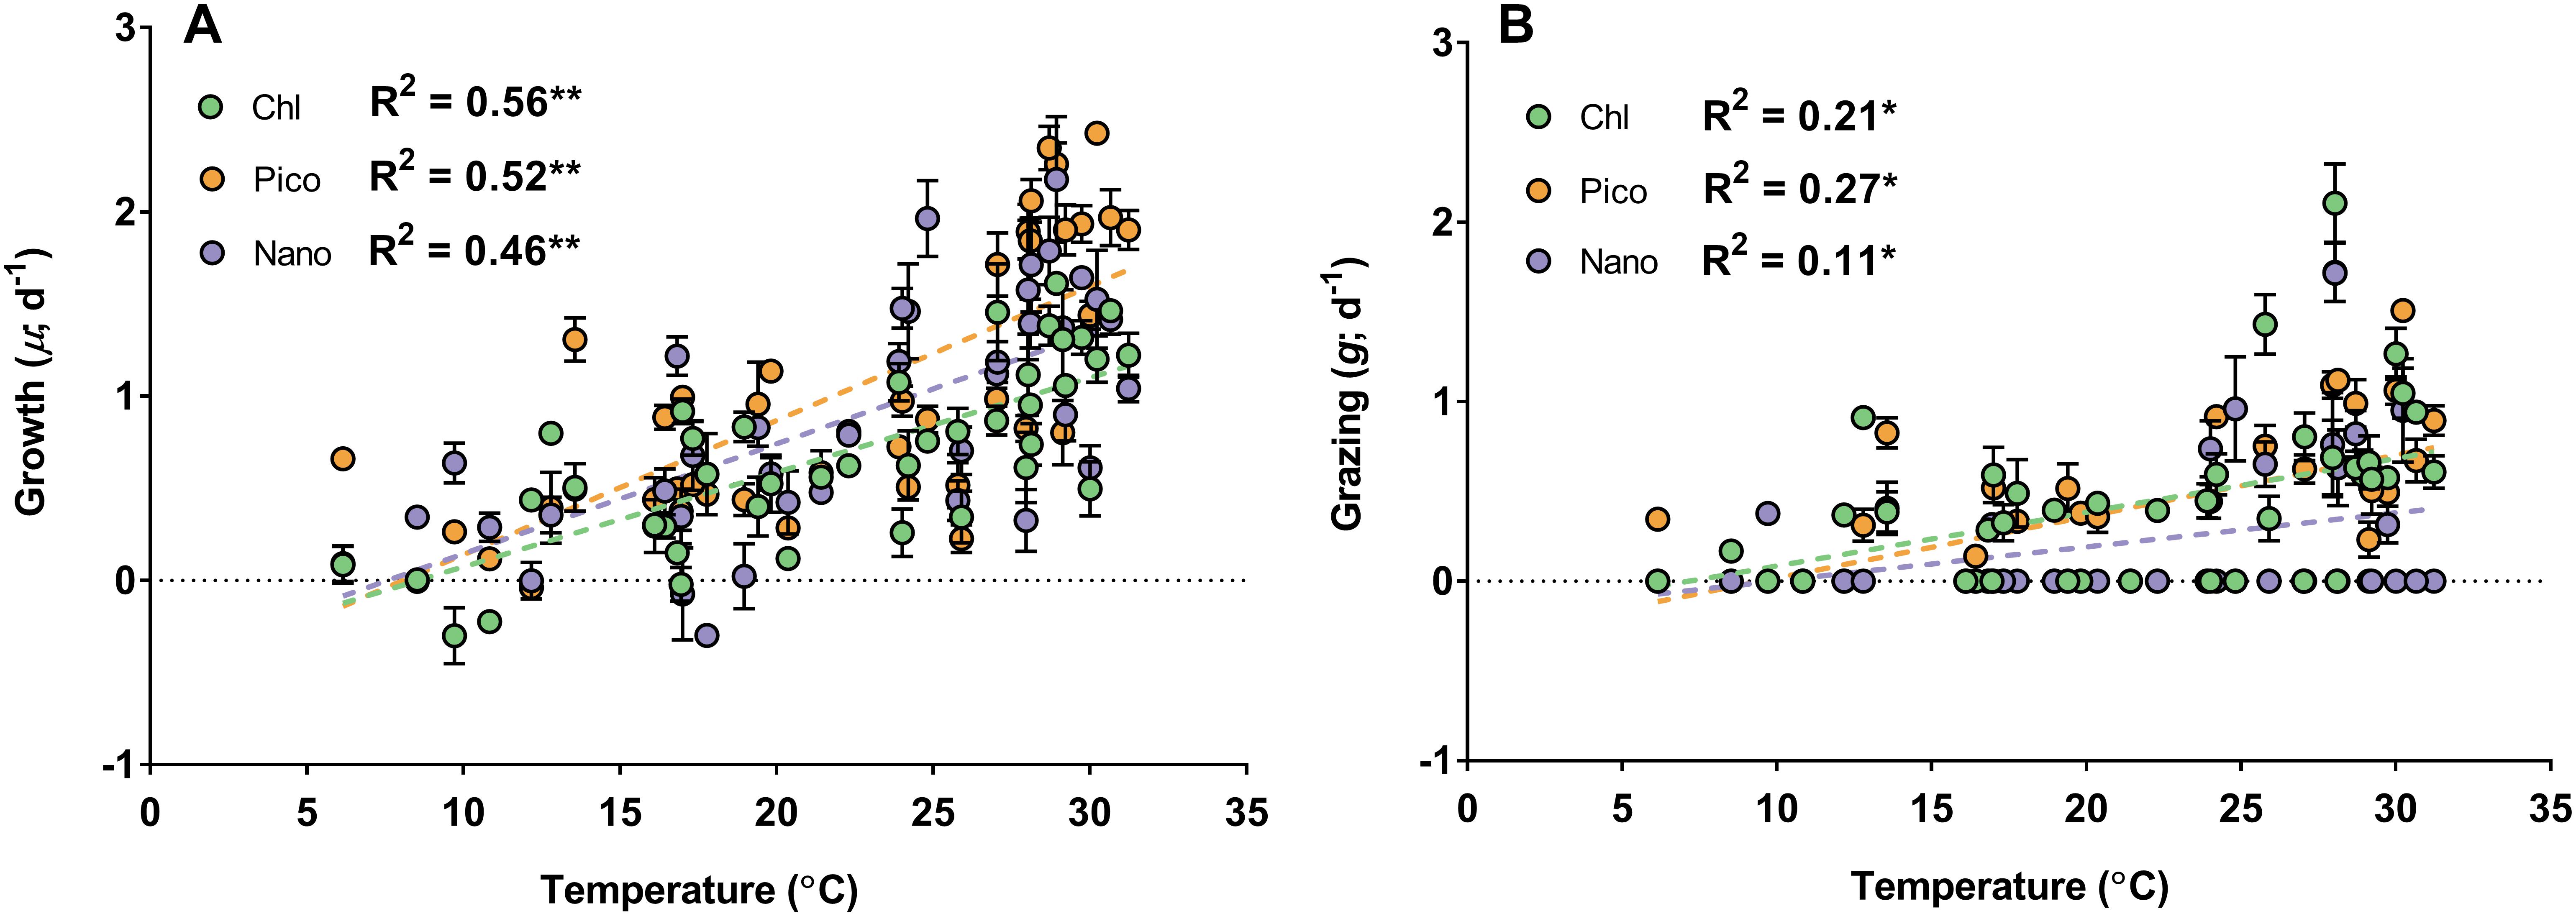
Figure 5. Model 1 linear regressions (dotted lines) of phytoplankton growth (A) and microzooplankton grazing (B) vs. surface water temperature (°C) for chlorophyll (green), picoeukaryotes (orange), and nanoeukaryotes (purple). Values of coefficient of determination (R2) indicate strength of linear relationship; regressions were significant for growth and grazing across all phytoplankton groups (∗p < 0.05 and ∗∗p < 0.001).
Discussion
Microzooplankton are ecologically important in marine food webs, as their grazing activity can elicit shifts in phytoplankton populations (e.g., biomass and diversity) and influence trophic transfer and carbon cycling (Schmoker et al., 2013; Steinberg and Landry, 2017). Few studies have considered changes in grazing rates over time at a fixed location (Schmoker et al., 2013), despite such resolution being relevant in coastal regions which often experience temporal variability in environmental factors (e.g., temperature and nutrients) and phytoplankton populations (Cloern and Jassby, 2010; Blauw et al., 2012; Anderson et al., 2018). Moreover, recurrent estimates of grazing over a range of biochemical conditions may offer valuable insight into mechanisms that control microzooplankton grazing in natural communities (Strom et al., 2007; Chen et al., 2012). Assessing temporal grazing rates will not only help to predict shifts in phytoplankton (and microzooplankton) populations but will also elucidate possible environmental or biological drivers of rates that may benefit population modeling under future climate scenarios (Caron and Hutchins, 2013).
Seasonal Variability in Rates
Phytoplankton growth and microzooplankton grazing rates varied seasonally in the estuary and were highest in the summer, which is consistent with seasonal trends found in temperate and high latitude waters (Kim et al., 2007; Calbet et al., 2008; Gutiérrez-Rodríguez et al., 2011; Lawrence and Menden-Deuer, 2012). The magnitude of grazing rates presented here (0–2.11 day-1) are similar to previous estimates from the region (southeast United States; Murrell et al., 2002; Wetz et al., 2006; Sitta et al., 2018) and support the role of microzooplankton as important consumers in subtropical systems. Seasonal differences were also observed in the ratio of growth to grazing, resulting in either negative or positive accumulation of plankton biomass. For instance, microzooplankton grazing exerted more control on winter–spring primary production, as evidenced by low (and often negative) accumulation rates (i.e., g ≥μ). Increased grazing pressure during this time may have been facilitated by poor phytoplankton growth conditions, as temperatures were low and phytoplankton groups were often nutrient-limited (μn > μ; Landry et al., 1995; Chen et al., 2009). Phytoplankton communities were likely limited by NO3, as other nutrients (PO4 and SiO4) were either stable over the year or in high enough concentrations to support growth (Verity and Borkman, 2010; Bittar et al., 2016). Furthermore, cases of nitrogen limitation are common in the Skidaway River Estuary (Verity, 2002a) and many other southeastern United States estuaries (Howarth and Marino, 2006; Sitta et al., 2018), which supports the nitrate-limiting system we observed. During the summer, environmental conditions improved (e.g., increased temperature, sunlight, and nutrients), which likely contributed to estimates of positive accumulation rates. Seasonal differences in growth and grazing rates observed in our study emphasize the importance of temporal rate dynamics in predicting plankton biomass accumulation, trophic transfer, and carbon cycling in coastal estuaries.
Despite differences in overall magnitude, trends in phytoplankton rates were remarkably similar between those estimated via bulk chlorophyll concentration and those estimated from abundances of pico- and nanoeukaryotes. The exception was grazing on nanoeukaryotes, which was often zero throughout the year (68%), though annual trends in accumulation mirrored other groups. Interestingly, group-specific growth of and grazing rates on Synechococcus spp. did not resemble chlorophyll or other group-specific rate estimates. Grazing on Synechococcus spp. has been measured in estuaries (Chen et al., 2009; Tsai et al., 2015), though significant grazing rates were hardly measured over the year in our study. Positive slopes were often detected among diluted and non-diluted treatments for Synechococcus spp. (i.e., negative grazing rates), which suggests that specific grazer–prey dilution assumptions were violated or growth conditions (e.g., nutrient regeneration) in the non-diluted fraction were enhanced due to grazing activity (Modigh and Franzè, 2009). Similar seasonal patterns in rates between phytoplankton groups indicates there may be overarching environmental factors which universally constrain phytoplankton growth and mortality within natural communities. However, identifying what controls phytoplankton rates has been challenging in the field, especially microzooplankton grazing, which may not only depend on environmental factors like temperature, but also on the composition (or quality) of prey (Rose and Caron, 2007; Lawrence and Menden-Deuer, 2012). Weekly sampling over an annual cycle allowed us to examine possible environmental or biological drivers of phytoplankton growth and grazing within a seasonally dynamic estuary (e.g., broad temperature and nutrient range), which may inform the response of coastal phytoplankton communities to future climate shifts.
Drivers of Observed Rates
Grazing activity is driven by complex grazer–prey interactions, which can be guided by grazer selectivity of prey sources (e.g., based on size or nutrition) and result in mismatches between resident grazers and prey (Irigoien et al., 2005; Poulin and Franks, 2010). In these instances, bulk proxies like chlorophyll concentration or total grazer biomass may not accurately reflect microzooplankton grazing rates (Strom et al., 2001; Olson and Strom, 2002; Lawrence and Menden-Deuer, 2012; Menden-Deuer et al., 2018). This was likely the case here, where grazing was poorly explained by prey or grazer biomass. Moreover, our results contradict density-dependent prey ingestion kinetics often seen when culturing single grazer–prey pairings (Holling, 1959; Frost, 1972; Jeong et al., 2010), as evidenced by poor relationships between nano- and picoeukaryote-specific grazing rates and their abundances (data not shown). It may be that in a natural setting, microzooplankton grazing rates are poorly explained by the amount of plankton biomass, because grazer assemblages in situ are mixed with species-specific feeding activities and physiological demands. To determine important drivers of growth and grazing rates over the annual cycle, we applied several statistical techniques using collected environmental and biological data (PLS analysis), as well as plankton biomass measurements (multivariate clustering). These approaches highlighted several factors (likely compounding) that were important in driving the observed seasonal differences in phytoplankton rates, including plankton community composition, temperature, and other mortality processes.
Multivariate clustering of group-specific biomass revealed seasonal shifts in plankton community composition over the year, with a winter–spring community of <20 μm phytoplankton that transitioned to a diatom-dominated community in late summer–fall. While fall diatom blooms have been recorded in the Skidaway River Estuary (Verity and Borkman, 2010), typical seasonality in coastal systems is characterized by winter–spring diatom blooms (Carstensen et al., 2015; Cloern, 2018), which was not seen here. Interestingly, the lowest microzooplankton grazing rates (often zero) were measured in the fall across all phytoplankton groups, which may have been influenced by the transition to weekly diatom blooms (mainly Chaetoceros and Guinardia). Diatom blooms captured during this time may have been facilitated by upstream or downstream transport of communities that had previously bloomed under more favorable conditions. Though SiO4 (>50 μM) was not limited, total chlorophyll in the fall was low (<3 μg L-1), which suggests diatom communities were likely stressed by other environmental factors (e.g., low NO3 and/or sunlight). Diatoms have been shown to release polyunsaturated aldehydes in response to physiological (Ribalet et al., 2007) or mechanical stress (e.g., grazing or lysis; Ribalet et al., 2014), which can inhibit microzooplankton feeding and the growth of other phytoplankton species (Franzè et al., 2018). These inhibitory factors may explain low phytoplankton mortality in the fall compared to other seasons. We cannot rule out the effect of additional factors (e.g., trophic cascades, prey switching, or mixotrophic activity) that may have also contributed to low microzooplankton grazing at this time (Calbet et al., 2008; Strom and Fredrickson, 2008).
Temperature emerged as a strong predictor of phytoplankton growth rates (via PLS) and was strongly related to phytoplankton growth on its own, which supports extensive theoretical (Eppley, 1972) and empirical evidence of this relationship (Rose and Caron, 2007; Bissinger et al., 2008; Kremer et al., 2017). Along with temperature, dissolved nutrients were important covariables in driving phytoplankton growth rates, though individual nutrient concentrations poorly explained growth rates over the year. Temperature is also thought to affect microzooplankton grazing (Rose and Caron, 2007). Despite temperature being identified as an important predictor of grazing in the PLS analysis, linear relationships between temperature and grazing were poor over a wide temperature gradient in the estuary (6–31°C). Others have noted, based on field measurements, that the relationship between temperature and grazing may not behave linearly (Chen et al., 2012; Lawrence and Menden-Deuer, 2012; Liu et al., 2018) and grazing rates >0.5 day-1 are frequently recorded at near-freezing temperatures (Sherr et al., 2013; Menden-Deuer et al., 2018). Often in our study, grazing was zero at higher temperatures (20–31°C), which contradicts expected acceleration of heterotrophic processes (e.g., ingestion and respiration) with temperature (Brown et al., 2004; Chen et al., 2012). Rose and Caron (2007) predicted higher capacity for microzooplankton growth compared to phytoplankton growth rates at temperatures >15°C, which has been confirmed in field-based temperature incubations with natural assemblages (Chen and Laws, 2017; Liu et al., 2018). It is important to note these experiments exposed the same community to rapid shifts in temperature, whereas our study measured fluctuations in plankton composition over a wide temperature gradient that likely masked temperature sensitivity of grazing. Though other environmental factors (e.g., nutrients, sunlight, and POC) were relevant to grazing rates in our study, these relationships were not supported by single linear regressions. The lack of temperature effects (or any other parameter) on grazing we observed indicates the importance of community composition and complex grazer–prey interactions in driving rates within marine environments.
Additional loss processes were likely important in controlling primary production in the estuary, as average accumulation rates over the year remained positive (0.28–0.58 day-1). Viral lysis represents an important loss process for phytoplankton in coastal ecosystems, particularly during periods of high, monospecific prey biomass (e.g., phytoplankton blooms; Tsai et al., 2015). Nevertheless, in our dilution experiments, viral lysis was rarely measured over an annual cycle among phytoplankton groups, which may be attributed to infection dynamics. For instance, viruses are known to exert host specificity, and so it is possible the viral community present during our dilutions was not specific or in dense enough concentrations to affect population rates (Kimmance et al., 2007). The incubation period used in our dilutions may have been too short to capture viral infection, as often the viral lytic cycle can exceed 24 h (Evans et al., 2003; Jacquet et al., 2005). Lastly, recent meta-analysis revealed that over half of viral-induced mortality rates measured via the modified dilution approach were minimal (-0.1–0.1 day-1), which suggests that typical dilution assays may lack the sensitivity needed to detect viral mortality (Staniewski and Short, 2018). Other sources may have contributed to phytoplankton mortality in the estuary, such as consumption by mesozooplankton or benthic invertebrates (e.g., bivalves), though both processes were not measurable via dilution incubations and typically account for less consumption of primary production compared to microzooplankton (Cloern et al., 2014; Steinberg and Landry, 2017).
Concluding Remarks
Our findings of seasonal variability in growth and grazing contributes to the growing knowledge on the importance of time in structuring phytoplankton rate dynamics, particularly in complex coastal regions (Lawrence and Menden-Deuer, 2012; Anderson et al., 2018). Over seasonal scales in the Skidaway River Estuary, phytoplankton growth was universally controlled by temperature and to a lesser extent by concentrations of major dissolved nutrients. Though several environmental factors were important in predicting grazing rates, there was no clear linear relationship between temperature (or any other single factor) and microzooplankton grazing. While temperature may affect grazing under controlled conditions (e.g., single grazer–prey; Rose and Caron, 2007), we demonstrate that temperature fails to explain temporal variability in grazing over wide biochemical gradients in the field. Such empirical evidence supports modeling efforts that have found it difficult to predict microzooplankton grazing rates (and accumulation rates) based solely on remotely sensed variables like temperature and chlorophyll (Chen et al., 2012, 2013; Schmoker et al., 2013). Poor correlations between grazing rates and any single factor is likely related to the fact that grazing is heavily dependent on plankton community composition, a factor not easily incorporated into model scenarios. Certainly, additional temporal rate studies, which include measures of community composition, will help to reveal biological and environmental drivers of grazing and inform future phytoplankton population models (Li et al., 2011; Caron and Hutchins, 2013). Ultimately, our ability to accurately predict the fate of primary production and of related food web processes will rely on continued measurements of microzooplankton grazing and phytoplankton growth rates over time and across marine ecosystems.
Author Contributions
EH and SA conceived the experimental design. SA performed the weekly dilution sampling and related sample analyses. EH and SA performed the data analysis and wrote the manuscript.
Funding
The work was funded by National Science Foundation awards 1459190 (Biological Oceanography) and 1624593 (DBI), as well as a grant from the University of Georgia Research Foundation, all awarded to EH.
Conflict of Interest Statement
The authors declare that the research was conducted in the absence of any commercial or financial relationships that could be construed as a potential conflict of interest.
Acknowledgments
The authors thank T. Bittar and K. Bulski for their thoughtful advice and assistance with weekly dilution experiment sampling. The authors would also like to thank comments from reviewers, which strengthened the manuscript.
Supplementary Material
The Supplementary Material for this article can be found online at: https://www.frontiersin.org/articles/10.3389/fmars.2019.00174/full#supplementary-material
References
Anderson, S. R., Diou-cass, Q. P., and Harvey, E. L. (2018). Short-term estimates of phytoplankton growth and mortality in a tidal estuary. Limnol. Oceanogr. 63, 2411–2422. doi: 10.1002/lno.10948
Bissinger, J. E., Montagnes, D. J. S., Sharples, J., and Atkinson, D. (2008). Predicting marine phytoplankton maximum growth rates from temperature: improving on the Eppley curve using quantile regression. Limnol. Oceanogr. 53, 487–493. doi: 10.4319/lo.2008.53.2.0487
Bittar, T. B., Berger, S. A., Birsa, L. M., Walters, T. L., Thompson, M. E., Spencer, R. G. M., et al. (2016). Estuarine, coastal and shelf science seasonal dynamics of dissolved, particulate and microbial components of a tidal saltmarsh-dominated estuary under contrasting levels of freshwater discharge. Estuar. Coast. Shelf Sci. 182, 72–85. doi: 10.1016/j.ecss.2016.08.046
Blauw, A. N., Beninca, E., Laane, R. W. P. M., Greenwood, N., and Huisman, J. (2012). Dancing with the tides: fluctuations of coastal phytoplankton orchestrated by different oscillatory modes of the tidal cycle. PLoS One 7:e49319. doi: 10.1371/journal.pone.0049319
Brown, J. H., Gillooly, J. F., Allen, A. P., Savage, V. M., and West, G. B. (2004). Toward a metabolic theory of ecology. Ecology 85, 1771–1789. doi: 10.1890/03-9000
Calbet, A., and Landry, M. R. (2004). Phytoplankton growth, microzooplankton grazing, and carbon cycling in marine systems. Limnol. Oceanogr. 49, 51–57. doi: 10.4319/lo.2004.49.1.0051
Calbet, A., Riisgaard, K., Saiz, E., Zamora, S., Stedmon, C., and Nielsen, T. G. (2011). Phytoplankton growth and microzooplankton grazing along a sub-Arctic fjord (Godthåbsfjord, west Greenland). Mar. Ecol. Prog. Ser. 442, 11–22. doi: 10.3354/meps09343
Calbet, A., and Saiz, E. (2005). The ciliate-copepod link in marine ecosystems. Aquat. Microb. Ecol. 38, 157–167. doi: 10.3354/ame038157
Calbet, A., Trepat, I., Almeda, R., Salo, V., Saiz, E., Movilla, J. I., et al. (2008). Impact of micro- and nanograzers on phytoplankton assessed by standard and size-fractionated dilution grazing experiments. Aquat. Microb. Ecol. 50, 145–156. doi: 10.3354/ame01171
Caron, D. A., Dennett, M. R., Lonsdale, D. J., Moran, D. M., and Shalapyonok, L. (2000). Microzooplankton herbivory in the Ross Sea. Antarctica 47, 3249–3272. doi: 10.1016/S0967-0645(00)00067-9
Caron, D. A., and Hutchins, D. A. (2013). The effects of changing climate on microzooplankton grazing and community structure: drivers, predictions and knowledge gaps. J. Plankton Res. 35, 235–252. doi: 10.1093/plankt/fbs091
Carstensen, J., Klais, R., and Cloern, J. E. (2015). Phytoplankton blooms in estuarine and coastal waters: seasonal patterns and key species. Estuar. Coast. Shelf Sci. 162, 98–109. doi: 10.1016/j.ecss.2015.05.005
Chen, B. (2015). Assessing the accuracy of the “two-point” dilution technique. Limnol. Oceanogr. Methods 13, 521–526. doi: 10.1002/lom3.10044
Chen, B., Landry, M. R., Huang, B., and Liu, H. (2012). Does warming enhance the effect of microzooplankton grazing on marine phytoplankton in the ocean? Limnol. Oceanogr. 57, 519–526. doi: 10.4319/lo.2012.57.2.0519
Chen, B., and Laws, E. A. (2017). Is there a difference of temperature sensitivity between marine phytoplankton and heterotrophs? Limnol. Oceanogr. 62, 806–817. doi: 10.1002/lno.10462
Chen, B., Liu, H., Landry, M. R., Chen, M., Sun, J., Shek, L., et al. (2009). Estuarine nutrient loading affects phytoplankton growth and microzooplankton grazing at two contrasting sites in Hong Kong coastal waters. Mar. Ecol. Prog. Ser. 379, 77–90. doi: 10.3354/meps07888
Chen, B., Zheng, L., Huang, B., Song, S., and Liu, H. (2013). Seasonal and spatial comparisons of phytoplankton growth and mortality rates due to microzooplankton grazing in the northern System. Biogeosciences 10, 2775–2785. doi: 10.5194/bg-10-2775-2013
Clarke, K. R., and Gorley, R. N. (2015). Getting Started with PRIMER v7 PRIMER-E. Plymouth: PRIMER-E Ltd.
Clarke, K. R., and Warwick, R. M. (2001). A further biodiversity index applicable to species lists: variation in taxonomic distinctness. Mar. Ecol. Prog. Ser. 216, 265–278. doi: 10.3354/meps216265
Cloern, J. E. (2018). Why large cells dominate estuarine phytoplankton. Limnol. Oceanogr. 63, 392–409. doi: 10.1002/lno.10749
Cloern, J. E., Foster, S. Q., and Kleckner, A. E. (2014). Phytoplankton primary production in the world’s estuarine-coastal ecosystems. Biogeosciences 11, 2477–2501. doi: 10.5194/bg-11-2477-2014
Cloern, J. E., and Jassby, A. D. (2010). Patterns and scales of phytoplankton variability in estuarine – coastal ecosystems. Estuar. Coasts 33, 230–241. doi: 10.1007/s12237-009-9195-3
Eriksson, L., Johansson, E., Kettaneh-Wold, N., Wilkström, C., and Wold, S. (2006). Multi- and Megavariate Data Analysis: Part I: Basic Principles and Applications. Umea: Umetrics AB.
Evans, C., Archer, S. D., Jacquet, S., and Wilson, W. H. (2003). Direct estimates of the contribution of viral lysis and microzooplankton grazing to the decline of a Micromonas spp. population. Aquat. Microb. Ecol. 30, 207–219. doi: 10.3354/ame030207
Franzè, G., Pierson, J. J., Stoecker, D. K., and Lavrentyev, P. J. (2018). Diatom-produced allelochemicals trigger trophic cascades in the planktonic food web. Limnol. Oceanogr. 63, 1093–1108. doi: 10.1002/lno.10756
Frost, B. W. (1972). Effects of size and concentration of food particles on the feeding behavior of the marine planktonic copepod Calanus Pacificus. Limnol. Oceanogr. 17, 805–815. doi: 10.4319/lo.1972.17.6.0805
Godhe, A., and McQuoid, M. R. (2003). Influence of benthic and pelagic environmental factors on the distribution of dinoflagellate cysts in surface sediments along the Swedish west coast. Aquat. Microb. Ecol. 32, 185–201. doi: 10.3354/ame032185
Graff, J. R., and Rynearson, T. A. (2011). Extraction method influences the recovery of phytoplankton pigments from natural assemblages. Limnol. Oceanogr. Methods 9, 129–139. doi: 10.4319/lom.2011.9.129
Gutiérrez-Rodríguez, A., Latasa, M., Scharek, R., Massana, R., Vila, G., and Gasol, J. M. (2011). Growth and grazing rate dynamics of major phytoplankton groups in an oligotrophic coastal site. Estuar. Coast. Shelf Sci. 95, 77–87. doi: 10.1016/j.ecss.2011.08.008
Hillebrand, H., Durselen, C.-D., Kirschtel, D., Pollingher, U., and Zohary, T. (1999). Biovolume calculation for pelagic and benthic microalgae. J. Phycol. 35, 403–424. doi: 10.1046/j.1529-8817.1999.3520403.x
Holling, C. S. (1959). Some characteristics of simple types of predation and parasitism. Can. Entomol. 91, 385–398. doi: 10.4039/Ent91385-7
Howarth, R. W., and Marino, R. (2006). Nitrogen as the limiting nutrient for eutrophication in coastal marine ecosystems: evolving views over three decades. Limnol. Oceanogr. 51, 364–376. doi: 10.4319/lo.2006.51.1_part_2.0364
Irigoien, X., Flynn, K. J., and Harris, R. P. (2005). Phytoplankton blooms: a ‘ loophole ’ in microzooplankton grazing impact? J. Plankton Res. 27, 313–321. doi: 10.1093/plankt/fbi011
Jacquet, S., Domaizon, I., and Personnic, S. (2005). Estimates of protozoan- and viral-mediated mortality of bacterioplankton in Lake Bourget ( France ). Freshw. Biol. 50, 627–645. doi: 10.1111/j.1365-2427.2005.01349.x
Jeong, H. J., Du Yoo, Y., Kim, J. S., Seong, K. A., Kang, N. S., and Kim, T. H. (2010). Growth, feeding and ecological roles of the mixotrophic and heterotrophic dinoflagellates in marine planktonic food webs. Ocean Sci. J. 45, 65–91. doi: 10.1007/s12601-010-0007-2
Jespersen, A. M., and Christoffersen, K. (1987). Measurements of chlorophyll a from phytoplankton using ethanol as extraction solvent. Arch. Hydrobiol. 109, 445–454.
Kim, S., Gil, M., Moon, C., Shin, K., and Chang, M. (2007). Seasonal variations in phytoplankton growth and microzooplankton grazing in a temperate coastal embayment, Korea. Estuar. Coast. Shelf Sci. 71, 159–169. doi: 10.1016/j.ecss.2006.07.011
Kimmance, S. A., Atkinson, D., and Montagnes, D. J. S. (2006). Do temperature – food interactions matter? Responses of production and its components in the model heterotrophic flagellate Oxyrrhis marina. Aquat. Microb. Ecol. 42, 63–73. doi: 10.3354/ame042063
Kimmance, S. A., Wilson, W. H., and Archer, S. D. (2007). Modified dilution technique to estimate viral versus grazing mortality of phytoplankton: limitations associated with method sensitivity in natural waters. Aquat. Microb. Ecol. 49, 207–222. doi: 10.3354/ame01136
Kremer, C. T., Thomas, M. K., and Litchman, E. (2017). Temperature- and size-scaling of phytoplankton population growth rates: reconciling the Eppley curve and the metabolic theory of ecology. Limnol. Oceanogr. 62, 1658–1670. doi: 10.1002/lno.10523
Landry, M. R., Brown, S. L., Rii, Y. M., Selph, K. E., Bidigare, R. R., Yang, E. J., et al. (2008). Depth-stratified phytoplankton dynamics in Cyclone Opal, a subtropical mesoscale eddy. Deep. Res. Part II 55, 1348–1359. doi: 10.1016/j.dsr2.2008.02.001
Landry, M. R., Haas, L. W., and Fagerness, V. L. (1984). Dynamics of microbial plankton communities: experiments in Kaneohe Bay, Hawaii. Mar. Ecol. Prog. Ser. 16, 127–133. doi: 10.3354/meps016127
Landry, M. R., and Hassett, R. P. (1982). Estimating the grazing impact of marine micro-zooplankton. Mar. Biol. 67, 283–288. doi: 10.1007/BF00397668
Landry, M. R., Kirshtein, J., and Constantinou, J. (1995). A refined dilution technique for measuring the community grazing impact of microzooplankton, with experimental tests in the central equatorial Pacific. Mar. Ecol. Prog. Ser. 120, 53–63. doi: 10.3354/meps120053
Lawrence, C., and Menden-Deuer, S. (2012). Drivers of protistan grazing pressure: seasonal signals of plankton community composition and environmental conditions. Mar. Ecol. Prog. Ser. 459, 39–52. doi: 10.3354/meps09771
Li, Q. P., Franks, P. J. S., and Landry, M. R. (2011). Microzooplankton grazing dynamics: parameterizing grazing models with dilution experiment data from the California current ecosystem. Mar. Ecol. Prog. Ser. 438, 59–69. doi: 10.3354/meps09320
Liu, K., Chen, B., Zhang, S., Sato, M., Shi, Z., and Liu, H. (2018). Marine phytoplankton in subtropical coastal waters showing lower thermal sensitivity than microzooplankton. Limnol. Oceanogr. doi: 10.1002/lno.11101 [Epub ahead of print].
Menden-Deuer, S., Lawrence, C., and Franzè, G. (2018). Herbivorous protist growth and grazing rates at in situ and artificially elevated temperatures during an Arctic phytoplankton spring bloom. PeerJ 6:e5264. doi: 10.7717/peerj.5264
Menden-Deuer, S., and Lessard, E. J. (2000). Carbon to volume relationships for dinoflagellates, diatoms, and other protist plankton. Limnol. Oceanogr. 45, 569–579. doi: 10.4319/lo.2000.45.3.0569
Mevik, B. H., and Wehrens, R. (2007). The pls package: principal component and partial least squares regression in R. J. Stat. Softw. 18, 1–23.
Modigh, M., and Franzè, G. (2009). Changes in phytoplankton and microzooplankton populations during grazing experiments at a Mediterranean coastal site. J. Plankton Res. 31, 853–864. doi: 10.1093/plankt/fbp035
Morison, F., and Menden-Deuer, S. (2017). Doing more with less? Balancing sampling resolution and effort in measurements of protistan growth and grazing-rates. Limnol. Oceanogr. Methods 15, 794–809. doi: 10.1002/lom3.10200
Murrell, M., Stanley, R. S., Lores, E. M., DiDonato, G. T., and Flemer, D. A. (2002). Linkage between microzooplankton grazing and phytoplankton growth in a gulf of mexico estuary. Estuaries 25, 19–29. doi: 10.1007/BF02696046
Olson, M. B., and Strom, S. L. (2002). Phytoplankton growth, microzooplankton herbivory and community structure in the southeast Bering Sea: insight into the formation and temporal persistence of an Emiliania huxleyi bloom. Deep. Res. Part II 49, 5969–5990. doi: 10.1016/S0967-0645(02)00329-6
Poulin, F. J., and Franks, P. J. S. (2010). Size-structured planktonic ecosystems: constraints, controls and assembly instructions. J. Plankton Res. 32, 1121–1130. doi: 10.1093/plankt/fbp145
Poulton, N. (2016). FlowCam: quantification and classification of phytoplankton by imaging flow cytometry. Methods Mol Biol. 1389, 237–247. doi: 10.1007/978-1-4939-3302-0_17
Ribalet, F., Bastianini, M., Vidoudez, C., Acri, F., Berges, J., Ianora, A., et al. (2014). Phytoplankton cell lysis associated with polyunsaturated aldehyde release in the Northern Adriatic Sea Franc. PLoS One 9:e85947. doi: 10.1371/journal.pone.0085947
Ribalet, F., Wichard, T., Pohnert, G., Ianora, A., Miralto, A., and Casotti, R. (2007). Age and nutrient limitation enhance polyunsaturated aldehyde production in marine diatoms Franc. Phytochemistry 68, 2059–2067. doi: 10.1016/j.phytochem.2007.05.012
Rose, J. M., and Caron, D. A. (2007). Does low temperature constrain the growth rates of heterotrophic protists? Evidence and implications for algal blooms in cold waters. Limnol. Oceanogr. 52, 886–895. doi: 10.4319/lo.2007.52.2.0886
Schmoker, C., Hernández-León, S., and Calbet, A. (2013). Microzooplankton grazing in the oceans: impacts, data variability, knowledge gaps and future directions. J. Plankton Res. 35, 691–706. doi: 10.1093/plankt/fbt023
Sherr, E. B., and Sherr, B. F. (2007). Heterotrophic dinoflagellates: a significant component of microzooplankton biomass and major grazers of diatoms in the sea. Mar. Ecol. Prog. Ser. 352, 187–197. doi: 10.3354/meps07161
Sherr, E. B., Sherr, B. F., and Ross, C. (2013). Microzooplankton grazing impact in the Bering Sea during spring sea ice conditions. Deep. Res. Part II 94, 57–67. doi: 10.1016/j.dsr2.2013.03.019
Sherr, E. B., Sherr, B. F., Wheeler, P. A., and Thompson, K. (2003). Temporal and spatial variation in stocks of autotrophic and heterotrophic microbes in the upper water column of the central Arctic Ocean. Deep. Res. Part I 50, 557–571. doi: 10.1016/S0967-0637(03)00031-1
Sitta, K. A., Reed, M., Mortensen, R., Doll, C., Callahan, T., and Green, D. I. (2018). The influences of nitrogen form and zooplankton grazing on phytoplankton assemblages in two coastal southeastern systems. Limnol. Oceanogr. 63, 2523–2544. doi: 10.1002/lno.10957
Staniewski, M. A., and Short, S. M. (2018). Methodological review and meta-analysis of dilution assays for estimates of virus- and grazer-mediated phytoplankton mortality. Limnol. Oceanogr. Methods 16, 649–668. doi: 10.1002/lom3.10273
Steinberg, D. K., and Landry, M. R. (2017). Zooplankton and the Ocean carbon cycle. Ann. Rev. Mar. Sci. 9, 413–444. doi: 10.1146/annurev-marine-010814-015924
Strom, S. L., Brainard, M. A., Holmes, J. L., and Olson, M. B. (2001). Phytoplankton blooms are strongly impacted by microzooplankton grazing in coastal North Pacific waters. Mar. Biol. 138, 355–368. doi: 10.1007/s002270000461
Strom, S. L., and Fredrickson, K. A. (2008). Intense stratification leads to phytoplankton nutrient limitation and reduced microzooplankton grazing in the southeastern Bering Sea. Deep. Res. Part II 55, 1761–1774. doi: 10.1016/j.dsr2.2008.04.008
Strom, S. L., Macri, E. L., and Olson, M. B. (2007). Microzooplankton grazing in the coastal Gulf of Alaska: variations in top-down control of phytoplankton. Limnol. Oceanogr. 52, 1480–1494. doi: 10.4319/lo.2007.52.4.1480
Tsai, A.-Y., Gong, G.-C., Huang, Y. W., and Chao, C. F. (2015). Estimates of bacterioplankton and Synechococcus spp. mortality from nanoflagellate grazing and viral lysis in the subtropical Danshui River estuary. Estuar. Coast. Shelf Sci. 153, 54–61. doi: 10.1016/j.ecss.2014.11.032
Verity, P. G. (2002a). A Decade of change in the Skidaway River estuary. I. hydrography and nutrients. Estuaries 25, 944–960. doi: 10.1007/BF02691343
Verity, P. G. (2002b). A decade of change in the Skidaway River Estuary. II. particulate organic carbon, nitrogen, and chlorophyll a. Estuaries 25, 961–975. doi: 10.1007/BF02691344
Verity, P. G., and Borkman, D. G. (2010). A decade of change in the skidaway river estuary. III. plankton. Estuar. Coasts 33, 513–540. doi: 10.1007/s12237-009-9208-2
Wetz, M. S., Hayes, K. C., Lewitus, A. J., Wolny, J. L., and White, D. L. (2006). Variability in phytoplankton pigment biomass and taxonomic composition over tidal cycles in a salt marsh estuary. Mar. Ecol. Prog. Ser. 320, 109–120. doi: 10.3354/meps320109
Worden, A. Z., and Binder, B. J. (2003). Application of dilution experiments for measuring growth and mortality rates among Prochlorococcus and Synechococcus populations in oligotrophic environments. Aquat. Microb. Ecol. 30, 159–174. doi: 10.3354/ame030159
Keywords: microzooplankton grazing, phytoplankton growth, plankton community composition, estuary, seasonal dynamics, food web
Citation: Anderson SR and Harvey EL (2019) Seasonal Variability and Drivers of Microzooplankton Grazing and Phytoplankton Growth in a Subtropical Estuary. Front. Mar. Sci. 6:174. doi: 10.3389/fmars.2019.00174
Received: 28 January 2019; Accepted: 18 March 2019;
Published: 17 April 2019.
Edited by:
Eva Ortega-Retuerta, UMR7621 Laboratoire d’Océanographie Microbienne (LOMIC), FranceReviewed by:
Márcio Silva de Souza, Fundação Universidade Federal do Rio Grande, BrazilMichèle Tackx, UMR5245 Laboratoire Ecologie Fonctionnelle et Environnement (ECOLAB), France
Copyright © 2019 Anderson and Harvey. This is an open-access article distributed under the terms of the Creative Commons Attribution License (CC BY). The use, distribution or reproduction in other forums is permitted, provided the original author(s) and the copyright owner(s) are credited and that the original publication in this journal is cited, in accordance with accepted academic practice. No use, distribution or reproduction is permitted which does not comply with these terms.
*Correspondence: Elizabeth L. Harvey, ZWxpemFiZXRoLmhhcnZleUBza2lvLnVnYS5lZHU=