 Maricarmen Igarza
 Thorsten Dittmar
 Michelle Graco
 Jutta Niggemann
- 1Research Group for Marine Geochemistry (ICBM-MPI Bridging Group), Institute for Chemistry and Biology of the Marine Environment, Carl von Ossietzky University of Oldenburg, Oldenburg, Germany
- 2Instituto del Mar del Perú (IMARPE), Dirección General de Investigaciones en Oceanografía y Cambio Climático, Callao, Peru
The Peruvian upwelling system (PUS) is among the most productive regions in the ocean, with high rates of primary production and an intense oxygen minimum zone (OMZ). The main perturbation of this system is associated to “El Niño” (EN), which affects water mass distribution and reduces primary production. Previous studies in the PUS provided first insights into the dynamics of dissolved organic matter (DOM), but high-resolution studies involving the molecular characterization of the DOM pool to reveal the processes that affect the carbon cycle in this highly productive system are lacking. We characterized the molecular composition of solid-phase extractable DOM (SPE-DOM) in the coastal upwelling system off Central Peru and linked it to specific processes that affect DOM cycling. Seasonal sampling (April, August, and December) was carried out off Central Peru (12°S) during 2015, a low productivity year marked by EN conditions. The DOM molecular composition was obtained via Fourier transform ion cyclotron resonance mass spectrometry (FT-ICR-MS). Solid-phase extractable dissolved organic carbon (SPE-DOC) concentrations showed significant differences (p < 0.05) between the water masses present off central Peru. In order to explore if changes in SPE-DOC concentrations were the result of water mass mixing, we applied a conservative mixing (CM) model. The model revealed a non-conservative behavior of SPE-DOC and allowed us to identify two distinct groups of samples with increased and decreased SPE-DOC concentrations, respectively, and one group of samples inside the CM range. Differences in environmental parameters characterizing these groups were in accordance with respective processes associated to production and degradation of SPE-DOC. The trends observed for molecular parameters revealed the imprint of processes related to DOM production and DOM degradation, both biotic (microbial degradation) and abiotic (photodegradation). Our study suggests that even under low productivity conditions like EN, there is an active cycling of the DOM pool off central Peru.
Introduction
Dissolved organic matter (DOM) represents one of the largest reactive pools of organic carbon in the ocean (Carlson and Hansell, 2014). This pool of dissolved molecules plays a crucial role in biogeochemical cycles, since it constitutes the link between production and decay of organic matter in the oceanic water column.
In the world ocean, there are four major Eastern Boundary Upwelling Ecosystems characterized by high primary production (Fréon et al., 2009). These areas show active upwelling and are associated with the subtropical gyres of the Atlantic and the Pacific (Chavez and Messié, 2009). The most prominent feature of these systems is the strong coupling between atmospheric forcing, ocean circulation, and biogeochemical cycling (Chavez and Messié, 2009). Since the dominant source of marine DOM is marine phytoplankton (Hansell et al., 2009), the global patterns in primary productivity influence the distribution of dissolved organic carbon (DOC) and high DOM concentrations occur in these highly productive areas of the ocean (Dittmar and Stubbins, 2014). For instance, large amounts of DOC are produced and processed in the coastal upwelling area off the north western part of the Iberian Peninsula (Álvarez-Salgado et al., 2001); furthermore, coastal upwelling areas have been suggested to play an important role in the export of labile DOC to the adjacent ocean (Álvarez-Salgado et al., 2001; Lønborg et al., 2010).
The Humboldt Current Upwelling System (HCUS) extends from southern Chile (45°S) to northern Peru (4°S). This upwelling system consists of three defined biomes, one of these is the highly productive year-round Peruvian upwelling system (PUS; 4–16°S) (Chavez and Messié, 2009). In this system, upwelling-favorable winds bring nutrient-rich waters to the surface, supporting high rates of primary production (855 g C m-2 year-1, Chavez and Messié, 2009) and the development of a very intense oxygen minimum zone (OMZ, i.e., upper boundary < 150 m and dissolved oxygen (DO) < 0.5 mL L-1) (Helly and Levin, 2004; Fuenzalida et al., 2009). One of the unique features of the PUS is the decoupling between the cycles of productivity and upwelling (Chavez and Messié, 2009; Gutiérrez et al., 2011), most likely caused by the deepening of the mixed layer during the upwelling period (Echevin et al., 2008). The typical seasonality observed in this system consists of high productivity periods during austral summer (December–March), and low productivity and strong upwelling periods during austral winter (June–August) (Gutiérrez et al., 2011). Intense phytoplankton blooms occur during spring (re-stratification period) and during fall (destratification period) (Echevin et al., 2008).
Among the Eastern Boundary Upwelling Ecosystems, the PUS presents the strongest interannual variability, which is associated to El Niño (EN)-Southern Oscillation, especially to its warm phase EN. EN affects and changes completely the physical, chemical, and biological dynamics of this system (Gutiérrez et al., 2008). Three main features characterize the PUS under EN conditions, (i) increase of sea surface temperature, (ii) change of water mass distribution mainly characterized by the progressive approach of the Surface Subtropical Waters (SSW) toward the coast, and (iii) decrease of primary production. Although upwelling-favorable winds can increase during EN and the depth of the upwelling source waters can remain rather unaffected, the nutrient supply to surface waters often decreases as the result of complex physical processes that involve downwelling and offshore transport, consequently primary production is reduced under such scenarios (Espinoza-Morriberón et al., 2017).
Studies of the composition and potential reactivity of DOM in the HCUS are scarce. One study performed by Pantoja et al. (2009) off Chile showed that an important fraction of the DOM is processed in the OMZ. In the PUS, the few studies performed during normal conditions of primary production revealed a patchy DOC distribution influenced by lateral and vertical transport processes (Romankevich and Ljutsarev, 1990), and a complex dynamic of optically active DOM influenced by the interplay of biological and physical processes (Galgani and Engel, 2016; Loginova et al., 2016). Detailed studies on the dynamics of the DOM pool in the PUS, including its characterization at a molecular level, are essential for a better understanding of the carbon cycle in such highly productive regions and the potential consequences that climate change scenarios may have.
The present study characterized the molecular composition of solid-phase extractable DOM (SPE-DOM) present in the water column off central Peru during an EN year and linked it to processes involved in DOM cycling. Water samples from different water depths were collected in 2015 in a perpendicular transect off central Peru covering a wide spatial (coastal – ocean) and seasonal (April, August, and December) range. The DOM molecular composition was obtained via Fourier-transform ion cyclotron resonance mass spectrometry (FT-ICR-MS). The high resolution of FT-ICR-MS allows the identification of thousands of molecular formulae (MF) in complex DOM mixtures (Dittmar and Stubbins, 2014). We hypothesize that under conditions of low primary production and enhanced influence of the nutrient-depleted SSW, DOM dynamics is mainly affected by physical processes like water mass mixing, with no imprint of seasonality or primary production in the DOM molecular composition.
Materials and Methods
Description of the Study Site and Water Mass Distribution
The PUS presents latitudinal and seasonal variation in both upwelling and primary production (Calienes et al., 1985). One of the main and well-developed upwelling and primary production centers is located off central Peru (Callao – 12°S), which results in a thicker and shallower OMZ (upper boundary starting at 30 m depth) compared to other areas (Ledesma et al., 2011). During EN years, the upper boundary of the OMZ in this area can deepen to more than 100 m (Gutiérrez et al., 2008).
The water mass dynamics off central Peru is strongly influenced by upwelling and mixing processes. It is possible to distinguish between surface and subsurface water masses of distinct origins, and waters that result from the mixing of these water masses (e.g., Zuta and Guillén, 1970; Fiedler and Talley, 2006; Grados et al., 2018). At the surface, the SSW dominate offshore (Supplementary Figure S1 and Supplementary Table S1), and are characterized by high salinity (>35), high temperatures (>18°C), high DO concentrations, and low concentrations of nutrients (Zuta and Guillén, 1970; Strub et al., 1998; Fiedler and Talley, 2006; Graco et al., 2007; Grados et al., 2018). This water mass extends from 6°S off Peru to 24°S off Chile (Silva et al., 2009).
At the subsurface level, the Equatorial Subsurface Waters (ESSW) are transported poleward by the Peru-Chile Undercurrent (Silva and Neshyba, 1979; Chaigneau et al., 2013). This water mass has been identified as the main source of upwelling off Peru (e.g., Montes et al., 2010) and is characterized by relatively high salinity (>34.5), temperatures ≥ 13°C (Zuta and Guillén, 1970; Fiedler and Talley, 2006; Graco et al., 2007), minimum DO concentrations, and high nutrient concentrations (Zuta and Guillén, 1970; Silva et al., 2009). The isotherm that is associated to these waters is the 15°C isotherm (Zuta and Guillén, 1970), which is indicative for the presence of active upwelling (e.g., Graco et al., 2007; Grados et al., 2018). In addition to this subsurface water mass, Zuta and Guillén (1970) defined the Deep Equatorial Waters (DEW) as a water mass characterized by temperatures between 7 and 13°C and a vertical extension up to 600 m depth. Some studies (e.g., Grados et al., 2018) consider the ESSW and the DEW as one water mass, assigning the ESSW a temperature range between 8 and 14°C and a depth range of 50–600 m.
Water mass dynamics off central Peru is strongly influenced by mixing processes. Nearshore, mixing of the nutrient-poor SSW and the ESSW that upwell to the surface result in waters of intermediate salinity (34.8–35.1), the so-called Coastal Cold Waters (CCW; Zuta and Guillén, 1970; Graco et al., 2007; Morón, 2011). Since these waters are the result of mixing, they are not considered sensu stricto a water mass. The physical and chemical properties of CCW are variable, with generally enhanced concentrations of nutrients and chlorophyll-a (Chl-a) which vary seasonally due to changing extent of upwelling and mixing. Under normal non-EN conditions, the CCW extend 55 km off the coast, while during EN conditions, the spatial distribution is reduced due to the approximation of the nutrient-poor SSW toward the coast (Supplementary Figure S1).
Sampling and Chemical Analyses
Water samples were collected in 2015 during three oceanographic cruises from the Peruvian Sea Institute (Instituto del Mar del Perú – IMARPE) along a perpendicular transect of stations located off central Peru (Callao – 12°S, Figure 1) between 14 and 93 km from the coast. Station 2 is located on the inner shelf, station 5 on the outer shelf almost at the outer edge (200 m), and station 7 is located on the slope. The cruises took place during April (end of austral summer), August (austral winter), and December (end of austral spring) in order to cover the whole seasonal cycle.
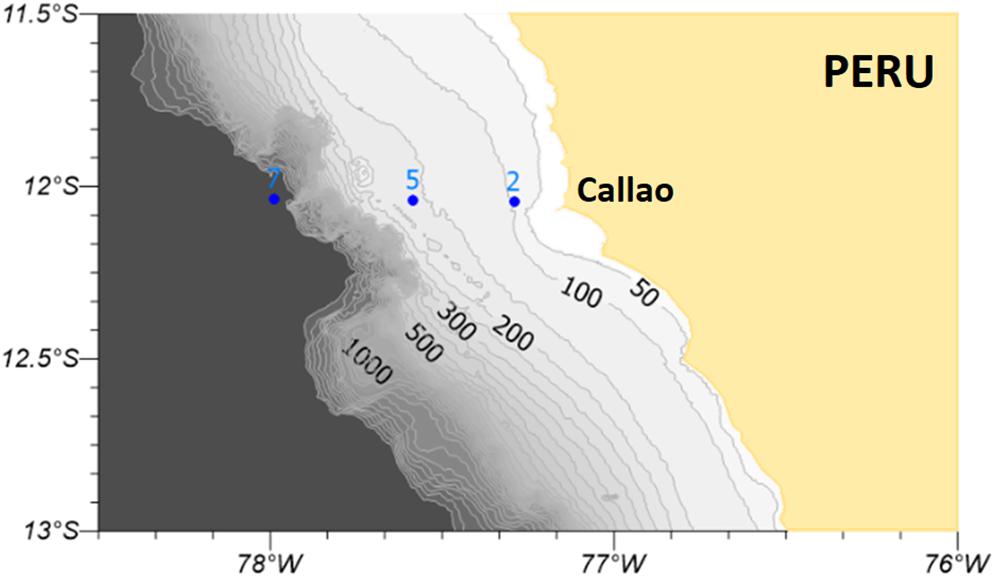
Figure 1. Perpendicular transect of stations located off central Peru (Callao –12°S) sampled for DOM during April, August, and December 2015. The contour lines shown in the map represent bathymetric isolines. Numbers mark stations: 2 (station 2), 5 (station 5), and 7 (station7).
Physical and chemical parameters temperature, salinity, DO concentration, and pH were measured in situ using a conductivity-temperature-depth sensor (CTD Seabird SBE19 Plus) equipped with a DO and Chl-a sensor (membrane-type). Water samples for nutrient and DOM analyses were collected with Niskin bottles at specific water depths (Table 1). During the cruise in December, water depths for DOM sampling were chosen according to the Chl-a profile in order to target depths with elevated DOM production. In addition to this, only during the December cruise, water samples were taken in duplicates from shallower depths, while for deeper sampling points, water was not collected in duplicates but from close depths (i.e., station 5 at 48 and at 50 m); this obeyed strictly to logistical reasons (sampling time, weather conditions). All samples were retrieved in separate hauls; therefore, we decided to treat these samples as independent samples and not as replicates. Quantification of nutrient concentrations (nitrate, nitrite, silicate, and phosphate) was done using standard colorimetric techniques (Parsons et al., 1984); Chl-a concentrations were quantified using the standard fluorometric procedure of Holm-Hansen et al. (1965). Based on nitrate, nitrite and phosphate concentrations we calculated a nutrient N:P ratio for each of the samples.
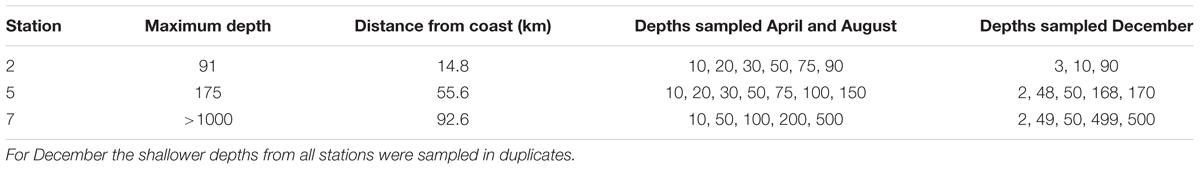
Table 1. Water depths sampled for DOM during 2015 off Callao.
Samples for DOM analysis were filtered directly onboard from the Niskin bottles to 2-L Nalgene bottles through pre-combusted (400°C – 4 h) glass fiber filters (GF/F, 0.7 μm) and acidified to pH2 (HCl 37%). Due to logistical reasons and bad weather conditions, during the cruises of August and December, DOM samples were collected directly from the Niskin bottle to the Nalgene bottle without filtration and stored dark and at 4°C onboard the ship; filtration and acidification of the samples took place immediately after arriving to the laboratory. Additional samples for DOC analysis were collected from the Niskin bottles to 500-mL Nalgene bottles, then filtered through glass fiber filters (GF/F, 0.7 μm), and acidified to pH 2 (HCl 37%). Due to contamination issues, these samples were not included in the study; for more details, please refer to the Supplementary Material.
DOM was extracted from the filtered and acidified samples using pre-cleaned cartridges filled with a styrene divinyl benzene polymer (Agilent Bond Elut PPL, 1 g; Dittmar et al., 2008). These PPL cartridges have a pore size of 150 Å and allow the retention of highly polar to non-polar compounds (Dittmar et al., 2008). The DOM fraction that is retained in the PPL cartridge is called SPE-DOM and includes a wide range of dissolved highly polar to non-polar compounds, excluding the smallest polar molecules like free amino acids (Hawkes et al., 2016).
After the samples passed through the PPL column by gravity flow, the cartridge was rinsed two times with ultrapure water (pH 2, HCl) and then dried using nitrogen gas. Finally, the SPE-DOM samples (DOM extracts) were eluted with 6 mL of methanol from the PPL cartridge to 10-mL amber vials and kept dark and at -20°C for further analyses. In addition to the water samples, procedural blanks of ultrapure water were prepared in the field; these blanks underwent all the same procedures as the samples.
Solid-phase extractable DOC (SPE-DOC) concentrations were determined by drying an aliquot of the SPE-DOM extract (at 40°C) and re-dissolving it in ultrapure water. SPE-DOC concentrations were obtained by high-temperature catalytic oxidation on a Shimadzu TOC-VCPH/CPN total organic carbon analyzer. For each run, measurement accuracy was controlled with the Deep Atlantic Seawater Reference material (DSR, D. A. Hansell, University of Miami, Miami, FL, United States). Precision was on average 4.5%.
Water Mass Assignment and Conservative Mixing Model
Based on their salinity and temperature, all samples collected during the three oceanographic campaigns were assigned to a specific water mass (Supplementary Table S1). In order to examine if water mass mixing was the principal process affecting DOM dynamics during 2015, we applied a conservative mixing (CM) model. We tested the potential conservative behavior of SPE-DOC with water mass mixing. For this, we defined two end members, ESSW and SSW, each represented by average values of salinity and SPE-DOC concentrations of all ESSW and SSW samples, respectively. CCW samples were considered as resulting from mixing of ESSW and SSW and deviations from CM of SPE-DOC were identified.
Molecular Analysis of DOM
Solid-phase extractable DOM aliquots were diluted to a final DOC concentration of 5 mg L-1 in a 1:1 mixture of methanol and ultrapure water for analysis with ultrahigh-resolution mass spectrometry using a Fourier transform ion cyclotron resonance mass spectrometer (FT-ICR-MS, Solarix, Bruker Daltonik GmbH) with a 15 T magnet.
For each of the SPE-DOM samples, 250 scans were accumulated using electrospray ionization in negative mode. The ion accumulation time varied from sample to sample between 0.2 and 0.35 s; this was done in order to reach a similar total ion current (TIC) for all samples. The data were acquired in broadband mode using eight megaword data sets and a scanning range of 92–2000 Daltons. At the beginning and at the end of the measurements each day, an in-house reference deep sea DOM extract was analyzed in order to monitor the reproducibility and stability of the instrument.
Each mass spectrum was calibrated internally with a reference containing >50 known molecular masses. Masses and detected signal intensities were exported at a signal-to-noise ratio (S/N) of 0 and noise removal was done using the method detection limit described in Riedel and Dittmar (2014). MF assignment was performed considering the elements C, H, O, N, S, and P and based on the criteria described by Koch et al. (2007) and Seidel et al. (2014) using in-house Matlab (MathWorks, Natwick, MA, United States) routines.
After the assignment of MF, further data reduction steps were applied. MF present in less than three samples were removed. Potential contamination signals were removed. For this, we calculated for each peak its average intensity only in all procedural blanks and then divided it by the noise. Peaks with a value ≥20 were removed. Finally, signal intensities of the remaining peaks were normalized to the sum of all peak intensities in each respective sample.
The MF obtained were assigned to molecular classes based on molar ratios (H/C and O/C), modified aromaticity index (AImod), and heteroatom content (Šantl-Temkiv et al., 2013; Koch and Dittmar, 2006, 2016). The molecular classes were named according to likely structural characteristics that are consistent with the elemental composition: condensed aromatic compounds (AImod ≥ 0.67), highly unsaturated compounds (AImod < 0.50, H/C < 1.5, O/C < 0.9), unsaturated aliphatic (UA) compounds without nitrogen (1.5 ≤ H/C ≤ 2.0, O/C < 0.9, N = 0), saturated fatty acids (H/C > 2, O/C < 0.9), sugars (O/C ≥ 0.9), and peptides (1.5 ≤ H/C ≤ 2.0, O/C < 0.9, and N > 0). We do not claim that all detected formulae represent a compound of their assigned class, and we are aware that each MF likely includes a range of isomers (Zark et al., 2017). The elemental composition of each MF also allowed us to calculate the double bond equivalent (DBE; Koch et al., 2005). We further separated the MF according to their heteroatom content in: MF that contain nitrogen (N-containing compounds), MF that contain sulfur (S-containing compounds), and MF that contain phosphorus (P-containing compounds). Some MF have been assigned to more than one group since some of them contain, i.e., nitrogen and sulfur.
Statistical Analyses and Data Visualization
All statistical analyses and box plots were performed using the R statistical platform (version 3.4.3). All calculations that involved data obtained by FT-ICR-MS were done on normalized peak intensities. For each sample, weighted averages were calculated for relative abundance of molecular classes, molar ratios, AImod, DBE, and heteroatom content.
In order to compare a given variable (i.e., H/C ratio, DO concentration) between two groups of samples, we first performed a Fisher F-test in order to verify the homoscedasticity criterion (homogeneity of variances) and then a Student t-test. In the cases where the Fisher F-test revealed that the variances of the two groups were different, a Welch two-sample t-test was performed instead of the Student t-test. When more than two groups of samples needed to be compared, we performed a one-way ANOVA test; if this test revealed significant differences, a Tukey test was performed, and the adjusted p-values were obtained. Only p-values < 0.05 were considered as significant.
We compared the relative intensity of individual MF between different groups of samples by applying a multiple t-tests approach (confidence level = 0.001; Zark et al., 2015). This was done in order to identify specific MF with significantly decreased or increased intensity between different groups of samples. Since the multiple t-tests analysis involves the simultaneous consideration of a set of statistical inferences, the multiple comparison problem arises (Miller, 1981). In order to assess this effect, we artificially generated a random dataset with the same number of samples and variables and the same number of zero entries as in the real data and performed a multiple t-tests analysis (Zark et al., 2017) emulating the way we performed the analysis of the real data. The results obtained were tested under different significant levels (p-values < 0.05, < 0.01, < 0.005, and < 0.001) in order to determine the threshold where the real data separated from the random dataset.
The statistical packages vegan (Oksanen et al., 2018), ade4 (Dray and Dufour, 2007), and Hmisc (Harrell et al., 2018) were used to perform Pearson correlation analyses. Prior to all correlation analyses, the environmental data were standardized in aid of comparability using the function decostand from the package vegan (transformation standardize). Only correlations with a p-value < 0.05 were considered in the analysis and discussion.
The graphical display of the oceanographic variables temperature, salinity, and DO concentration was done using the software Ocean Data View (Schlitzer, 2017).
Results
Oceanographic Conditions During 2015
Temperature, Salinity, and Dissolved Oxygen
The temperature profiles for April, August, and December (Figure 2A) reflect the progressive deepening of the 15°C isotherm in the water column along the studied transect. In April, the shallowest position of this isotherm, which marks the presence of active upwelling, approached 50 m water depth, meanwhile for December, it was below 100 m depth. The deepening of the 15°C isotherm is characteristic of EN years (Espinoza-Morriberón et al., 2017; Grados et al., 2018). Sea surface temperatures increased throughout the year from April to December, with higher values observed near the coast for both April and December. During August (austral winter), sea surface temperatures were lower near the coast.
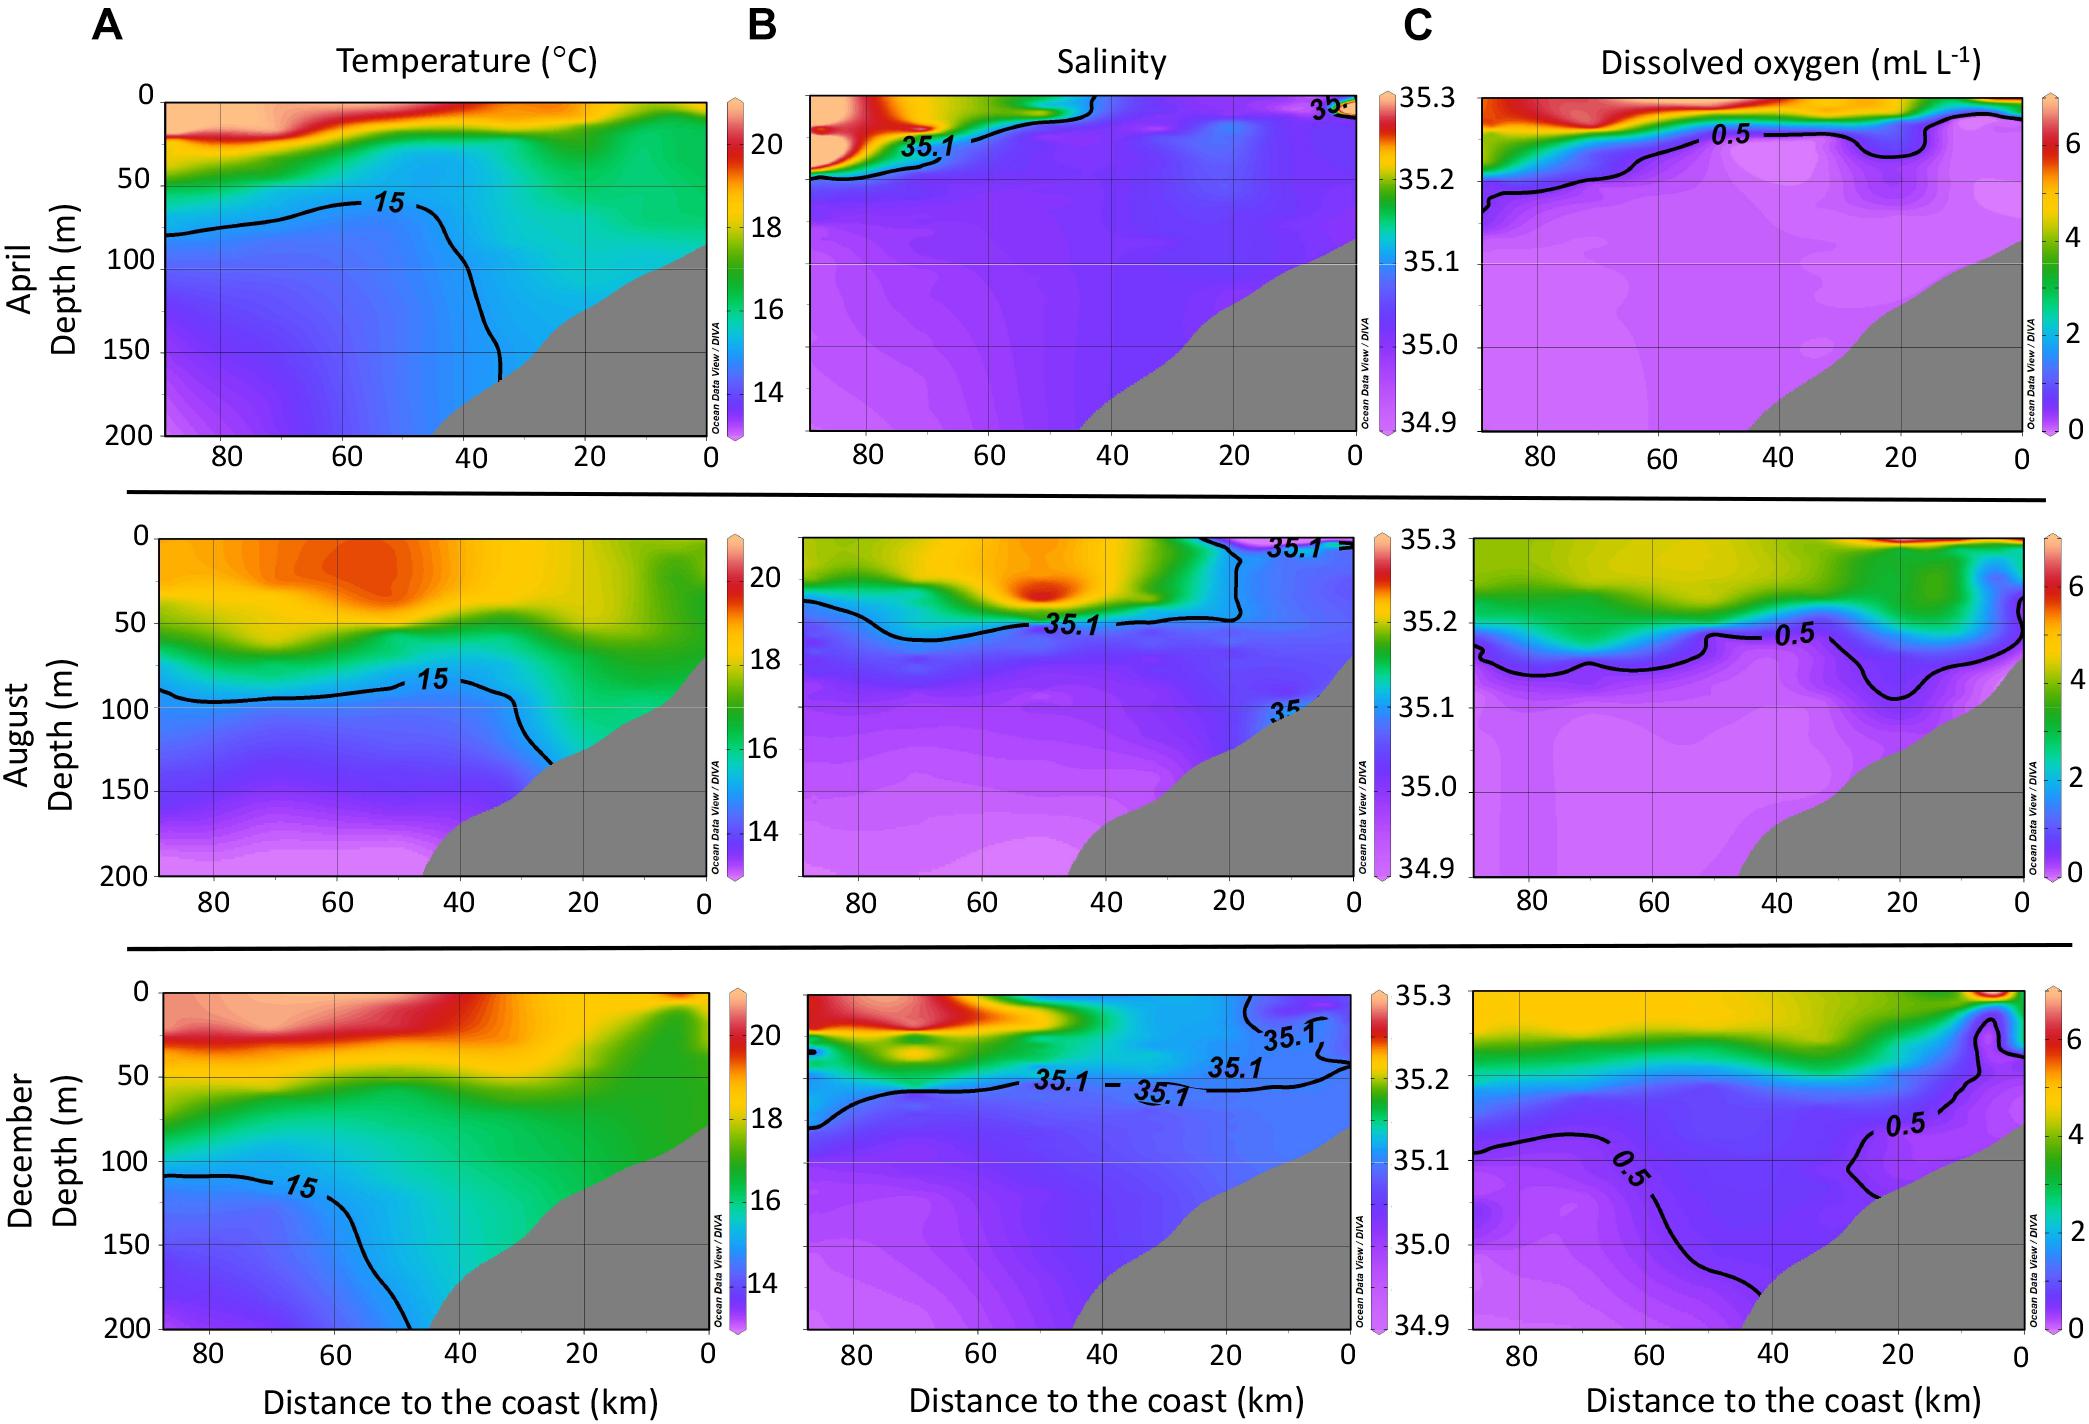
Figure 2. Profiles of temperature (A), salinity (B), and dissolved oxygen concentration (C) for the studied transect off central Peru (Callao – 12°S) during 2015, including all data collected during the CTD casts for the whole transect off central Peru (Figure 1) and not only stations where water samples for DOM analysis were collected. Interpolation was done using the DIVA gridding function in ODV.
The salinity profiles for the studied transect (Figure 2B) throughout 2015 showed a progressive approach of the 35.1 isohaline toward the coast. This isohaline marks the distribution of the SSW, which are ventilated, nutrient-depleted, and high in salinity (e.g., Strub et al., 1998; Fiedler and Talley, 2006). The DO profiles (Figure 2C) showed a progressive deepening of the 0.5 mL L-1 isocline during 2015; this isocline marks the upper limit of the OMZ (Graco et al., 2007).
This continuous approach of warmer and more saline waters toward the coast during 2015 is typical of anomalous conditions associated to EN. The progressive evolution of anomalous oceanographic conditions ended with a strong EN event during the austral summer of 2016.
Water Masses and CCW
Based on the properties salinity and temperature, water masses were identified off central Peru for 2015 (Supplementary Figure S2) and each sample was assigned to either one of the two subsurface water masses (DEW and ESSW), the surface water mass (SSW), or the CCW (result of mixing). Based on this water mass classification, we derived box plots for concentrations of DO, Chl-a, nitrate, silicate, phosphate, and the N:P ratio (Figure 3). These box plots include all samples collected during 2015 and are therefore representative for the whole year.
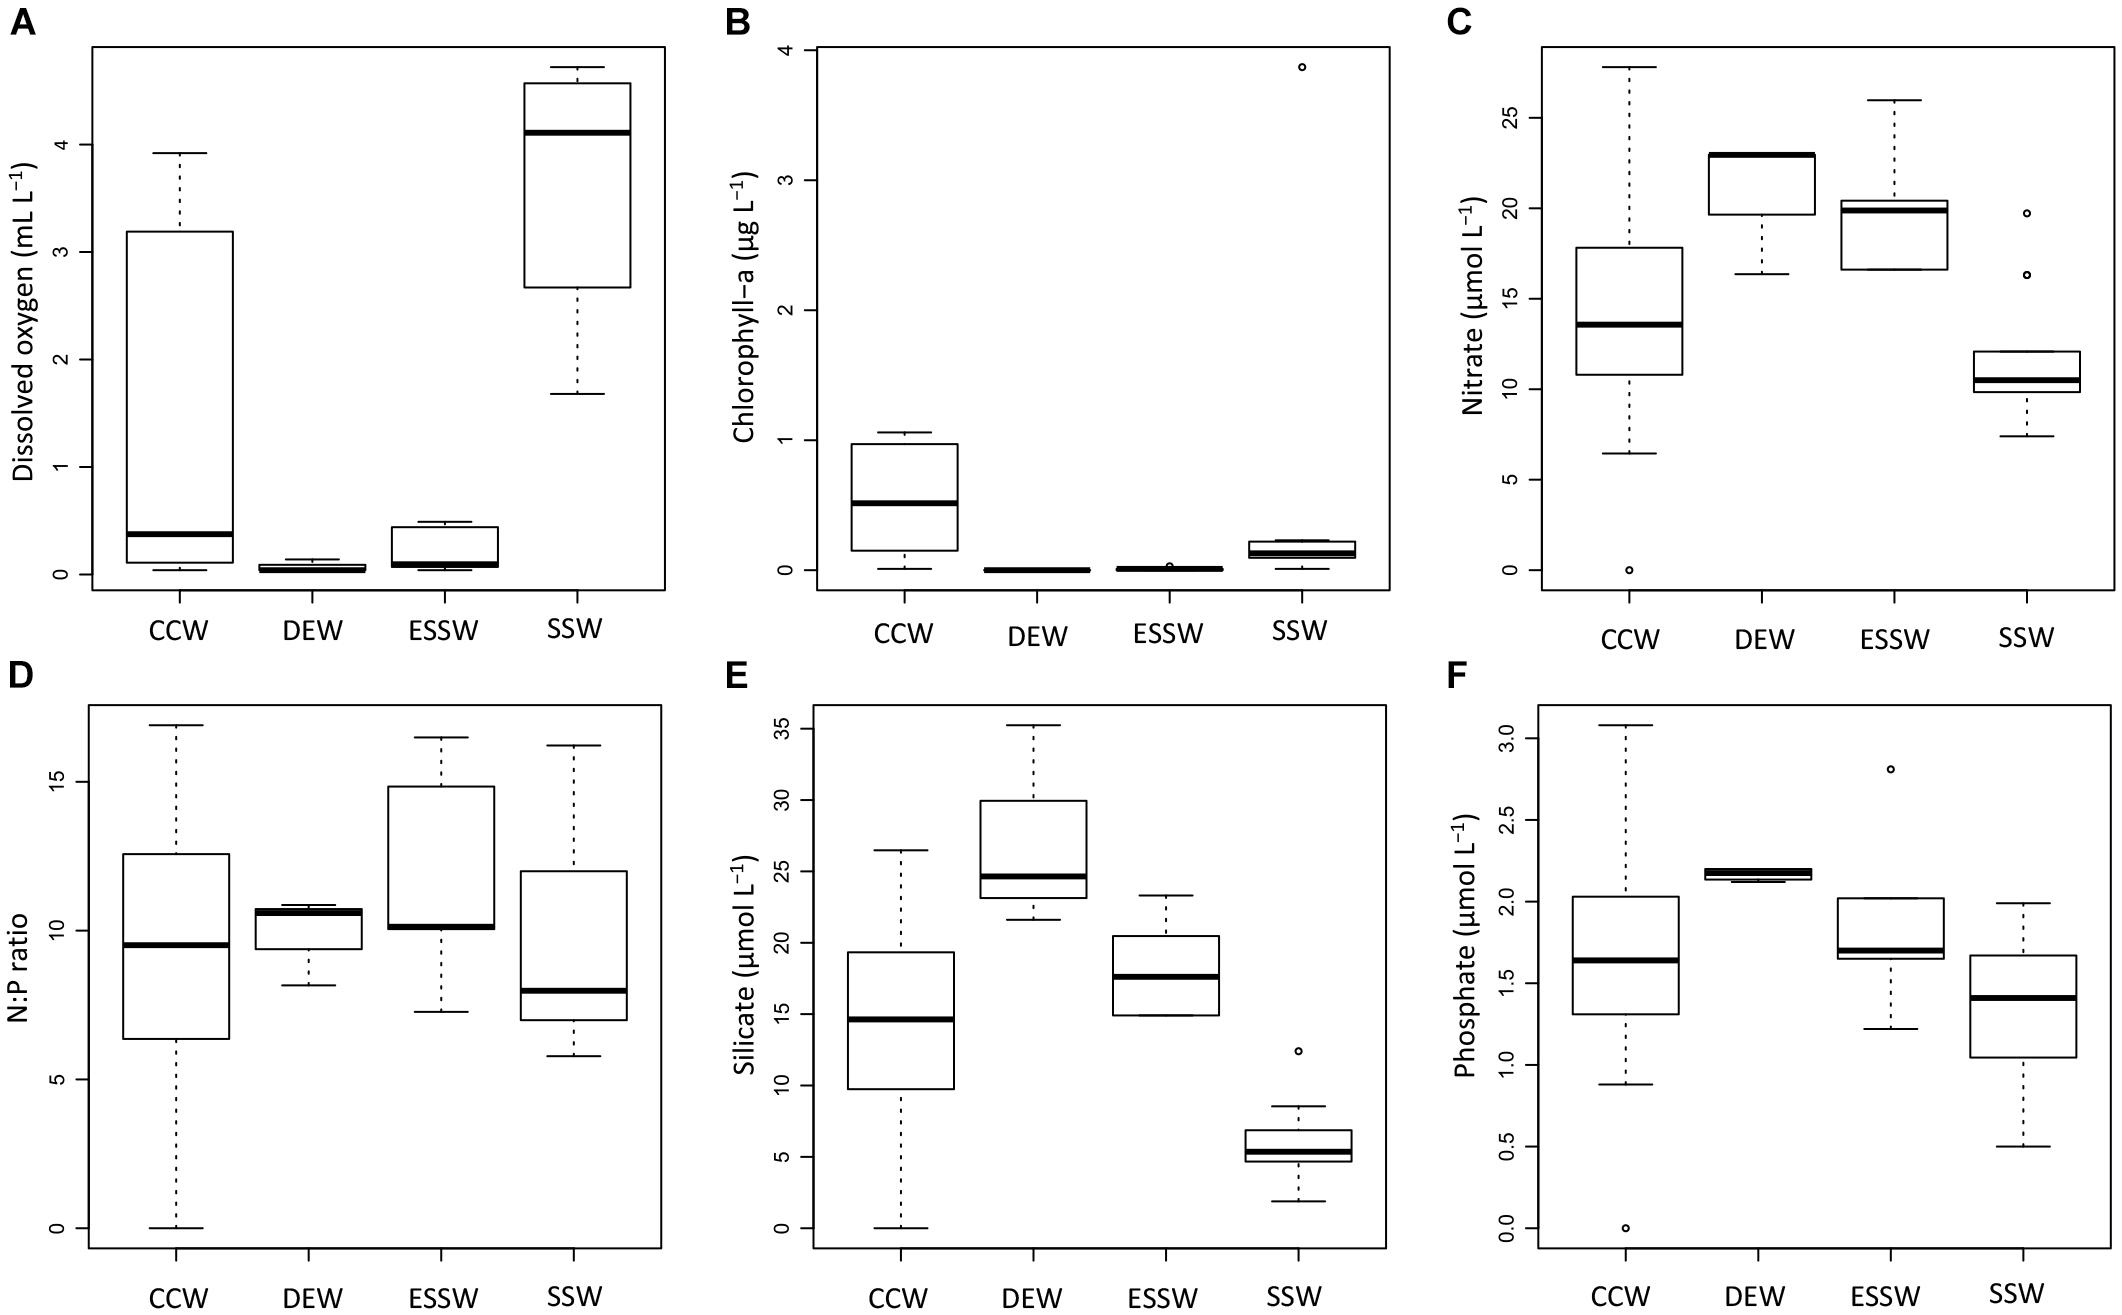
Figure 3. Box plots of chemical properties for the studied transect during 2015. Properties depicted are: dissolved oxygen (A), chlorophyll-a (B), nitrate (C), N:P ratio (D), silicate (E), and phosphate (F). CCW: Coastal Cold Waters (n = 22), DEW: Deep Equatorial Waters (n = 4), ESSW: Equatorial Subsurface Waters (n = 6), SSW: Surface Subtropical Waters (n = 15).
The observed distributions of DO and nutrient concentrations are consistent with previous reports (e.g., Strub et al., 1998; Fiedler and Talley, 2006; Silva et al., 2009; Grados et al., 2018). DO showed minimum concentrations for DEW and ESSW, and maximum concentrations for SSW (Figure 3A). ANOVA and Tukey test (Supplementary Table S2) showed that with respect to DO concentrations, only SSW was significantly different from DEW, ESSW, and also CCW. No significant differences were found between the DO concentrations of CCW, DEW, and ESSW. CCW showed high variability in DO concentration, values > 2 mL L-1 correspond to samples from station 2 from August and December, while lowest values (<0.1 mL L-1) correspond to samples from station 2 from April.
Chlorophyll-a (Figure 3B) showed minimum concentrations for the three prevailing water masses; only CCW showed increased concentrations (up to 1 μg L-1). The ANOVA test revealed no significant differences in the Chl-a concentration between CCW, SSW, DEW, and ESSW for the studied period.
With respect to nutrient concentrations, only nitrate and silicate concentrations (Figures 3C,E) showed significant differences between the prevailing water masses and CCW. No significant differences were found for the N:P ratio and phosphate concentration (Figures 3D,F). The Tukey tests (Supplementary Table S2) showed that SSW had significantly lower nitrate and silicate concentrations compared to DEW and ESSW, and the silicate concentration of CCW was significantly lower compared to DEW and SSW.
Solid-Phase Extractable Dissolved Organic Carbon (SPE-DOC)
SPE-DOC concentrations increased from April to December 2015 for all stations and depths (Figures 4A–C). This increase coincided with the approximation of the 35.1 isohaline toward the coast, which marks the presence of the SSW.
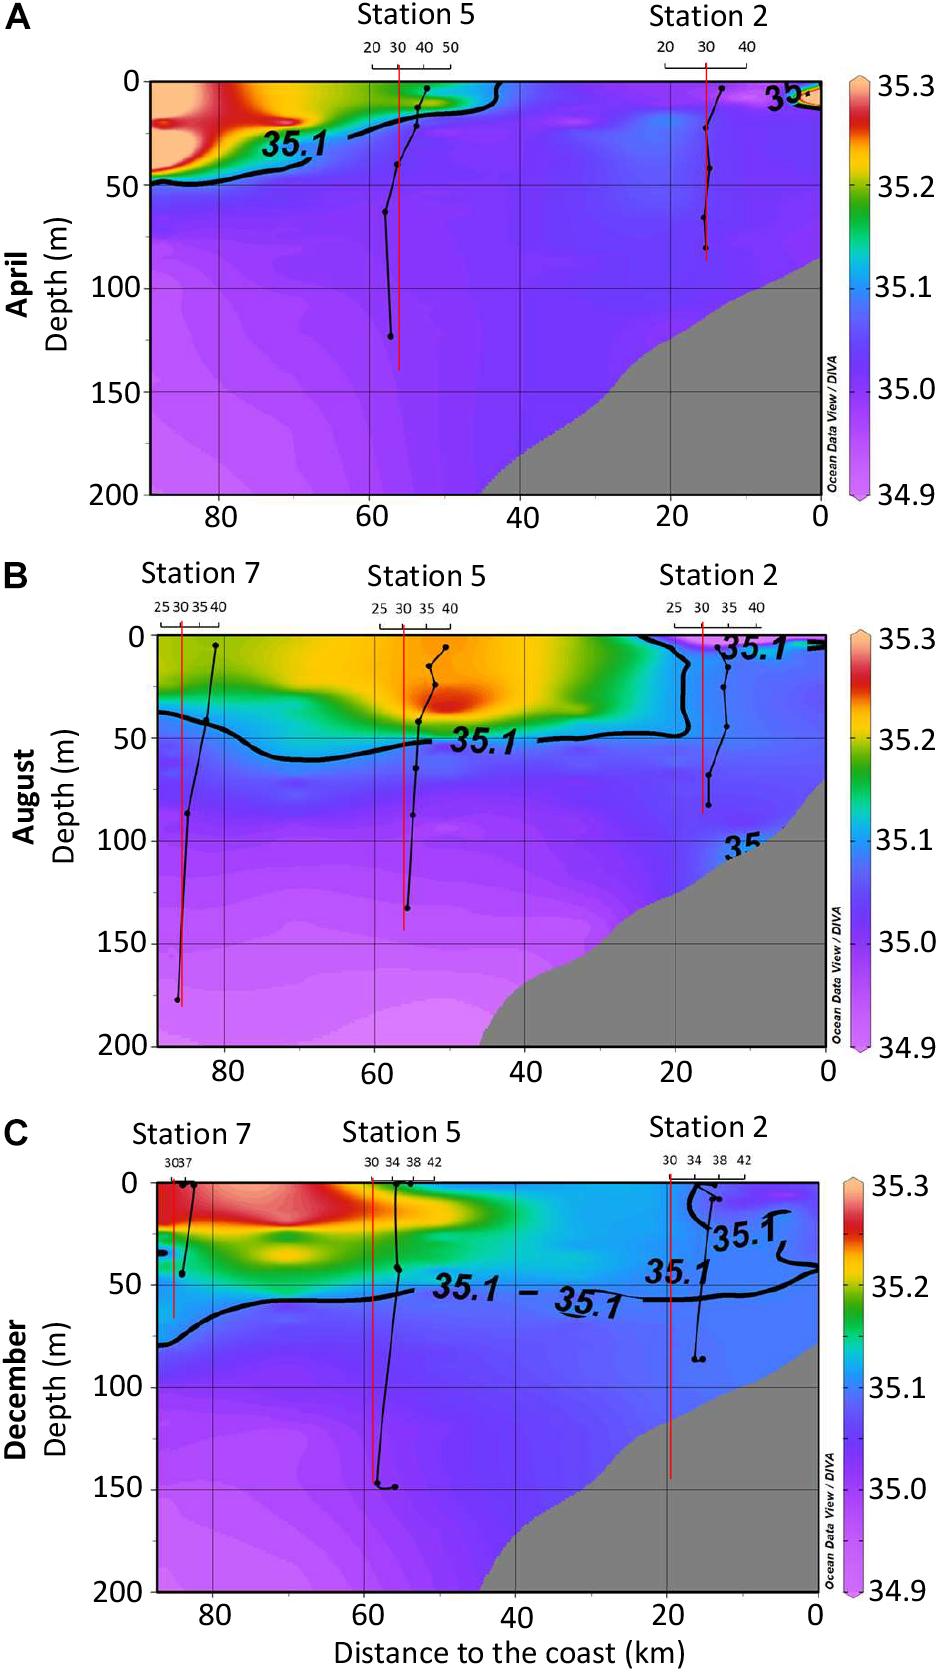
Figure 4. Solid-phase extractable dissolved organic carbon (SPE-DOC) concentrations for April (A), August (B), and December (C) 2015. The color indicates the salinity distribution (compare to Figure 2B). Black vertical lines represent the SPE-DOC concentration at the investigated stations (axis legend on top). The red vertical lines mark the limit of 30 μmol L-1; this was done only for visualization reasons. In order to achieve a better resolution of the plots, further data for deeper water depths at station 7 for August and December were omitted in the plots: August station 7 at 500 m: 27 μmol L-1; December station 7 at 499 m: 29 μmol L-1, at 500 m: 30 μmol L-1.
A correlation analysis was performed between SPE-DOC concentration and the available environmental variables (Table 2). The highest positive correlation coefficients were obtained between SPE-DOC and DO (r = 0.74), temperature (r = 0.73), salinity (r = 0.67), and pH (r = 0.65); whereas the lowest was between SPE-DOC and Chl-a (r = 0.43). SPE-DOC also correlated negatively with silicate (r = -0.69) and water depth (r = -0.57).
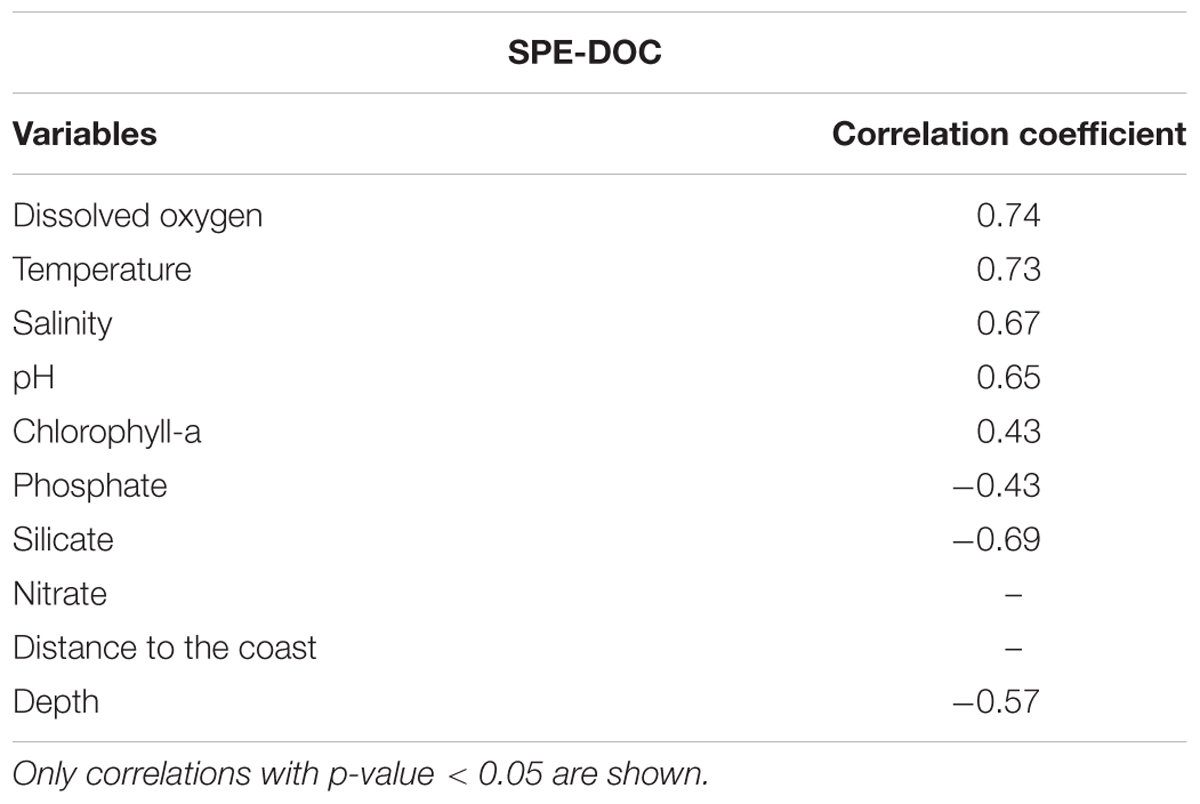
Table 2. Correlation coefficients between SPE-DOC concentration and environmental data.
Considering the positive correlations between SPE-DOC and the parameters salinity and temperature, which were used for water mass assignment, we compared the SPE-DOC concentrations of the different water masses (Figure 5). SPE-DOC increased from deeper waters (DEW, ESSW) to surface waters (SSW), while CCW (result of mixing) showed high variability in SPE-DOC concentration. The ANOVA test revealed significant differences in the SPE-DOC concentration between the water masses. The Tukey test (Supplementary Table S2) showed significant differences in SPE-DOC concentration between SSW and CCW, DEW, and ESSW; also, CCW was significantly different from DEW.
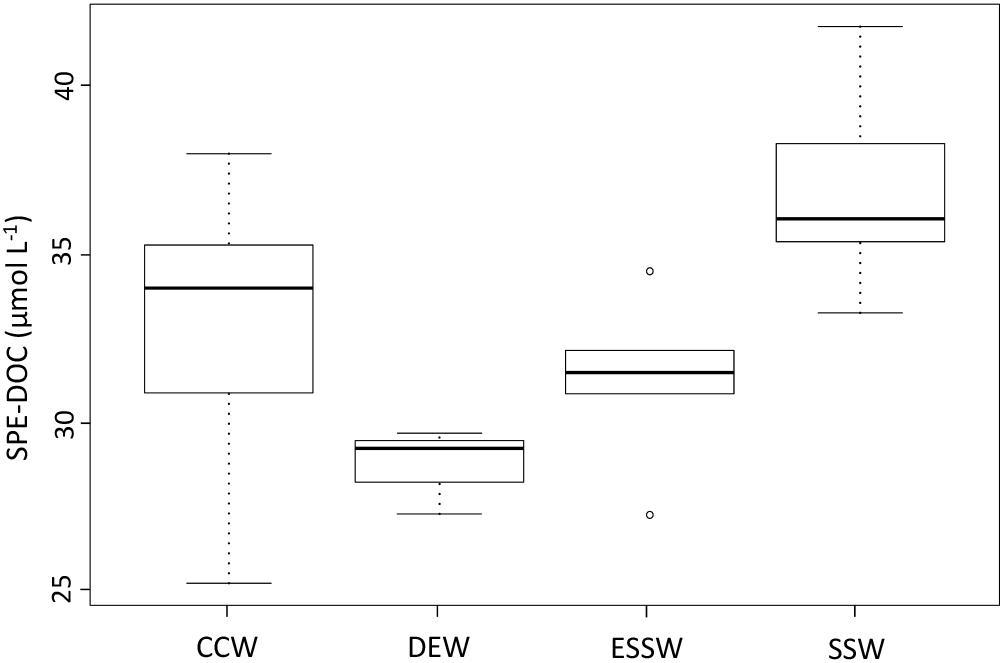
Figure 5. Solid-phase extractable dissolved organic carbon (SPE-DOC) variability between the water masses off central Peru during 2015. CCW: Coastal Cold Waters (n = 22), DEW: Deep Equatorial Waters (n = 4), ESSW: Equatorial Subsurface Waters (n = 6), SSW: Surface Subtropical Waters (n = 15).
Conservative Mixing (CM) Model
Salinity has widely been used as a tracer for water mass mixing due to its conservative distribution in the water column. The relation of any given constituent to salinity provides information on its conservative or non-conservative behavior. The observation that SPE-DOC was significantly positively correlated with temperature and salinity gave initial support to the proposed hypothesis that under low conditions of productivity (typical of an EN year) DOM dynamics is mainly affected by water mass mixing. We applied a CM model to examine whether SPE-DOC concentrations behaved conservatively with mixing of water masses. In this model, we plotted SPE-DOC concentrations (y-axis) versus salinity (x-axis) (Figure 6).
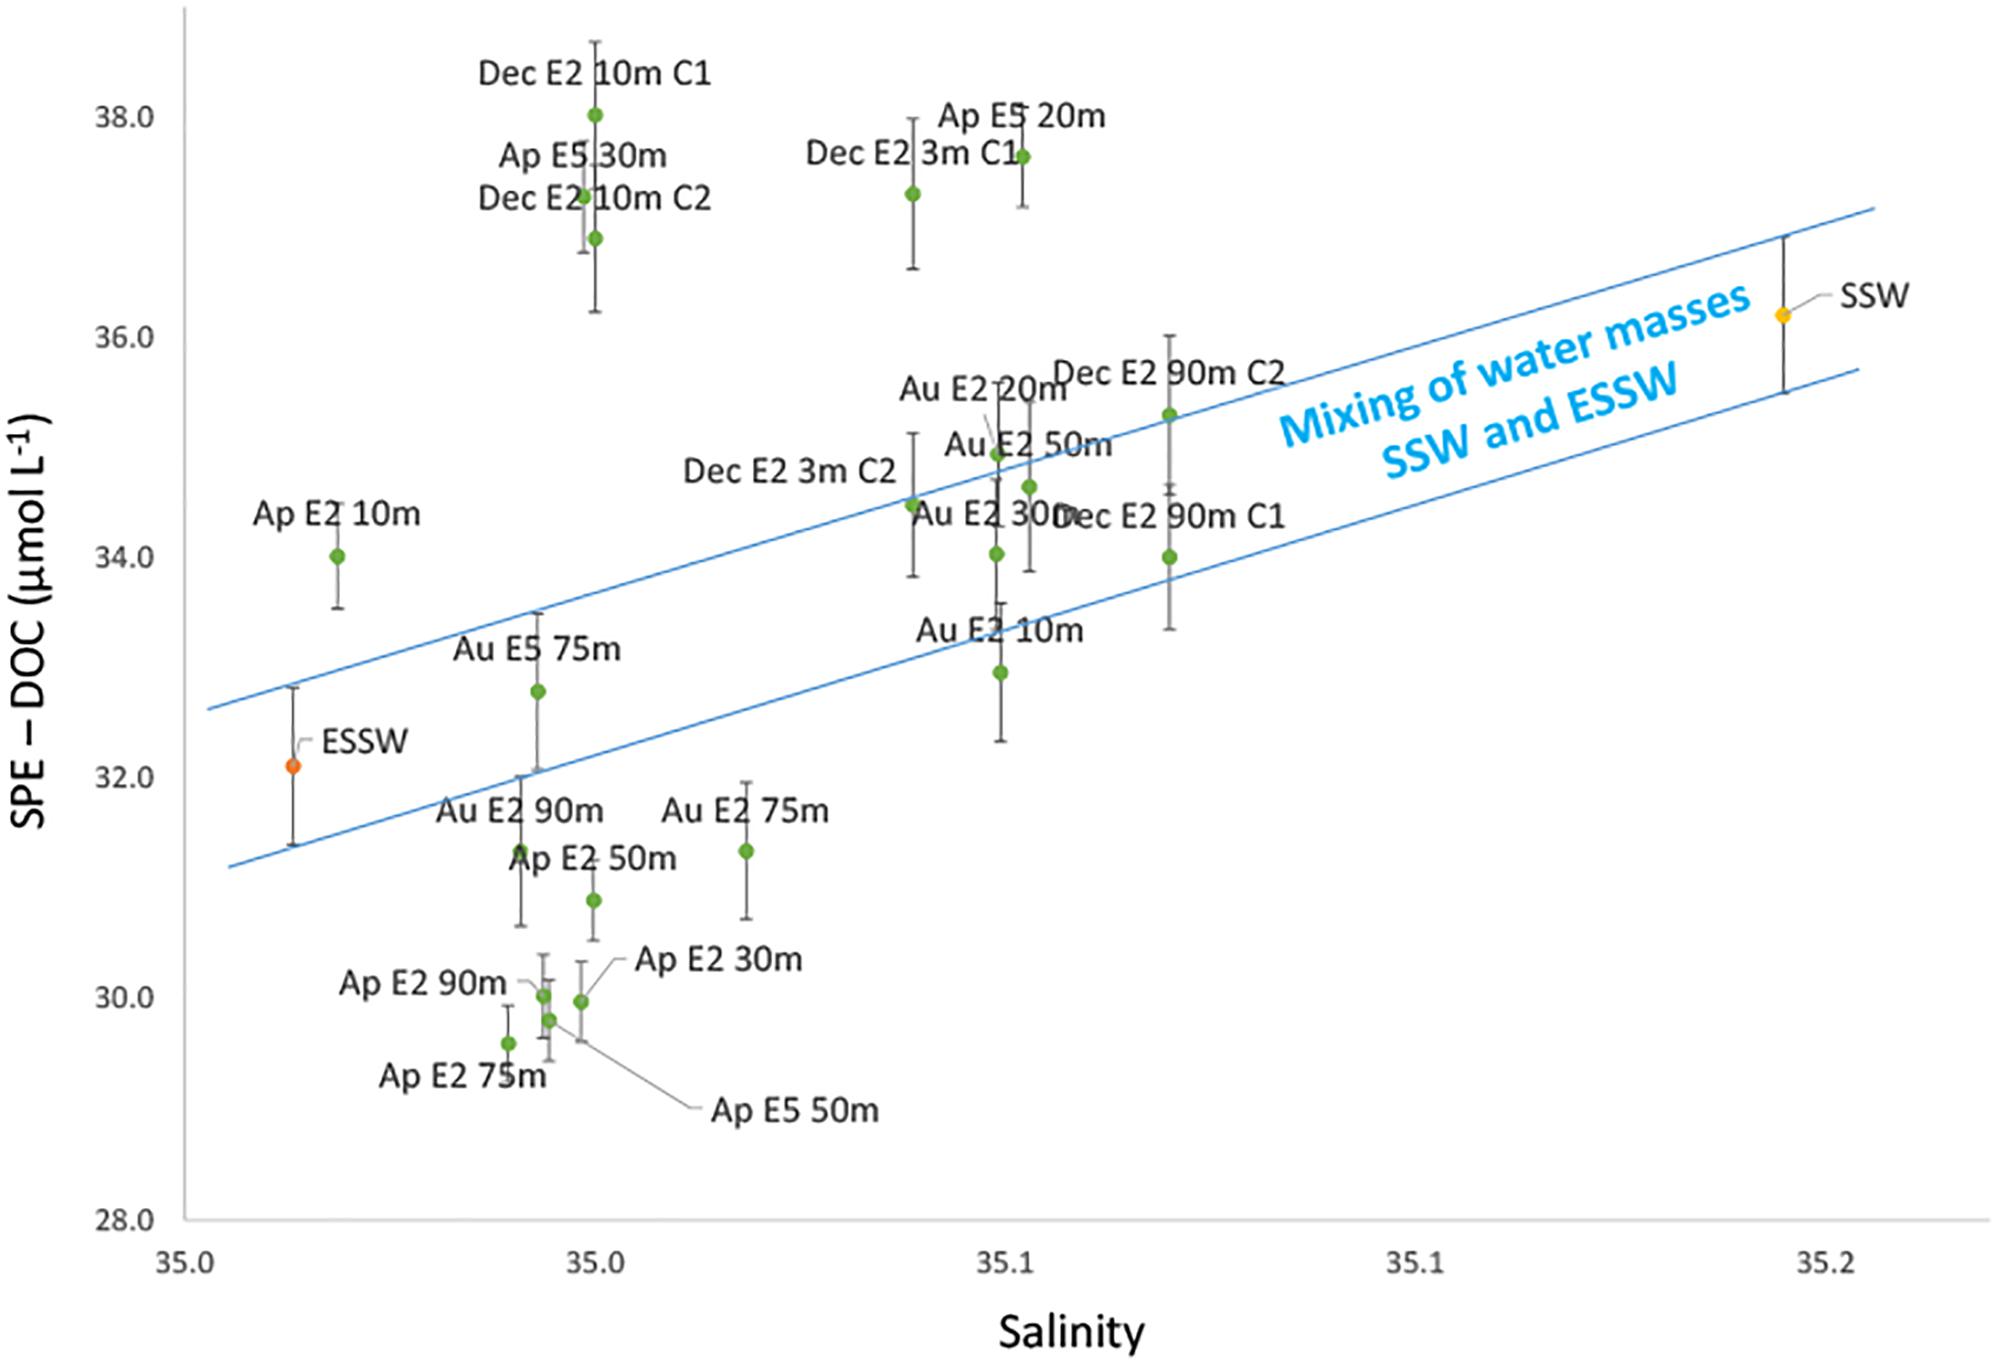
Figure 6. Conservative mixing model for SPE-DOC. The blue lines mark the range of conservative mixing of the defined end members (ESSW and SSW). Green dots represent the samples from the Coastal Cold Waters (CCW, n = 21). The orange dot is the average of the samples from the Equatorial Subsurface Waters (ESSW, n = 5) and the yellow dot the Surface Subtropical Waters (SSW, n = 13). Error bars indicate the analytical error for SPE-DOC concentrations. The samples are labeled according to month of sampling (Ap = April, Au = August, and Dec = December), distance to the coast (station 2 – E2, station 5 – E5, and station 7 – E7), and water depth.
The mixing model is based on the assumption that only advection and vertical mixing cause salinity changes off central Peru. Other processes that potentially influence salinity such as evaporation, precipitation, and river discharge are negligible for this area and have therefore been neglected (Zuta and Guillén, 1970). As CCW is the result of mixing of SSW and ESSW (source of upwelling), the latter two water masses were selected as end members of the mixing model. SPE-DOC concentrations and salinity of all the samples representing either ESSW (n = 5; orange symbol) or SSW (n = 13; yellow symbol) were averaged and defined the CM range (blue lines; Figure 6). Mixing of SSW and ESSW results in the intermediate salinity of CCW (Grados et al., 20181; Morón, 2011). The changes in salinity and SPE-DOC concentrations for the samples classified as CCW (n = 21; green symbols) can be explained by water mass mixing for all samples inside the CM range, whereas changes in salinity and SPE-DOC for the samples plotting significantly outside the mixing range indicate other non-conservative processes.
The CM model revealed a non-conservative behavior of SPE-DOC, i.e., the DOM pool during 2015 was not only affected by water mass mixing. In order to identify the processes affecting DOM cycling outside the CM range, we clustered our samples in three groups: (i) samples that plot below the CM range – group that lost SPE-DOC, (ii) samples inside the CM range –CM group, and (iii) samples above the CM range – group that gained SPE-DOC. The terms lost/gained coined for the samples below/above the CM range result from the comparison with SPE-DOC concentrations of the CM group. Overall, the group that lost SPE-DOC is formed mainly by samples from April and one sample from August, while the group that gained SPE-DOC is exclusively formed by samples from April and December. The CM group is mainly formed by samples from August.
Environmental Characterization of the Groups That Lost/Gained SPE-DOC
The environmental characterization of the samples outside the CM range (Figure 6) revealed differences for the groups that lost and gained SPE-DOC (Figures 7A–G). The samples that lost SPE-DOC were from deeper waters (30–90 m) and characterized by minimum oxygen concentrations (0.04–0.5 mL L-1, Figures 7A,B), while the samples that gained SPE-DOC were limited to the upper water layer (0–30 m) and characterized by more ventilated conditions (DO from 0.2 to 3.8 mL L-1). Both water depth and DO concentration showed significant differences between the groups (Fisher test and Student t-test, p < 0.05).
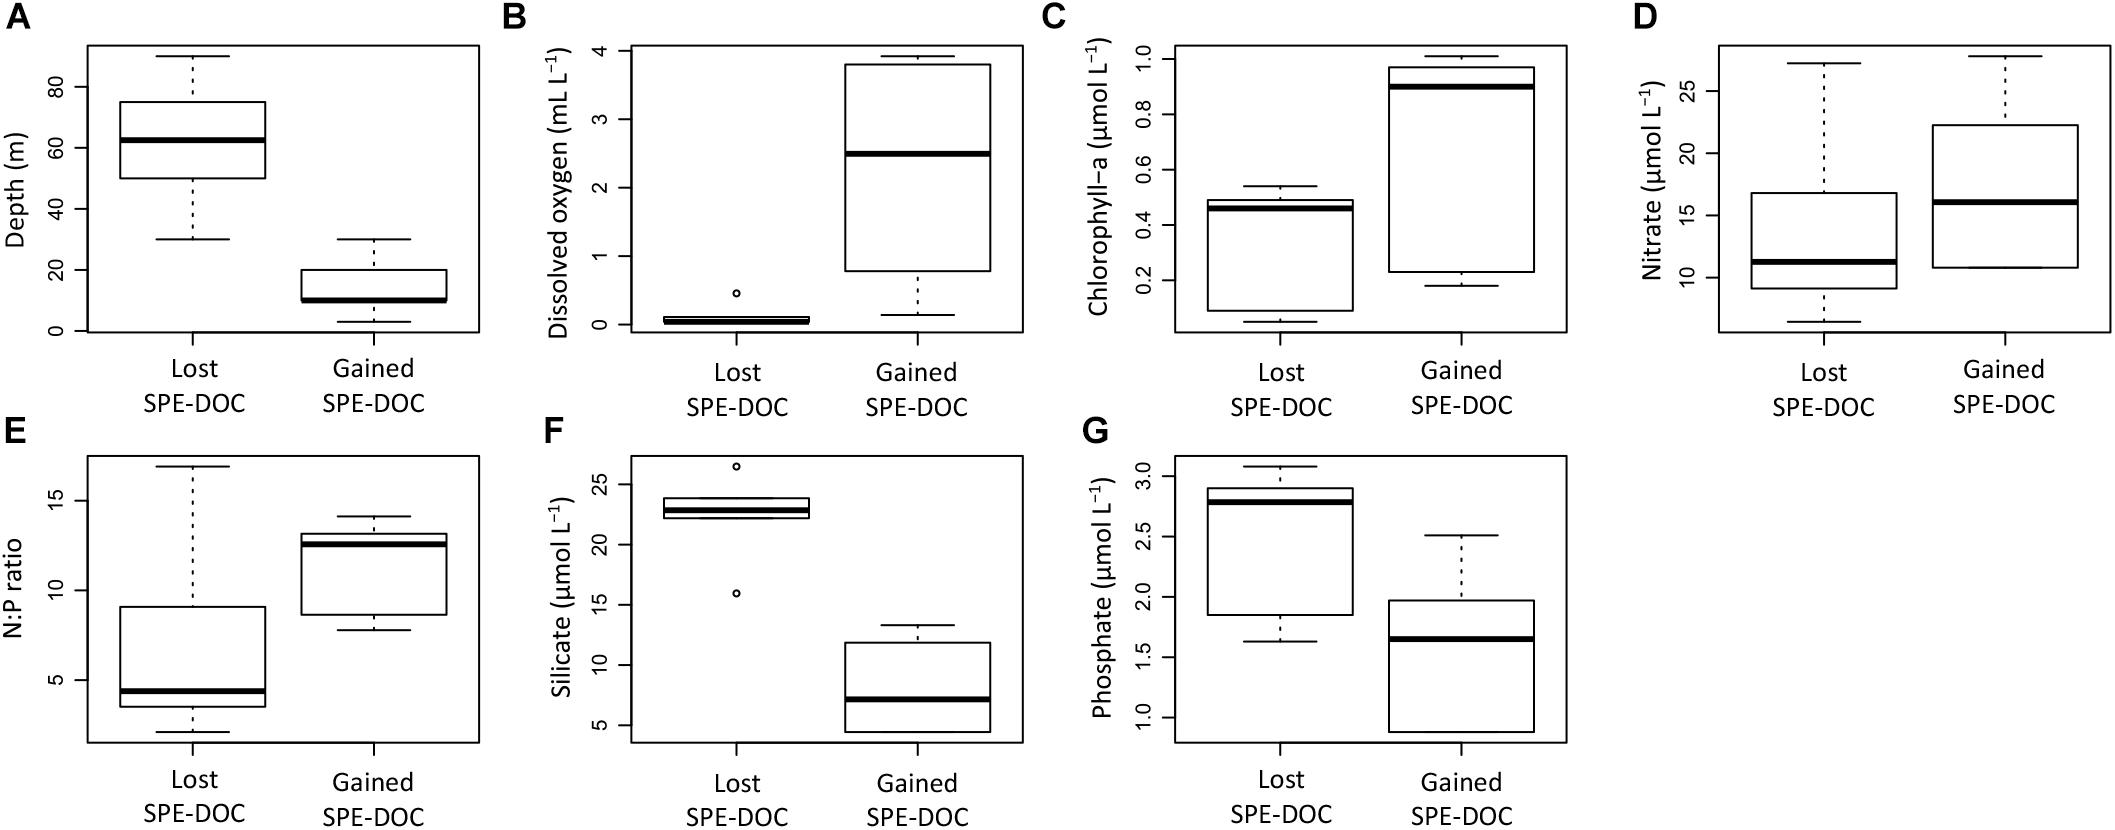
Figure 7. Comparison of environmental parameters between the group of samples that lost SPE-DOC (n = 6) and the group of samples that gained SPE-DOC (n = 6). The environmental parameters depicted are water depth (A), dissolved oxygen (B), chlorophyll-a (C), nitrate (D), N:P ratio (E), silicate (F), and phosphate (G).
Chlorophyll-a concentrations, nitrate concentrations, and the N:P ratio were by trend higher in the group that gained SPE-DOC; nevertheless, no significant differences were found when compared to the group that lost SPE-DOC (Figures 7C–E). Silicate and phosphate concentrations (Figures 7F–G) showed significant differences between the groups (Fisher test and Student t-test, p < 0.05), with higher concentrations of both nutrients in the group that lost SPE-DOC compared to the group that gained SPE-DOC.
Molecular Characterization of the Groups That Lost/Gained SPE-DOC
The molecular characterization of DOM in the groups that lost/gained SPE-DOC and the CM group identified a total of 13,724 MF. In order to reveal differences in the DOM molecular composition between the groups, we examined the relative signal intensity of each identified MF. Multiple Student’s t-tests (confidence level = 0.001) were performed for each MF between the groups of samples. This analysis revealed a total of 315 MF that were significantly decreased (p < 0.05) in intensity in the group that lost SPE-DOC (n = 6) compared to the CM group (n = 27), and 254 MF that were significantly increased (p < 0.05) in intensity in the group that gained SPE-DOC (n = 6) compared to the CM group (n = 27). At this significance level, the total number of MF that were significantly decreased and increased in intensity with respect to the CM group represented 4% of the total number of MF. We interpret the significant decrease or increase in intensity of a specific MF as a result of consumption/degradation or production/release of specific molecules.
In order to overcome the multiple comparisons problem that arises when multiple individual tests are performed (Miller, 1981), we compared the outcome of our analyses with the outcome of the same analyses based on randomized data. The multiple Student’s t-tests performed in the randomized data revealed that the number of MF that significantly decreased or increased between groups of samples was higher when compared to the results obtained for the real dataset (Supplementary Table S3). Only for a significance level with p-value < 0.05, results from the analysis of the real data were significantly different from results based on the randomly generated dataset. However, this only holds true for the number of significantly decreased/increased MF. When considering the molecular properties (e.g., H/C ratio, O/C ratio) of the MF that significantly decreased/increased between the groups that lost/gained SPE-DOC and the CM group, the trends revealed were not random in the real dataset, in contrast to the molecular properties in the random dataset (Supplementary Figure S3).
The MF that were significantly decreased contributed less to the total intensity in the group that lost SPE-DOC when compared to the CM group (Figure 8A); in the same way, the MF that were significantly increased contributed more to the total intensity in the group that gained SPE-DOC when compared to the CM group (Figure 8B).
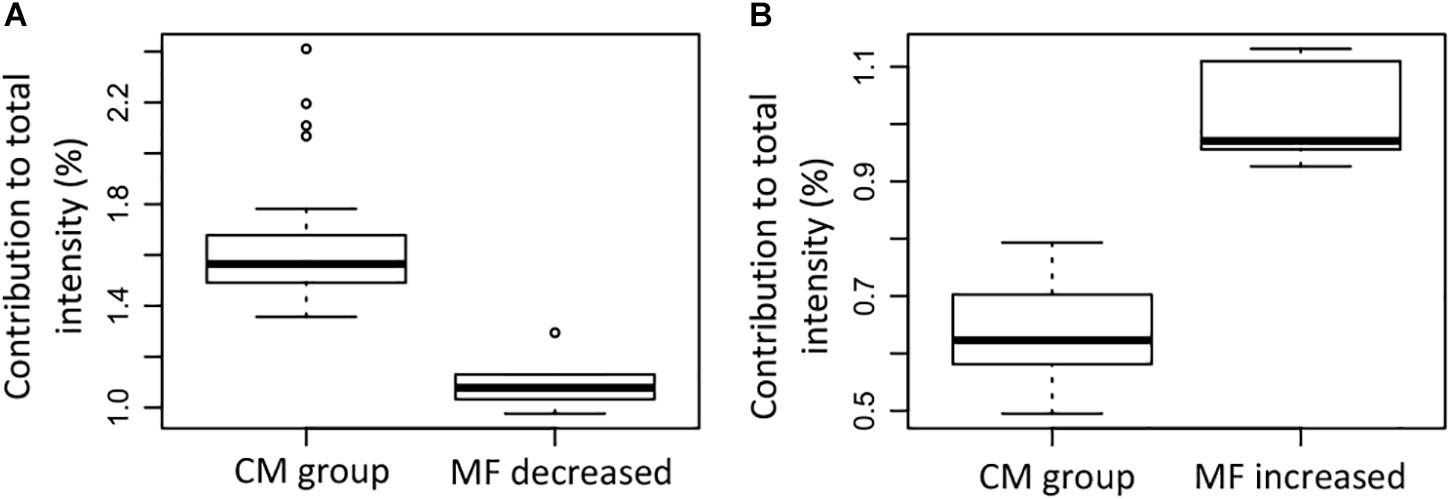
Figure 8. Contribution to the total signal intensity of the (A) molecular formulae (MF) that were significantly decreased in the samples that lost SPE-DOC (n = 6) compared to the conservative mixing group (n = 27), and (B) the MF that were significantly increased in the samples that gained SPE-DOC (n = 6) compared to the conservative mixing group (n = 27). CM group: conservative mixing group.
The molecular characteristics of the significantly decreased/increased MF and the MF in the CM group showed differences in mass range, elemental composition, molecular indices, and assigned molecular classes (Figures 9–11). The MF that were significantly decreased were on average lower in mass and contained a lower number of carbon and hydrogen when compared to the CM group and the MF that significantly increased (Figures 9A–C). The ANOVA and Tukey test confirmed significant differences between all the groups for the number of carbon and hydrogen, whereas the observed difference in mass was not significant between the MF that were increased and the CM group (p < 0.05, Supplementary Table S4).
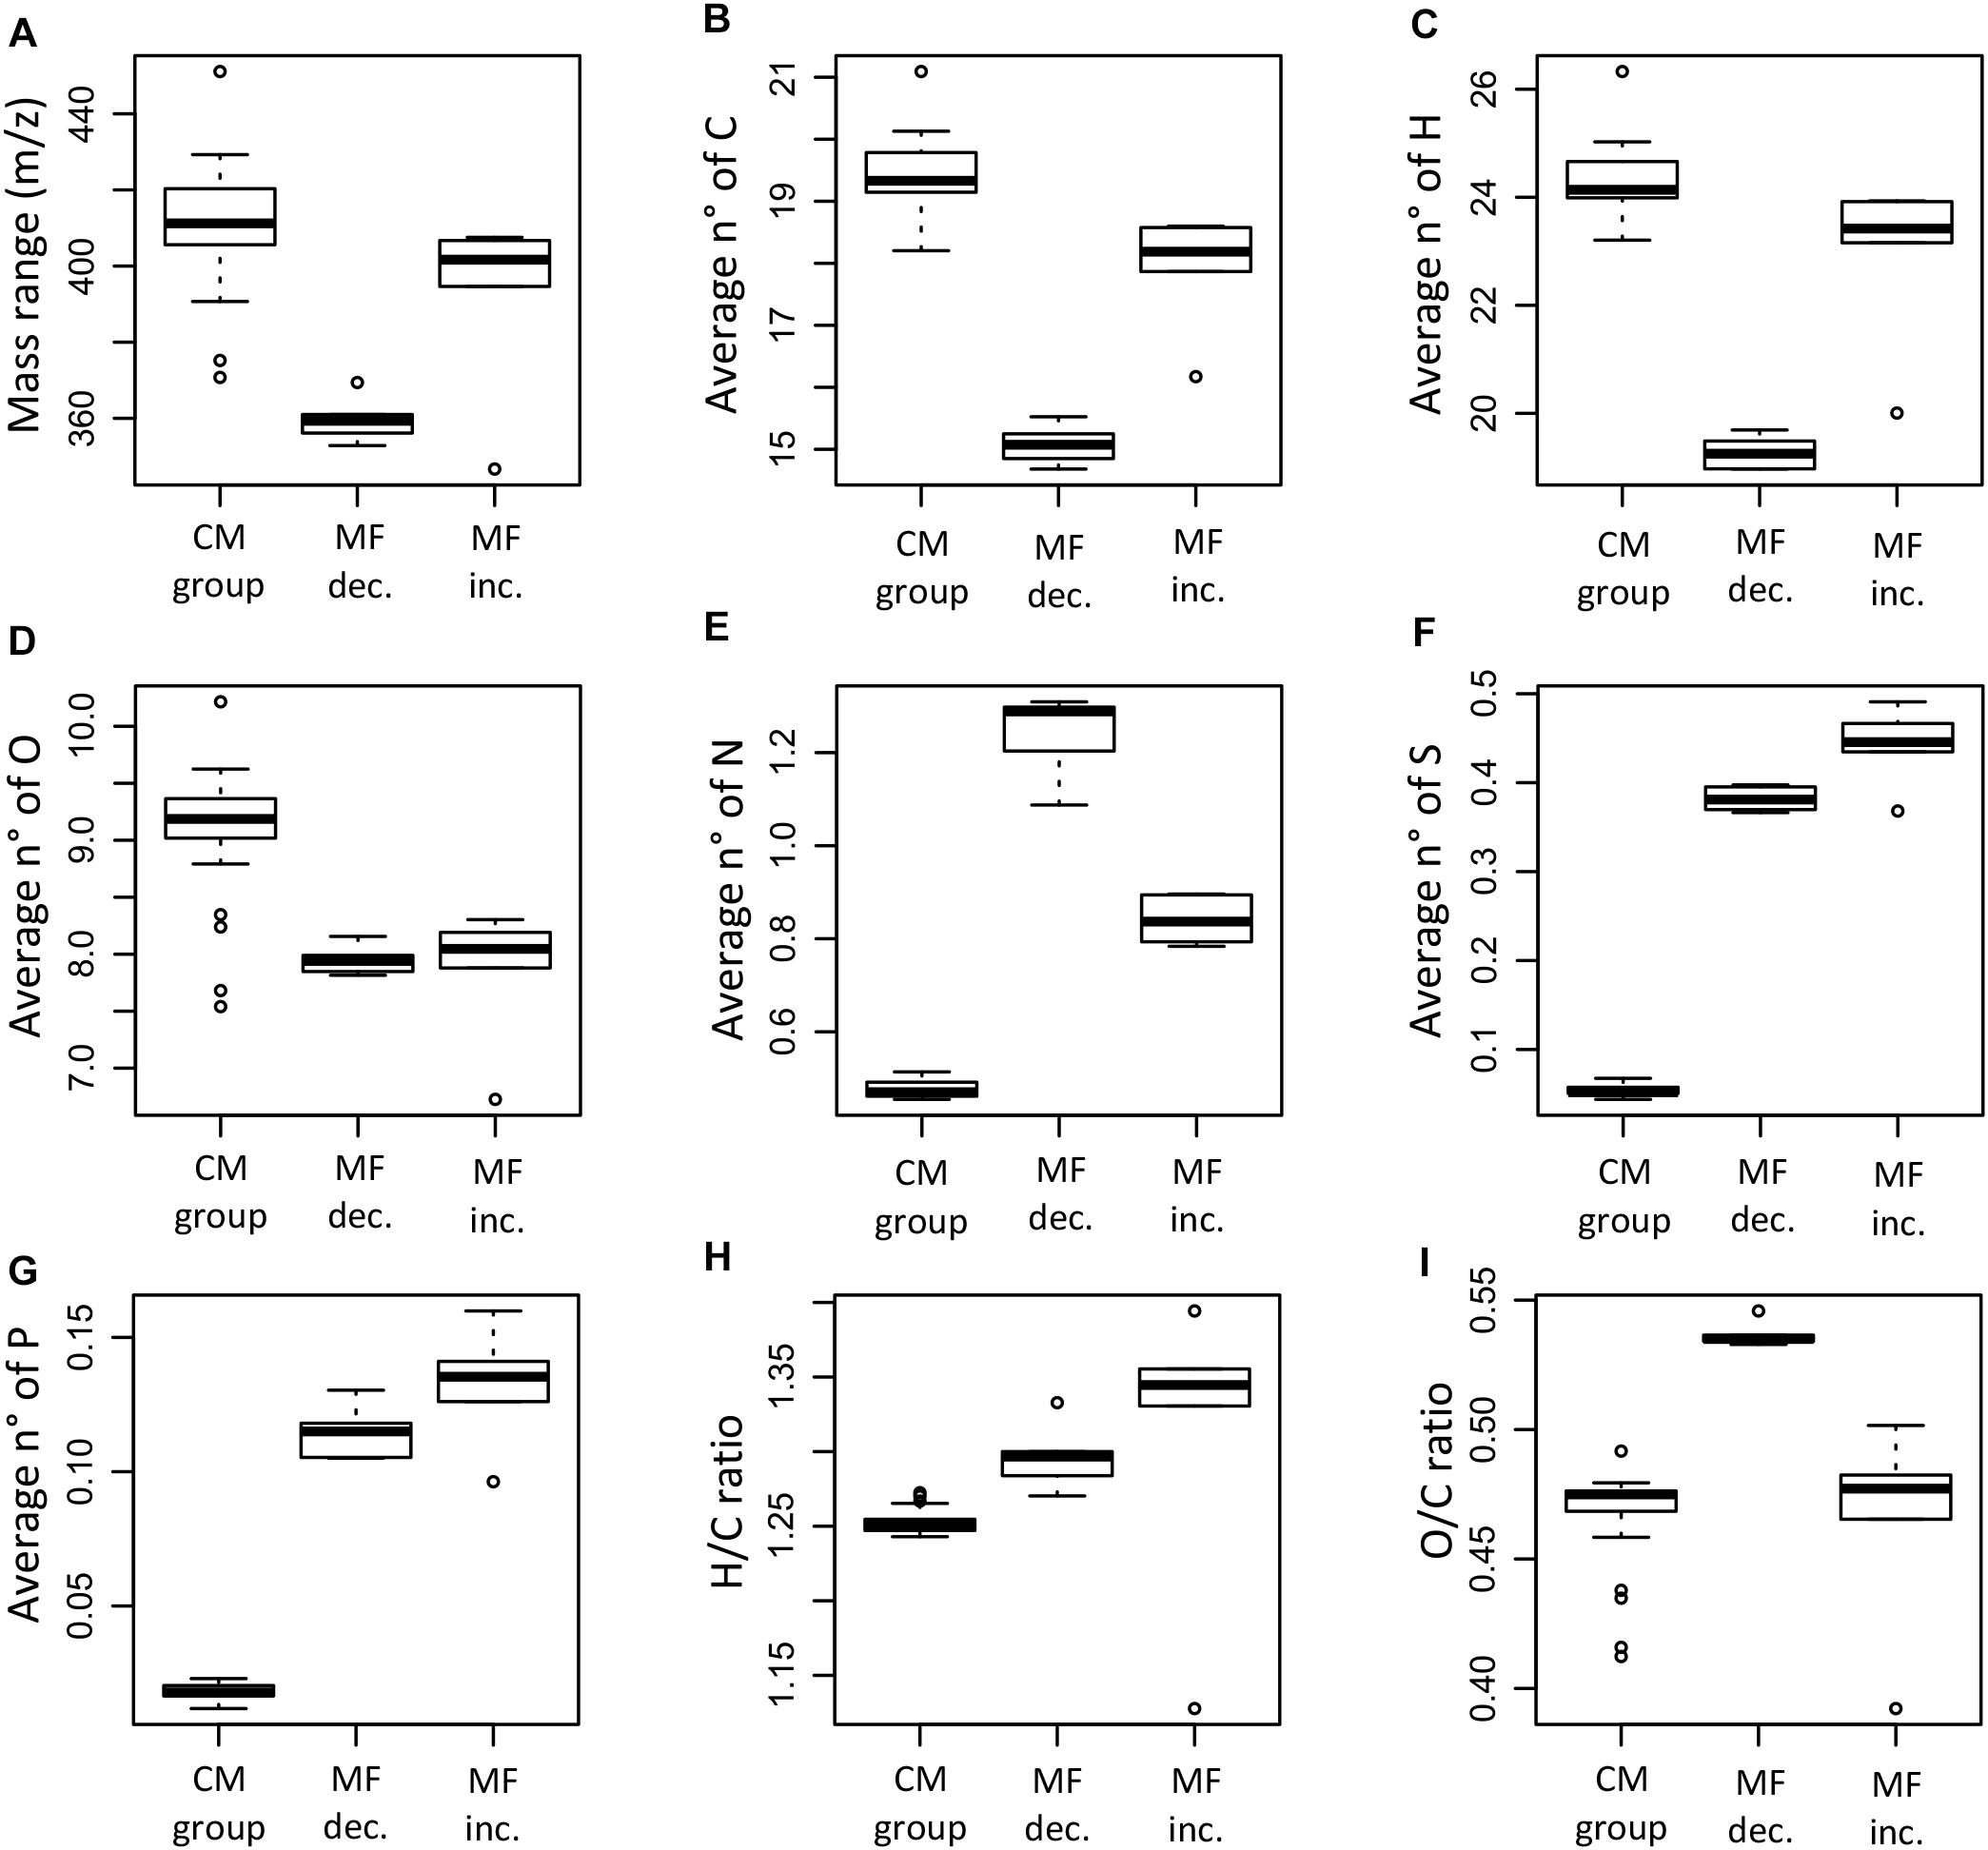
Figure 9. Box plots summarizing and comparing the average mass range (A), number of carbon (B), hydrogen (C), oxygen (D), nitrogen (E), sulfur (F), phosphorus (G), H/C ratio (H), and O/C ratio (I) of the molecular formulae that significantly decreased (MF dec., n = 315), the molecular formulae that significantly increased (MF inc., n = 254), and the molecular formulae in the conservative mixing group (CM group, n = 13,462). The information corresponds to the averages weighted by FT-ICR-MS signal intensity for each of the samples.
The elemental ratios H/C and O/C showed significant differences between the groups (ANOVA test, p < 0.05). The MF that increased had generally higher H/C ratios compared to the MF that decreased and the CM group (Figure 9H); significant differences were found between the H/C ratio of the increased MF and the CM group (Supplementary Table S4). In the case of the O/C ratio, the MF that decreased had significantly higher ratios compared to the MF that increased and the CM group (Figure 9I). Differences in elemental composition were also reflected in the AImod and the DBE (Figures 10A,B). There were significant differences for both AImod and DBE between the MF that were decreased/increased and the CM group (Supplementary Table S4), with MF that decreased exhibiting the lowest values for both AImod and DBE (Figures 10A,B).
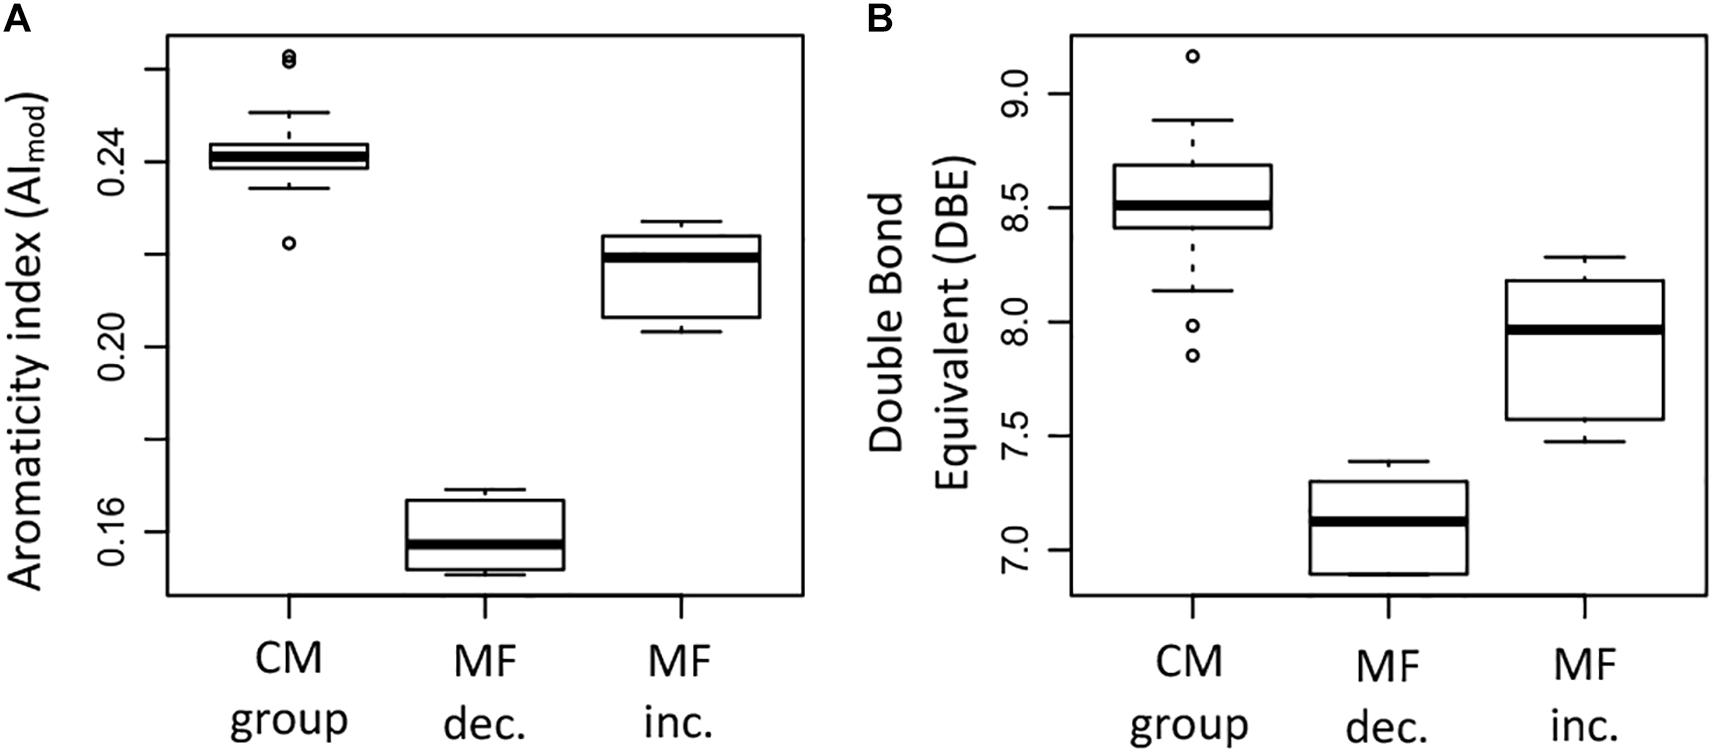
Figure 10. Box plots summarizing and comparing (A) the modified aromaticity index (AImod) and (B) the double bond equivalent (DBE) of the molecular formulae that significantly decreased (MF dec., n = 315), the molecular formulae that significantly increased (MF inc., n = 254), and the molecular formulae in the conservative mixing group (CM group, n = 13,462). The information corresponds to the averages weighted by FT-ICR-MS signal intensity for each of the samples.
The relative abundance of MF assigned to different molecular classes (Figures 11A–E) showed a strong predominance of unsaturated aliphatics and sugar-like formulae in the MF that increased when compared to the MF that decreased and the CM group, e.g., 24% of the MF that increased corresponded to unsaturated aliphatics (Table 3). Significant differences were found in the relative abundance of these molecular classes between the groups compared (ANOVA and Tukey test, p < 0.05, Supplementary Table S4). In addition to the MF that significantly decreased in intensity (n = 315), we also identified a total of 840 MF that were absent in the samples that lost SPE-DOC but present in the CM group (Table 3). From the MF that were decreased in intensity, 54 and 13% corresponded to N-containing compounds and peptide-like formulae, respectively; similar percentages were reported for the MF absent (58% N-containing compounds and 12% peptide-like formulae). In the case of aromatic compounds, the difference was bigger. From the MF that were decreased, 4% were aromatics, while among the absent MF, 17% corresponded to aromatics.
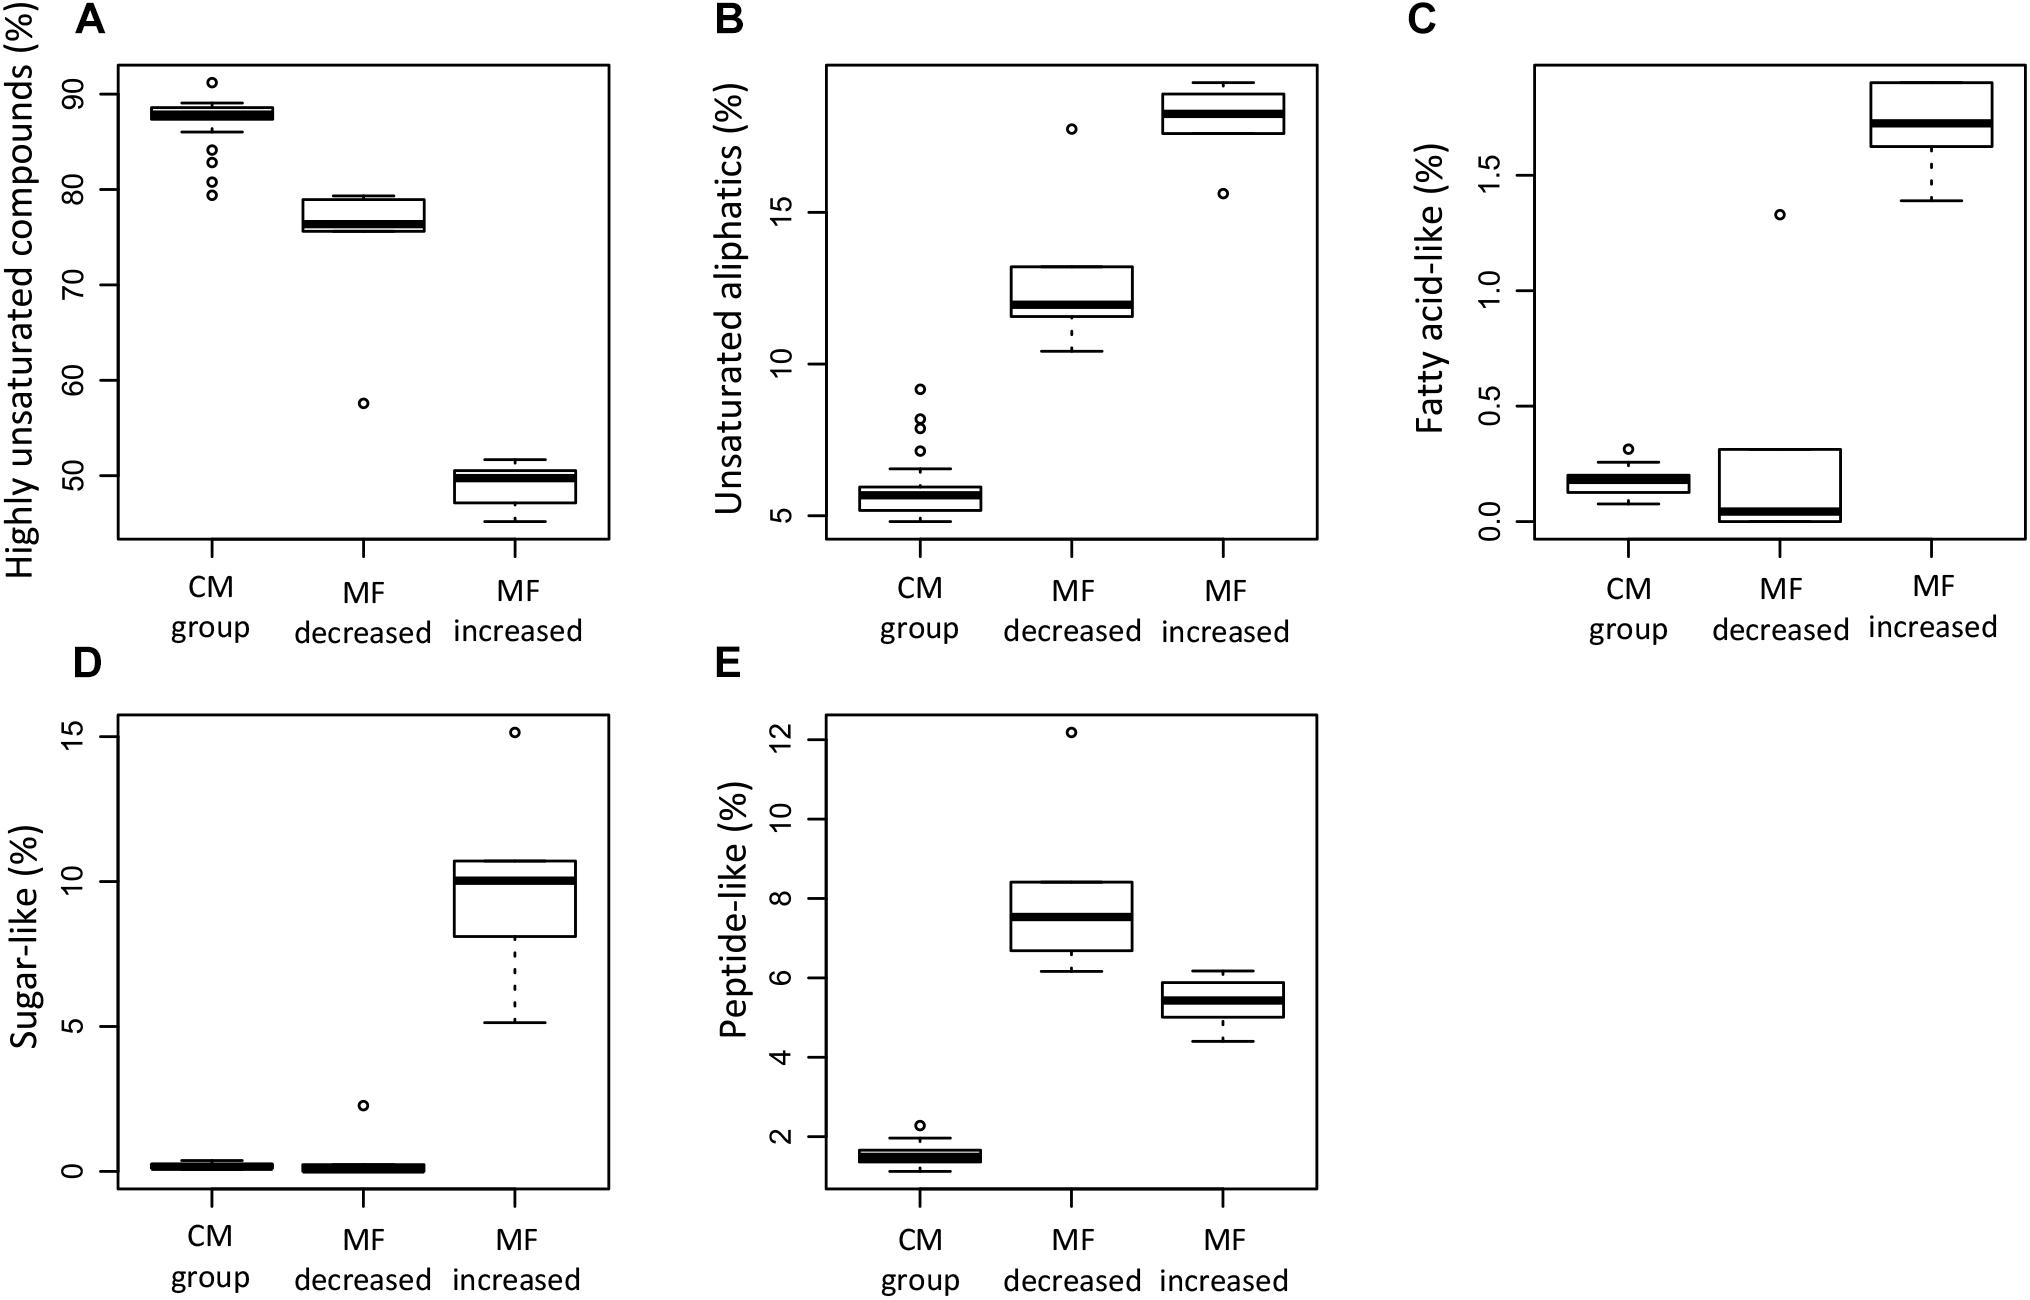
Figure 11. Box plots summarizing the relative abundance of specific DOM molecular classes of the molecular formulae that significantly decreased (MF dec., n = 315), the molecular formulae that significantly increased (MF inc., n = 254), and the molecular formulae in the conservative mixing group (CM group, n = 13,462). The information corresponds to the averages weighted by FT-ICR-MS signal intensity for each of the samples. The DOM molecular classes shown correspond to highly unsaturated compounds (A), unsaturated aliphatics (B), fatty acid-like (C), sugar-like (D), and peptide-like (E). For definition of DOM molecular classes, please refer to section molecular analysis of DOM in materials and methods.
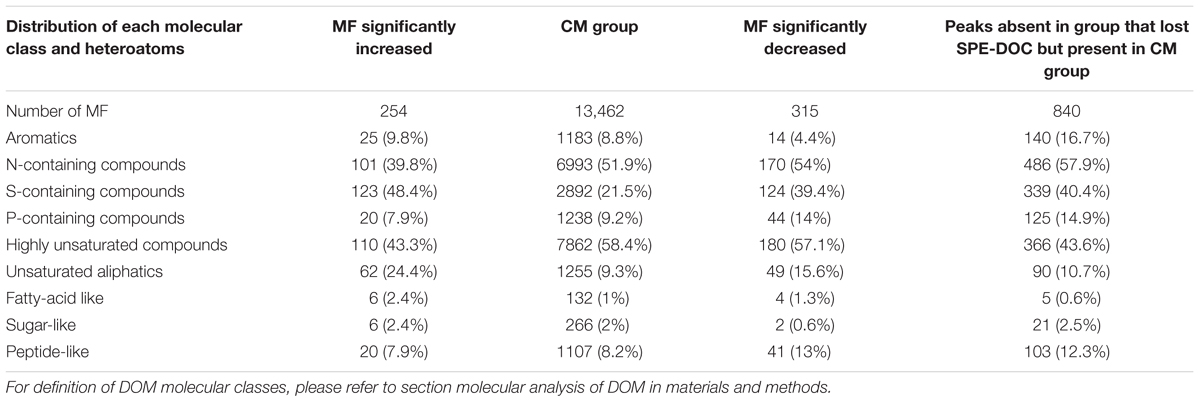
Table 3. Comparison of molecular DOM composition showing the distribution of each class of molecules among the different classes of DOM for the molecular formulae (MF) that significantly increased between the group that gained SPE-DOC (n = 6) and the conservative mixing group (CM group, n = 27), and the molecular formulae (MF) that significantly decreased between the group that lost SPE-DOC (n = 6) and the conservative mixing group (CM group, n = 27).
Discussion
Processes Affecting DOM Cycling Outside the Conservative Mixing Range
Different processes affect the concentration and composition of DOM. The most prominent DOM sources are extracellular release by phytoplankton, release via cell lysis, and solubilization of detrital and sinking particles (Carlson and Hansell, 2014). Important sinks for DOM are biotic consumption and abiotic removal processes (e.g., photodegradation) (Carlson and Hansell, 2014).
The environmental parameters that characterized the group of samples that gained SPE-DOC and the group of samples that lost SPE-DOC can be related to processes that add and remove SPE-DOC. For the group that lost SPE-DOC (water depths: 30–90 m) minimum oxygen concentrations, increased silicate and phosphate concentrations and lower Chl-a concentrations are consistent with a scenario of SPE-DOC loss due to remineralization of organic matter. Off central Peru, high silicate concentrations in subsurface waters are associated with higher phosphate concentrations and reflect organic matter remineralization at these depths (Graco et al., 2017). Loginova et al. (2016), who studied the cycling of optically active DOM off central Peru in a transect between 12 and 13°S, proposed the presence of a more degraded/refractory component of the colored DOM (CDOM) pool deeper in the water column off central Peru as a result of microbial reworking of labile DOM. Pantoja et al. (2009) proposed active DOM processing in subsurface waters of the OMZ off the northern Chilean coast.
For the group of samples that gained SPE-DOC, shallower water depths, oxic conditions, lower silicate concentrations, and higher Chl-a concentrations suggest that the increase in SPE-DOC concentrations is linked to increased primary production. Off central Peru, silicate is the first nutrient that gets depleted and can even become limiting for phytoplankton growth (Graco et al., 2007). Low silicate concentrations characterizing the group that gained SPE-DOC, together with high Chl-a concentrations, are consistent with a scenario of increased DOM production by phytoplankton and associated microbial communities. This is also in agreement with findings of Loginova et al. (2016), who reported the accumulation of DOC for the upper part of the water column (0–20 m), and an increase in CDOM concentrations toward the surface, indicating the production of DOM very likely by phytoplankton.
Under typical conditions of high primary production off central Peru (non-EN years), low nitrate concentrations prevail near the sea surface, particularly during summer and autumn, due to efficient uptake by phytoplankton (Graco et al., 2017). At the time of our study in 2015, increased nitrate concentrations and N:P ratios characterized the group of samples that gained SPE-DOC originating from shallower water depths when compared to the group that lost SPE-DOC. In a time series analysis of the nitrogen deficit off central Peru from 1996 to 2011 performed by Graco et al. (2017), low nitrogen deficit was associated to EN years. Deviations toward lower N:P ratios off central Peru are not only driven by organic matter degradation or phytoplankton grazing, but also reflect nitrogen loss (as N2, N2O) through processes such as denitrification and annamox that are related to the intensity of the OMZ (Hamersley et al., 2007; Lam and Kuypers, 2011). Therefore, the distribution of both nitrate concentrations and N:P ratio in the group of samples that lost/gained SPE-DOC can be explain by (i) lower nitrate consumption in surface waters due to decreased productivity that characterizes EN conditions and (ii) reduction of nitrogen loss processes in the water column, which decrease during EN years due to better ventilation of the OMZ (Dale et al., 2017).
Based on the above, we consider phytoplankton primary production in surface waters and microbial degradation coinciding with minimum DO conditions the main processes affecting SPE-DOC concentrations during 2015. Assuming that production and degradation of DOM are selective, these processes potentially leave an imprint in the molecular composition of DOM, as observed in previous studies (e.g., Seidel et al., 2015; Osterholz et al., 2016; Rossel et al., 2016).
DOM Molecular Composition
Although there were no significant differences in the number of MF that were significantly decreased or increased in intensity when comparing the real data to an artificially generated dataset (in order to overcome the multiple comparisons problem), there were significant trends in molecular properties of the MF that were either decreased or increased in intensity between the identified groups of samples. These trends point to a distinct molecular imprint that production and degradation processes leave in the DOM pool, consistent with the trends observed for the environmental parameters characterizing the groups that lost/gained SPE-DOC.
The lower average mass and lower average number of carbon and hydrogen of the MF that decreased in intensity between the samples that lost SPE-DOC and the CM group (Figures 9A–C) indicate a preferential degradation of low molecular weight compounds. This is an apparent contradiction to the size-reactivity continuum concept (Amon and Benner, 1996) proposing that organic matter reactivity decreases along a continuum of decreasing sizes. However, this concept is based on the observation that the bulk of high molecular weight DOM is more bioreactive compared to the bulk of low molecular weight DOM, and other studies have shown a preferential bacterial utilization of low molecular weight over high molecular weight DOM (Covert and Moran, 2001; Khodse and Bhosle, 2011). The higher O/C ratio that characterized the MF that decreased in intensity (Figure 9I) is consistent with findings that biodegradation selectively removes compounds with higher O/C ratio (Kim et al., 2006).
Further evidence for microbial DOM degradation as the main driver of molecular changes is provided by the high proportion of peptide-like formulae and N-containing compounds that either decreased in intensity or were absent in the group that lost SPE-DOC when compared to the CM group (Table 3). Since the group of samples that lost SPE-DOC coincided with minimum oxygen conditions (Figure 7B), the decrease in intensity and complete loss of peptide-like and N-containing MF could be related to DOM degradation in low oxygen waters, where active peptide hydrolysis has been proposed as a prevalent degradation process (Pantoja et al., 2009).
Microbial remineralization plays an important role in DOM degradation, but abiotic photochemical transformation has also been identified as a prominent DOM sink (Carlson and Hansell, 2014). Photodegradation is restricted to the sunlit surface waters where dissolved molecules absorb sunlight, which can result in partial or complete remineralization of molecules (Mopper et al., 1991, 2014). This abiotic transformation preferentially removes aromatic compounds from the DOM pool (Stubbins et al., 2010), diminishing DBE and AImod values, which are indicative for aromatic structures (Koch and Dittmar, 2006). The MF that were significantly decreased between the group that lost SPE-DOC and the CM group showed the lowest DBE and AImod (Figures 10A,B), and only 4.4% of the decreased MF corresponded to aromatics (Table 3); nevertheless, from the MF absent in the group that lost SPE-DOC but present in the CM group, 16.7% corresponded to aromatics (Table 3). This is indication that complete degradation of aromatic MF occurred in the group that lost SPE-DOC, which is consistent with previous studies (e.g., Mopper et al., 1991; Stubbins et al., 2010) that reported rapid and complete degradation of aromatic compounds. We propose a photodegradation imprint in the group of samples that lost SPE-DOC, indicating that this abiotic degradation process is a possible DOM sink off central Peru.
Photochemical transformations of CDOM off central Peru have been reported by Loginova et al. (2016) in surface waters, and by Galgani and Engel (2016) for the surface microlayer. In our study, the group of samples that lost SPE-DOC, which showed the strongest photodegradation imprint, corresponded to water depths between 30 and 90 m. One plausible explanation for the strong imprint of photodegradation processes in the DOM molecular composition at these depths is vertical transport of surface waters (downwelling). Under this scenario, the samples could have been exposed to sunlight recently and the persistent photodegradation signature was exported with the water parcel to greater depths. Such scenario would imply that a photodegradation signal should also be evidenced in surface samples. Indeed, we identified that 14% of the MF absent in the group that gained SPE-DOC but present in the CM group corresponded to aromatics. Thus, both groups of samples that lost/gained SPE-DOC lost aromatics, with the signal of photodegradation being stronger in the group that lost SPE-DOC compared to the group that gained SPE-DOC (16.7 versus 14% loss of aromatics, respectively). We propose that the export of the persistent photodegradation signal to depths beyond the photic zone could be a consequence of mesoscale processes like eddies. These mesoscale structures have been suggested to play an important role in the physical and biogeochemical dynamics of the PUS by increasing offshore transport and subduction of nutrients (Callbeck et al., 2017), and by actively ventilating the OMZ (Bettencourt et al., 2015; Thomsen et al., 2016). These mesoscale eddies intensify during EN conditions, being responsible for nutrient off-shore transport and subduction (Chaigneau et al., 2008; Espinoza-Morriberón et al., 2017).
Overall, the reported findings support the imprint of DOM degradation processes, both biotic and abiotic (photodegradation), in the molecular composition of the group that lost SPE-DOC.
The most distinct molecular features of the MF that increased were (i) higher average mass and higher number of carbons and hydrogens (Figures 9A–C) and (ii) increased relative abundance of MF corresponding to the compound classes unsaturated aliphatics, saturated fatty acids, and sugars (Figures 11B–D). Laboratory experiments (e.g., Landa et al., 2014) revealed that unsaturated aliphatics are a major fraction of phytoplankton exudates, and Medeiros et al. (2015) showed that unsaturated aliphatics contributed largely to the DOM compounds present in the chlorophyll maximum. Therefore, the higher abundance of these molecular classes, especially of the unsaturated aliphatics, in the MF that were significantly increased is consistent with an imprint of DOM production in the molecular composition of the group of samples that gained SPE-DOC. This was also supported by the distribution of each molecular class among the groups of samples (Table 3), of the 254 MF that were increased in the group that gained SPE-DOC and the CM group, 24% were unsaturated aliphatics.
This study characterized the processes affecting DOM cycling under low productivity conditions characteristic of EN years (Espinoza-Morriberón et al., 2017). The few previous studies published for the same study area analyzed DOM cycling under normal productivity conditions, i.e., non-EN year (Romankevich and Ljutsarev, 1990; Galgani and Engel, 2016; Loginova et al., 2016). Although the distribution pattern of SPE-DOC concentrations agreed with the high DOC and CDOM concentrations reported in these previous studies in surface waters, some inferences can be made regarding DOM cycling under different conditions of productivity.
Two studies performed during December 2012 (non-EN year) in both the surface microlayer and the underlying water column of the PUS showed highest concentrations of DOC and some dissolved organic compounds (e.g., dissolved combined carbohydrates) (Engel and Galgani, 2016), together with high CDOM concentrations (Galgani and Engel, 2016), occurring off central Peru (12°S) associated to high Chl-a concentrations. A study performed by Loginova et al. (2016) during February–March 2013 (non-EN year) focused on the interpretation of the distribution of optically active DOM. They report that the highest Chl-a, DOC, and CDOM concentrations were associated to a water mass classified as “surface salinity minimum water” with salinities < 35.1, which would be the equivalent of the CCW in the present study. Based on the predominance of an amino acid-like component of CDOM, Loginova et al. (2016) identified this “surface salinity minimum water” as a water mass where DOM is freshly produced. In the present study, the CCW between 0 and 30 m also represent waters where DOM is produced, as shown by the elevated SPE-DOC concentrations (Figure 6) and the molecular characteristics of the DOM (Figures 9, 11). Nevertheless, the highest SPE-DOC concentrations in our study were found for the nutrient-depleted SSW, contrary to what was shown by Loginova et al. (2016), who reported lower DOC concentrations for the SSW compared to the “surface salinity minimum water”. Based on this, we propose that low productivity conditions like in EN years reduce DOM production in the highly productive CCW, which could explain the differences observed in the present study and Loginova et al. (2016). Nevertheless, it should be noted that even under these conditions of low productivity, there is an active DOM cycling, as evidenced by the non-conservative behavior of SPE-DOC and the characteristic imprint of production and degradation processes in the molecular characteristics of the DOM pool.
Conclusion
We characterized the molecular composition of SPE-DOM in a highly productive coastal upwelling system and, based on the molecular information, elucidated the processes involved in DOM cycling off central Peru. This is the first study that provides information on DOM dynamics during low productivity conditions like the ones that characterized EN years.
Even under the low productivity conditions characteristic of EN, there are processes that affect DOM cycling off central Peru evidenced by the addition and removal of SPE-DOC. These processes are mainly related to SPE-DOC production in surface waters and SPE-DOC degradation at greater water depth under low oxygen conditions. Observed changes in the DOM molecular composition are consistent with the proposed production and degradation scenarios. The properties of the MF that showed significant changes were characteristic for distinct imprints of DOM production and photodegradation in surface waters, and biotic DOM degradation under low oxygen conditions, pointing to a complex interplay of biological and physical factors that influence DOM dynamics off central Peru.
We recommend that future studies examine DOM cycling from a molecular perspective under typical oceanographic conditions of high productivity in the PUS. Since upwelling systems are hot-spots for primary production and can act as both sink and source of CO2 to the atmosphere, the study of DOM cycling in these systems is fundamental for a better understanding of the global carbon cycle and its implications in climate change.
Author Contributions
All authors conceived the study. MI collected all the samples and performed all chemical and statistical analyses. MI and JN thoroughly discussed the results with important input from MG and TD. MI and JN wrote the manuscript with input from all co-authors.
Funding
This work was possible thanks to a doctoral grant from the Peruvian Ministry of Production – Program “Innovate Peru” – FINCyT (Fund for Innovation, Science, and Technology) awarded to the lead author MI. Further financial support was provided by the University of Oldenburg.
Conflict of Interest Statement
The authors declare that the research was conducted in the absence of any commercial or financial relationships that could be construed as a potential conflict of interest.
Acknowledgments
We thank the captains and crews of RV Olaya Balandra and RV Flores, especially Jesús Ledesma, Miguel Sarmiento, Wilson Carhuapoma, and Avy Bernales, for their help during the sampling campaigns in 2015 and for the nutrient analyses performed. We also thank Dr. Dimitri Gutiérrez, head of the Research Unit in Oceanography and Climate Change, and the scientists of the Laboratory of Marine Geology and the Laboratory of Hydrochemistry and Primary Productivity at the Peruvian Sea Institute (IMARPE – Instituto del Mar del Perú), for the authorization and all the facilities given to MI to process all samples. We also thank Matthias Friebe and Ina Ulber for SPE-DOC analysis and Katrin Klaproth for FT-ICR-MS analysis. We also thank Dr. Gaute Lavik from the Max Planck Institute for Marine Microbiology for his important input for both the study design and discussion of the results.
Supplementary Material
The Supplementary Material for this article can be found online at: https://www.frontiersin.org/articles/10.3389/fmars.2019.00198/full#supplementary-material
Footnotes
- ^Please note that Grados et al. (2018) refer to the Coastal Cold Waters as peruvian coastal water (pcw).
References
Álvarez-Salgado, X. A., Gago Piñeiro, J. M., Míguez, B. M., and Pérez, F. F. (2001). Net ecosystem production of dissolved organic carbon in a coastal upwelling system: the Ría de Vigo, Iberian margin of the North Atlantic. Limnol. Oceanogr. 46, 135–146. doi: 10.4319/lo.2001.46.1.0135
Amon, R., and Benner, R. (1996). Bacterial utilization of different size classes of dissolved organic matter. Limnol. Oceanogr. 41, 41–51. doi: 10.4319/lo.1996.41.1.0041
Bettencourt, J. H., Lopez, C., Hernandez-Garcia, E., Montes, I., Sudre, J., Dewitte, B., et al. (2015). Boundaries of the Peruvian oxygen minimum zone shaped by coherent mesoscale dynamics. Nat. Geosci. 8, 937–940. doi: 10.1038/ngeo2570
Calienes, R., Guillén, O., and Lostaunau, N. (1985). Variabilidad espacio-temporal de clorofila, producción primaria y nutrientes frente a la costa peruana. Bol. Inst. Mar. Perú Callao 10:44.
Callbeck, C. M., Lavik, G., Stramma, L., Kuypers, M., and Bristow, L. A. (2017). Enhanced nitrogen loss by eddy-induced vertical transport in the offshore Peruvian oxygen minimum zone. PLoS One 12:e0170059. doi: 10.1371/journal.pone.0170059
Carlson, C. A., and Hansell, D. A. (2014). “DOM sources, sinks, reactivity, and budgets,” in Biogeochemistry of Marine Dissolved Organic Matter, 2nd Edn, eds D. A. Hansell and C. A. Carlson (Amsterdam: Elsevier), 65–126. doi: 10.1016/B978-0-12-405940-5.00003-0
Chaigneau, A., Dominguez, N., Eldin, G., Vasquez, L., Flores, R., Grados, C., et al. (2013). Near-coastal circulation in the northern humboldt current system from shipboard ADCP data. J. Geophys. Res. Oceans 118, 5251–5266. doi: 10.1002/jgrc.20328
Chaigneau, A., Gizolme, A., and Grados, C. (2008). Mesoscale eddies off Peru in altimeter records: identification algorithms and eddy spatio-temporal patterns. Prog. Oceanogr. 79, 106–119. doi: 10.1016/j.pocean.2008.10.013
Chavez, F. P., and Messié, M. (2009). A comparison of eastern boundary upwelling ecosystems. Prog. Oceanogr. 83, 80–96. doi: 10.1016/j.pocean.2009.07.032
Covert, J. S., and Moran, M. A. (2001). Molecular characterization of estuarine bacterial communities that use high- and low-molecular weight fractions of dissolved organic carbon. Aquat. Microb. Ecol. 25, 127–139. doi: 10.3354/ame025127
Dale, A. W., Graco, M., and Wallmann, K. (2017). Strong and dynamic benthic-pelagic coupling and feedbacks in a coastal upwelling system (Peruvian shelf). Front. Mar. Sci. 4:29. doi: 10.3389/fmars.2017.00029
Dittmar, T., Koch, B., Hertkorn, N., and Kattner, G. (2008). A simple and efficient method for the solid-phase extraction of dissolved organic matter (SPE-DOM) from seawater. Limnol. Oceanogr. Methods 6, 230–235. doi: 10.4319/lom.2008.6.230
Dittmar, T., and Stubbins, A. (2014). Dissolved Organic Matter in Aquatic Systems. Treatise on Geochemistry, 2nd Edn, Vol. 12. Amsterdam: Elsevier Ltd, doi: 10.1016/B978-0-08-095975-7.01010-X
Dray, S., and Dufour, A. B. (2007). The ade4 package: implementing the duality diagram for ecologists. J. Stat. Softw. 22, 1–20. doi: 10.18637/jss.v022.i04
Echevin, V., Aumont, O., Ledesma, J., and Flores, G. (2008). The seasonal cycle of surface chlorophyll in the peruvian upwelling system: a modelling study. Prog. Oceanogr. 79, 167–176. doi: 10.1016/j.pocean.2008.10.026
Engel, A., and Galgani, L. (2016). The organic sea-surface microlayer in the upwelling region off the coast of Peru and potential implications for air–sea exchange processes. Biogeosciences 13, 989–1007. doi: 10.5194/bg-13-989-2016
Espinoza-Morriberón, D., Echevin, V., Colas, F., Tam, J., Ledesma, J., Vásquez, L., et al. (2017). Impacts of El Niño events on the Peruvian upwelling system productivity. J. Geophys. Res. Oceans 122, 5423–5444. doi: 10.1002/2016JC012439
Fiedler, P. C., and Talley, L. D. (2006). Hydrography of the eastern tropical pacific: a review. Prog. Oceanogr. 69, 143–180. doi: 10.1016/j.pocean.2006.03.008
Fréon, P., Barange, M., and Arístegui, J. (2009). Eastern boundary upwelling ecosystems: integrative and comparative approaches. Prog. Oceanogr. 83, 1–14. doi: 10.1016/j.pocean.2009.08.001
Fuenzalida, R., Schneider, W., Garcés-Vargas, J., Bravo, L., and Lange, C. (2009). Vertical and horizontal extension of the oxygen minimum zone in the eastern South pacific ocean. Prog. Oceanogr. 56, 992–1003. doi: 10.1016/j.dsr2.2008.11.001
Galgani, L., and Engel, A. (2016). Changes in optical characteristics of surface microlayers hint to photochemically and microbially mediated dom turnover in the upwelling region off the coast of Peru. Biogeosciences 13, 2453–2473. doi: 10.5194/bg-13-2453-2016
Graco, M., Ledesma, J., Flores, G., Girón, M., Calienes, R., Guillén, O., et al. (2007). Nutrients, oxygen and biogeochemical processes in the humboldt upwelling current system off Peru nutrientes, oxígeno y procesos biogeoquímicos En El Sistema de Surgencias de La Corriente de Humboldt Frente a Perú. Rev. Peru. Biol. 14, 117–128. doi: 10.1029/2009JC005710
Graco, M., Purca, S., Boris, D., Carmen, C., Octavio, M., Ledesma, J., et al. (2017). The OMZ and nutrient features as a signature of interannual and low-frequency variability in the Peruvian upwelling system. Biogeosciences 145194, 4601–4617. doi: 10.5194/bg-14-4601-2017
Grados, C., Chaigneau, A., Echevin, V., and Dominguez, N. (2018). Upper ocean hydrology of the Northern humboldt current system at seasonal, interannual and interdecadal scales. Prog. Oceanogr. 165, 123–144. doi: 10.1016/j.pocean.2018.05.005
Gutiérrez, D., Bouloubassi, I., Sifeddine, A., Purca, S., Goubanova, K., Graco, M., et al. (2011). Coastal cooling and increased productivity in the main upwelling zone off peru since the mid-twentieth century. Geophys. Res. Lett. 38:L07603. doi: 10.1029/2010GL046324
Gutiérrez, D., Enríquez, E., Purca, S., Quipúzcoa, L., Marquina, R., Flores, G., et al. (2008). Oxygenation episodes on the continental shelf of central Peru: remote forcing and benthic ecosystem response. Prog. Oceanogr. 79, 177–189. doi: 10.1016/j.pocean.2008.10.025
Hamersley, M., Lavik, G., Woebken, D., Lam, P., Hopmans, E. C., Sinninghe Damsté, J., et al. (2007). Anaerobic ammonium oxidation in the Peruvian oxygen minimum zone. Limnol. Oceanogr. 52, 923–933. doi: 10.4319/lo.2007.52.3.0923
Hansell, D., Carlson, C., Repeta, D., and Schlitzer, R. (2009). Dissolved organic matter in the ocean: a controversy stimulates new insights. Oceanography 22, 202–211. doi: 10.5670/oceanog.2009.109
Harrell, F. E. Jr., with contributions from Charles Dupont and many others (2018). Hmisc: Harrell Miscellaneous. R Package Version 4.1-1. Available at: https://CRAN.R-project.org/package=Hmisc (accessed January 3, 2018).
Hawkes, J. A., Hansen, C., Goldhammer, T., Bach, W., and Dittmar, T. (2016). Molecular alteration of marine dissolved organic matter under experimental hydrothermal conditions. Geochim. Cosmochim. Acta 175, 68–85. doi: 10.1016/j.gca.2015.11.025
Helly, J. J., and Levin, L. (2004). Global distribution of naturally occurring marinehypoxia on continental margins. Deep Sea Res. Part I 51, 1159–1168. doi: 10.1016/j.dsr.2004.03.009
Holm-Hansen, O., Lorenzen, C. J., Holmes, R. W., and Strickland, J. (1965). Fluorometric determination of chlorophyll. ICES J. Mar. Sci. 30, 3–15. doi: 10.1093/icesjms/30.1.3
Khodse, V. B., and Bhosle, N. (2011). Bacterial utilization of size-fractionated dissolved organic matter. Aquat. Microb. Ecol. 64, 299–309. doi: 10.3354/ame01529
Kim, S., Kaplan, L., and Hatcher, P. (2006). Biodegradable dissolved organic matter in a temperate and a tropical stream determined from ultra – high resolution mass spectrometry. Limnol. Oceanogr. 51, 1054–1063. doi: 10.4319/lo.2006.51.2.1054
Koch, B. P., and Dittmar, T. (2006). From mass to structure: an aromaticity index for high-resolution mass data of natural organic matter. Rapid Commun. Mass Spectrom. 20, 926–932. doi: 10.1002/rcm.2386
Koch, B. P., and Dittmar, T. (2016). Erratum: from mass to structure: an aromaticity index for high-resolution mass data of natural organic matter. Rapid Commun. Mass Spectrom. 30:250. doi: 10.1002/rcm.7433
Koch, B. P., Dittmar, T., Witt, M., and Kattner, G. (2007). Fundamentals of molecular formula assignment to ultrahigh resolution mass data of natural organic matter. Anal. Chem. 79, 1758–1763. doi: 10.1021/AC061949S
Koch, B. P., Witt, M., Engbrodt, R., Dittmar, T., and Kattner, G. (2005). Molecular formulae of marine and terrigenous dissolved organic matter detected by electrospray ionization Fourier transform ion cyclotron resonance mass spectrometry. Geochim. Cosmochim. Acta 69, 3299–3308. doi: 10.1016/j.gca.2005.02.027
Lam, P., and Kuypers, M. (2011). Microbial nitrogen cycling processes in oxygen minimum zones. Annu. Rev. Mar. Sci. 3, 317–345. doi: 10.1146/annurev-marine-120709-142814
Landa, M., Cottrell, M. T., Kirchman, D. L., Kaiser, K., Medeiros, P., Tremblay, L., et al. (2014). Phylogenetic and structural response of heterotrophic bacteria to dissolved organic matter of different chemical composition in a continuous culture study. Environ. Microbiol. 16, 1668–1681. doi: 10.1111/1462-2920.12242
Ledesma, J., Tam, J., Graco, M., León, V., Flores, G., and Morón, O. (2011). Characterization of oxygen minimum zone (OMZ) in front of peruvian coast between 3°N and 14°S, 1999–2009. Boletín Del Instituto Del Mar Del Perú 26, 49–57.
Loginova, A., Thomsen, S., and Engel, A. (2016). Chromophoric and fluorescent dissolved organic matter in and above the oxygen minimum zone off Peru. J. Geophys. Res. Oceans 121, 1–18. doi: 10.1002/2015JC011534
Lønborg, C., Álvarez-Salgado, X., Martínez-García, S., Miller, A., and Teira, E. (2010). Stoichiometry of dissolved organic matter and the kinetics of its microbial degradation in a coastal upwelling system. Aquat. Microb. Ecol. 58, 117–126. doi: 10.3354/ame01364
Medeiros, P., Seidel, M., Powers, L., Dittmar, T., Hansell, D., and Miller, W. (2015). Dissolved organic matter composition and photochemical transformations in the northern north pacific ocean. Geophys. Res. Lett. 2013, 863–870. doi: 10.1002/2014GL062663
Miller, R. G. (1981). Simultaneous Statistical Inference, 2nd Edn. New York, NY: Springer Verlag. doi: 10.1007/978-1-4613-8122-8
Montes, I., Colas, F., Capet, X., and Schneider, W. (2010). On the pathways of the equatorial subsurface currents in the eastern equatorial pacific and their contributions to the peru-chile undercurrent. J. Geophys. Res. Oceans 115, 1–16. doi: 10.1029/2009JC005710
Mopper, K., Kieber, D. J., and Stubbins, A. (2014). “Marine photochemistry of organic matter: processes and impacts,” in Biogeochemistry of Marine Dissolved Organic Matter, 2nd Edi Edn, eds D. A. Hansell and C. A. Carlson (Amsterdam: Elsevier Inc), 389–450. doi: 10.1016/B978-0-12-405940-5.00008-X
Mopper, K., Yu, X., Kieber, R., Kieber, D. J., Sikorski, R., and Jones, R. (1991). Photochemical degradation of dissolved organic carbon and its impact on the oceanic carbon cycle. Lett. Nat. 353, 737–740. doi: 10.1038/353060a0
Morón, O. (2011). Climatología de la salinidad superficial del mar frente a la costa peruana 1960-2008. Inf. Inst. Mar. Perú 38, 7–39.
Oksanen, J., Blanchet, G., Friendly, M., Kindt, R., Legendre, P., McGlinn, D., et al. (2018). vegan: Community Ecology Package. R Package Version 2.4-6. Available at: https://CRAN.R-project.org/package=vegan (accessed December, 2018).
Osterholz, H., Kirchman, D. L., Niggemann, J., and Dittmar, T. (2016). Environmental drivers of dissolved organic matter molecular composition in the delaware estuary. Front. Earth Sci. 4:95. doi: 10.3389/feart.2016.00095
Pantoja, S., Rossel, P., Castro, R., Cuevas, L. A., Daneri, G., and Córdova, C. (2009). Microbial degradation rates of small peptides and amino acids in the oxygen minimum zone of Chilean coastal waters. Deep Sea Res. Part II Top. Stud. Oceanogr. 56, 1019–1026. doi: 10.1016/j.dsr2.2008.09.007
Parsons, T. R., Maita, Y., and Lalli, C. M. (1984). A Manual of Chemical and Biological Methods for Seawater Analysis. Oxford: Pergamon Press, 173.
Riedel, T., and Dittmar, T. (2014). A method detection limit for the analysis of natural organic matter via Fourier transform ion cyclotron resonance mass spectrometry. Anal. Chem. 86, 8376–8382. doi: 10.1021/ac501946m
Romankevich, E. A., and Ljutsarev, S. V. (1990). Dissolved organic carbon in the ocean. Mar. Chem. 30, 161–178. doi: 10.1016/0304-4203(90)90068-n
Rossel, P. E., Bienhold, C., Boetius, A., and Dittmar, T. (2016). Dissolved organic matter in pore water of arctic ocean sediments: environmental influence on molecular composition. Org. Geochem. 97, 41–52. doi: 10.1016/j.orggeochem.2016.04.003
Šantl-Temkiv, T., Finster, K., Dittmar, T., Hansen, B., Thyrhaug, R., Nielsen, N., et al. (2013). Hailstones: a window into the microbial and chemical inventory of a storm cloud. PLoS One 8:e53550. doi: 10.1371/journal.pone.0053550
Schlitzer, R. (2017). Ocean Data View. Available at: http://www.odv.awi.de (accessed August 15, 2017).
Seidel, M., Beck, M., Riedel, T., Waska, H., Suryaputra, I., Schnetger, B., et al. (2014). Biogeochemistry of dissolved organic matter in an anoxic intertidal creek bank. Geochim. Cosmochim. Acta 140, 418–434. doi: 10.1016/j.gca.2014.05.038
Seidel, M., Yager, P., Ward, N., Carpenter, E., Gomes, H., Krusche, A., et al. (2015). Molecular-level changes of dissolved organic matter along the amazon river-to-ocean continuum. Mar. Chem. 177, 218–231. doi: 10.1016/j.marchem.2015.06.019
Silva, N., and Neshyba, S. (1979). On the southernmost extension of the Peru-Chile undercurrent. Deep Sea Res. 26A, 1387–1393.
Silva, N., Rojas, N., and Fedele, A. (2009). Water masses in the Humboldt current system: properties, distribution, and the nitrate deficit as a chemical water mass tracer for equatorial subsurface water off Chile. Deep Sea Res. Part II Top. Stud. Oceanogr. 56, 992–1008. doi: 10.1016/j.dsr2.2008.11.001
Strub, P. T., Mesías, J. M., Montecino, V., Rutlant, J., and Salinas, S. (1998). “Coastal ocean circulation off western south America,” in The Global Coastal Ocean. The sea, Vol. 11, eds A. R. Robinson and K. H. Brink (New York, NY: Interscience), 273–313. doi: 10.1016/j.jaapos.2005.06.004
Stubbins, A., Spencer, R., Chen, H., Hatcher, P., Mopper, K., Hernes, P. J., et al. (2010). Illuminated darkness: molecular signatures of Congo river dissolved organic matter and its photochemical alteration as revealed by ultrahigh precision mass spectrometry. Limnol. Oceanogr. 55, 1467–1477. doi: 10.4319/lo.2010.55.4.1467
Thomsen, S., Kanzow, T., Colas, F., Echevin, V., Krahmann, G., and Engel, A. (2016). Do submesoscale frontal processes ventilate the oxygen minimum zone off Peru? Geophys. Res. Lett. 43, 8133–8142. doi: 10.1002/2016GL070548
Zark, M., Broda, N., Hornick, T., Grossart, H., Riebesell, U., and Dittmar, T. (2017). Ocean acidification experiments in large-scale mesocosms reveal similar dynamics of dissolved organic matter production and biotransformation. Front. Mar. Sci. 4:271. doi: 10.3389/fmars.2017.00271
Zark, M., Riebesell, U., and Dittmar, T. (2015). Effects of ocean acidification on marine dissolved organic matter are not detectable over the succession of phytoplankton blooms. Sci. Adv. 1:e1500531. doi: 10.1126/sciadv.1500531
Keywords: Peruvian upwelling system, Central Peru, El Niño, dissolved organic matter, carbon cycling, ultrahigh-resolution mass spectrometry
Citation: Igarza M, Dittmar T, Graco M and Niggemann J (2019) Dissolved Organic Matter Cycling in the Coastal Upwelling System Off Central Peru During an “El Niño” Year. Front. Mar. Sci. 6:198. doi: 10.3389/fmars.2019.00198
Received: 28 June 2018; Accepted: 29 March 2019;
Published: 07 May 2019.
Edited by:
José M. Riascos, Universidad del Valle, ColombiaReviewed by:
Martin Zimmer, Leibniz Centre for Tropical Marine Research (LG), GermanyYuanyuan Feng, Tianjin University of Science and Technology, China
Copyright © 2019 Igarza, Dittmar, Graco and Niggemann. This is an open-access article distributed under the terms of the Creative Commons Attribution License (CC BY). The use, distribution or reproduction in other forums is permitted, provided the original author(s) and the copyright owner(s) are credited and that the original publication in this journal is cited, in accordance with accepted academic practice. No use, distribution or reproduction is permitted which does not comply with these terms.
*Correspondence: Maricarmen Igarza, bWFyaWEuZGVsLmNhcm1lbi5pZ2FyemEudGFnbGVAdW5pLW9sZGVuYnVyZy5kZQ==