 Tom Willaert1*
 Ana García-Alegre
 Henrique Queiroga
 Ana Isabel Lillebø
- 1NOVA School of Business and Economics, Lisbon, Portugal
- 2Department of Biology and CESAM, University of Aveiro, Aveiro, Portugal
The main objective of this work is to promote Ecosystem Based Management (EBM), using a complex Atlantic region, to demonstrate how the InVEST model tool and associated methods can be applied to calculate benthic habitats cumulative risk and to create a vulnerability index of the potential of these habitats to deliver ecosystem services (ES). The study area, in the Western-Atlantic coast of Portugal, includes the Nazaré Canyon (>3,000 m depth within the study region), Óbidos Lagoon (transitional waters), São Martinho do Porto bay (marine inlet), and Berlengas Archipelago (UNESCO world biosphere reserve). The ES delivered by this complex coastal region supports the main regional/local socio-economic activities (e.g., fisheries and tourism activities). The approach combined the InVEST habitat risk assessment tool with the identified ES to create a proxy for the habitats’ vulnerability to deliver ES. Within the region 28 marine benthic habitats were identified and combined with 12 classes of ES (Common International Classification of ES), and two prospective scenarios were analyzed (a potential socio-economic scenario for 2025 and a climate change scenario for the end of the century). The results show that the applied vulnerability approach enables the combination of information from different sources, including local knowledge, and the translation of the generated information into 2D spatial explicit maps that can support strategic management options, namely in the context of maritime spatial planning and “Blue Growth.” The interpretation of the habitat vulnerability approach requires the consideration of data spatial resolution, its quality, and the impact of associated pressures. However, despite the limitations and assumptions (e.g., all ES classes are equally important), models such as this have opened new avenues contributing to improve EBM, by combining spatial explicit GIS tools with supply and demand of marine ES, human activities, and their related positive and negative impacts.
Introduction
The environmental status of benthic habitats is a key determinant of the marine and coastal ecosystem services (ES) they can deliver, that is, the direct and indirect contributions of ecosystems to human well-being (Haines-Young and Potschin, 2013). According to the same authors, human well-being can be defined as all benefits that “arises from adequate access to the basic materials for a good life needed to sustain freedom of choice and action, health, good social relations and security.” Following the Common International Classification of Ecosystem Services (CICES) latest version (V5.1 in Haines-Young and Potschin, 2017), natural capital includes the abiotic outputs from ecosystems and the ecosystems capital, whereas ES is restricted to the outputs of ecosystems dependent on living processes. In this context, Marine ES can be classified as: (i) provisioning, such as food, materials and energy mediated by biota, (ii) regulating and maintenance, such as mediation of waste and climate regulation, and finally (iii) cultural, such as physical, spiritual, or intellectual interactions with ecosystems and land-/seascapes. Relevant examples of abiotic outputs from marine natural systems are (i) abiotic provisioning, such as salt, sunlight, minerals, wind, and wave energy, (ii) regulation and maintenance by natural physical structures, such as atmospheric dispersion and dilution, and (iii) cultural settings dependent on abiotic structures, such as sea breezes. By exploiting nature, we incurred costs by degrading the ecosystems and their ability to deliver ES (Millennium Ecosystem Assessment, 2005). Biological, chemical, and physical pressures caused by multiple human marine and coastal uses including among others fishing, off-shore constructions, and nutrient inputs can adversely affect the condition of marine and coastal systems and hence prevent a sustainable flow of ES from these systems. To cope with this, as stated in the European Union (EU) Marine Strategy Framework Directive (MSFD), marine strategies should ensure that the cumulative pressure of such activities is kept within levels that are compatible with the achievement of good environmental status of EU waters by 2020, while enabling the sustainable use of marine goods and services (Directive 2008/56/EC). In the directive it is therefore suggested that member states of the EU follow an ecosystem-based management (EBM) approach acknowledging the full array of interactions within an ecosystem, including humans.
An EBM approach recognizes ecological system interactions and complexity, and it recognizes that human well-being and ecological status are linked (UNEP, 2011). It also implies integrated adaptive management that moves away from the more conventional sector-by-sector approach to natural resource management, explicitly accounting and addressing multiple pressures in management plans (Halpern et al., 2008a; Ruckelshaus et al., 2008; Thrush and Dayton, 2010; Smith et al., 2016). The evaluation of tradeoffs or compatibilities between human uses and the protection of ecosystems and their services is essential in this and requires understanding and quantification of the spatial distribution of anthropogenic impacts on marine and coastal systems (Halpern et al., 2008b). Measuring the cumulative impact from human uses is, however, not straightforward since these uses generate multiple pressures that act simultaneously producing unexpected ecosystem responses that are often hard to predict (Crain et al., 2008; Darling and Côté, 2008; Doak et al., 2008; Halpern et al., 2008a; Parravicini et al., 2012; Borja et al., 2016). Interactions between and among activities are rarely additive and will almost always interact because of both the interdependence of physiological rate processes within individuals and the interdependence of ecological interactions within communities and ecosystems (Breitburg and Riedel, 2005; Crain et al., 2008; Shears and Ross, 2010). Disentangling these interactions is challenging in the real world since many stressors may co-exist and their direct manipulation is not always feasible (Parravicini et al., 2012). Moreover, in spite of the fact that marine and coastal policymakers are facing increased calls to take cumulative risk in to account in marine spatial plans, they hardly ever have the luxury to wait for research that provides modeling tools capable of dealing with all stressor interactions (Parravicini et al., 2010, 2012). Still, when spatial data on habitat distribution and human uses are available, a measure of potential risk can be obtained to inform marine policy (Halpern et al., 2008b; Stelzenmüller et al., 2010; Arkema et al., 2014; Cabral et al., 2015). The main drawback of these measures is that they generally assume that pressures are additive.
All marine management plans, including licensing, regulating, and planning marine activities, imply tradeoffs, since it is unfeasible to simultaneously maximize the flow of all ES (Tallis and Kareiva, 2006; Halpern et al., 2007; Barbier et al., 2008). The ability of marine and coastal benthic habitats to deliver ES under different scenarios has been assessed before using the vulnerability concept (Metzger and Schröter, 2006; Metzger et al., 2008; Cabral et al., 2015). Vulnerability is defined as the degree to which a system is susceptible to, and unable to cope with injury, damage, or harm (De Lange et al., 2010). It includes three elements: exposure, sensitivity, and adaptive capacity. Estimating the changes in the vulnerability of marine habitats under different scenarios can be used as a proxy of the habitats' potential to deliver ES (Cabral et al., 2015), since the supply of ES is likely to decrease with increased vulnerability (Schröter et al., 2005).
In the present study we create a spatially explicit vulnerability index of the potential of benthic habitats to deliver ES in the Peniche-Nazaré coastal and marine region in the Western-Atlantic coast of Portugal. We do this by assessing the risk posed to these habitats under different scenarios in combination with expert scores on the importance of ES delivered by each of these habitat types. The main objective of this work is to promote EBM in Portugal by demonstrating how existing tools and methods can be applied to improve the effective implementation of marine and coastal related policies, namely, Marine Strategy Framework Directive (Directive 2008/56/EC), Maritime Spatial Planning Directive (Directive 2014/89/EU), Water Framework Directive (Directive 2000/60/EC) and Habitats Directive–Natura 2000 framework (Directive 92/43/EEC). The specific objectives are: (i) to demonstrate how the InVEST model tool and associated methods can be applied to improve EBM in marine and coastal regions, with Peniche-Nazaré region as a case study, (ii) to calculate cumulative risk and to create a vulnerability index for this complex Atlantic region, and (iii) to force the model with possible future narratives, for the prospective scenario's for the years 2035 and 2100, taking into account regional/local socio-economic options and expected climate change for the region, respectively.
Materials and Methods
Study Area
This study was conducted in the west coast of Portugal, north of Lisbon (Figure 1). It is a complex coastal region characterized by a wide variety of habitats delivering marine ES that support the main regional/local socio-economic activities. The continental margin in the study area is incised by the longest Iberian submarine canyon, the Nazaré Canyon, reaching depths of >3,000 m in the study site. In addition, other distinctive biophysical units such as the Óbidos Lagoon (transitional waters), São Martinho do Porto bay (marine inlet), and Berlengas Archipelago fall inside this area. The latter is a group of small islands and reefs which has been a marine protected area since 1981 and a UNESCO world biosphere reserve since 2011. The area of study covers 3,570 km2, comprising of a coastal area of five municipalities with a combined population of approximately 160 000 inhabitants (2011 census). Relevant examples of the regional/local socio-economic activities are fisheries (the Peniche harbor is the second most important in Portugal with regards to fish landings and Nazaré still maintains the characteristics of a traditional fisherman village) and tourism (the entire coastal area is known for their beaches and waves for surfing, with a special emphasis on the Nazaré giant wave (Cunha-e-Sá et al., 2018), and the Rip Curl that takes place in Peniche.
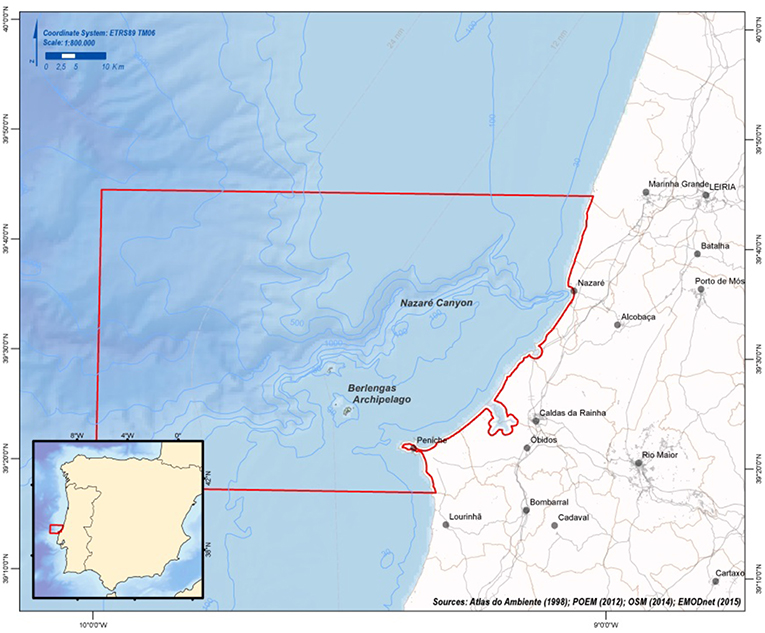
Figure 1. The location of the complex Atlantic region between Peniche and Nazaré.
Data Sources and Workflow
The case study region includes the four typologies of marine ecosystems following the EC working group on Mapping and Assessment of Ecosystem Services (WG MAES) classification (Maes et al., 2016): marine inlets and transitional waters, coastal waters, shelf waters and open ocean. The benthic habitats were classified following the EUNIS habitat type hierarchical view system from the European Union Nature Information System (EUNIS) (Davies et al., 2004). Habitat data were obtained from the seabed habitats portal of the European Marine Observation and Data Network (EMODNET) and from the UNEP's Global Seafloor Geomorphic Features Map (GSGFM) (Harris et al., 2014) to cover deep-sea areas that were not available in the former portal. In this case, the geomorphologic features of the sea-bed were transformed to the EUNIS classification system following the study of Tempera (2015). According to this classification system, escarpments were classified as A6.1: Deep-sea rock and artificial hard substrata, canyons as A6:81: Canyons, channels, slope failures and slumps on the continental slope, and Abyssal plain as A6:5: Deep sea mud.
Spatial data layers on human activities were developed based on the available literature collected in the scope of the research project MCES–The Economic Valuation and Governance of Marine and Coastal Ecosystem Services funded by Gulbenkian Oceans Initiative. From these data we created pressure maps, using the activities-pressures database constructed by the Joint Nature Conservation Committee as a guidance tool (DEFRA, 2015), as well as the summary of significant pressures and impacts analyzed in the Marine Strategy for Mainland Portugal (MAMAOT, 2012, Table IV.92.). We created vector layers for 11 pressures according to the terminology used in the Maritime Spatial Framework Directive (MSFD; 2014/89/EU) as shown in Table 1. The MSFD pressures list is available as (Table SD1).
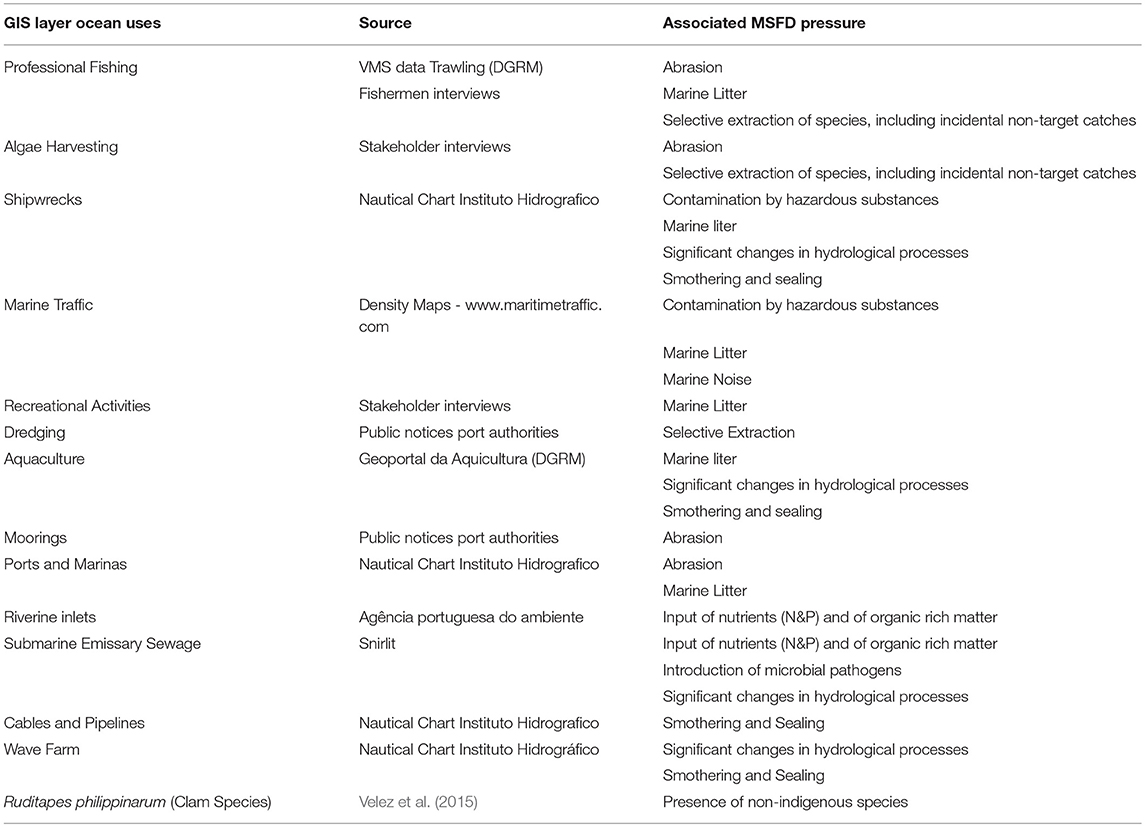
Table 1. The constructed GIS layers and associated pressures following the Maritime Spatial Framework Directive (MSFD; 2014/89/EU).
Overall, we adopted the workflow proposed by Cabral et al. (2015), following three main steps depicted in Figure 2, but introduced some modifications in the calculations. As a first step we used the InVEST habitat risk assessment (HRA) tool from the Natural Capital Project to measure the cumulative risk posed to the marine habitats (Sharp et al., 2015). As a second step we identified the most relevant ES to be considered in the case study region and proceeded with the expert valuation on the identified benthic habitats' ES availability. In the third step we combined the information on the cumulative risk posed to the marine benthic habitats with expert valuation on habitats' ES availability to create a proxy for the habitats' vulnerability to provide ES. In the next section follows a comprehensive explanation of this methodology.
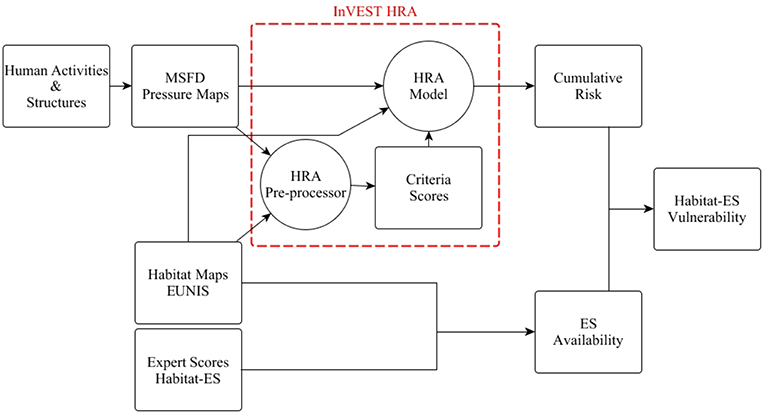
Figure 2. Schematic representation of the workflow.
Cumulative Risk Calculation
Risk to coastal and nearshore habitats is a function of the exposure of each habitat to each pressure and the consequences for each habitat. The InVEST HRA tool produces spatially explicit risk information using spatial layers of habitats and pressures together with exposure (E) and consequence (C) scores for each habitat-pressure combination. The model's output is a cumulative risk map, a grid with risk values at a chosen spatial resolution. E and C are calculated by scoring a set of criteria, each of them being either an exposure or consequence. For each habitat-pressure combination E and C are the weighted averages of the respective criteria. Weighting is obtained by scoring the data quality and the importance given to each criterion. The formulas are given by:
where ei and ci are the scores for the respective exposure or consequence criterion i, di represents the data quality rating for criterion i, wi the importance weighting for the criterion, and N the number of exposure or consequence criteria valued for the habitat-pressure combination. All parameters are integer values ranging from 1 to 3. The E and C values hence also fall within this interval.
In this study we use the exposure criteria: spatial overlap, temporal overlap, intensity, and management strategy effectiveness. However, spatial overlap is treated differently since not having a spatial overlap between a habitat and a pressure implies that there is no risk. Therefore, E and C are only calculated when there is spatial overlap between the habitat and the pressure and set to zero otherwise. Temporal overlap represents the duration of spatial overlap between the pressure and the habitat, management strategy effectiveness accounts for management actions such as treatment of sewage discharges or mesh size regulations that might reduce (or increase) the exposure of habitats to pressures, and intensity relates to the human activity that causes the pressure. Marine noise, for example, originating from cargo vessels has a higher intensity than marine noise from recreational vessels. The scores given to the exposure criteria are spatially explicit implying that the E score for a given habitat-pressure combination can be different depending on its location in the study site.
The consequence criteria consist of two groups: resilience attributes and recovery attributes. The scores for the former group are dependent both on the habitat and the pressure and relate to the consequences of the habitat's exposure to a pressure. These criteria are the change in area (the percent change in areal extent of a habitat when exposed to a given stressor), change in structure (the percent change in structural density for biotic habitats or structural damage sustained for abiotic habitats when exposed to a stressor) and frequency of natural disturbance. It is argued that habitats that are naturally frequently perturbed in a way similar to an anthropogenic stressor may be more resistant to additional anthropogenic stress (Sharp et al., 2015). The consequence recovery attributes used are connectivity (the spacing of habitat patches and larval dispersal) and regeneration time (the time it takes for habitats to reach maturity) and are habitat specific. The applied criteria and score interpretation are shown in Table 2. Scores were attributed through expert judgment by three researchers with a background in marine ecology and environmental chemistry, environmental sciences, and GIS marine habitat mapping. When a criterion was given a score of 0 this implied that the criterion was not considered for the habitat-pressure combination when calculating E or C. In this study all criteria were given the same importance, hence wi in the two preceding formulas was set to 1 for each i.
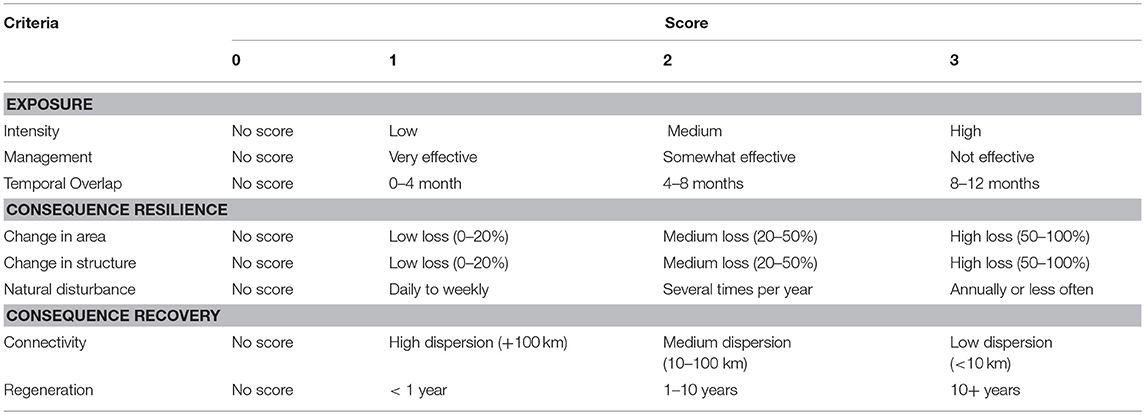
Table 2. The applied criteria and score interpretation applied in HRA model.
For every cell in the grid the individual risk for a habitat-pressure combination is calculated using the Euclidean risk function which is given by:
where Ri is the individual risk for habitat-stressor combination i and E and C are the respective exposure and consequence scores. bi is a buffer decay value used and will be explained hereafter.
The exposure to pressures, e.g., noise and nutrient input, decreases the further away from the source of the pressure. To deal with this the HRA model allows exposure to exponentially decrease to 0 between the pressure's source and a chosen buffer distance. The formula used is:
Where b is the buffer decay value, x the distance to the source of the pressure and B the chosen buffer distance. This formula implies that at the chosen buffer distance B the remaining exposure is only 1% of the exposure at the source. When x is >B the model does not calculate the risk since there is no spatial overlap.
Since, as shown in the previous formulas, b ranges between 0 and 1 and E and C between 1 and 3, the resulting individual risk for each habitat-pressure combination is a value between 0 and √8 (≈2.83). This calculation of Ri is different from the InVEST HRA model where E is multiplied by b before subtracting 1. The problem with this is that (bE-1) becomes negative from a certain distance from the source of the pressure onwards. Because this term of the equation is squared in the Euclidean risk equation the risk will erroneously start increasing again when moving further away from the pressure's source. To avoid this, we first subtract exposure by one before multiplying it by b. In addition, we also adapted the measurement of buffer distances in the model (supplementary data, Figure SD1).
The final step in the HRA model combines individual risk scores to obtain a cumulative risk. In the InVEST model this is done by summing the individual risk values at each cell in the grid. In our study we added weights to individual risks so that more weight can be given to those pressures policy-makers are more concerned with. The calculation is as follows:
where R is the cumulative risk in a cell, x is the weight given to pressure j and Rj is the individual risk score for the pressure habitat combination in the cell. Whereas, we assume that risk is additive this formula could easily be adapted when more information on joint effects of multiple pressures is available. All criteria scores and weights used in the HRA model are presented as Supplementary Data (SD Cumulative Risk Calculation Scores).
Ecosystem Services Availability
In the context of this approach, Ecosystem Services availability is synonymous with the supply side of Ecosystem Services. Twelve classes of ES were selected to evaluate in this study due to their representativeness and to enable the comparison with previous studies (Salomidi et al., 2012; Galparsoro et al., 2014; Potts et al., 2014; Cabral et al., 2015): (ES1) Nutrition, (ES2) Material, (ES3) Mediation of waste, toxics and other nuisances, (ES4) Mediation of flows, (ES5) Lifecycle maintenance, habitat and gene pool protection, (ES6) Pest and disease control, (ES7) Soil formation and composition, (ES8) Water conditions, (ES9) Atmospheric composition and climate regulation, (ES10) Physical and experiential interactions, (ES11) Intellectual and representative interactions, (ES12) Spiritual, symbolic and other interactions with biota, ecosystems, and land-/seascapes. The combined table is available as (Table SD2). The habitat-ES scoring was done using expert judgement by four groups of three researchers each: a biology and ecology group, a policy and governance group, a group involved in interviewing fishers and stakeholders in the case study region, and a group of researchers involved in modeling economic, ecologic and/or hydrological aspects of the case study region. Rating the availability of ES was done using four evaluation classes: 0- Unknown, when the contribution of the habitat to provide the ES is unknown to the expert group, 1- Negligible/irrelevant/low, when the contribution to this ES is low or irrelevant, 2- Moderate, when the contribution is considered important but in a substantially lower magnitude than other habitats, 3- High, when the contribution is elevate and considerably higher than the average. The calculations of ES availability/supply correspond to the average of the scores from the four expert groups, excluding from the calculation the evaluation class: 0- Unknown. Average scores were calculated for the Provisioning, Maintenance and Regulating, and Cultural ES categories and all scores were normalized to 0–1.
Habitat-ES Vulnerability
The vulnerability score for each cell in the grid is obtained by multiplying cumulative risk by availability for each cell in the grid:
where V stands for vulnerability, R the cumulative risk score as measured by the HRA model and A the expert score on availability. Our vulnerability index is thus positively correlated with both ES availability and risk, implying that the highest vulnerability is obtained when a habitat with a high potential to deliver ES is subject to high risk. Thus, the higher the index in a cell, the higher the potential loss of ES in that location.
Scenario Analysis
For the prospective scenarios we considered two time frames: (i) the period around 2035 for which we consider possible future socio-economic options, taking into account the available information on possible human activities foreseen for the region in the near future, such as spatially explicit areas with concession for wind farms and aquaculture, as well as an expected increase in maritime traffic (POEM, 2011; PricewaterhouseCoopers, 2015; Lopes, 2016), and (ii) the period around 2100 for which we consider the numerical hydrological modeling for the case study region using IPPC scenarios for the end of the century as a forcing function and the trends for alien invasive species (Pires et al., 2015). Whereas, the former scenario shows how changes in management options may influence the cumulative risk and, therefore, the habitat's potential to deliver ES, the latter scenario does not assume changes in human ocean uses compared to the baseline. A more detailed description of the storylines is available as Supplementary Data (SD scenarios storylines).
Results
Habitats Mapping
In total 28 marine benthic habitats were identified in this complex Atlantic region, as shown in Figure 3. The area corresponding to each type of habitat and their percentage in relation to the entire study area are presented as (Table SD3).
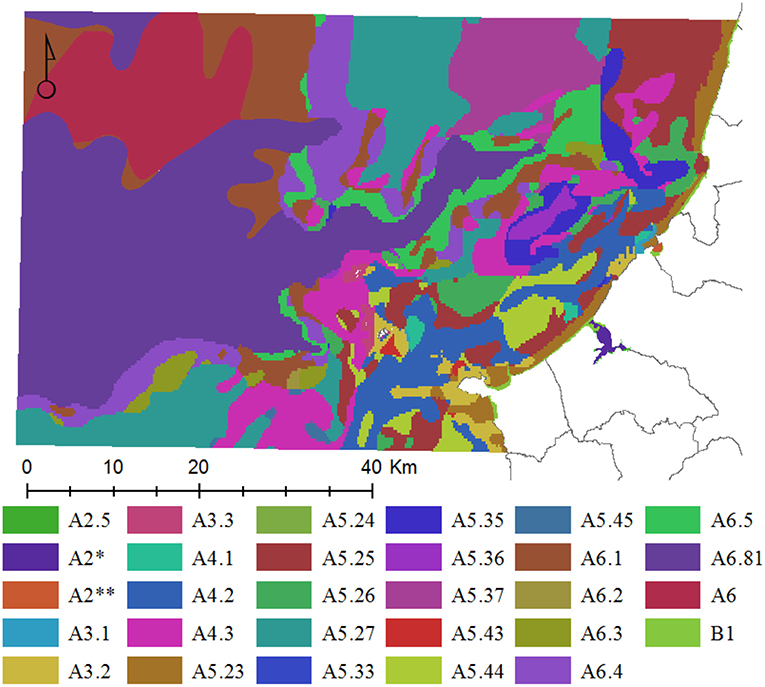
Figure 3. Habitat map with the 28 marine benthic habitats identified in the complex Atlantic region between Peniche and Nazaré following the EUNIS habitat classification. (*Òbidos Lagoon **S. Martinho do Porto bay).
Cumulative Risk Maps
In Figure 4 the results of the cumulative risk assessment are presented in a grid with a spatial resolution of 1 × 1 km. For both prospective scenarios as well as the baseline situation the highest risk scores can be found at the Óbidos lagoon, due to the overlap of many pressures. Other places with relative high-risk scores are situated in coastal zones, e.g., Nazaré, the Berlengas archipelago, and areas where there is a significant presence of marine traffic and/or trawling activities.
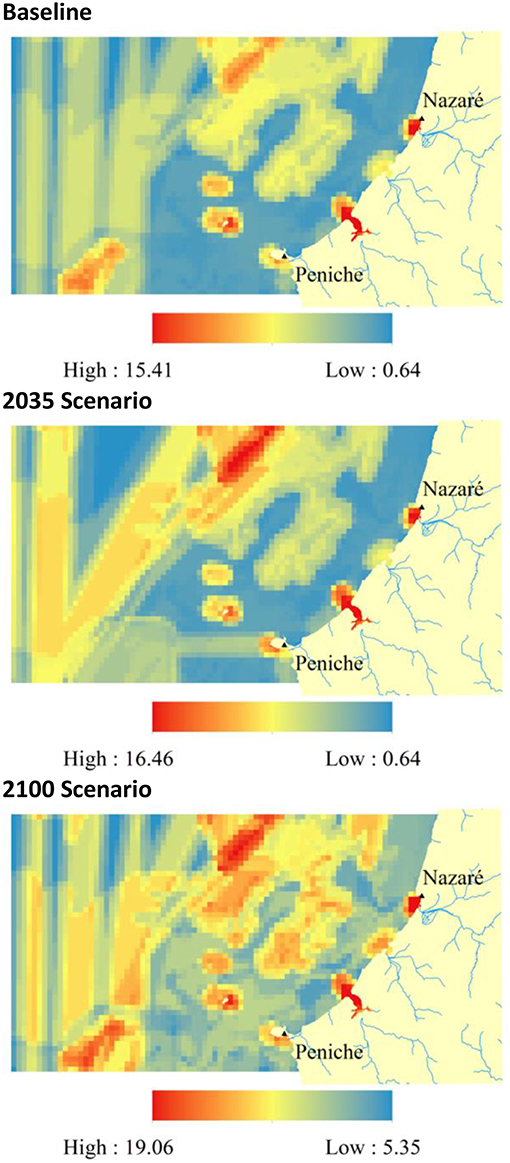
Figure 4. Cumulative risk map for the complex Atlantic region between Peniche and Nazaré, with a resolution of 1x1 km, for the present condition (baseline) and for the years 2035 and 2100 prospective scenarios.
Ecosystem Service Availability Maps
The correspondence matrix between the most relevant ES considered in the case study region and the expert valuation on the identified benthic habitats' ES availability are included as (Table SD4). The availability maps for Provisioning, Regulating and Maintenance, and Cultural ES are depicted in Figure 5, in a 50 × 50 m spatial resolution grid. It can be observed that, in particular, rocky habitats were valued for provisioning services and that the habitats of the Óbidos lagoon and Nazaré canyon were highly valued for their regulating maintenance and cultural services.
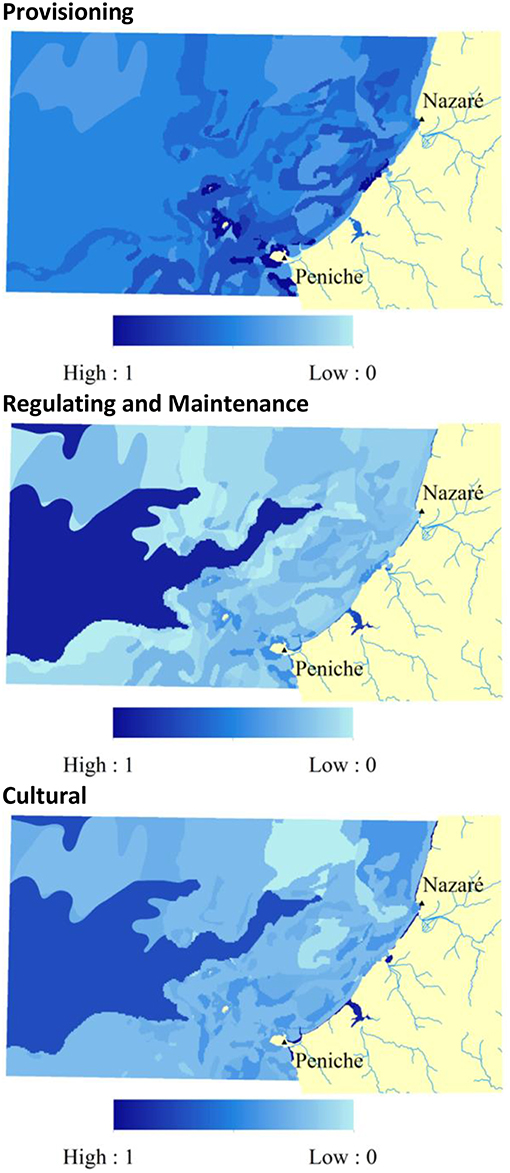
Figure 5. Marine ES availability maps for the complex Atlantic region between Peniche and Nazaré: Provisioning, Regulating and Maintenance, and Cultural.
Habitat-ES Vulnerability Maps
In Figure 6 the results of ES vulnerability are depicted for the three categories of ES for each of the scenarios in a 1 × 1 km spatial resolution grid. In Table 3 results are provided per habitat type. Some habitats were aggregated, since they are very similar (e.g., circalittoral fine sand and circalittoral muddy sand) and since they were therefore also aggregated when giving scores to the habitat-specific criteria in the risk assessment model. The scenario-based percentual changes in vulnerability are also shown in this table. It can be seen that, overall, there is an increase in the vulnerability index by more than 20% for all three ES categories in the 2035 scenario, and an increase of more than 145% for each in the 2100 scenario. The main reason for this large increase in vulnerability in the latter case is that climate change impacts the whole ocean area, thus including areas that were almost not exposed to pressures in the baseline situation. For the 2035 scenario, changes are more modest, and a decrease of vulnerability can be noticed for the Bathyan Seabed (A6) located North-West in the study site. This is due to a decrease in pressures related to maritime traffic for this habitat since the creation of an off-shore wind farm imposes a change in the location of the maritime traffic lanes. Moreover, it can be seen that the percentage increase of vulnerability for Littoral Sediments (A2) to which most of the Óbidos Lagoon and São Martinho do Porto bay belong is relatively small. Still, the average vulnerability index score for this habitat is much higher for cultural services than for any other habitat. Percentual changes should, hence, be carefully interpreted. Vulnerability is calculated by multiplying Availability by Cumulative Risk. Since the availability score is assumed constant for each habitat for all scenarios, the percentage change for the three vulnerability scores for each habitat are the same as the percentage change in average cumulative risk for that habitat. Some vulnerability scores are 0 because the expert score indicated that the availability of the ES belonging to that category is negligible.
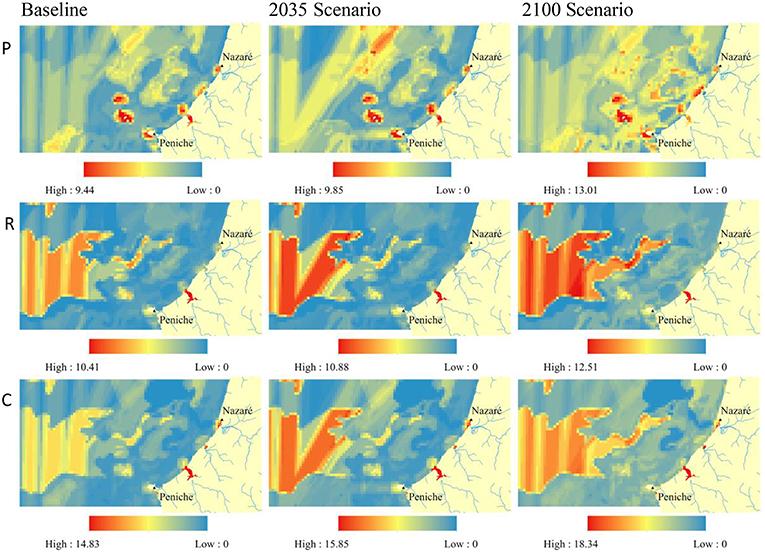
Figure 6. Marine ES vulnerability maps for the complex Atlantic region between Peniche and Nazaré for the present condition (baseline) and for the years 2035 and 2100 prospective scenarios: Provisioning (P), Regulating and Maintenance (R), and Cultural (C) ES.
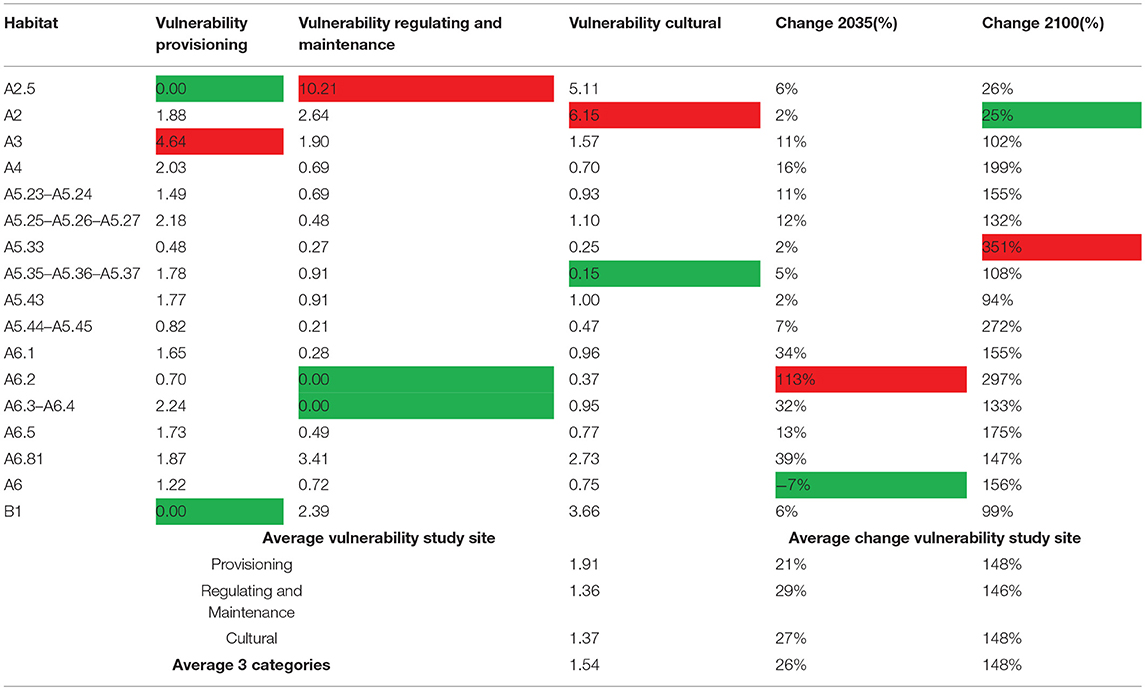
Table 3. Summary table per habitat type with the scenario-based percentual changes in vulnerability: green cells represent the lowest change in vulnerability, whilst red cells stand for the highest change in vulnerability.
Discussion
The vulnerability of a sector relying on a particular ES at a particular location (e.g., grid cell) under a certain scenario and at a certain point in time is a function of exposure, sensitivity, and the potential to adjust in response to the stressor, i.e., adaptive capacity (Metzger et al., 2006). Adaptive capacity should not only assess how habitats can cope with change but also how the sector relying on an ES does. Cabral et al. (2015) consider that higher levels of existing ES availability implies a higher capacity of the habitat to adapt under adverse circumstances. The authors thus divide cumulative risk values by the level of ES availability to obtain a vulnerability score. There is however not much knowledge about the adaptive capacity of marine habitats (Metzger et al., 2006).
Since our study was conducted at a regional/local scale, it can be argued that a scenario that minimizes the potential loss of ES delivery over the whole study site is preferred, even if this implies a loss of ES in places with low availability. Since more benefits can be lost in locations with a high availability of ES, the vulnerability index increases with availability. However, it should be noted that if a sector dependent on an ES in a location with low availability cannot adjust to meet its ES demand in another place, that is, if there is no spatial substitutability across ES, the vulnerability of that sector could be higher when there is risk in places where the ES availability is low. Hence, for similar studies with bigger study areas the habitat-ES vulnerability equation might not be ideal since a sector may rely more significantly on the ES that are close to it.
Potential of the Approach
It is stated in article 4 of the EU's Maritime Spatial Planning Directive (MSPD) (Directive 2014/89/EU) that:
“When establishing maritime spatial planning, Member States shall have due regard to the particularities of the marine regions, relevant existing and future activities and uses and their impacts on the environment, as well as to natural resources, and shall also take into account land-sea interactions.”
In Portugal, a maritime spatial plan for the continental part of the exclusive economic zone was developed between 2009 and 2011. This plan was however not granted the status of a planning and management instrument (Calado and Bentz, 2013). With the obligation for Member States to have established a maritime spatial plan at the latest by March 31 st, 2021, there is a growing need for easily replicable models that account for multiple stressors in the marine environment. Namely, processes related to natural drivers (e.g., climate change, invasive species, i.e., not directly driven by human activities) and/or socio-economic drivers (e.g., shipping, fishing, off-shore wind farms, i.e., directly driven by human activities) which might directly impact the sustainable development of marine ecosystems. Changes in these complex socio-economic systems are of paramount importance for management authorities looking to maintaining resilience of combined and interrelated social-ecological systems. Furthermore, there is an increased focus on the economy of the sea (“Blue Economy”) aiming for a “Green Economy in a Blue World,” including “improved human well-being and social equity, while significantly reducing environmental risks and ecological scarcities” (UNEP, 2013; Lillebø et al., 2017). In this sense, the vulnerability approach applied to the selected complex Atlantic region, using the InVEST modeling tool, combining the marine benthic habitats risk assessment with marine ES, enables the translation of the generated information into 2D spatial explicit maps. These types of maps allow decision-makers and managers to establish the appropriate scales for the implementation of policies (e.g., MSFD, International agreements) cope with international conventions (e.g., OSPAR, 2011) and to undertake strategic options. Moreover, this study shows how the engagement of stakeholders, which is advocated in the MSFD, can help in collecting spatial data on human and coastal ocean uses that are difficult to monitor, e.g., recreational activities and small-scale fisheries. Therefore, the potential of the InVEST model is particularly relevant because poor maritime spatial planning leads not only to suboptimal exploitation of economic potential but also to the degradation of marine and coastal environments and insufficient adaptation to climate risks. In this study we also foresee that InVEST HRA model combined with the marine ES, in a supply and demand perspective, with the Habitat-ES Vulnerability may support the decision-making process in the context of the economy of the Sea and the “Blue Growth.” On the supply side, which corresponds to the ES production area (O'Higgins et al., 2019; Teixeira et al., 2019), the approach could be undertaken by giving different weights to the pressures depending on the type of ES concerned. On the demand side, that is, in what concerns the ES benefits (O'Higgins et al., 2019), the approach would require the estimation of the economic value of the targeted marine ES.
Finally, this approach does not require continuous data from long term monitoring systems, numerical models, among others. It can be applied in regions where data are more limited, for example, limited to spatially explicit data (e.g., presence/absence of benthic habitats' and of ES availability).
Approach Limitations
The modeling approach followed in this study is similar to that of Cabral et al. (2015) who already identified several limitations that need to be considered when using results from studies following this habitat vulnerability approach. A first one is that geographical datasets of human ocean uses, and/or marine pressures are scarce, rarely using spatial resolutions that can be useful for studies at regional or local scales. These datasets vary a lot in quality since they are often collected for specific purposes. For example, while trawling is well characterized in Portugal, with spatial data on fishing efforts due to the concern of its negative impacts on the marine environment, data on artisanal, small scale fisheries had to be collected on site in the course of this project and included self-reported information by fishermen on where they go fishing. Another relevant example regards the characterization of the habitats. While detailed spatial information is available for few areas, e.g., salt marshes in Óbidos coastal lagoon, only broader spatial information exists for the others. Moreover, the unbalanced availability of spatial data at different locations may lead to bias results. Whereas, it was expected that the cumulative risk and vulnerability scores would be high in the Óbidos Lagoon there might be a bias as this location is better monitored than other sites in the study. The longer recognized need to monitor transitional and coastal waters due to environmental and human health concerns (water and environmental EU and national related policies and regulations) may increase the discrepancy in risk values that can be found for different habitats. Yet, the effective implementation of the MSFD could contribute to reducing this gap. Also, by selecting an appropriate spatial resolution and by weighting data by its quality, datasets that present a large variability can be combined to create pressure layers. Second, the habitat risk assessment model assumes an additive impact of pressures which is debatable as already mentioned. Third, there might be positive externalities of human ocean uses and structures associated with the supply of certain ES on even though they might have a negative effect on the benthic habitats. It can be argued, for example, that shipwrecks, despite being considered a pressure, have positive effects on marine fauna diversity. Wind farms could possibly have a positive effect on bivalve recruitment providing hard-bottom substrates, similar to the impact of artificial reefs These positive externalities to certain services are not considered when applying this model. Adding to that, the opposite may also hold. While the contribution of marine noise or marine litter to the cumulative risk on habitats is relatively low compared to pressures such as abrasion and smothering, it has a direct non-negligible impact on several ES. Marine litter will, for example, has a significant impact on activities supported by cultural services, e.g., surfing and scuba diving, although when measured through the impact on the habitats and their potential to deliver ES its contribution to the vulnerability is rather low.
Finally, when calculating the availability scores for provisioning, regulating and maintenance, and cultural ES we took the average scores of the ES classes belonging to each category without weighting, thus assuming that all ES classes are equally important. For example, the availability score for the ES category provisioning for a habitat is the average of the expert scores for nutrition and materials, even though it is obvious that currently the local economy is much more dependent on the former service.
Concluding Remarks
This study is a first attempt to apply an ecosystem vulnerability approach to a marine region representing a complex Atlantic region on the Portuguese coast. While the focus in this study won the cumulative risk to benthic habitats and the vulnerability of the marine habitats' potential to provide ES under different scenarios further research should focus on integrating it with direct effects of specific pressures on the ES supply side and the effects on the demand side and on the human related activities and well-being. The supply side approach could be considered by giving different weights to the pressures depending on the type of ES concerned. Accounting for the demand side would require the estimation of the economic value of the targeted marine ES. Despite the limitations and assumptions stated before, there is a clear need for models such as this to inform marine policy. The mapping of benthic habitats has opened new avenues, contributing to improve not only marine spatial plans, but also the EBM approach by facilitating the combination of spatial explicit GIS tools with the supply and demand of marine ES, human activities and their related impacts, as well as with other natural impacts (e.g., climate change) to forecast scenarios (including marine ES trade-offs) and to open the floor for discussions (namely in stakeholders participatory processes) and sustainable decision making processes in a “Blue Growth” context by maximizing the net benefits provided by marine environments over time.
Author Contributions
TW, AL, and MC led the work on this manuscript. TW lead the InVest modeling, AG-A lead the habitat mapping, AL lead the marine ecology and marine ecosystem services. TW and AG-A were involved in stakeholder interviews. TW and AL comprised the core writing team with inputs from AG-A, HQ, and MC.
Funding
This study was supported by the Calouste Gulbenkian Foundation, Portugal, through the research project MCES-The Economic Valuation and Governance of Marine and Coastal Ecosystem Services, in the context of the Gulbenkian Oceans' Initiative. We also thank to FCT/MEC due to the financial support to CESAM, through national funds (UID/AMB/50017/2019) and the co-funding by the FEDER, within the PT2020 Partnership Agreement and Compete 2020 (UID/AMB/50017/2013).
Conflict of Interest Statement
The authors declare that the research was conducted in the absence of any commercial or financial relationships that could be construed as a potential conflict of interest.
Acknowledgments
We are thankful to all fishers and stakeholders that participated in the surveys conducted over the course of this project, and to our MCES project colleagues that scored the ES/habitats matrix.
Supplementary Material
The Supplementary Material for this article can be found online at: https://www.frontiersin.org/articles/10.3389/fmars.2019.00199/full#supplementary-material
References
Arkema, K. K., Verutes, G., Bernhardt, J. R., Clarke, C., Rosado, S., Canto, M., et al. (2014). Assessing habitat risk from human activities to inform coastal and marine spatial planning: a demonstration in Belize. Environ. Res. Lett. 9:114016. doi: 10.1088/1748-9326/9/11/114016
Barbier, E. B., Koch, E. W., Silliman, B. R., Hacker, S. D., Wolanski, E., Primavera, J., et al. (2008). Coastal ecosystem-based management with nonlinear ecological functions and values. Science 319, 321–323. doi: 10.1126/science.1150349
Borja, A., Elliott, M., Andersen, J. H., Berg, T., Carstensen, J., Halpern, B. S., et al. (2016). Overview of integrative assessment of marine systems: the ecosystem approach in practice. Front. Mar. Sci. 3:20. doi: 10.3389/fmars.2016.00020
Breitburg, D. L., and Riedel, G. F. (2005). Multiple Stressors in Marine Systems. Marine Conservation Biology: The Science of Maintaining the Sea's Biodiversity. Washington, DC: Island Press, 167–182.
Cabral, P., Levrel, H., Schoenn, J., Thiebaut, E., Le Mao, P., Mongruel, R., et al. (2015). Marine habitats ecosystem service potential: a vulnerability approach in the Normand-Breton (Saint Malo) Gulf, France. Ecosyst. Serv. 16, 306–318. doi: 10.1016/j.ecoser.2014.09.007
Calado, H., and Bentz, J. (2013). The Portuguese maritime spatial plan. Marine Policy 42, 325–333 doi: 10.1016/j.marpol.2013.03.014
Crain, C. M., Kroeker, K., and Halpern, B. S. (2008). Interactive and cumulative effects of multiple human stressors in marine systems. Ecol. Lett. 11, 1304–1315. doi: 10.1111/j.1461-0248.2008.01253.x
Cunha-e-Sá, M. A., Freitas, R., Nunes, L. C., and Otrachshenko, V. (2018). On nature's shoulders: riding the big waves in Nazaré. Tour. Econ. 24. 369–385. doi: 10.1177/1354816617731195
Darling, E. S., and Côté, I. M. (2008). Quantifying the evidence for ecological synergies. Ecol. Lett. 11, 1278–1286. doi: 10.1111/j.1461-0248.2008.01243.x
Davies, C. E., Moss, D., and Hill, M. O. (2004). EUNIS Habitat Classification Revised 2004. Report to: European Environment Agency-European Topic Centre on Nature Protection and Biodiversity, 127–143.
De Lange, H. J., Sala, S., Vighi, M., and Faber, J. H. (2010). Ecological vulnerability in risk assessment—a review and perspectives. Sci. Total Environ. 408, 3871–3879. doi: 10.1016/j.scitotenv.2009.11.009
DEFRA (2015). Validating an Activity-Pressure Matrix, Report R.2435, pp73. Available online at: http://randd.defra.gov.uk/Document.aspx?Document=13051_ME5218FinalReport.pdf (accessed September 26, 2016).
Doak, D. F., Estes, J. A., Halpern, B. S., Jacob, U., Lindberg, D. R., Lovvorn, J., et al. (2008). Understanding and predicting ecological dynamics: are major surprises inevitable. Ecology 89, 952–961. doi: 10.1890/07-0965.1
Galparsoro, I., Borja, A., and Uyarra, M. C. (2014). Mapping ecosystem services provided by benthic habitats in the European North Atlantic Ocean. Front. Mar. Sci 1:23.
Haines-Young, R., and Potschin, M. (2013). CICES V4.3. Report Prepared following Consultation on CICES Version 4, August–December 2012. EEAFramework contract no. 441EEA/IEA/09/003.
Haines-Young, R., and Potschin, M. B. (2017). Common International Classification of Ecosystem Services (CICES) V5.1 and Guidance on the Application of the Revised Structure. Available online at: www.cices.eu
Halpern, B. S., McLeod, K. L., Rosenberg, A. A., and Crowder, L. B. (2008a). Managing for cumulative impacts in ecosystem-based management through ocean zoning. Ocean Coast. Manag. 51, 203–211. doi: 10.1016/j.ocecoaman.2007.08.002
Halpern, B. S., Selkoe, K. A., Micheli, F., and Kappel, C. V. (2007). Evaluating and ranking the vulnerability of global marine ecosystems to anthropogenic threats. Conserv. Biol. 21, 1301–1315. doi: 10.1111/j.1523-1739.2007.00752.x
Halpern, B. S., Walbridge, S., Selkoe, K. A., Kappel, C. V., Micheli, F., D'Agrosa, C., et al. (2008b). A global map of human impact on marine ecosystems. Science 319, 948–952. doi: 10.1126/science.1149345
Harris, P. T., Macmillan-Lawler, M., Rupp, J., and Baker, E. K. (2014). Geomorphology of the oceans. Mar. Geol. 352:4–24. doi: 10.1016/j.margeo.2014.01.011
Lillebø, A. I., Pita, C., Garcia Rodrigues, J., Ramos, S., and Villasante, S. (2017). How can marine ecosystem services support the blue growth agenda? Marine Policy 81, 132–142. doi: 10.1016/j.marpol.2017.03.008
Lopes, A. F. (2016). “The economic potential value of offshore wind near Berlengas,” in Progress in Renewable Energies Offshore. Proceedings of the 2nd International Conference on Renewable Energies Offshore, RENEW 2016 (Lisbon), 851–858.
Maes, J., Liquete, C., Teller, A., Erhard, M., Paracchini, M. L., Barredo, J. I., et al. (2016). An indicator framework for assessing ecosystem services in support of the EU biodiversity strategy to 2020. Ecosyst. Serv. 17, 14–23. doi: 10.1016/j.ecoser.2015.10.023
MAMAOT (2012). Estratégia Marinha para a subdivisão do Continente. Diretiva Quadro Estratégia Marinha. Ministério da Agricultura, do Mar, do Ambiente e do Ordenamento do Território. October 2012.
Metzger, M., Rounsevell, M. D. A., Acosta-Michlik, L., Leemans, R., and Schröter, D. (2006). The vulnerability of ecosystem services to land use change. Agric. Ecosyst. Environ. 114, 69–85. doi: 10.1016/j.agee.2005.11.025
Metzger, M. J., and Schröter, D. (2006). Towards a spatially explicit and quantitative vulnerability assessment of environmental change in Europe. Reg. Environ. Change 6, 201–216. doi: 10.1007/s10113-006-0020-2
Metzger, M. J., Schröter, D., Leemans, R., and Cramer, W. (2008). A spatially explicit and quantitative vulnerability assessment of ecosystem service change in Europe. Reg. Environ. Change 8, 91–107. doi: 10.1007/s10113-008-0044-x
Millennium Ecosystem Assessment (2005). Ecosystems and Human Well-being: Synthesis. Washington, DC: Island Press.
O'Higgins, T., Nogueira, A. A., and Lillebo, A. I. (2019). A simple spatial typology for assessment of complex coastal ecosystem services across multiple scales. Sci. Total Environ. 649, 1452–1466.
OSPAR (2011). Pressure List and Descriptions. Paper to ICG-COBAM (1) 11/8/1 Add.1-E (amended version 25th March 2011) presented by ICG-Cumulative Effects. London: OSPAR Commission.
Parravicini, V., Rovere, A., Vassallo, P., Micheli, F., Montefalcone, M., Morri, C., et al. (2012). Understanding relationships between conflicting human uses and coastal ecosystems status: a geospatial modeling approach. Ecol. Indic. 19, 253–263. doi: 10.1016/j.ecolind.2011.07.027
Parravicini, V., Thrush, S. F., Chiantore, M., Morri, C., Croci, C., and Bianchi, C. N. (2010). The legacy of past disturbance: chronic angling impairs long-term recovery of marine epibenthic communities from acute date-mussel harvesting. Biol. Conserv. 143, 2435–2440. doi: 10.1016/j.biocon.2010.06.006
Pires, A. C., Nolasco, R., Rocha, A., Ramos, A. M., and Dubert, J. (2015). Climate change in the iberian upwelling system: a numerical study using GCM downscaling. Climate Dynamics 1–>14.
POEM (2011). Despacho n. 14449/2012 - Divulgação do Plano de Ordenamento do Espaço Marítimo. Available online at: https://www.dgpm.mm.gov.pt/ordenamento-e-maritimo
Potts, T., Burdon, D., Jackson, E., Atkins, J., Saunders, J., Hastings, E., and Langmead, O. (2014). Do marine protected areas deliver flows of ecosystem services to support human welfare? Marine Policy 44, 139–148. doi: 10.1016/j.marpol.2013.08.011
PricewaterhouseCoopers (2015). HELM – PwC Economy of the Sea Barometer Edition n° 6. Portugal, December 2015. Available online at: https://www.pwc.pt/en/publications/helm-portugal.html (accessed April 10, 2019).
Ruckelshaus, M., Klinger, T., Knowlton, N., and De Master, D. P. (2008). Marine ecosystem-based management in practice: scientific and governance challenges. Bioscience 58, 53–63. doi: 10.1641/B580110
Salomidi, M., Katsanevakis, S., Borja, Á., Braeckman, U., Damalas, D., Galparsoro, I., et al. (2012). Assessment of goods and services, vulnerability, and conservation status of European seabed biotopes: a stepping stone towards ecosystem-based marine spatial management. Mediter. Marine Sci. 13, 49–88. doi: 10.12681/mms.23
Schröter, D., Cramer, W., Leemans, R., Prentice, I. C., Araújo, M. B., Arnell, N. W., et al. (2005). Ecosystem service supply and vulnerability to global change in Europe. Science 310, 1333–1337. doi: 10.1126/science.1115233
Sharp, R., Tallis, H. T., Ricketts, T., Guerry, A. D., Wood, S. A., Chaplin-Kramer, R., et al. (2015). InVEST 3.2.0 User's Guide. Stanford, CA: The Natural Capital Project, Stanford University, University of Minnesota, The Nature Conservancy, and World Wildlife Fund.
Shears, N. T., and Ross, P. M. (2010). Toxic cascades: multiple anthropogenic stressors have complex and unanticipated interactive effects on temperate reefs. Ecol. Lett. 13, 1149–1159. doi: 10.1111/j.1461-0248.2010.01512.x
Smith, C. J., Papadopoulou, K.-N., Barnard, S., Mazik, K., Elliott, M., Patrício, J., et al. (2016). Managing the marine environment, conceptual models and assessment considerations for the european marine strategy framework directive. Front. Mar. Sci. 3:144. doi: 10.3389/fmars.2016.00144
Stelzenmüller, V., Lee, J., South, A., and Rogers, S. I. (2010). Quantifying cumulative impacts of human pressures on the marine environment: a geospatial modelling framework. Mar. Ecol. Prog. Ser. 398, 19–32. doi: 10.3354/meps08345
Tallis, H., and Kareiva, P. (2006). Shaping global environmental decisions using socio-ecological models. Trends Ecol. Evol. 21, 562–568. doi: 10.1016/j.tree.2006.07.009
Teixeira, H., Lilleb, ø A. I, Culhane, F., Robinson, L., Trauner, D., Borgwardt, F., et al. (2019). Linking biodiversity to ecosystem services supply: Patterns across aquatic ecosystems. Sci. Total Environ. 657, 517–534. doi: 10.1016/j.scitotenv.2018.11.440
Tempera, F. (2015). Bringing together harmonized EUNIS seabed habitat geospatial information for the European Seas. JRC Technical Reports. Joint Research Centre, Luxembourg.
Thrush, S. F., and Dayton, P. K. (2010). What can ecology contribute to ecosystem-based management? Ann. Rev. Mar. Sci. 2, 419–441. doi: 10.1146/annurev-marine-120308-081129
UNEP (2011). Taking Steps toward Marine and Coastal Ecosystem-Based Management - An Introductory Guide. No. 189. Nairobi: Division for Environmental Policy Implementation United Nations Environment Programme, 68.
UNEP (2013). Green Economy and Trade – Trends, Challenges and Opportunities. 302pp. Available online at: http://hdl.handle.net/20.500.11822/8165 (accessed April 10, 2019).
Keywords: ecosystem based management (EBM), benthic habitats mapping, InVEST, human dimension, blue growth
Citation: Willaert T, García-Alegre A, Queiroga H, Cunha-e-Sá MA and Lillebø AI (2019) Measuring Vulnerability of Marine and Coastal Habitats’ Potential to Deliver Ecosystem Services: Complex Atlantic Region as Case Study. Front. Mar. Sci. 6:199. doi: 10.3389/fmars.2019.00199
Received: 28 September 2018; Accepted: 29 March 2019;
Published: 25 April 2019.
Edited by:
Sebastian Villasante, University of Santiago de Compostela, SpainReviewed by:
Maria Sini, Department of Marine Sciences, University of the Aegean, GreeceJan Marcin Weslawski, Institute of Oceanology (PAN), Poland
Copyright © 2019 Willaert, García-Alegre, Queiroga, Cunha-e-Sá and Lillebø. This is an open-access article distributed under the terms of the Creative Commons Attribution License (CC BY). The use, distribution or reproduction in other forums is permitted, provided the original author(s) and the copyright owner(s) are credited and that the original publication in this journal is cited, in accordance with accepted academic practice. No use, distribution or reproduction is permitted which does not comply with these terms.
*Correspondence: Tom Willaert, dG9td2lsbGFlcnRAaG90bWFpbC5jb20=
Ana Isabel Lillebø, bGlsbGVib0B1YS5wdA==