 Cecilia M. Liszka
 Clara Manno
 Gabriele Stowasser
 Carol Robinson
 Geraint A. Tarling
- 1British Antarctic Survey, Cambridge, United Kingdom
- 2School of Environmental Sciences, University of East Anglia, Norwich, United Kingdom
Zooplankton fecal pellets (FPs) are important conduits of carbon from the surface to the deep ocean, as shown by their presence in deep-sea sediment traps. Zooplankton themselves are thought to play an important role in the breakdown and reworking of FPs as they sink, whilst processes such as diel vertical migration (DVM) may enhance the supply of carbon to the mesopelagic. However, comparatively little is known about the processes or variability of FP sinking/transport within the upper mesopelagic and how this relates to deeper ocean export. Profiles of FP type and size, and the contribution made by FPs to mesopelagic carbon flux to a depth of 400 m, were considered. Three contrasting locations in the Scotia Sea were compared, which together reflect the variability in physical regime and productivity encountered across the Southern Ocean. Comparing observed FPs with predictions from the mesozooplankton community, we show that, even at shallow depths, the smallest fraction of FP is under-represented, suggesting rapid remineralization, incorporation into larger aggregates or reworking into larger FPs, and that the flux is dominated by FPs from larger zooplankton. In contrast to models where POC attenuation rates are set to increase with temperature, we find that FP carbon flux attenuates rapidly in low productivity, colder regions dominated by krill, while remineralization is deeper in warmer areas where productivity is high and copepods dominate. This emphasizes the strong modulation of the zooplankton community on the supply and transfer of FP carbon between the epi- and mesopelagic. Evidence was found to suggest that DVM enhances FP flux across the upper mesopelagic, producing a pulse of fresh, dense material that may support secondary production and heterotrophic respiration in the mesopelagic. This illustrates that variability in flux at short (daily) as well as longer (seasonal) timescales may have important implications for the supply of FP carbon to deeper waters.
Introduction
The Southern Ocean (SO) is an important region for the global uptake and sequestration of CO2: whilst accounting for only 10% of global ocean area, it is responsible for >20% CO2 uptake (Takahashi et al., 2002). The biological carbon pump (BCP) delivers photosynthetically derived organic material from the euphotic zone to the deeper ocean (Legendre et al., 2015), largely via the sinking of phytoplankton cells and detrital aggregates including molts, feeding webs, and carcasses. It therefore exerts an important control on the uptake of atmospheric CO2 by the oceans. Whilst much of the SO is iron-limited and termed high nutrient-low chlorophyll (HNLC) (Martin, 1990; de Baar et al., 1995), there are also regions of exceptionally high productivity that may be of increased importance in driving the SO BCP. This includes areas of terrestrial iron input around archipelagos, where phytoplankton blooms can last up to 4 months (Whitehouse et al., 2008), and the seasonal ice edge where substantial seasonal diatom blooms are stimulated (Korb et al., 2005).
The BCP is enhanced by the passively sinking fecal pellets (FPs) of zooplankton and micronekton feeding in the epi- and upper mesopelagic, repackaging and converting small, slow-sinking phytoplankton cells into larger, faster-sinking agglomerates (Urrère and Knauer, 1981; Turner, 2015). Factors affecting FP export efficiency include temperature (Bendtsen et al., 2015; Marsay et al., 2015), season (Urban et al., 1993; Frangoulis et al., 2001), food type or availability, and FP composition or ballast (Francois et al., 2002; Ploug et al., 2008; Atkinson et al., 2012; Dagg et al., 2014), microbial colonization (Turner, 1979; Sampei et al., 2009; Belcher et al., 2016), and mechanical degradation (e.g., Sampei et al., 2009). Zooplankton are also important mediators of FP flux, transforming FPs via processes of ingestion (coprophagy), fragmentation (coprorhexy), and loosening (coprochaly) (Lampitt et al., 1990; Noji et al., 1991; Iversen and Poulsen, 2007), contributing to the export of carbon to the deep ocean and supporting the metabolism of mesopelagic biota (Buesseler et al., 2007; Steinberg et al., 2008; Robinson et al., 2010). FP export may be further augmented by the diel vertical migration (DVM) of zooplankton in response to feeding and survival cues (Angel, 1986; Emerson and Roff, 1987; Longhurst and Harrison, 1989). Deep FP production may therefore bypass the region of greatest zooplankton abundance and most rapid remineralization, expediting the transfer of organic carbon, nitrogen and phosphorous to meso- and bathypelagic depths (Urrère and Knauer, 1981).
Estimates of the contribution of FP carbon to export flux are subject to substantial temporal and spatial variability, ranging from <1% to ∼100% (González, 1992; González et al., 2000; Turner, 2002, 2015; Steinberg and Landry, 2017) and discrepancies between estimates of export to the ‘twilight’ zone (Buesseler et al., 2007; Burd et al., 2010) can be especially great at high latitudes (Maiti et al., 2013). Recent studies in the SO challenge assumptions of relationships between primary productivity (PP) or temperature to export efficiency (Maiti et al., 2013; Cavan et al., 2015; Marsay et al., 2015) and highlight the role of zooplankton–microbial interactions (Steinberg et al., 2008; Giering et al., 2014) or zooplankton trophic dynamics (Le Quéré et al., 2016) in resolving such discrepancies. Material collected in SO sediment traps demonstrates the importance of zooplankton mediated FP flux in this region, with well-preserved FPs being found at greater depths than expected from passive sinking alone (Wilson et al., 2013; Manno et al., 2015). Studies of FP morphology have also provided insight into the origin and repackaging of FPs throughout the water column (Turner, 2002; Wilson et al., 2008; Belcher et al., 2017a). Despite this, our knowledge of FP production and export processes in the SO remains hampered by a paucity of measurements at intermediate depths, particularly in the crucial region between the epi- and upper mesopelagic.
Evidence suggests that, where euphausiids are abundant and consume a diatom-rich diet, they can exert a strong control on export flux (Dagg et al., 2014). Euphausia superba is a central component of the SO ecosystem, linking PP and higher predators (Murphy et al., 2007) and their FPs have been found in deep sediment traps (Manno et al., 2015). However, Manno et al. (2015) also showed that variability in mesozooplankton community structure may be responsible for differences in deep FP export in the Scotia Sea. To better understand the role of zooplankton in the export of FPs to depth, we conducted a study at three contrasting locations within the Scotia Sea. This includes a naturally iron fertilized region with elevated PP and zooplankton abundances; a region of lower PP more characteristic of the wider SO; and an ice influenced region where seasonal diatom blooms occur and euphausiids can be particularly abundant (Lancraft et al., 1989; Atkinson et al., 2008).
We investigated FP morphology, vertical distribution and flux at six depths between the epi- and upper mesopelagic, to provide higher resolution insight into the supply and attenuation of zooplankton FPs on both sides of the mixed layer, beneath which exported material may be more likely to sink to depth. Our aim was to (i) establish the role of the zooplankton community in mediating FP flux to depth by comparing observed FP profiles with predictions based on the mesozooplankton community; and (ii) quantify the flux of FP carbon across the upper mesopelagic, from 5 to 400 m in different regimes within the SO. This will lead to an improved understanding of the factors affecting flux through the mesopelagic in three important and contrasting regimes typical of the SO.
Materials and Methods
Study Area and Sampling
This study was conducted at three time-series stations in the Scotia Sea: P3, P2, and ICE, which were sampled at six depths over the top 400 m (Figure 1). The stations encompass different oceanic regimes which is reflected in zooplankton community compositions. P3 is situated downstream of South Georgia where it benefits from natural iron fertilization and is characterized by high levels of biological productivity and a diverse zooplankton community. P2 is situated upstream of South Georgia and receives low natural iron inputs. Its zooplankton community is similar in composition to P3 but often lower in abundance. ICE is situated close to the ice edge where seasonal ice advance and retreat is an important feature and where euphausiids often dominate the zooplankton.
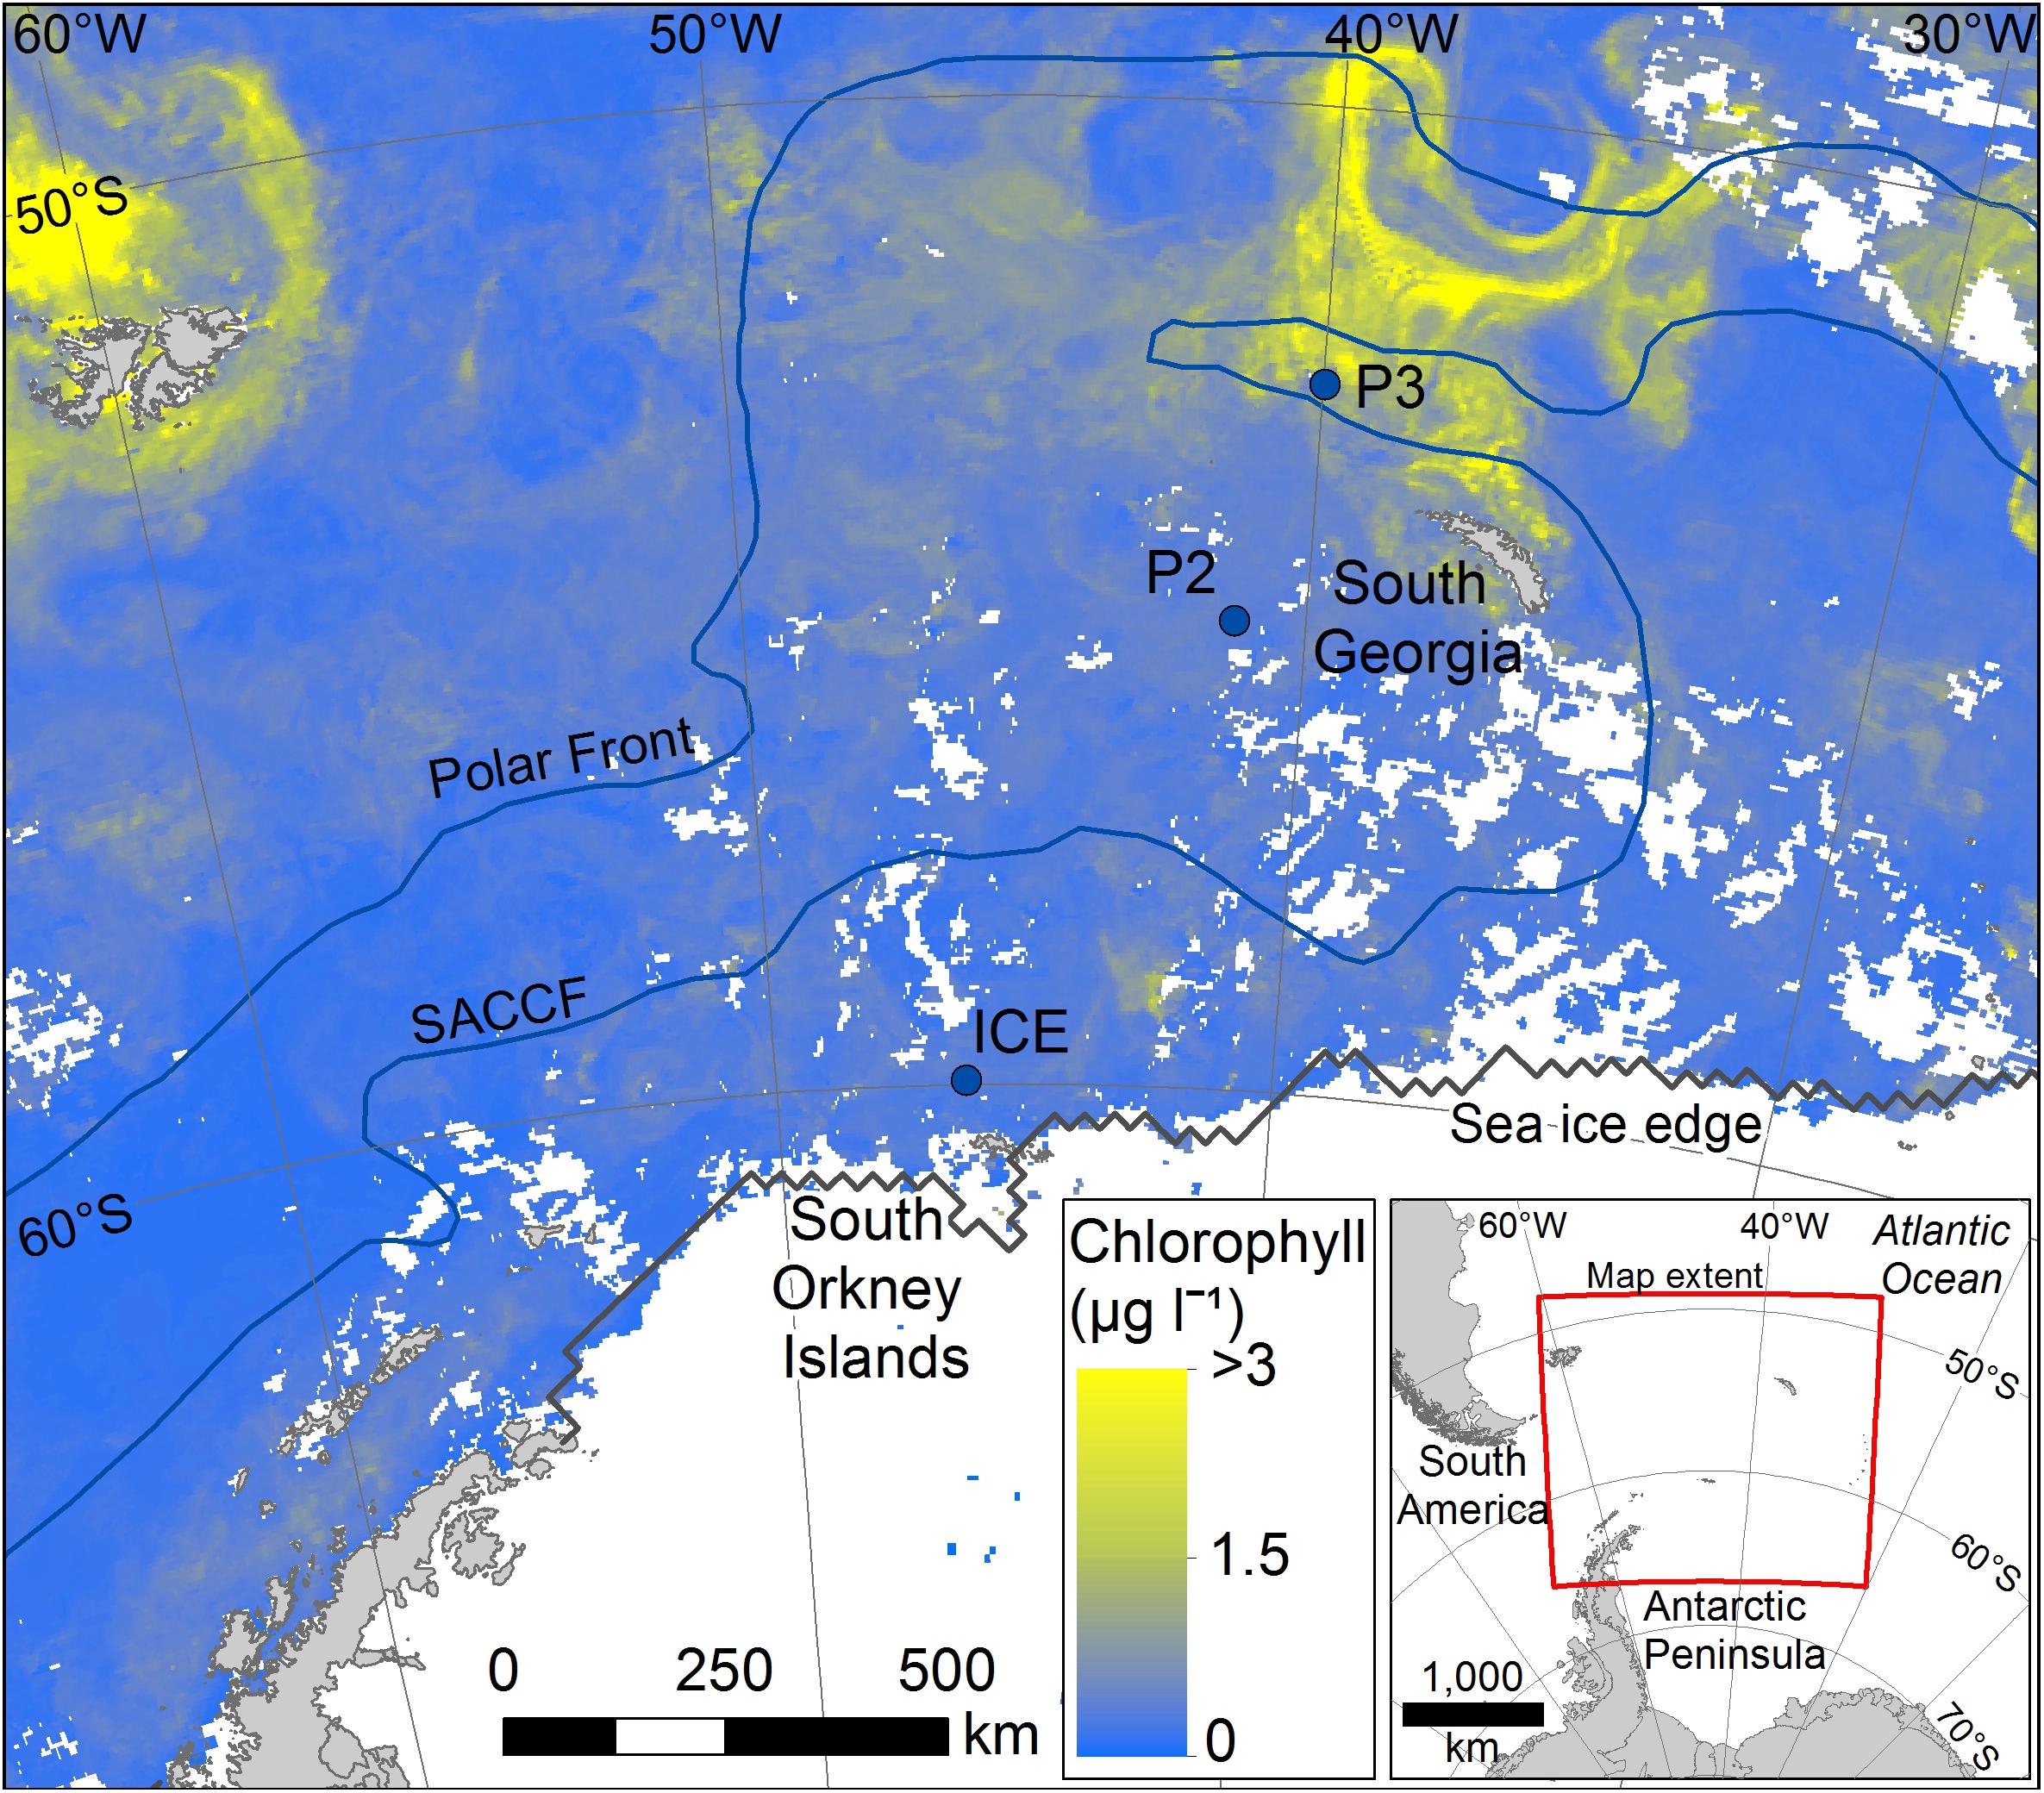
Figure 1. Mean chlorophyll data for the period covering sampling (stations marked with filled blue circles). Data for the period 25/11/14 to 26/12/14 were taken from NASA MODIS website: https://oceandata.sci.gsfc.nasa.gov/MODIS-Aqua/Mapped/Rolling_32_Day/4km/chlor_a/2014/.
All samples were collected on board the Southern Ocean research cruise JR304 (Watkins et al., 2015) on the RRS James Clark Ross. The expedition took place in the austral spring/summer season, from 15 November 2014 to 17 December 2014.
Environmental and Hydrographic Data
An SBE 9Plus CTD was set up with instrumentation including a dual SBE 3Plus temperature sensor, SBE4C conductivity sensor and a fluorometer. Fluorescence was converted from volts into chlorophyll a (μg l−1) using the manufacturer’s calibration. Chlorophyll a concentrations were used as a proxy for phytoplankton biomass at each station.
Aqua MODIS 4 km, 32-day mean chlorophyll data were also obtained from NASA’s Ocean Color Data website1 for the study area to provide additional environmental context and indicate mean phytoplankton biomass around the stations before, after, and during the period of sampling.
Sample Collection
Mesozooplankton samples were collected in order to predict the abundance and size spectra of FPs produced from within the upper 200 m for comparison with direct observations of FPs from bottle samples. Motion-compensated Bongo nets with a 200 μm mesh net (57 cm mouth diameter, 2.8 m long) were deployed at all time-series stations throughout the cruise (see Table 1). Nets were deployed vertically to 200 m depth during morning and evening, as close as possible to 12 h apart, in order to sample populations throughout the diurnal cycle. Samples were passed through a stacked sieve onto a 200 μm mesh and immediately frozen and stored at −80°C. Once back at the laboratory they were defrosted and immediately fixed in 100% ethanol in preparation for analysis.
An SBE32 carousel water sampler holding 24 12 L Niskin bottles and attached to a SBE 11Plus deck unit was deployed for collection of water for FP and phytoplankton analysis at three stations, ICE, P2, and P3 (see Table 1). Six bottles were fired at each station, one at each of the following depths: 5 m, 20 m, 40 m, 100 m, 200 m, and 400 m. These depths were selected to give good coverage throughout the mixed layer and the undersampled portion of the upper mesopelagic between the base of the mixed layer and deep sediment traps.
Once on deck, water was gently siphoned out of the Niskin bottles via a piece of silicone tubing, which had been pre-rinsed three times with 0.22 μm filtered seawater (FSW), into pre-rinsed 20 L carboys. To ensure collection of all possible fecal material from the funneled base of the Niskin bottles, the base of each bottle was opened, rinsed with FSW, and the water collected in separate sterile 250 mL Nalgene bottles.
The contents of the carboys and Nalgene bottles were then gently filtered through a 53 μm mesh and bottles rinsed through with FSW. The contents of the mesh were backwashed into a 250 mL sterile Nalgene bottle using a 5% borax-buffered formalin-seawater solution.
Formalin-preserved samples were stored in the shipboard chemical cupboard in the dark until arrival back at the laboratory, where they were stored in the dark at ambient temperature and analyzed within 21 months.
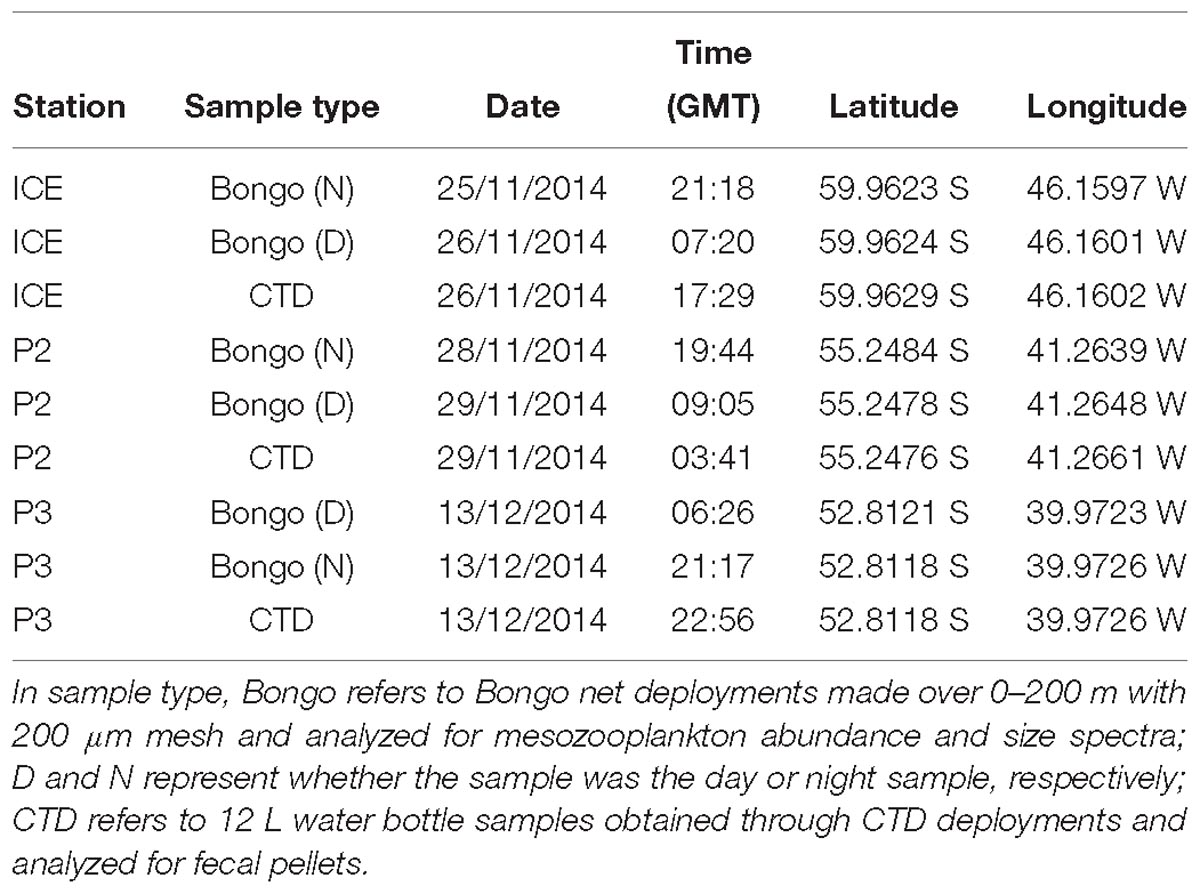
Table 1. Details of sampling undertaken in the Scotia Sea, Southern Ocean during cruise JR304.
Sample Analysis
Mesozooplankton
Mesozooplankton samples were split using a Folsom Plankton Splitter, according to the density of the sample, and final splits were analyzed using two methods. The first half of the final fraction split was transferred to a beaker and topped up to 500 mL. Three 25 mL aliquots were extracted and analyzed for abundance and size spectra using ZooScan (CNRS and Hydroptic) and Ecotaxa (Picheral et al., 2017), a semi-automated software package for digital zooplankton analysis. The second half of the final split was preserved in 35 mL 95% ethanol and analyzed by the Plankton Sorting and Identification Center Morski Instytut Rybacki, Poland. Samples were classified to the lowest possible taxonomic resolution for additional semi-quantitative and contextual information about the taxonomic composition of samples.
Fecal Pellets
The contents of Nalgene bottles (generally between 100 mL and 200 mL) were filtered onto a 53 μm mesh, gently rinsed and backwashed into petri dishes. Petri dishes were examined under a light microscope (Olympus SZX16 with SDF PLAPO 0.5XPF and 1.6XPF objectives) for whole or fragmented FPs and other organic matter (e.g., diatoms, protozoa, and detritus). FPs were photographed using a Canon EOS 70D camera. Observations related to type and abundance of sample content, lens and magnification of photographs were recorded.
FPs were categorized into morphological type: cylindrical, spherical, ovoid or ellipsoidal. Images were visually examined and length (L) and width (W) measured with the imaging software, ImageJ (Rasband, 1997/2016). Where the item was an irregular shape, e.g., wider at the top than the bottom, measurements of each part were made and an average taken. FP volume was calculated using the geometric formulae for sphere, cylinder and ellipsoid/ovoid (González et al., 2000; Manno et al., 2015). Since spherical items included some that were a slightly irregular shape, the radius was taken as half of the average of both the L and W measurements. FP carbon content was calculated using mean conversion factors specific to the Scotia Sea for spring-early autumn calculated by Manno et al. (2015): 0.052 mg C mm−3 for ovoid/ellipsoidal; 0.035 mg C mm−3 for spherical; and 0.030 mg C mm−3 for cylindrical FPs.
A number of FPs, including many spherical items that were too small to identify clearly with the magnification of the light microscope alone, were examined further with Scanning Electron Microscopy (SEM). Samples were filtered onto 53 μm mesh, rinsed to remove formalin and backwashed into a petri dish. They were then pipetted gently onto PELCO double coated carbon conductive tabs, excess water was pipetted off and the stub was allowed to air dry. Samples were analyzed with a Hitachi TM3000 SEM and associated software.
Estimates of FP numbers are likely to represent a minimum per sample due to unavoidable losses incurred during transfer stages, despite care taken to minimize this.
Phytoplankton Analysis
Samples were visually assessed for the number of phytoplankton species and their comparative abundances. The most common species were identified and their abundances across stations and depth were assessed semi-quantitatively.
Data Analysis and Statistics
Mesozooplankton
Following Ecotaxa image processing and verification, data were analyzed in RStudio (V.1.0.136) (R Core Team, 2016), converting object length in pixels [estimated with ZooScan as the object’s major axis (Gorsky et al., 2010)] to prosome length (PL, mm) and using this value to classify zooplankton into 0.1 mm size spectra bins, ranging from 0–0.1 mm to 5.9–6.0 mm.
Counts per sample were calculated by multiplying abundance (as quantified from ZooScan samples) up to the 500 mL subsample from which the aliquots originated and then by the relevant split. Counts per sample were converted to individuals m−3 by dividing by the volume filtered (calculated from the net mouth area multiplied by the depth of haul). These values were multiplied by 200 (the depth of haul in m) to determine individuals m−2.
An Anderson–Darling k sample test was performed on pairs of day/night samples to examine whether the distributions of prosome size spectra differed statistically. Day/night abundances from each station were averaged in order to account for any changes in the taxonomic composition of the mixed layer resulting from any normal or reverse patterns of DVM in the mesozooplankton community.
The predicted FP size (volume, FPV) from these animals was calculated as a function of prosome length (PL) following Eq. (1):
where θ of 2.58 and n of 5.4 have been taken from known relationships derived and adapted from Mauchline (1998) and Stamieszkin et al. (2015).
Predicted FP size was compared with actual FP size by comparing the frequency distributions of each using an Anderson–Darling k sample test.
Following taxonomic analysis, the percent contributions of individual taxa to the whole sample was calculated.
Fecal Pellets
Fecal pellet abundance m−3 was calculated by dividing abundance per sample by the volume of the Niskin sampling bottle (12 L) and multiplying by 1,000. The same calculation was used to calculate the volume and carbon of FPs m−3.
To investigate a difference in FP volume over depth, ANOVA tests were carried out for each station (Shapiro–Wilks and Kruskal–Wallis). Volumes of FPs from 5 m, 20 m, 40 m, and 100 m were also combined into a 0–100 m depth bin and 200 m and 400 m were combined into a 200–400 m depth bin to investigate whether FP volume changed significantly from the upper to lower mesopelagic and the same ANOVA tests were applied.
Fecal pellet flux was calculated following the methodology set out in Dagg et al. (2014) according to Eq. (2):
where ws is the FP sinking velocity, C is FP carbon content (g C), and V is the sample volume (m3).
Fecal pellet sinking velocity (ws, m d−1) was calculated using an empirically derived relationship adapted from Komar et al. (1981), Eq. (3), which has been shown to represent the settling velocities of mixed copepod and euphausiid FPs of different dimensions from a number of datasets.
where L is FP length (cm) and W is FP diameter (cm).
Statistics were carried out in SigmaPlot V.13.0.0.83 (Systat Software Inc.) and RStudio (V.1.0.136) (R Core Team, 2016).
Results
Environmental and Hydrographical Context
Chlorophyll a fluorescence profiles obtained from CTD instrumentation (Figure 2) are used as a proxy for the phytoplankton biomass. All three stations exhibited subsurface chlorophyll a maxima and high levels of chlorophyll a were found as deep as 100 m. The highest value was observed at P3 with a chlorophyll a maximum of 2.7 μg l−1 at ∼30 m, although it was consistently >2 μg l−1 between 0 and 50 m, remaining at >0.5 μg l−1 as deep as 80 m and only reaching a minimum below 120 m. The lowest value was observed at ICE where peak chlorophyll a at ∼35 m was 0.5 μg l−1, followed by a secondary peak of ∼0.4 μg l−1 at ∼70 m, with values remaining between 0.1 and 0.4 μg l−1 as deep as 120 m. At P2, chlorophyll a in the top 100 m was relatively constant at ∼0.5 μg l−1 from 0 to 65 m with sharp peaks >1.5 μg l−1 at ∼10 and 45 m and 0.9 μg l−1 at ∼80 m, possibly indicating some surface-level disruption to the water column from wind or storm turbulence.
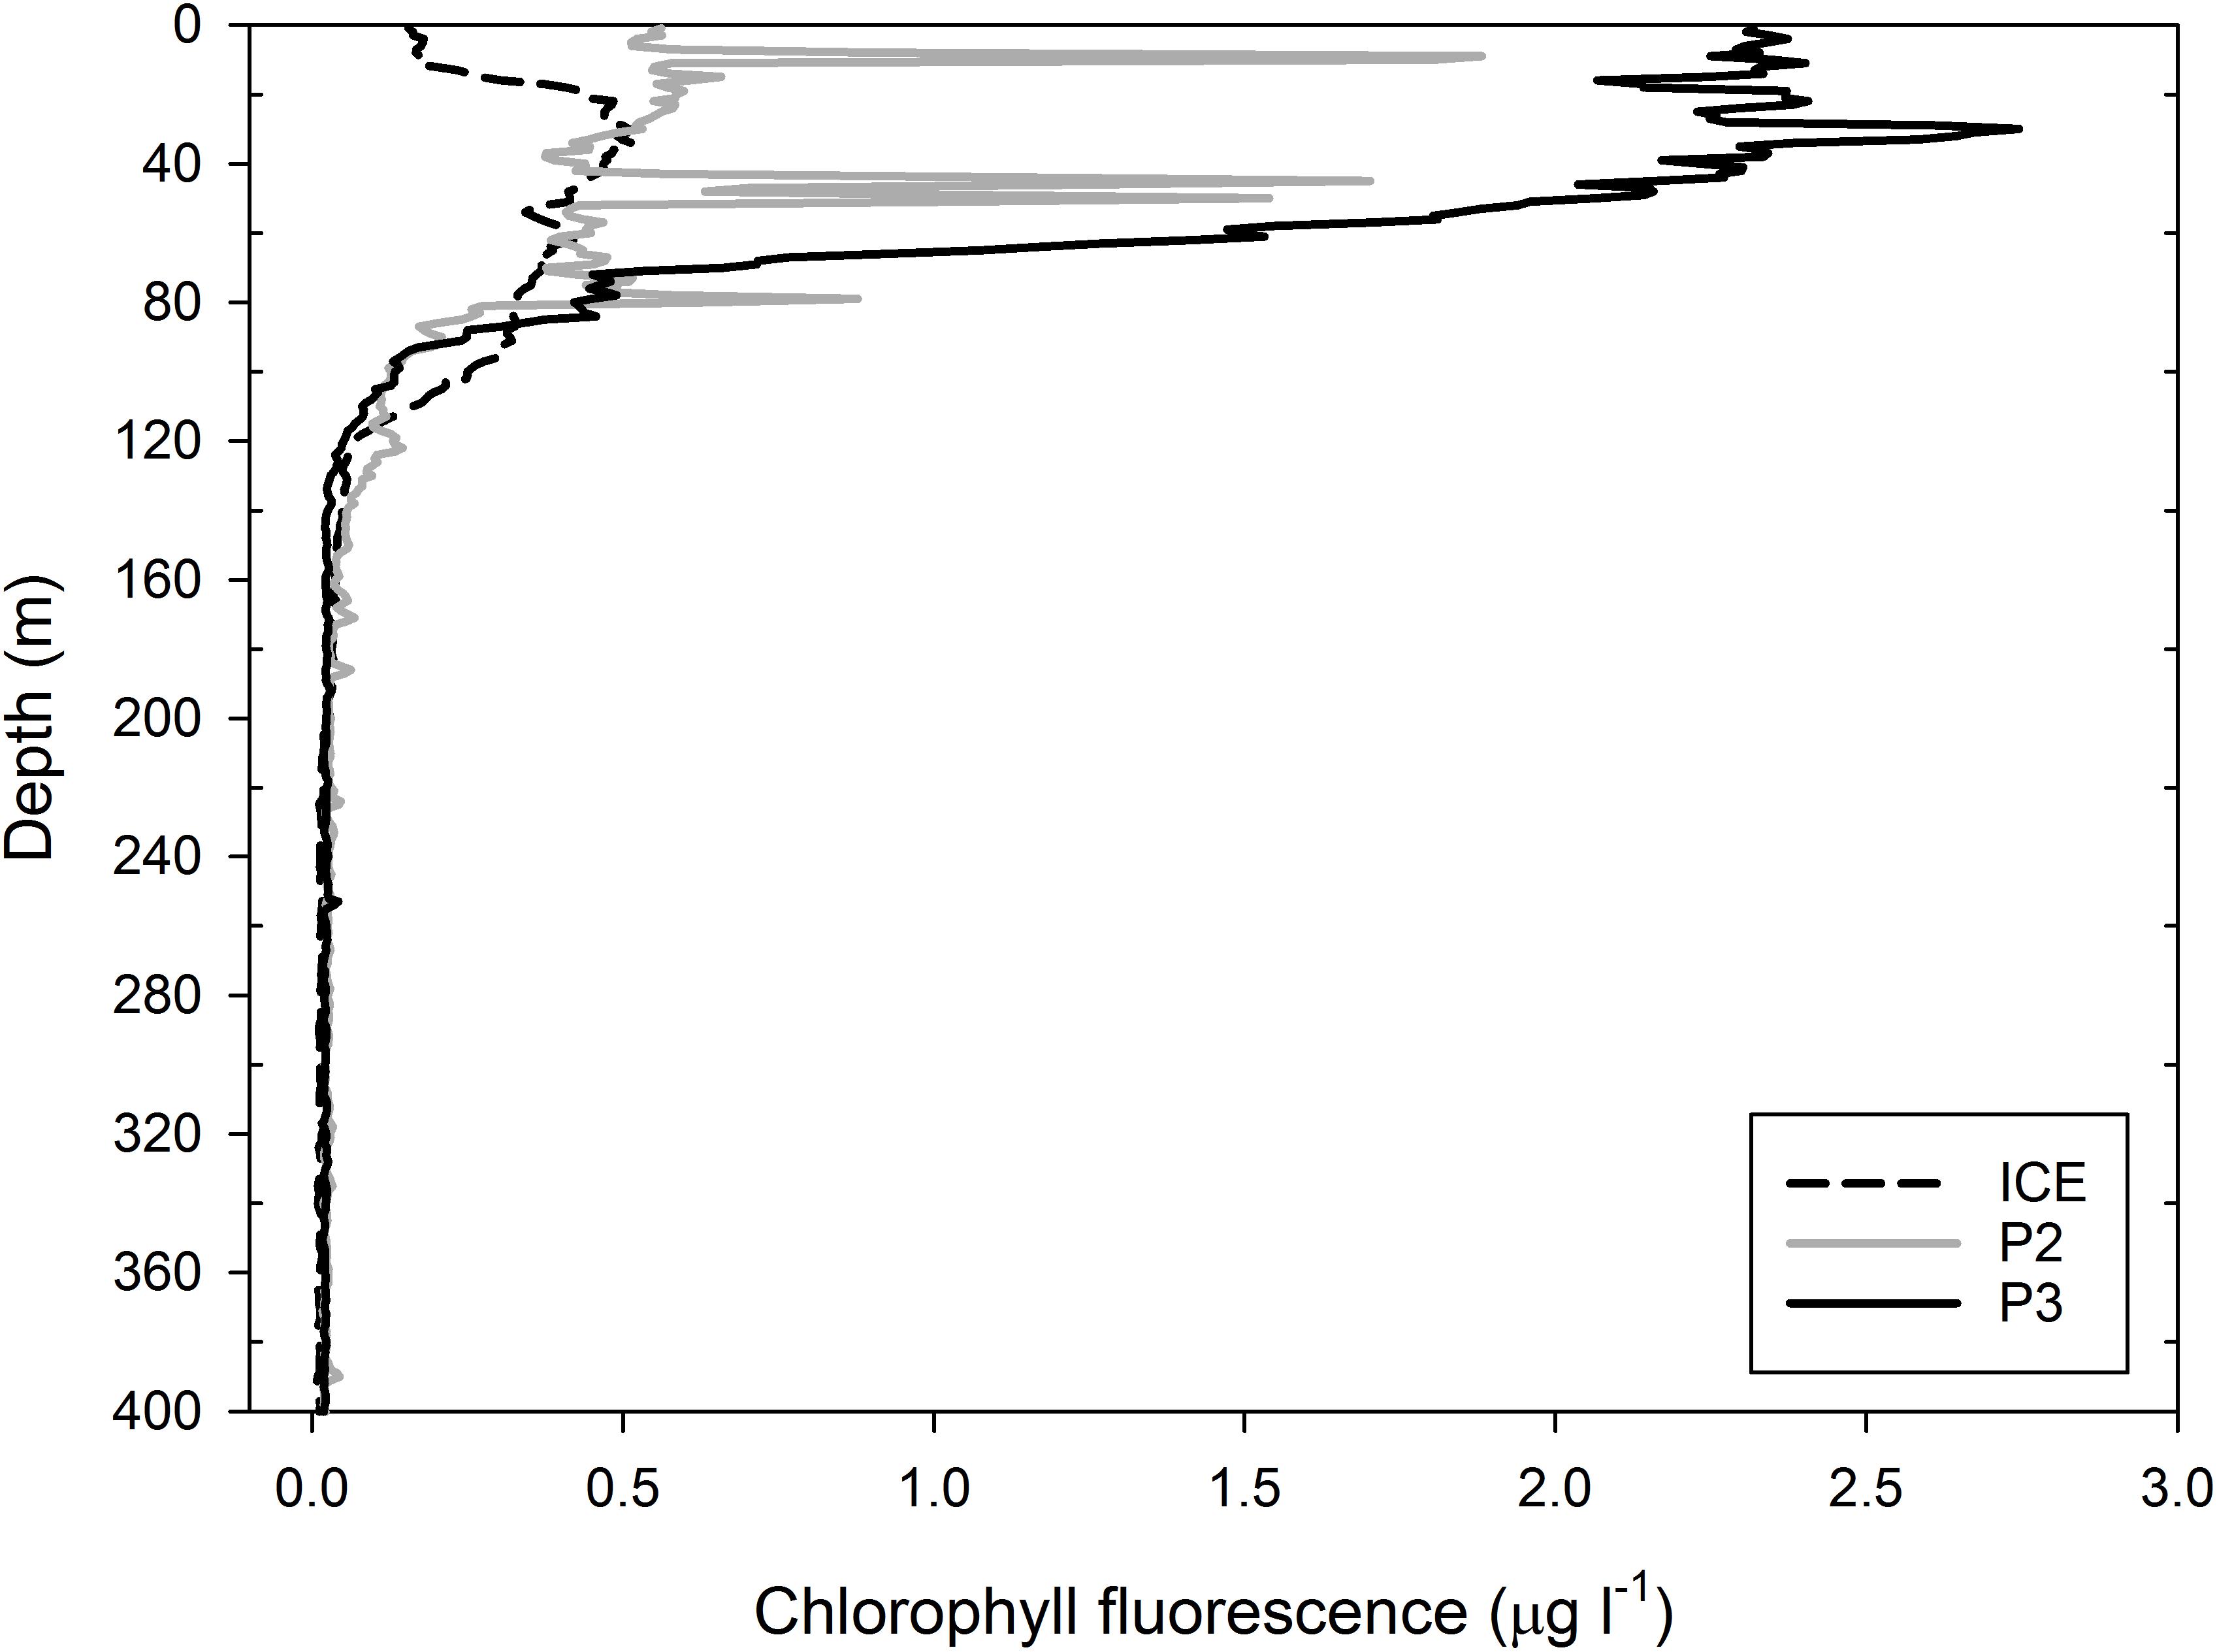
Figure 2. Profiles of chlorophyll a concentrations (μg l−1) based on fluorescence measurements at ICE, P2, and P3. Measurements were taken with CTD casts from which water samples were obtained.
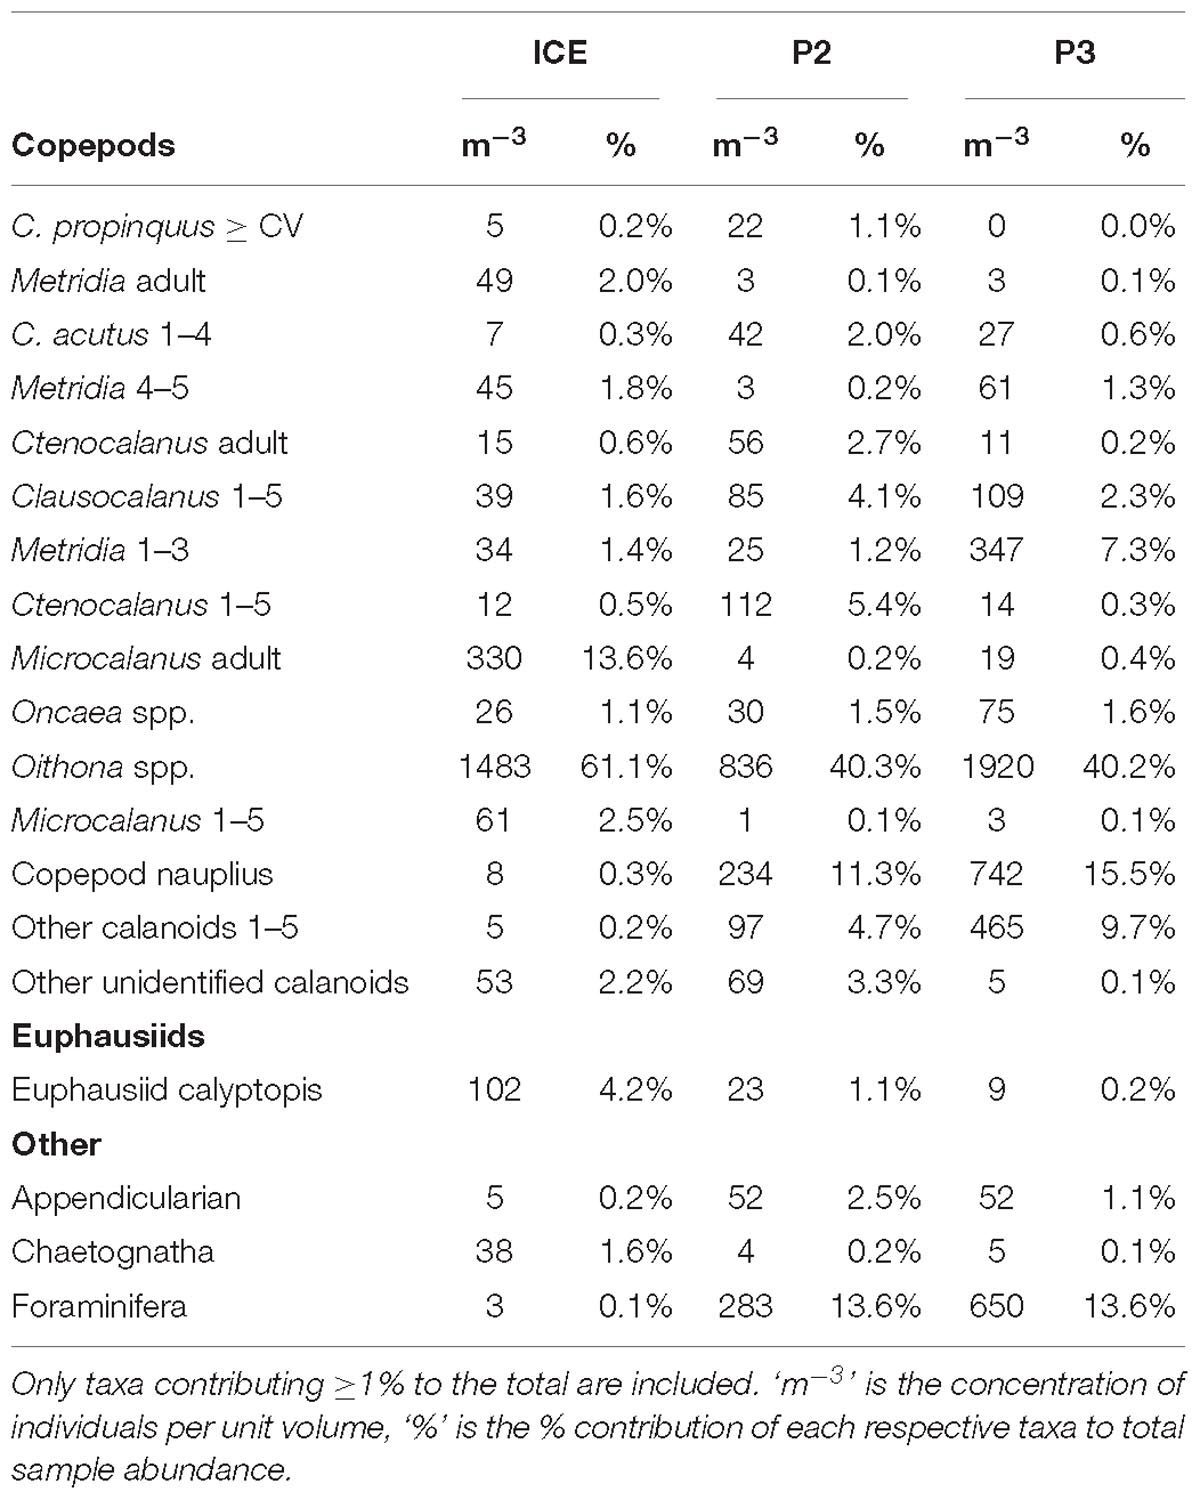
Table 2. Detailed taxonomic composition of mesozooplankton samples from 0 to 200 m at ICE, P2, and P3 grouped to species/stage (copepods), genus (euphausiids), and major group for all other taxa.
Mesozooplankton Abundance and Distribution
Table 2 shows the percent contribution of the most abundant taxa in the mesozooplankton community. Copepods comprised the majority of the mesozooplankton at all stations (80% at P2 to 93% at ICE). At P2 and P3, the mesozooplankton community was dominated by cyclopoids, especially Oithona spp., which comprised 40% of the total, and copepod nauplii (11% and 16%, respectively), whilst at ICE, Oithona spp. (61%) and Microcalanus adults (14%) dominated.
Due to the ability of larger euphausiids to avoid the Bongo net, adult euphausiids were almost absent at all stations but younger stages (calytopes, furcilia, and juveniles) comprised 4% at ICE, 1% at P2 and <1% at P3. Another important group at P2 and P3 was the Foraminifera, comprising 14% at both stations, but <1% at ICE.
An Anderson–Darling k sample test found no significant difference between the day and night nets (p > 0.05). The two nets were therefore combined into an average for each station. Abundance at P2 (>910 m−3) was over 12 times greater than at the ICE station (<75 m−3) and P3 abundances (>2,500 inds m−3) were almost three times greater than at P2 (individual station plots are in Supplemetary Figure S1).
Mesozooplankton size range (PL, mm; Figure 3) did not vary substantially between stations (median PL 0.35–5.15 mm at ICE, 0.35–5.05 at P2, and 0.35–5.25 mm at P3) with the range between modes being just 0.04 mm (modal peak abundance, x0(P3) = 0.60 mm, x0(ICE) = 0.62 mm, and x0(P2) = 0.64 mm).
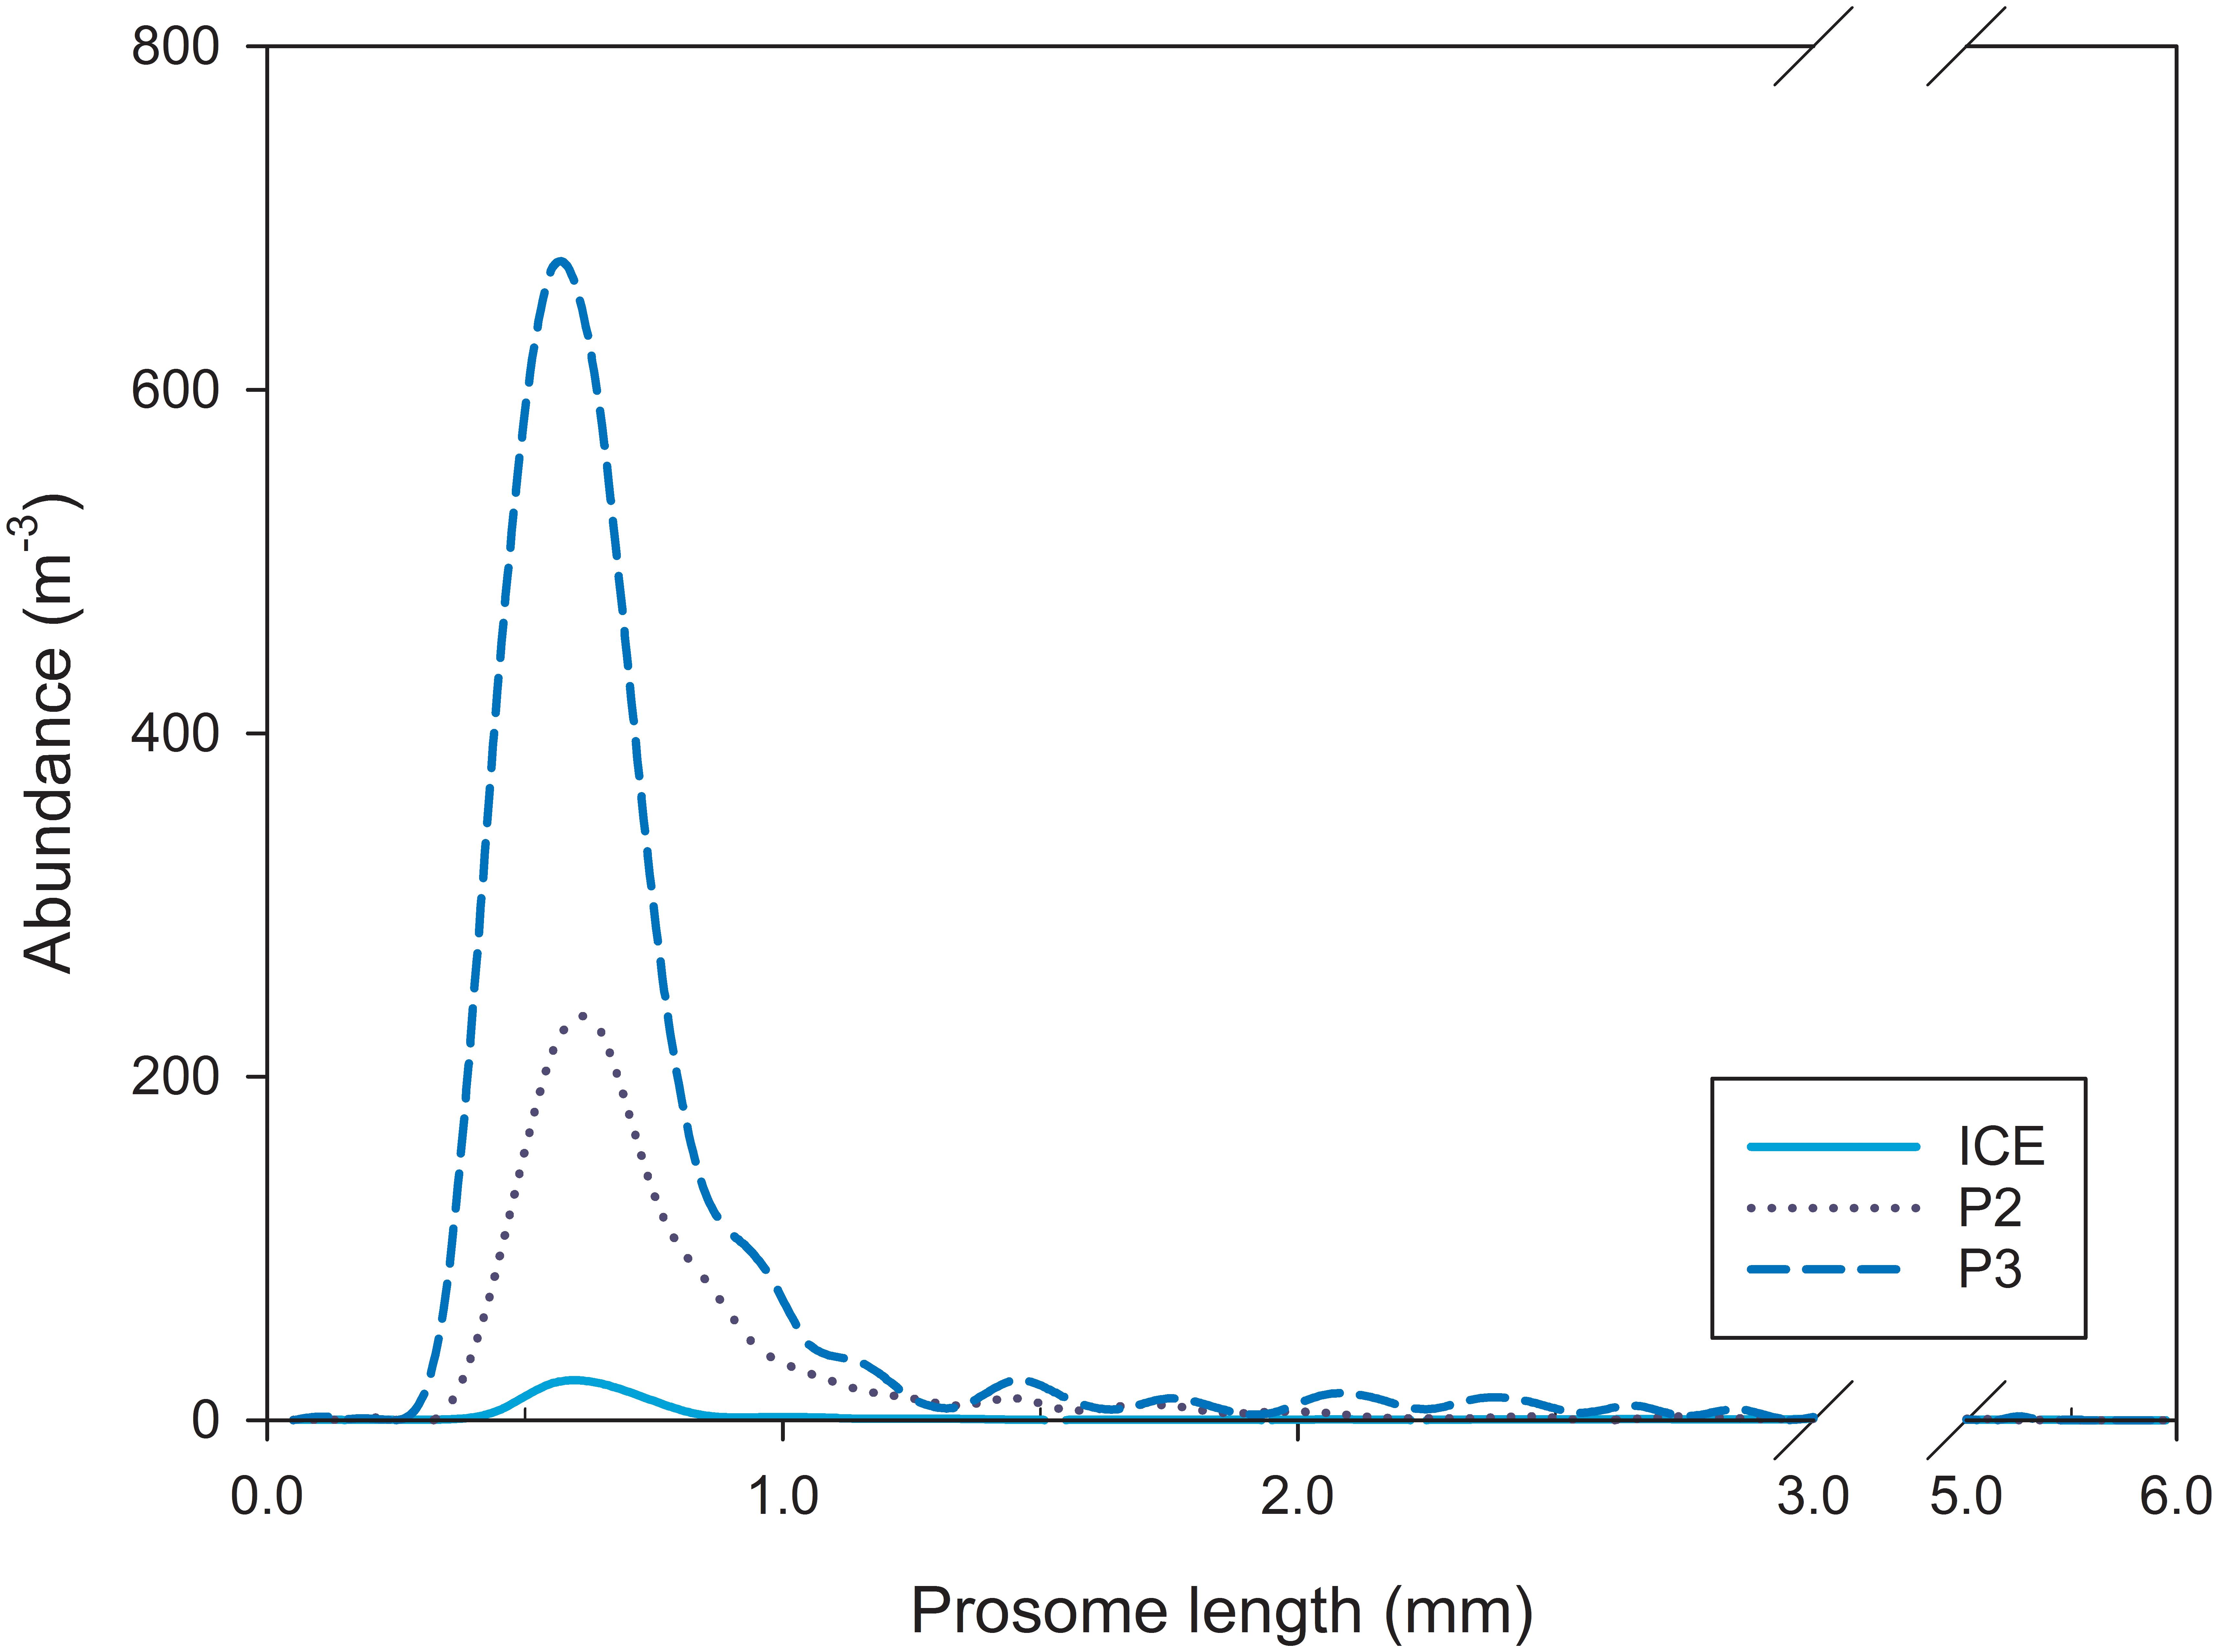
Figure 3. Mesozooplankton abundance and size spectra based on prosome length (PL) at ICE, P2, and P3.
Fecal Pellet Morphology and Size
Examples of the different morphological types identified as seen under the light microscope and SEM microscope are shown in Figures 4 and 5, respectively.
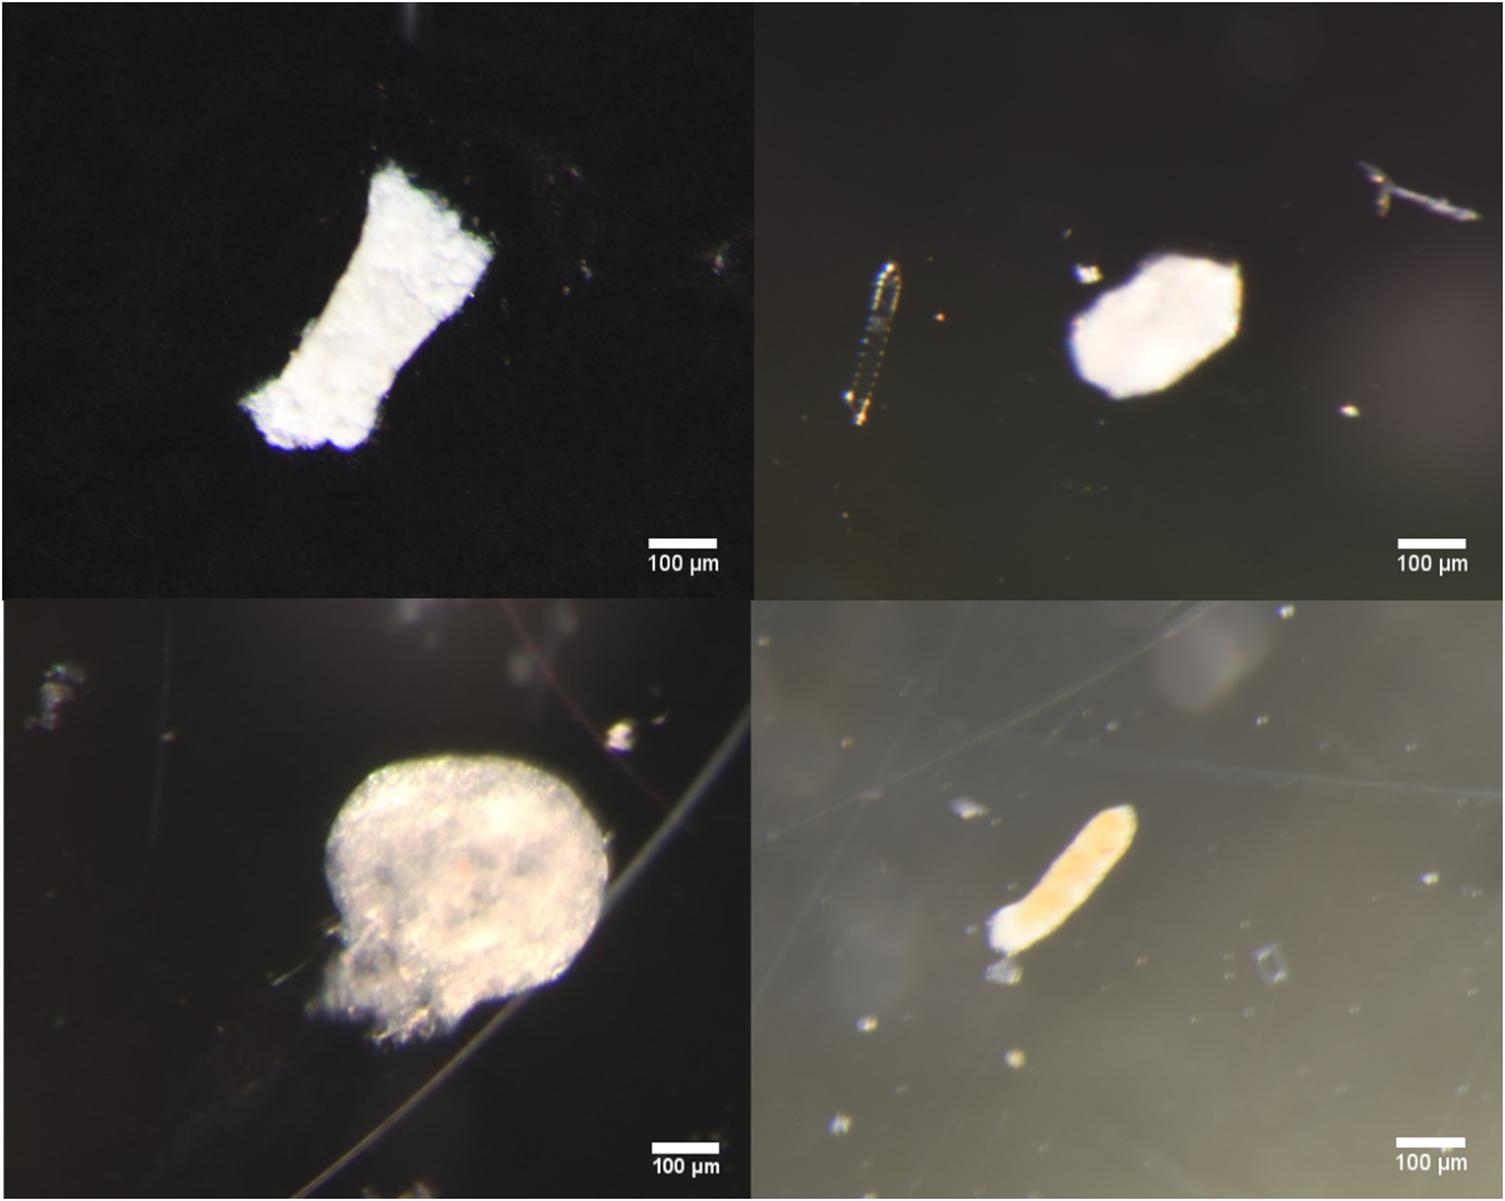
Figure 4. Clockwise from top left: Light microscope images of broken cylindrical, intact ovoid, partially broken ellipsoidal, and spherical fecal pellets typical of those found in samples.
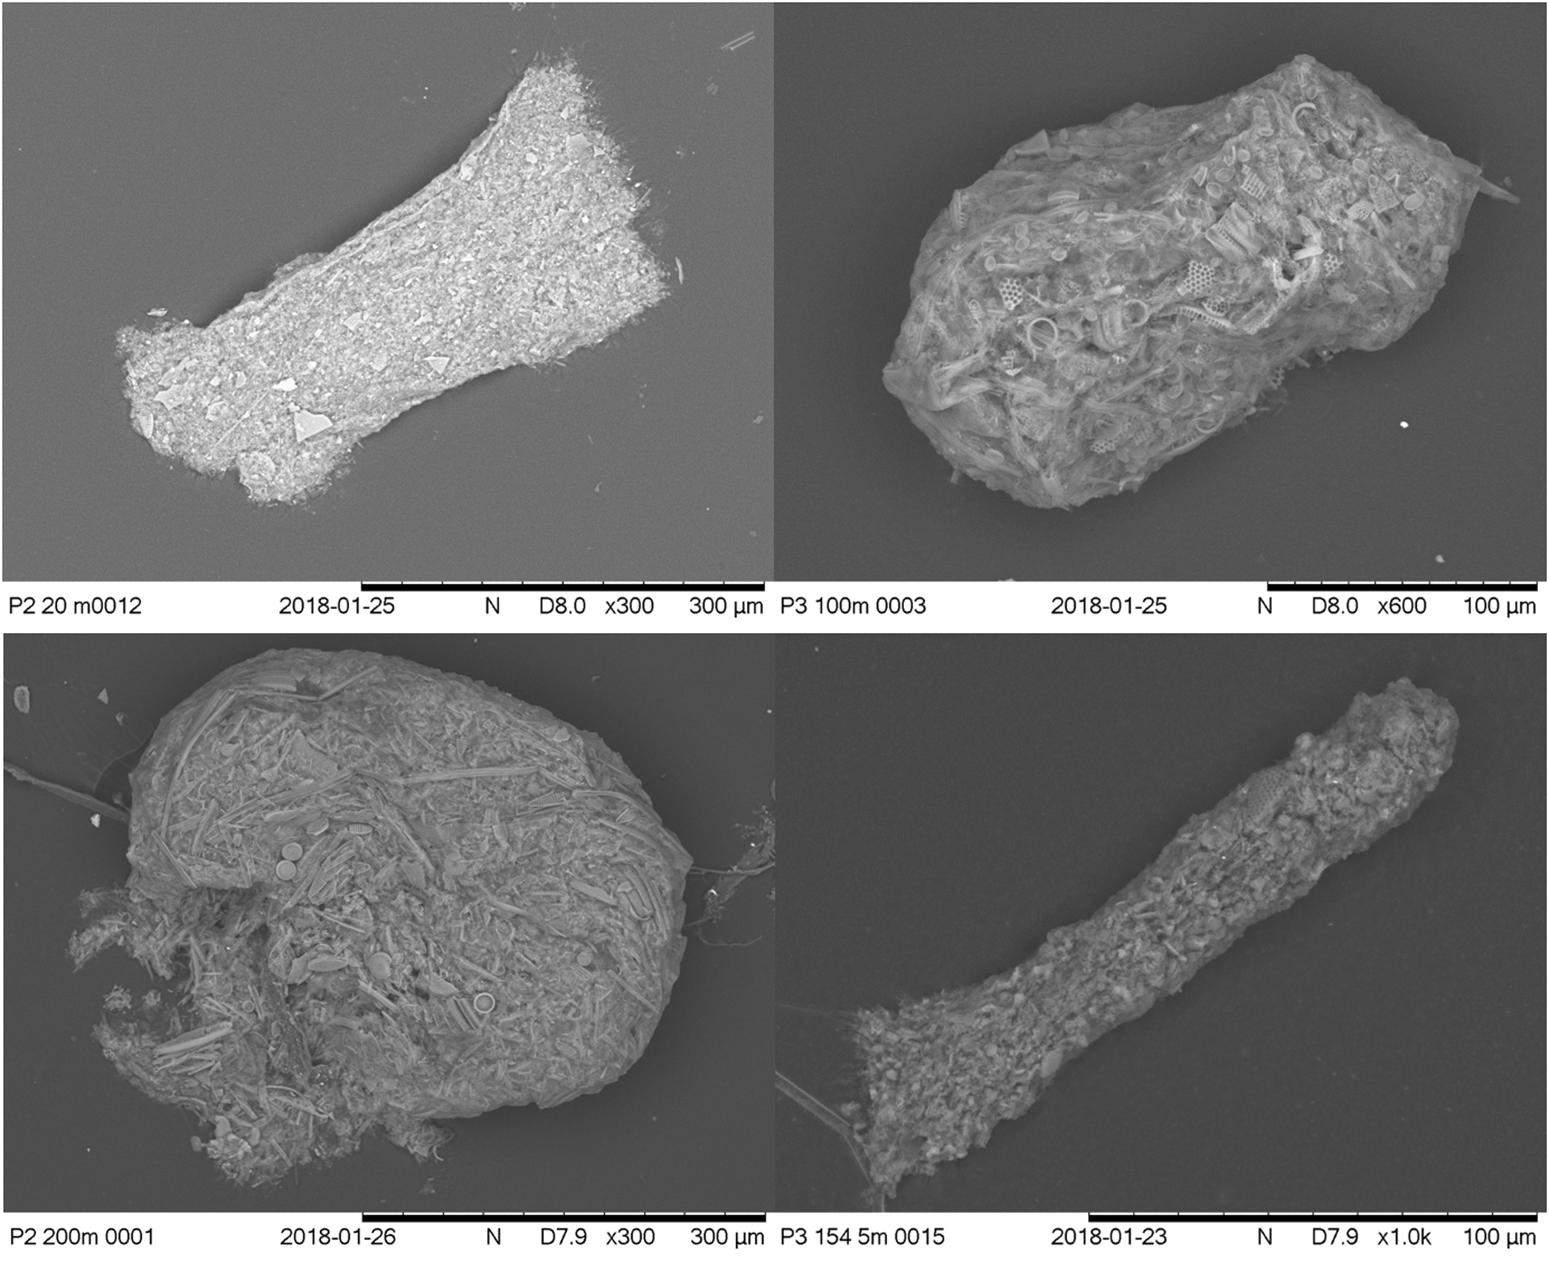
Figure 5. Clockwise from top left: SEM images of broken cylindrical, intact ovoid, partially broken ellipsoidal, and spherical fecal pellets typical of those found in samples. Images show evidence of organic material, peritrophic membrane (on ovoid and spherical FPs) and diatom fragments.
The contribution of FPs of different morphological type to total FP number and volume varied across depth and between stations (Figure 6). At ICE, cylindrical FPs dominated the flux in both abundance and volume over all depths, contributing most to the flux at 20 m (89% of total volume) and remaining the dominant contributor until 400 m. Ellipsoidal and ovoid FPs were also important, together contributing over 50% at 5 m and ≥40% at 40 m and 400 m but demonstrating no clear pattern. Spherical FPs were most prominent at 40 m in both abundance and volume although they only contributed 10% of flux, attenuating rapidly below 40 m.
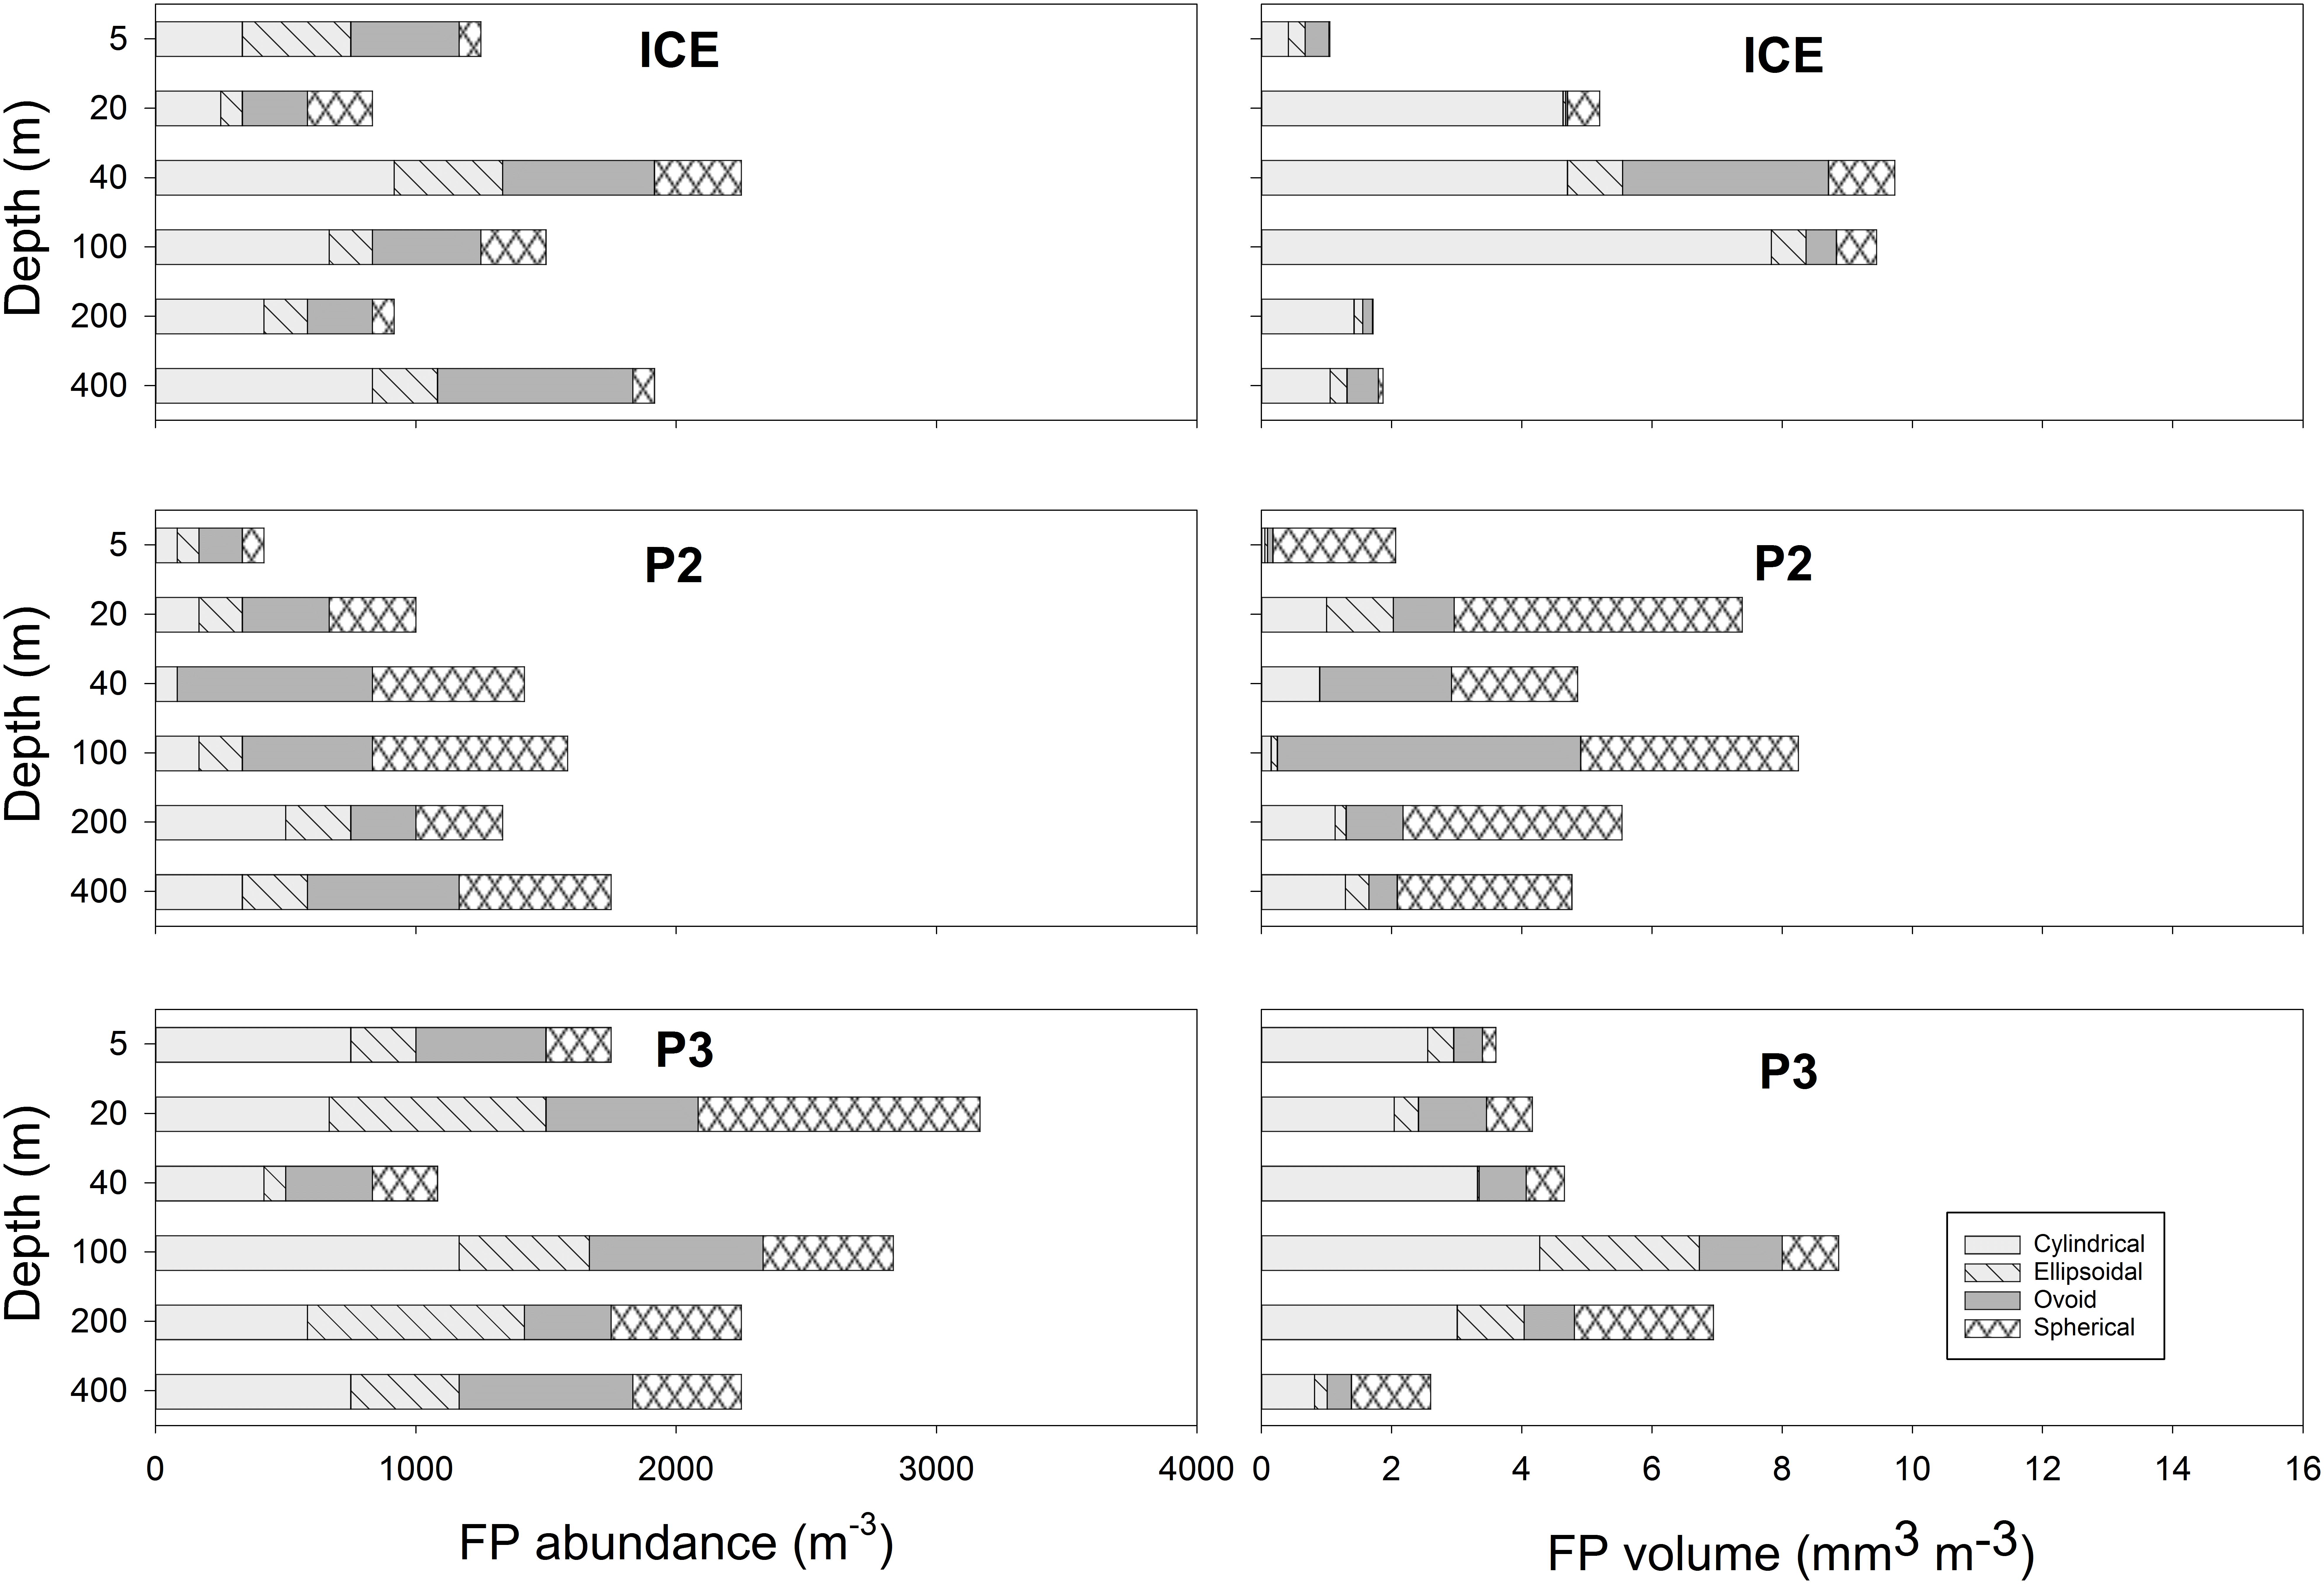
Figure 6. (Left) Total abundance of FPs at each station, stacked by contribution of different morphological type. (Right) Total volume of FPs at each station, stacked by contribution by different morphological type.
At P2, ovoid and spherical FPs strongly dominated in abundance and volume at all depths (≥73% in the top 200 m, 65% at 400 m), with only small contributions from cylindrical or ellipsoidal FPs. Despite this, the contribution of cylindrical FPs to FP volume generally increased with depth, from 3% at 5 m to 27% at 400 m, although there was no apparent pattern to ellipsoidal FPs.
At P3, the contribution of cylindrical FPs dominated in both number and volume over the top 200 m, although the overall mix was much more heterogeneous. Both ovoid and ellipsoidal FPs were fairly significant contributors, on average contributing 27% to total volume over all depths. Spherical FPs tended to increase in importance with depth however and, by 400 m, had become the greatest contributor to total volume (47%).
Fecal pellet abundance (m−3) (Figure 6, left panel) throughout the upper water column (0–100 m) differed between stations, although at all stations there was some attenuation between 100 and 200 m followed by an increase at 400 m. FP volume (mm3; Figure 6, right panel) increased at ICE to a 40 m maximum, decreasing slightly at 100 m and substantially thereafter; a bimodal peak in volume was exhibited at 20 m and 100 m at P2; whilst at P3, FP volume increased substantially to a 100 m peak before attenuating.
The mean size of FPs (measured in volume, mm3) at each depth across stations is shown in Figure 7. At ICE, FP size was greatest at 100 m (0.0063 mm3) although a similar size peak occurred at 20 m (0.0062 mm3). This was comprised mainly of FPs of a cylindrical morphology. At P2, mean size was greatest at 20 m (0.0074 mm3), comprised largely of ovoid and spherical FPs, with a secondary peak at 100 m before decreasing to a 400 m minimum. At P3, FP size peaked at 40 m (0.0043 mm3) before decreasing slightly to 200 m and more substantially at 400 m.
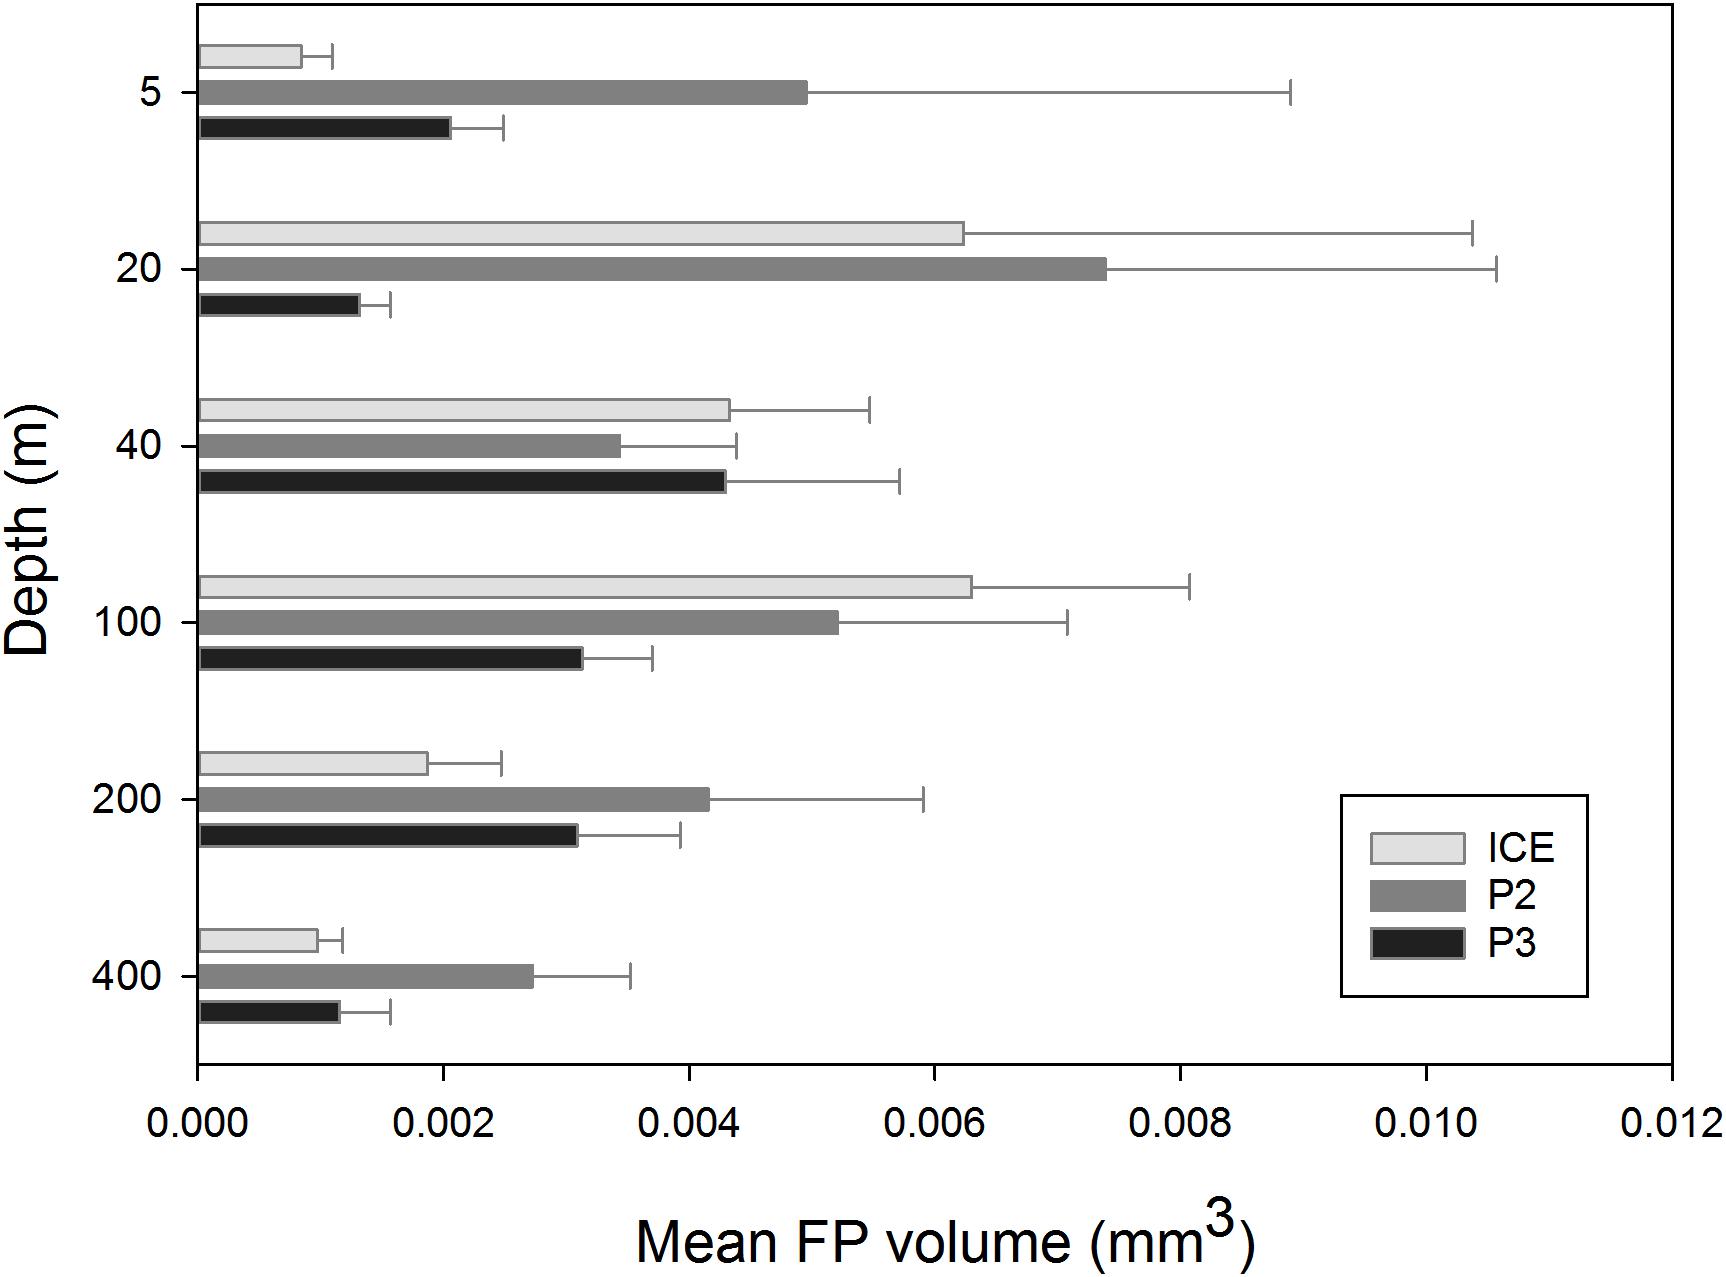
Figure 7. Plot of the mean size (volume, mm3) of FPs across depth at ICE, P2, and P3.
The size spectra (volume, mm3) of FPs encountered at each station ranged from <0.0001–0.045 (ICE), <0.0001–0.043 (P2), and <0.0001–0.018 (P3). No significant difference (Shapiro–Wilk’s and Mann–Whitney U-statistic) was found in FP volume between those found in the 0–100 m depth range and those from 200 to 400 m. Predicted FP size spectra ranged from <0.0001–0.016 (ICE), <0.0001–0.015 (P2), and <0.0001–0.017 (P3). At all three stations, the majority (>80%) of predicted FPs occurred in the 0.0002–0.01 mm3 size range.
Distributions of predicted FP size spectra, based on the mesozooplankton community in the top 200 m, and actual FP size spectra of FPs encountered in the top 200 m at each station, are shown in Figure 8. Anderson–Darling k sample tests revealed significant differences (p < 0.0001) between the size spectra of FPs predicted from zooplankton community size structure and those actually observed (based on volume), both between 0 and 200 m and 0 and 400 m depth (total FP sampled depth). In particular, many more FPs were predicted to occur in the smaller size fraction but most FPs were observed at the larger end of the size spectrum.
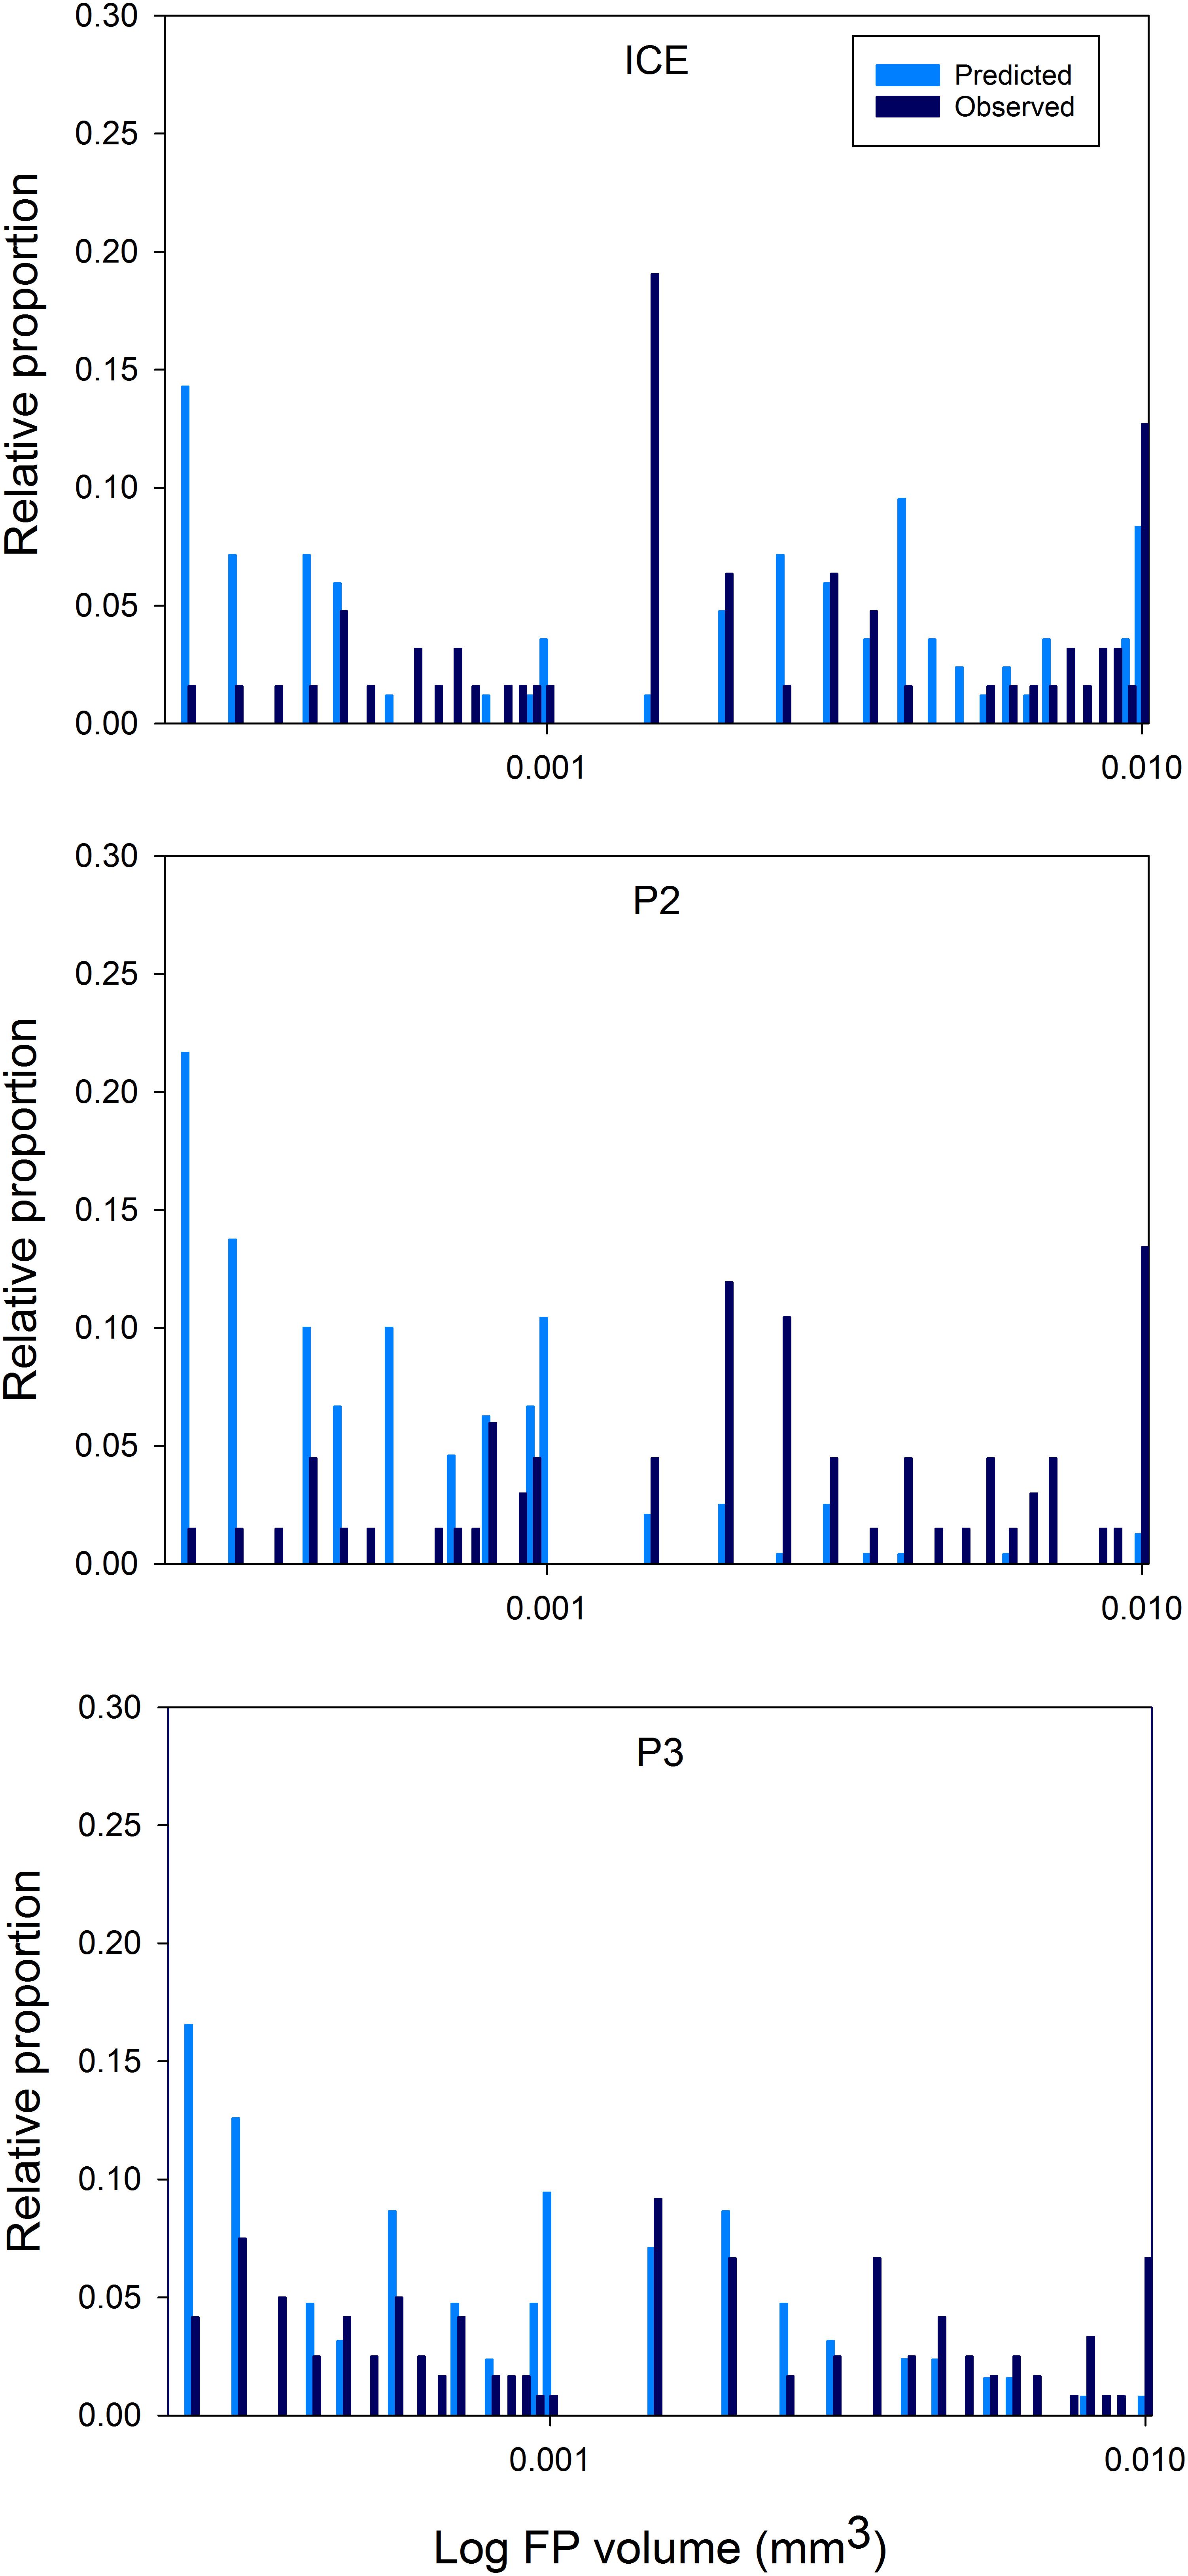
Figure 8. Area plots of predicted versus observed FP size distributions over 0–200 m. FPs ≥ 0.0002 mm3 are plotted as the log FP volume (mm3) against the proportion of the total for each FP size class (as a percentage).
Fecal Pellet Sinking Rates and Carbon Flux
The mean sinking velocities of FPs at each depth, as calculated from the relationship derived by Komar et al. (1981), are presented in Figure 9. Sinking rates were generally highest at P2 and lowest at P3. At ICE there was an increase in mean sinking speed to a maximum of 270 m d−1 at 100 m, followed by a decrease to 82 m d−1 at 400 m. At P2, there was a strong decrease in sinking velocity with depth from 437 m d−1 maximum at 20 m to 192 m d−1 at 400 m. At P3, there was a slight increase in sinking rate to 218 m d−1 maximum at 40 m followed by a steady decrease to 115 m d−1 at 400 m.
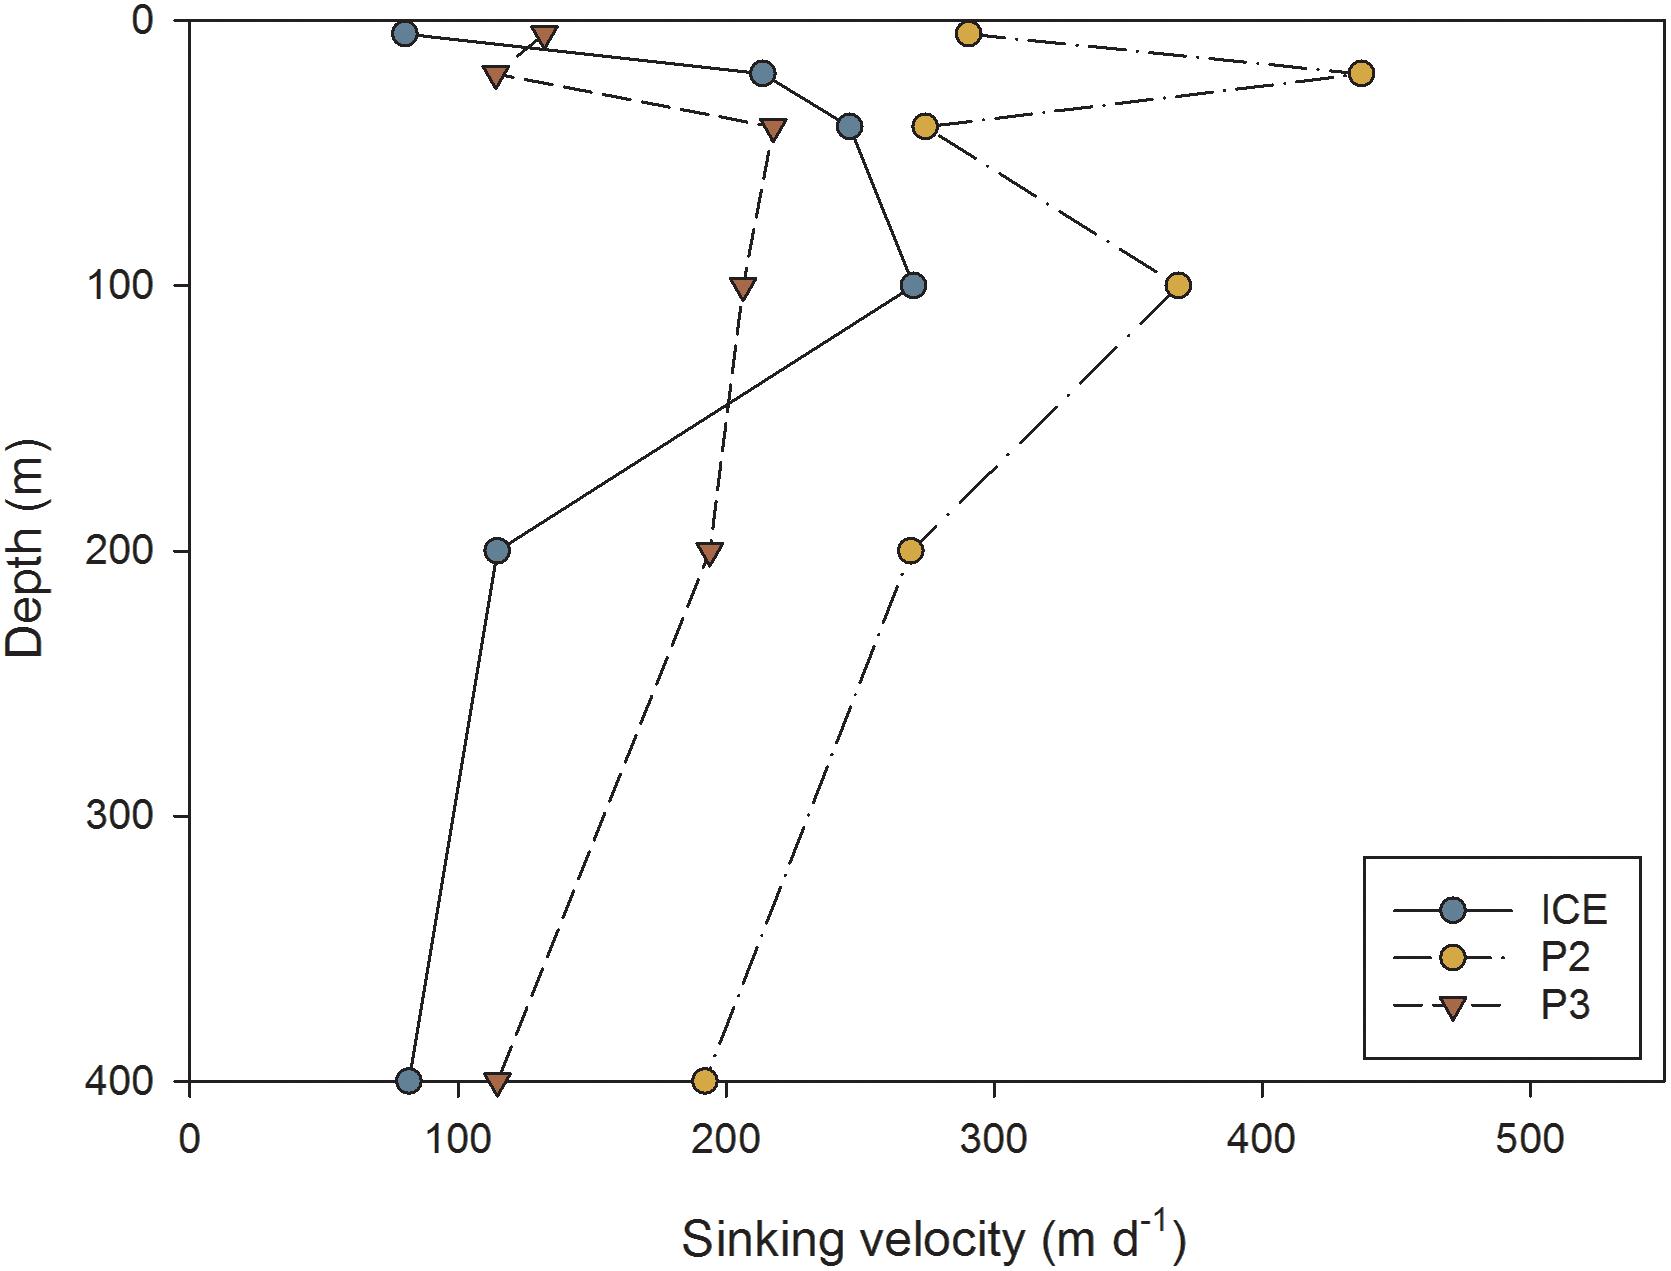
Figure 9. Average FP sinking velocity (m d−1) at different depths through the upper water column at ICE, P2, and P3 stations.
This was reflected in the flux of carbon over depth (mg C m−2 d−1) as calculated from FP sinking rates, shown in Figure 10. Overall, P2 exhibited the greatest attenuation and P3 the least, although by 400 m, the station with lowest flux was ICE (9 mg C m−2 d−1) while P2 exhibited the greatest 400 m flux despite strong attenuation (67 mg C m−2 d−1). Stations differed in the depth of peak flux: at ICE, flux peaked at 40 m before attenuating strongly; at P2 the peak occurred at 20 m followed by rapid attenuation; whilst at P3 flux gradually increased to 100 m and then decreased to 400 m.
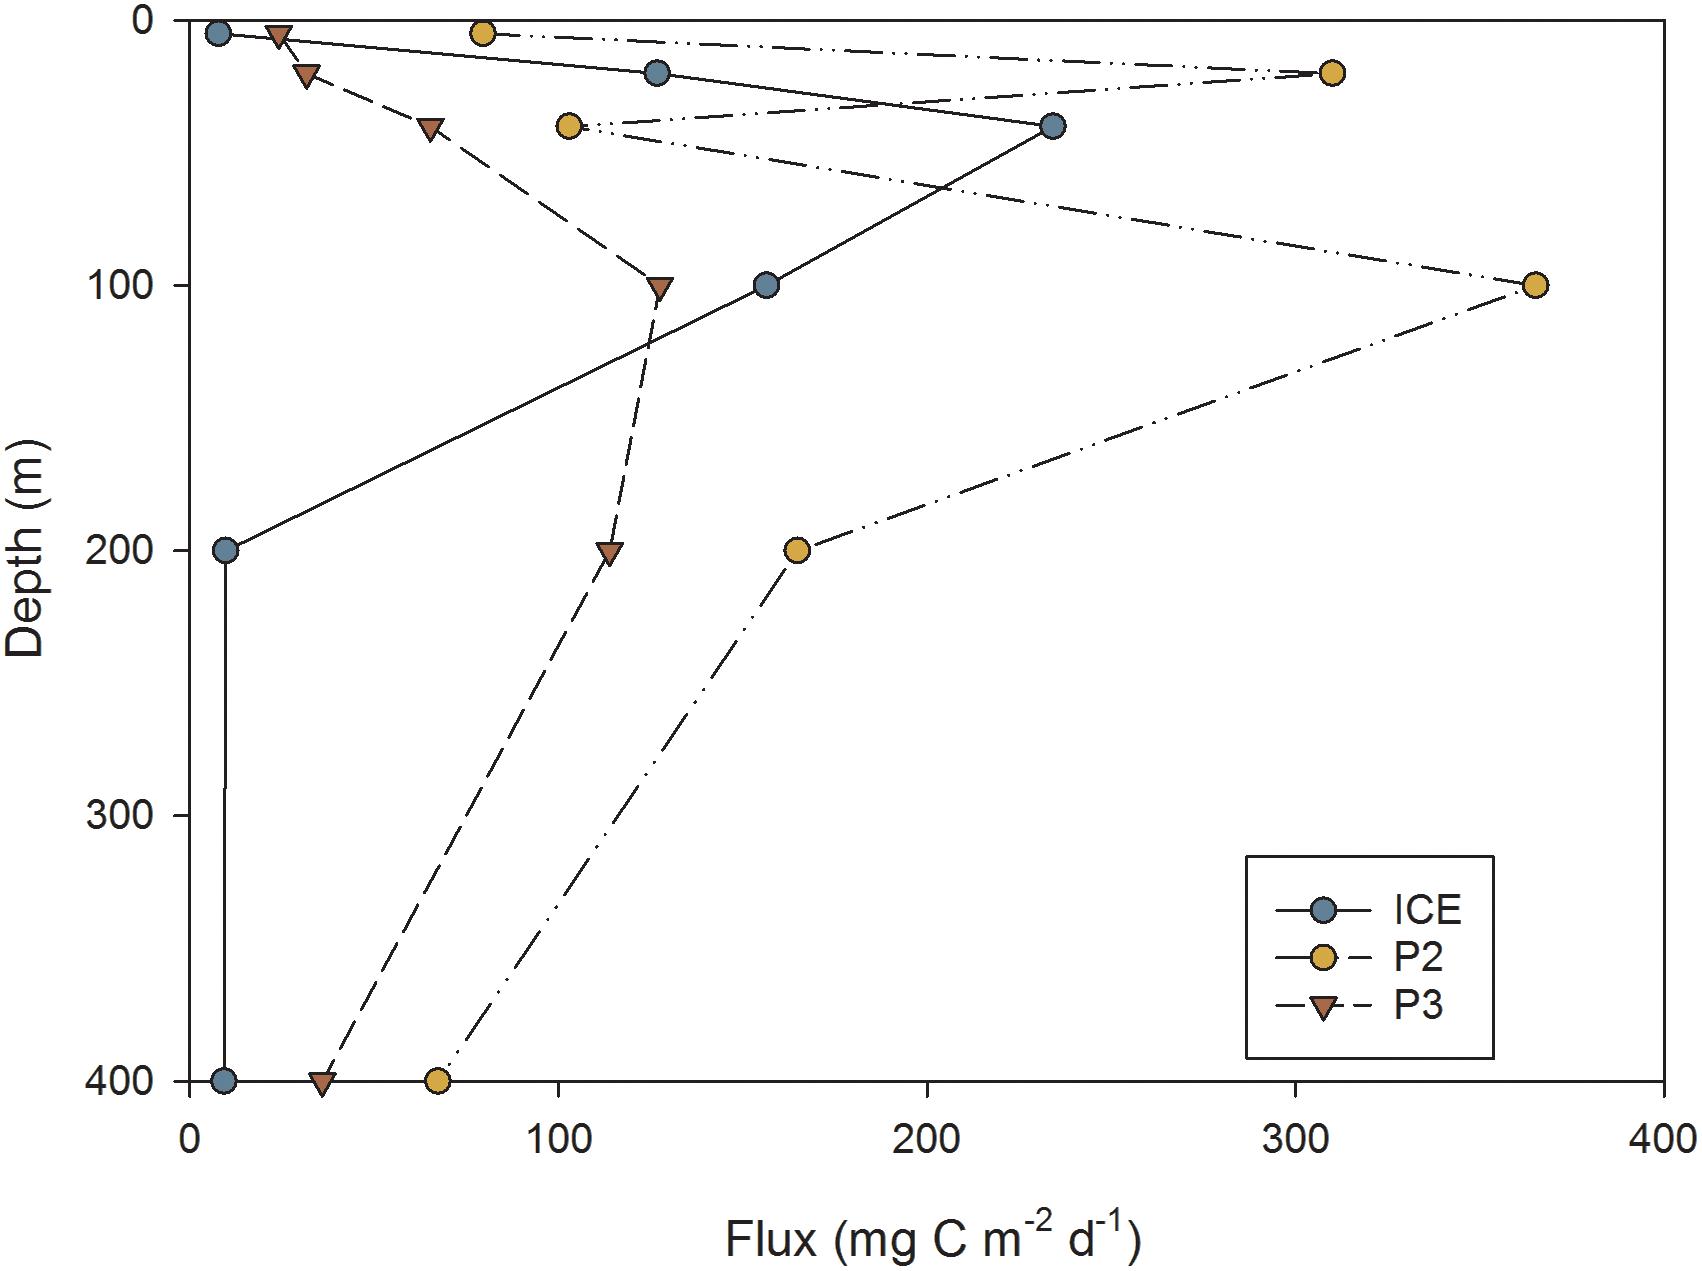
Figure 10. FP flux (mg C m−2 d−1) at different depths through the upper water column at ICE, P2, and P3 stations.
Phytoplankton Composition
A semi-quantitative analysis revealed some differences in phytoplankton between stations, although, at all stations, the phytoplankton was dominated by diatoms. Phytoplankton was sparsest at ICE, with only Corethron spp. observed in relatively low abundances. P2 exhibited a more diverse phytoplankton community, with moderate abundances of Fragilariopsis spp. and low abundances of Thalassiothrix spp. and Thalassiosira spp. The greatest diversity of phytoplankton species occurred at P3, where Eucampia spp. was most frequently observed, along with moderate abundances of Fragilariopsis spp. and Pseudo-nitzschia and low abundances of Corethron spp. and Thalassiosira spp.
Diatoms, organic detritus and zooplankton were sparsest at ICE across all depths. At P2, diatoms were observed as deep as 100 m but in greatest abundance at 20 and 40 m. In addition, occasional zooplankton and other specimens were observed within the samples, including copepods and their nauplii, euphausiid larvae, pteropods, polychaete worms, Foraminifera and egg masses. The highest concentration of material was encountered at P3 where diatoms, organic detritus and zooplankton were abundant to 40 m. Copepods of varying sizes were the most abundant type of zooplankton observed, although pteropods were also found. Below 40 m, material became sparser but zooplankton, diatoms and organic detritus were still evident at 100, 200, and 400 m.
Discussion
Across the upper mesopelagic, we found that FPs of the smallest mesozooplankton were rapidly lost whilst larger FPs contributed disproportionately to FP flux and export out of the mixed layer. In ice-influenced regions, where the zooplankton community is generally euphausiid-dominated, we found mesozooplankton contributed comparatively little to FP flux compared to lower latitude regions, although high fluxes to the deep sea were likely to have been driven by episodic, swarm events. Higher export out of the mixed layer, followed by deep but strong attenuation, occurred north of the SACCF where the mesozooplankton was most abundant and dominated by copepods. In contrast, shallower attenuation and lower export flux occurred at ICE, suggesting that remineralization depth cannot be predicted by temperature alone but requires an understanding of the zooplankton community structure.
Is the Mesozooplankton Community a Good Predictor of FP Export?
At all stations, the size spectra of FPs found in the top 200 m deviated strongly from that predicted based on the size structure of the mesozooplankton community sampled over the same depth, especially at the smallest end of the size spectrum. Based on our predictions, we expected >85% of FPs produced to be ≤0.0002 mm3 at all stations, yet found 78% (ICE) to 97% (P2) of FPs to be >0.0002 mm3, up to nine times greater than expected. FPs with volumes of ∼0.0001 mm3 often corresponded to those with one dimension <60 μm suggesting that one reason for not observing the very smallest FPs was the choice of mesh size. However, considering how few of the very smallest FPs were observed, a reduction in mesh size may not alter this result to any meaningful degree. Nevertheless, removing FPs ≤0.0001 mm3 from consideration still left between 6% (ICE) and 14% (P2) of the smallest predicted FPs unaccounted for. This implies that FPs originating from the smallest members of the zooplankton community including copepods of the abundant genus Oithona (Gonzalez and Smetacek, 1994; Dahms et al., 2015) are rapidly remineralized and that export is therefore dominated by FPs of the relatively less abundant but larger copepods such as Calanus and Metridia spp.
There was no significant difference in the size distribution in observed FPs between the upper four depths and bottom two depths at each station; however, the mean FP volume over depth showed a tendency first to increase (to 100 m at ICE, 20 m at P2 and 40 m at P3) before decreasing to 400 m. This suggests that the rate of production of smaller FPs in the surface waters exceeded their loss, whether to zooplankton-mediated coprophagy, coprorhexy, and coprochaly at depths of greater chlorophyll a concentration; or to the microbial or physical breakdown of particles as they sink. Conversely, as FPs sink through the mixed layer and light penetration and chlorophyll decrease, we suggest that the ingestion and breakdown of smaller FPs by other biota may increase as FPs contribute more to food intake. In addition, since small FPs produced in the mixed layer (between 40 and 80 m in this study) are less likely than larger ones to sink to deeper waters, this may contribute to an enhanced encounter rate of smaller particles in mixed layer waters and a shallower depth of their remineralization.
Similar patterns have been observed elsewhere: Lane et al. (1994) found that the larger FPs of the copepod species Calanus finmarchicus were important mediators of downward flux in the North Atlantic Bight, whilst the FPs of smaller copepods such as Centropages typicus were, on the whole, recycled. More recently, Belcher et al. (2017a) used Marine Snow Catcher and sediment trap data to conclude that the smallest FPs were not efficiently transferred from meso- to bathypelagic depths in the Scotia Sea and that they would represent only a small contribution to the flux of carbon. The present data represents the portion of the water column above their Marine Snow Catcher data (from 110 m below the mixed layer) and an intermediate depth of 400 m and suggests that, as well as not being transferred from meso- to bathypelagic depths, the smallest particles are in fact remineralized soon after production, regardless of depth or oceanographic regime. Although the importance of the microbial community colonizing zooplankton FPs, whether in breaking down the organic content of feces or as a direct food source, has long been appreciated (Johannes and Satomi, 1966; Poulsen and Iversen, 2008; Svensen et al., 2012), Svensen et al. (2012) also found that degradation of FPs by the microbial community and biota <200 μm is unlikely to retard the sinking rates of larger copepod FPs sufficiently to retain them at the surface.
At the larger end of the size spectrum (>0.0002 mm3), some differences between the three stations emerge. At ICE, there is a peak in observed FPs in the 0.0015–0.002 mm3 size range which is not predicted from the mesozooplankton community, and more deviation from the expected distribution than is seen at P2 or P3. The majority of the missing peak is comprised of cylindrical FPs typical of euphausiids. Due to the ability of euphausiids to avoid Bongo nets, they are not effectively captured by this method. However, taxonomic analysis found two to eight times as many euphausiid calyptopes at ICE than at P2 or P3, and for mesozooplankton abundance in the top 200 m to be up to one order of magnitude lower at ICE. Euphausiids are known to be an important component of the macrozooplankton community in much of the Scotia Sea (e.g., Ward et al., 2012) and to have large, fast sinking FPs (Fowler and Small, 1972). A study identifying bioregions of the Scotia Sea found communities in the colder waters to the south of the SACCF and close to the ice edge to be typified by a greater proportion of small zooplankton such as copepods of Oithona and Oncaea spp. and cyclopoid nauplii, and the large Euphausia superba (Ward et al., 2012). This is consistent with the present results which show the FP community at ICE to be largely comprised of cylindrical FPs and few small FPs, and for Oithona spp. to be most abundant here compared to either P2 or P3. For this region therefore, the mesozooplankton community alone is an insufficient predictor of FP export in the upper mesopelagic and euphausiids are more influential in FP carbon export over intermediate depths.
Additionally, at P3 and P2, the number of predicted FPs in the 0.001–0.0015 mm3 range were scarce in the observations. This corresponds to mesozooplankton with a prosome length of 1.8–2.1 mm, equivalent to, for example, copepodite stages of Calanoides acutus, Scolecithricella spp., and Euchaeta spp., and older stages of Metridia spp. Taxonomic analysis revealed the presence of most of these species at both stations. One explanation could be that our model is predicting what should occur in the absence of any biological or physical changes, yet FPs immediately become subject to processes which act to change their size and shape, including the coprophagous consumption of FPs (Gonzalez and Smetacek, 1994) and fragmentation of FPs by zooplankton in surface waters (Iversen and Poulsen, 2007). The implication is that physical, mechanical, and biological processes play an important role in reducing FP size, decoupling expected and observed FP size distributions, such that the overlying mesozooplankton community is not a direct predictor of FP size in the upper mesopelagic.
Race to the Bottom: Large, Dense FPs Are Biggest Contributors to Flux
Mean sinking rates calculated in this study ranged from 80 to 437 m d−1 across stations (range 5–1,919 m d−1). This means that the majority of particles will have sunk past 400 m within 1–3 days. Horizontal advection could potentially move these particles between 12 and 40 km over that time (assuming an average velocity magnitude for the Scotia Sea of 15 cm s−1, Tarling and Thorpe, 2014). This may introduce variability into our observations that can only be fully quantified through wider scale (∼50 km2) surveys. Here, we assume that our values represent mean levels at each station, pending further small- to mesoscale studies into spatial heterogeneity.
Comparing between stations, P3 had the slowest mean sinking rates, although they were also similar to ICE. FPs at P2 displayed the fastest sinking rates, also contributing to the greatest calculated carbon fluxes. FP sinking rates can be highly variable, ranging from 36 to 376 m d−1 (mixed zooplankton FPs, Smayda, 1969), 20 to 101 m d−1 (mixed copepods, Small et al., 1979), and 15 to 862 m d−1 (euphausiids, Fowler and Small, 1972; Belcher et al., 2017b). Sinking velocity is related to FP density which is affected by food type (Bienfang, 1980) or concentration (Small et al., 1979; Dagg and Walser, 1986) and ballast (Ploug et al., 2008). Since diets naturally high in mineral ballast and diatom frustules tend to produce denser, faster-sinking FPs (Small et al., 1979; Bienfang, 1980; Ploug et al., 2008), FPs originating from the characteristic diatom community of the Scotia Sea, and based on a herbivorous diet, should therefore be faster-sinking than those of similar dimensions and originating from a flagellate or omnivorous diet (Frangoulis et al., 2001). In addition, the fastest sinking FPs were found at P2 where the FP assemblage was dominated by ovoid and spherical FPs, as also observed in the Weddell Sea by Cadée et al. (1992). Many of the FPs found at P2 were densely packed with the silica frustules of diatoms, the mineral ballasting of which is likely to contribute to higher FP sinking rates.
Attenuation of FP Carbon Flux Is Strongly Modulated by Zooplankton
North of the SACCF at P2 and P3, FP carbon flux increased from the surface to a mid-depth maxima of 100 m situated below the thermocline. However, to the south at ICE, FP flux peaked within the mixed layer at a depth of 40 m. Here, a deep chlorophyll a maximum between 40 and 80 m suggests that most FPs resulted from production above or within this depth. At P2 and P3, chlorophyll a in the top 60–80 m was up to >2.0 μg l−1 higher than at ICE. This corresponded to zooplankton abundances over the top 200 m that were at least an order of magnitude higher, with substantially greater export beneath the mixed layer. This suggests that mesozooplankton play a greater role in the deeper export of FPs in the more productive waters of the northern Scotia Sea, with elevated production of FPs from autotrophic feeding to at least 80 m, and their sinking from above, likely fuelling a deeper dwelling zooplankton community. Despite this, fluxes at all stations demonstrated a high degree of attenuation from the flux maxima, decreasing by an order of magnitude by 400 m, suggesting efficient processes of remineralization in the intermediate depths of the upper mesopelagic.
At ICE, cylindrical FPs typical of euphausiids dominated the flux at 100 m, after which there was strong attenuation. This agrees with a previous study by Cavan et al. (2015) who observed 82% of FPs in the seasonal ice zone to be of euphausiid origin, and for a large decrease in flux to occur with depth. In a separate study, Dagg et al. (2014) found their FP samples to be comprised almost entirely of cylindrical types and for euphausiids to comprise almost half of the abundance in net samples. Euphausiids were episodically abundant, had a diet rich in diatoms, and were the dominant contributor to FP flux, although the flux decreased when food quality was lower. Whilst direct adult euphausiid abundances for this study were not available, our findings confirm that where the community is euphausiid dominated, they contribute proportionately more to the export of organic material from the surface. Nevertheless, the strong attenuation of flux between 100 and 400 m also shows that, despite these pellets being an important component of export out of the mixed layer, only a small fraction eventually reaches the deeper mesopelagic.
Whilst the attenuation depth was equally deep at P2 as at P3, overall fluxes were greater at P2 and there was an additional peak at 20 m. This also corresponds to the presence of a number of predominantly ovoid and spherical FPs across the upper 200 m in the size range 0.002–0.003 mm3, as well as increased numbers in sizes up to 0.007 mm3, consistent with copepods such as C. acutus stages CIV and CV or C. propinquus stages CIV and CV. SEM analysis showed these to be densely packed, often comprised of diatom fragments and with fully or partially intact membranes. Examination of sampling times revealed that the P2 CTD sample had been collected 4 h after sunset, whilst ICE was sampled in the middle of the day and P3 1 h prior to sunset. Despite attempts to capture the diel cycle by sampling during night and day, sampling constraints meant that the mesozooplankton samples at P2 were collected approximately 4 h prior to sunset and 2 h after sunrise. This raises the possibility that FPs captured at P2 were the result of recent production from vertically migrating zooplankton that were missed by the net sampling. Zooplankton composition at P2 is similar to P3 yet abundances in this study were almost three times lower. However, in the oceanic Scotia Sea, the proportion of zooplankton in the top 100 m can increase from 45 to 60% between midday and midnight, with an additional secondary biomass peak between 150 and 300 m found at midnight (Ward et al., 1995). Larger copepods such as C. acutus and C. propinquus undertake deeper DVMs than smaller species or younger stages (Atkinson et al., 1992; Ward et al., 1995). This supports the hypothesis that zooplankton not captured by the Bongo nets were responsible for an additional pulse of FP production during the night between 20 and 100 m which may have been too recent to be subjected to the same degree of breakdown, degradation or sinking loss as daytime samples. Assuming that the animals were actively feeding, this would explain the production of fresh, high volume FPs, many of which still had intact or partially intact peritrophic membranes. It also illustrates that estimates of FP flux may be affected by diel variability in zooplankton distribution and that more work is required to understand the importance of short-term (diel) variability of FP flux.
An additional feature of the FP flux profile at P2 is a reduction in flux at 40 m, followed by a subsequent increase at 100 m. The chlorophyll a profile from the same CTD shows spikes in chlorophyll a biomass throughout a deep mixed layer, suggesting a possible earlier disturbance of the water column. The reduction in flux at 40 m corresponds to low chlorophyll a, whilst the peaks in flux at 20 m and 100 m are directly below peaks in chlorophyll a, suggesting active feeding within or above chlorophyll a layers which resulted in the densely packed, labile FPs observed just below. The presence of a diversity of zooplankton specimens in bottle samples supports the presence of a mid-depth community at 100 m, which may be feeding on FPs raining down from above and further contributing to the secondary peak in flux observed at 100 m.
Conclusion
ICE is separated from P2 and P3 by the SACCF, representing a difference in surface water temperatures of up to 5°C and supporting different zooplankton communities. At global scales, POC remineralization is found to increase with temperature (Marsay et al., 2015) but, at the regional scale of our study, we found zooplankton community interactions were the dominant influence on remineralization rates (Belcher et al., 2016). Shallowest remineralization occurred at the coldest station, ICE, where zooplankton abundances were lower and dominated by euphausiids, while remineralization was deeper in the warmer waters to the north, where zooplankton abundances were high and dominated by copepods. We propose that, at sites of higher zooplankton abundance, the fragmentation and consumption of FPs is able to sustain further zooplankton production and microbial respiration in the twilight zone, contributing to a deep pool of dissolved organic carbon (DOC) and deeper remineralization by the microbial community. The absence of the smallest FPs from even shallow depths illustrates how FP supply to the mesopelagic is determined by the presence of larger zooplankton, demonstrating the strong modulation by the zooplankton community on the supply and transfer of FPs between the epi- and upper mesopelagic in the SO.
Author Contributions
CL carried out the fieldwork and sample collection with support from GT and other scientists on board JR304. CL carried out the sample and statistical analysis with support from CM and GT. CL wrote the manuscript with input from GT, CM, CR, and GS.
Funding
This work was funded by a NERC studentship granted through the EnvEast Doctoral Training Partnership (Grant No. NE/L002582/1) at the University of East Anglia. Fieldwork was supported by the British Antarctic Survey Ecosystems Programme and the Western Core Box and SCOOBIES Projects on board the RRS James Clark Ross.
Conflict of Interest Statement
The authors declare that the research was conducted in the absence of any commercial or financial relationships that could be construed as a potential conflict of interest.
Acknowledgments
We would like to acknowledge the master, crew, and scientists aboard the RRS James Clark Ross during cruise JR304. We thank Laura Gerrish for providing Figure 1 and the Plankton Sorting and Identification Center Morski Instytut Rybacki, Poland for their assistance with sample analysis.
Supplementary Material
The Supplementary Material for this article can be found online at: https://www.frontiersin.org/articles/10.3389/fmars.2019.00230/full#supplementary-material
FIGURE S1 | Average mesozooplankton abundance and size spectra based on prosome length at ICE (top), P2 (middle) and P3 (bottom).
Footnotes
References
Angel, M. V. (1986). Vertical migrations in the oceanic realm: possible causes and probable effects. Contrib. Mar. Sci. 27, 47–70.
Atkinson, A., Schmidt, K., Fielding, S., Kawaguchi, S., and Geissler, P. A. (2012). Variable food absorption by Antarctic krill: relationships between diet, egestion rate and the composition and sinking rates of their fecal pellets. Deep Sea Res. II Top. Stud. Oceanogr. 59–60, 147–158. doi: 10.1016/j.dsr2.2011.06.008
Atkinson, A., Siegel, V., Pakhomov, E., Rothery, P., Loeb, V., Ross, R., et al. (2008). Oceanic circumpolar habitats of Antarctic krill. Mar. Ecol. Prog. Ser. 362, 1–23. doi: 10.3354/meps07498
Atkinson, A., Ward, P., Williams, R., and Poulet, S. A. (1992). Diel vertical migration and feeding of copepods at an oceanic site near South Georgia. Mar. Biol. 113, 583–593. doi: 10.1007/bf00349702
Belcher, A., Iversen, M., Manno, C., Henson, S. A., Tarling, G. A., and Sanders, R. (2016). The role of particle associated microbes in remineralization of fecal pellets in the upper mesopelagic of the Scotia Sea, Antarctica. Limnol. Oceanogr. 61, 1049–1064. doi: 10.1002/lno.10269
Belcher, A., Manno, C., Ward, P., Henson, S. A., Sanders, R., and Tarling, G. A. (2017a). Copepod faecal pellet transfer through the meso-and bathypelagic layers in the Southern Ocean in spring. Biogeosciences 14:1511–1525. doi: 10.5194/bg-14-1511-2017
Belcher, A., Tarling, G., Manno, C., Atkinson, A., Ward, P., Skaret, G., et al. (2017b). The potential role of Antarctic krill faecal pellets in efficient carbon export at the marginal ice zone of the South Orkney Islands in spring. Polar Biol. 40, 2001–2013. doi: 10.1007/s00300-017-2118-z
Bendtsen, J., Hilligsøe, K. M., Hansen, J. L. S., and Richardson, K. (2015). Analysis of remineralisation, lability, temperature sensitivity and structural composition of organic matter from the upper ocean. Prog. Oceanogr. 130, 125–145. doi: 10.1016/j.pocean.2014.10.009
Bienfang, P. (1980). Herbivore diet affects fecal pellet settling. Can. J. Fish. Aquat. Sci. 37, 1352–1357. doi: 10.1139/f80-173
Buesseler, K. O., Lamborg, C. H., Boyd, P. W., Lam, P. J., Trull, T. W., Bidigare, R. R., et al. (2007). Revisiting carbon flux through the ocean’s twilight zone. Science 316, 567–570.
Burd, A. B., Hansell, D. A., Steinberg, D. K., Anderson, T. R., Arístegui, J., Baltar, F., et al. (2010). Assessing the apparent imbalance between geochemical and biochemical indicators of meso-and bathypelagic biological activity: what the@ $?! is wrong with present calculations of carbon budgets? Deep Sea Res. II Top. Stud. Oceanogr. 57, 1557–1571. doi: 10.1016/j.dsr2.2010.02.022
Cadée, G. C., González, H., and Schnack-Schiel, S. B. (1992). Krill diet affects faecal string settling. Polar Biol. 12, 75–80. doi: 10.1007/978-3-642-77595-6_8
Cavan, E. L., Le Moigne, F. A. C., Poulton, A. J., Tarling, G. A., Ward, P., Daniels, C. J., et al. (2015). Attenuation of particulate organic carbon flux in the Scotia Sea, Southern Ocean, is controlled by zooplankton fecal pellets. Geophys. Res. Lett. 42, 1–10.
Dagg, M. J., Jackson, G. A., and Checkley, D. M. (2014). The distribution and vertical flux of fecal pellets from large zooplankton in Monterey Bay and coastal California. Deep Sea Res. I Oceanogr. Res. Pap. 94, 72–86. doi: 10.1016/j.dsr.2014.09.001
Dagg, M. J., and Walser, W. E. (1986). The effect of food concentration on fecal pellet size in marine copepods. Limnol. Oceanogr. 31, 1066–1071. doi: 10.4319/lo.1986.31.5.1066
Dahms, H.-U., Tseng, L.-C., and Hwang, J.-S. (2015). Biogeographic distribution of the cyclopoid copepod genus Oithona – from mesoscales to global scales. J. Exp. Mar. Biol. Ecol. 467, 26–32. doi: 10.1016/j.jembe.2015.02.009
de Baar, H. J. W., De Jong, J. T. M., Bakker, D. C. E., Löscher, B. M., Veth, C., Bathmann, U., et al. (1995). Importance of iron for plankton blooms and carbon dioxide drawdown in the Southern Ocean. Nature 373, 412–415. doi: 10.1038/373412a0
Emerson, C. W., and Roff, J. C. (1987). Implications of fecal pellet size and zooplankton behaviour to estimates of pelagic-benthic carbon flux. Mar. Ecol. Prog. Ser. 35, 251–257. doi: 10.3354/meps035251
Fowler, S. W., and Small, L. F. (1972). Sinking rates of euphausiid fecal pellets. Limnol. Oceanogr. 17, 293–296. doi: 10.4319/lo.1972.17.2.0293
Francois, R., Honjo, S., Krishfield, R., and Manganini, S. (2002). Factors controlling the flux of organic carbon to the bathypelagic zone of the ocean. Glob. Biogeochem. Cycles 16, 34-1–34-20.
Frangoulis, C., Belkhiria, S., Goffart, A., and Hecq, J.-H. (2001). Dynamics of copepod faecal pellets in relation to a Phaeocystis dominated phytoplankton bloom: characteristics, production and flux. J. Plankton Res. 23, 75–88. doi: 10.1093/plankt/23.1.75
Giering, S. L., Sanders, R., Lampitt, R. S., Anderson, T. R., Tamburini, C., Boutrif, M., et al. (2014). Reconciliation of the carbon budget in the ocean’s twilight zone. Nature 507, 480–483. doi: 10.1038/nature13123
González, H. E. (1992). The distribution and abundance of krill faecal material and oval pellets in the scotia and weddell seas (Antarctica) and their role in particle flux. Polar Biol. 12, 81–91. doi: 10.1007/978-3-642-77595-6_9
González, H. E., Ortiz, V. C., and Sobarzo, M. (2000). The role of faecal material in the particulate organic carbon flux in the northern humboldt current, Chile (23 S), before and during the 1997–1998 El Niño. J. Plankton Res. 22, 499–529. doi: 10.1093/plankt/22.3.499
Gonzalez, H. E., and Smetacek, V. (1994). The possible role of the cyclopoid copepod Oithona in retarding vertical flux of zooplankton faecal material. Mar. Ecol. Prog. Ser. 113, 233–246. doi: 10.3354/meps113233
Gorsky, G., Ohman, M. D., Picheral, M., Gasparini, S., Stemmann, L., Romagnan, J.-B., et al. (2010). Digital zooplankton image analysis using the ZooScan integrated system. J. Plankton Res. 32, 285–303. doi: 10.1093/plankt/fbp124
Iversen, M. H., and Poulsen, L. K. (2007). Coprorhexy, coprophagy, and coprochaly in the copepods Calanus helgolandicus, Pseudocalanus elongatus, and Oithona similis. Mar. Ecol. Prog. Ser. 350, 79–89. doi: 10.1021/acs.est.5b05905
Johannes, R. E., and Satomi, M. (1966). Composition and nutritive value of fecal pellets of a marine crustacean. Limnol. Oceanogr. 11, 191–197. doi: 10.4319/lo.1966.11.2.0191
Komar, P. D., Morse, A. P., Small, L. F., and Fowler, S. W. (1981). An analysis of sinking rates of natural copepod and euphausiid fecal pellets. Limnol. Oceanogr. 26, 172–180. doi: 10.4319/lo.1981.26.1.0172
Korb, R. E., Whitehouse, M. J., Thorpe, S. E., and Gordon, M. (2005). Primary production across the Scotia Sea in relation to the physico-chemical environment. J. Mar. Syst. 57, 231–249. doi: 10.1016/j.jmarsys.2005.04.009
Lampitt, R. S., Noji, T., and Von Bodungen, B. (1990). What happens to zooplankton faecal pellets? Implications for material flux. Mar. Biol. 104, 15–23. doi: 10.1007/bf01313152
Lancraft, T. M., Torres, J. J., and Hopkins, T. L. (1989). Micronekton and macrozooplankton in the open waters near antarctic ice edge zones (Ameriez 1983 and 1986). Polar Biol. 9, 225–233. doi: 10.1007/bf00263770
Lane, P., Smith, S., Urban, J., and Biscaye, P. (1994). Carbon flux and recycling associated with zooplanktonic fecal pellets on the shelf of the Middle Atlantic Bight. Deep Sea Res. II Top. Stud. Oceanogr. 41, 437–457. doi: 10.1016/0967-0645(94)90031-0
Le Quéré, C., Buitenhuis, E. T., Moriarty, R., Alvain, S., Aumont, O., Bopp, L., et al. (2016). Role of zooplankton dynamics for Southern Ocean phytoplankton biomass and global biogeochemical cycles. Biogeosciences 13, 4111–4133. doi: 10.5194/bg-13-4111-2016
Legendre, L., Rivkin, R. B., Weinbauer, M. G., Guidi, L., and Uitz, J. (2015). The microbial carbon pump concept: potential biogeochemical significance in the globally changing ocean. Prog. Oceanogr. 134, 432–450. doi: 10.1016/j.pocean.2015.01.008
Longhurst, A. R., and Harrison, W. (1989). The biological pump: profiles of plankton production and consumption in the upper ocean. Prog. Oceanogr. 22, 47–123. doi: 10.1016/0079-6611(89)90010-4
Maiti, K., Charette, M. A., Buesseler, K. O., and Kahru, M. (2013). An inverse relationship between production and export efficiency in the Southern Ocean. Geophys. Res. Lett. 40, 1557–1561. doi: 10.1002/grl.50219
Manno, C., Stowasser, G., Enderlein, P., Fielding, S., and Tarling, G. A. (2015). The contribution of zooplankton faecal pellets to deep-carbon transport in the Scotia Sea (Southern Ocean). Biogeosciences 12, 1955–1965. doi: 10.5194/bg-12-1955-2015
Marsay, C. M., Sanders, R. J., Henson, S. A., Pabortsava, K., Achterberg, E. P., and Lampitt, R. S. (2015). Attenuation of sinking particulate organic carbon flux through the mesopelagic ocean. Proc. Natl. Acad. Sci. U.S.A. 112, 1089–1094. doi: 10.1073/pnas.1415311112
Martin, J. H. (1990). Glacial-interglacial CO2 change: the iron hypothesis. Paleoceanography 5, 1–13. doi: 10.1029/pa005i001p00001
Mauchline, J. (1998). “Physiology,” in The Biology of Calanoid Copepods, eds J. H. S. Blaxter, A. J. Southward, and P. A. Tyler (London: Academic Press).
Murphy, E. J., Watkins, J. L., Trathan, P. N., Reid, K., Meredith, M. P., Thorpe, S. E., et al. (2007). Spatial and temporal operation of the Scotia Sea ecosystem: a review of large-scale links in a krill centred food web. Philos. Trans. R. Soc. B Biol. Sci. 362, 113–148. doi: 10.1098/rstb.2006.1957
Noji, T. T., Estep, K. W., Macintyre, F., and Norrbin, F. (1991). Image analysis of faecal material grazed upon by three species of copepods: evidence for coprorhexy, coprophagy and coprochaly. J. Mar. Biol. Assoc. 71, 465–480.
Picheral, M., Colin, S., and Irisson, J. O. (2017). EcoTaxa, a tool for the Taxonomic Classification of Images. Available at: http://ecotaxa.obs-vlfr.fr (accessed date August 09, 2017).
Ploug, H., Iversen, M., and Fischer, G. (2008). Ballast, sinking velocity and apparent diffusivity in marine snow and zooplankton fecal pellets: implications for substrate turnover by attached bacteria. Limnol. Oceanogr. 53, 1878–1886. doi: 10.4319/lo.2008.53.5.1878
Poulsen, L. K., and Iversen, M. H. (2008). Degradation of copepod fecal pellets: key role of protozooplankton. Mar. Ecol. Prog. Ser. 367, 1–13. doi: 10.3354/meps07611
R Core Team (2016). R: A Language and Environment for Statistical Computing. Vienna: R Foundation for Statistical Computing. Available at: https://www.r-project.org/
Robinson, C., Steinberg, D. K., Anderson, T. R., Arístegui, J., Carlson, C. A., Frost, J. R., et al. (2010). Mesopelagic zone ecology and biogeochemistry–a synthesis. Deep Sea Res. II Top. Stud. Oceanogr. 57, 1504–1518. doi: 10.1016/j.dsr2.2010.02.018
Sampei, M., Forest, A., Sasaki, H., Hattori, H., Makabe, R., Fukuchi, M., et al. (2009). Attenuation of the vertical flux of copepod fecal pellets under Arctic sea ice: evidence for an active detrital food web in winter. Polar Biol. 32, 225–232. doi: 10.1007/s00300-008-0523-z
Small, L., Fowler, S., and Ünlü, M. (1979). Sinking rates of natural copepod fecal pellets. Mar. Biol. 51, 233–241. doi: 10.1021/acs.est.5b05905
Smayda, T. J. (1969). Some measurements of the sinking rate of fecal pellets. Limnol. Oceanogr. 14, 621–625. doi: 10.1038/srep00716
Stamieszkin, K., Pershing, A. J., Record, N. R., Pilskaln, C. H., Dam, H. G., and Feinberg, L. R. (2015). Size as the master trait in modeled copepod fecal pellet carbon flux. Limnol. Oceanogr. 60, 2090–2107. doi: 10.1002/lno.10156
Steinberg, D. K., and Landry, M. R. (2017). Zooplankton and the ocean carbon cycle. Annu. Rev. Mar. Sci. 9, 413–444. doi: 10.1146/annurev-marine-010814-015924
Steinberg, D. K., Van Mooy, B. A., Buesseler, K. O., Boyd, P. W., Kobari, T., and Karl, D. M. (2008). Bacterial vs zooplankton control of sinking particle flux in the ocean’s twilight zone. Limnol. Oceanogr. 53, 1327–1338. doi: 10.1002/bies.201400100
Svensen, C., Wexels Riser, C., Reigstad, M., and Seuthe, L. (2012). Degradation of copepod faecal pellets in the upper layer: role of microbial community and Calanus finmarchicus. Mar. Ecol. Prog. Ser. 462, 39–49. doi: 10.3354/meps09808
Takahashi, T., Sutherland, S. C., Sweeney, C., Poisson, A., Metzl, N., Tilbrook, B., et al. (2002). Global sea–air Co2 flux based on climatological surface ocean pco2, and seasonal biological and temperature effects. Deep Sea Res. II Top. Stud. Oceanogr. 49, 1601–1622. doi: 10.1016/s0967-0645(02)00003-6
Tarling, G. A., and Thorpe, S. E. (2014). Instantaneous movement of krill swarms in the antarctic circumpolar current. Limnol. Oceanogr. 59, 872–886. doi: 10.4319/lo.2014.59.3.0872
Turner, J. T. (1979). Microbial attachment to copepod fecal pellets and its possible ecological significance. Trans. Am. Microsc. Soc. 98, 131–135.
Turner, J. T. (2002). Zooplankton fecal pellets, marine snow and sinking phytoplankton blooms. Aquat. Microb. Ecol. 27, 57–102. doi: 10.3354/ame027057
Turner, J. T. (2015). Zooplankton fecal pellets, marine snow, phytodetritus and the ocean’s biological pump. Prog. Oceanogr. 130, 205–248. doi: 10.1016/j.pocean.2014.08.005
Urban, J., Mckenzie, C., and Deibel, D. (1993). Nanoplankton found in fecal pellets of macrozooplankton in coastal Newfoundland waters. Bot. Mar. 36, 267–282.
Urrère, M. A., and Knauer, G. A. (1981). Zooplankton fecal pellet fluxes and vertical transport of particulate organic material in the pelagic environment. J. Plankton Res. 3, 369–387. doi: 10.1093/plankt/3.3.369
Ward, P., Atkinson, A., Murray, A., Wood, A., Williams, R., and Poulet, S. (1995). The summer zooplankton community at South Georgia: biomass, vertical migration and grazing. Polar Biol. 15, 195–208.
Ward, P., Atkinson, A., Venables, H. J., Tarling, G. A., Whitehouse, M. J., Fielding, S., et al. (2012). Food web structure and bioregions in the Scotia Sea: a seasonal synthesis. Deep Sea Res. II Top. Stud. Oceanogr. 59–60, 253–266. doi: 10.1016/j.dsr2.2011.08.005
Watkins, J., Belcher, A., Duret, M., Enderlein, P., Fielding, S., Floter, S., et al. (2015). JR304 Western Core Box & Moorings Cruise Report. Cambridge: British Antarctic Survey.
Whitehouse, M. J., Korb, R. E., Atkinson, A., Thorpe, S. E., and Gordon, M. (2008). Formation, transport and decay of an intense phytoplankton bloom within the high-nutrient low-chlorophyll belt of the Southern Ocean. J. Mar. Syst. 70, 150–167. doi: 10.1016/j.jmarsys.2007.05.003
Wilson, S., Ruhl, H., and Smith, K. Jr. (2013). Zooplankton fecal pellet flux in the abyssal Northeast Pacific: a 15 year time-series study. Limnol. Oceanogr. 58, 881–892. doi: 10.4319/lo.2013.58.3.0881
Wilson, S. E., Steinberg, D. K., and Buesseler, K. O. (2008). Changes in fecal pellet characteristics with depth as indicators of zooplankton repackaging of particles in the mesopelagic zone of the subtropical and subarctic North Pacific Ocean. Deep Sea Res. II Top. Stud. Oceanogr. 55, 1636–1647. doi: 10.1016/j.dsr2.2008.04.019
Keywords: copepods, euphausiids, Scotia Sea, biological carbon pump, sea-ice, export
Citation: Liszka CM, Manno C, Stowasser G, Robinson C and Tarling GA (2019) Mesozooplankton Community Composition Controls Fecal Pellet Flux and Remineralization Depth in the Southern Ocean. Front. Mar. Sci. 6:230. doi: 10.3389/fmars.2019.00230
Received: 11 December 2018; Accepted: 12 April 2019;
Published: 10 May 2019.
Edited by:
Christian Grenz, UMR 7294 Institut Méditerranéen d’Océanographie (MIO), FranceReviewed by:
Daria Martynova, Zoological Institute (RAS), RussiaKusum Komal Karati, Centre for Marine Living Resources and Ecology (CMLRE), India
Copyright © 2019 Liszka, Manno, Stowasser, Robinson and Tarling. This is an open-access article distributed under the terms of the Creative Commons Attribution License (CC BY). The use, distribution or reproduction in other forums is permitted, provided the original author(s) and the copyright owner(s) are credited and that the original publication in this journal is cited, in accordance with accepted academic practice. No use, distribution or reproduction is permitted which does not comply with these terms.
*Correspondence: Cecilia M. Liszka, Yy5tLmxpc3prYS4wMkBjYW50YWIubmV0 Geraint A. Tarling, Z2FudEBiYXMuYWMudWs=