 Aaron B. Carlisle1*†
 David Tickler2
 Jonathan J. Dale1
 Francesco Ferretti1
 David J. Curnick3,4
 Taylor K. Chapple1Robert J. Schallert1Michael Castleton1
 Barbara A. Block1
- 1Hopkins Marine Station, Stanford University, Pacific Grove, CA, United States
- 2Marine Futures Lab, School of Biological Sciences, University of Western Australia, Perth, WA, Australia
- 3Institute of Zoology, Zoological Society of London, London, United Kingdom
- 4Centre for Biodiversity and Environment Research, Department of Genetics, Evolution and Environment, University College London, London, United Kingdom
Marine protected areas (MPAs) have become an increasingly important tool to protect and conserve marine resources. However, there remains much debate about how effective MPAs are, especially in terms of their ability to protect mobile marine species such as teleost and chondrichthyan fishes. We used satellite and acoustic tags to assess the ability of a large oceanic MPA, the British Indian Ocean Territory MPA (BIOT MPA), to protect seven species of pelagic and reef-associated teleost and chondrichthyan fishes. We satellite-tagged 26 animals from six species (Blue Marlin, Reef Mantas, Sailfish, Silky Sharks, Silvertip Sharks, and Yellowfin Tuna), producing 2,735 days of movement data. We also acoustically tagged 121 sharks from two species (Grey Reef and Silvertip Sharks), which were monitored for up to 40 months across a large acoustic receiver array spanning the MPA. We found that the activity spaces of all satellite-tagged animals, including pelagic species, were much smaller than the area of the BIOT MPA, even taking into account errors associated with position estimates. Estimates of space use of acoustically tagged sharks, based on dynamic Brownian Bridge Movement Models (dBBMM), were also much smaller than the size of the MPA. However, we found important limitations when using dBBMM and demonstrate its sensitivity to both study duration and array design. We found that Grey Reef Sharks should be monitored for at least 1 year and Silvertip Sharks for 2 years before their activity space can be effectively estimated. We also demonstrate the potentially important role that intraspecific variability in spatial ecology may play in influencing the ability of MPAs to effectively protect populations of mobile species. Overall, our results suggest that, with effective enforcement, MPAs on the scale of the BIOT MPA potentially offer protection to a variety of pelagic and reef species with a range of spatial ecologies. We suggest that animals need to be tagged across seasons, years, and ontogenetic stages, in order to fully characterize their spatial ecology, which is fundamental to developing and implementing effective MPAs to conserve the full life history of target species.
Introduction
The need to effectively manage marine resources and ecosystems in the face of increasing human exploitation and climate change is one of the pressing conservation issues of our time. Marine protected areas (MPAs), areas where extractive activities are restricted or prohibited, have become an important tool to help resource managers conserve and protect marine ecosystems and resources. While the ability of MPAs to protect marine species will depend on many factors, including the location of the MPAs, the spatial ecology of species of interest, and the level of enforcement, MPAs have the potential to provide protection to many marine taxa, including mobile species such as sharks (Edgar et al., 2014; Ward-Paige, 2017; White et al., 2017; Speed et al., 2018). Due to their known and perceived conservation benefits, the number of MPAs has increased dramatically over the past five decades (Worm, 2017). The total area protected is accelerating even more rapidly, in particular due to an emphasis in recent years on the creation of very large MPAs, which typically encompass hundreds of thousands of square kilometers of remote, oceanic habitat, often enclosing entire reef or island systems (e.g., Phoenix Islands Protected Area, Pacific Remote Islands Marine National Monument, Rapa Nui Marine Park, and Pitcairn Islands Marine Reserve) (Letessier et al., 2017).
However, despite their increasing implementation, much remains unclear about how to best design MPAs to achieve specified goals, particularly that of protecting mobile marine taxa of management and conservation interest, which includes many teleost and chondrichthyan fishes (Sibert et al., 2012; Kaplan et al., 2014; Boerder et al., 2017). The movement patterns of mobile fishes can be complex and highly variable within and across species, with some transient species wandering over large areas (Meyer et al., 2009; O’Toole et al., 2011; Ferreira et al., 2015), while others exhibit various migration strategies (Block et al., 2011; Jaine et al., 2014) or ontogenetic shifts in habitat or space use (Dahlgren and Eggleston, 2000; Carlisle et al., 2015). Movement dynamics are a key consideration when planning spatial protection for these species. At the extremes, transient or highly migratory species (e.g., pelagic fishes and sharks) may not be amenable to full protection by even the largest MPA, whereas highly resident species (e.g., small reef fish) can be protected by MPAs at the scale of single reefs (Mumby et al., 2006; Mee et al., 2017), if there is appropriate enforcement of the MPA. Nevertheless, even for highly mobile species, appropriately designed MPAs have the capacity to protect key habitats that fulfill important ecological or life history needs for a species, such as reproduction or foraging (Runge et al., 2014; Hays et al., 2019).
While it is critical to fully describe the spatial ecology of taxa of conservation and management interest in order to design effective MPAs, accurately quantifying the activity space of mobile teleost and chondrichthyan fishes remains challenging due to technological and logistical issues associated with accurately characterizing the movements and distributions of marine fishes. The use of electronic tags is one of the most common approaches to study their movements and spatial ecology (Arnold and Dewar, 2001; Block et al., 2011; Hussey et al., 2015). While advances in electronic tag technologies over the last several decades have greatly improved our understanding of the spatial ecology of fishes, each design has different limitations in terms of its capacity to describe the movements of fishes. Importantly, these technologies often have substantial error associated with positional estimates, though this varies across tag technologies (Teo et al., 2004; Kessel et al., 2014). This is particularly true in the case tags that use light-based geolocation to reconstruct tracks of tagged animals. This approach can have errors in latitude and longitude in excess of several degrees (Teo et al., 2004; Winship et al., 2012), which, depending upon the scale of the error and the size of the MPA, can bias inferences regarding the degree of protection provided by an MPA. On the other extreme, acoustic monitoring approaches can provide fine scale estimates of space use, but only provide information when tagged animals are within range of an acoustic receiver. One method to estimate space use from acoustic data is the use of Brownian Bridge models, which generate probability distributions for animal locations between successive detections based on conditional random walks between locations (Horne et al., 2007). This approach is increasingly being used to estimate patterns of space use from acoustic receiver arrays (Pagès et al., 2013; Becker et al., 2016; Acolas et al., 2017; Oh et al., 2017), though it is known to be sensitive to irregular detection records or large temporal gaps in detections (Horne et al., 2007; Pagès et al., 2013), which are common in acoustic tag data. One approach to mitigate these limitations is to use a combination of tagging technologies to evaluate the degree of protection conferred on mobile taxa by existing MPAs (Weng et al., 2005; Meyer et al., 2010; Carlisle et al., 2011; Papastamatiou et al., 2015; Drymon and Wells, 2017).
The British Indian Ocean Territory MPA (BIOT MPA) is one of the largest no-take MPAs in the world. Established in 2010, the BIOT MPA contains the islands and atolls of the Chagos Archipelago and extends out to the 200 nautical mile (nm) exclusive economic zone (EEZ), bringing the total MPA area to ∼640,000 km2 (Figure 1). The only resident human population in the BIOT MPA is based on Diego Garcia, in the south east of the MPA, where approximately 3,000 individuals support a joint United Kingdom–United States military base. Its remote location and low population density means that the MPA is relatively free from local anthropogenic effects (Sheppard et al., 2012) and therefore boasts a relatively high reef fish biomass (Graham et al., 2013) and abundance of top predators (Graham and McClanahan, 2013). However, the MPA has been targeted by illegal, unreported and unregulated fishing (IUU) (IOTC-2015-WPEB11-48), predominantly by vessels from India and Sri Lanka fishing for sharks (Graham et al., 2010), a problem that continues to be a significant management concern (Ferretti et al., 2018; Tickler et al., 2019).
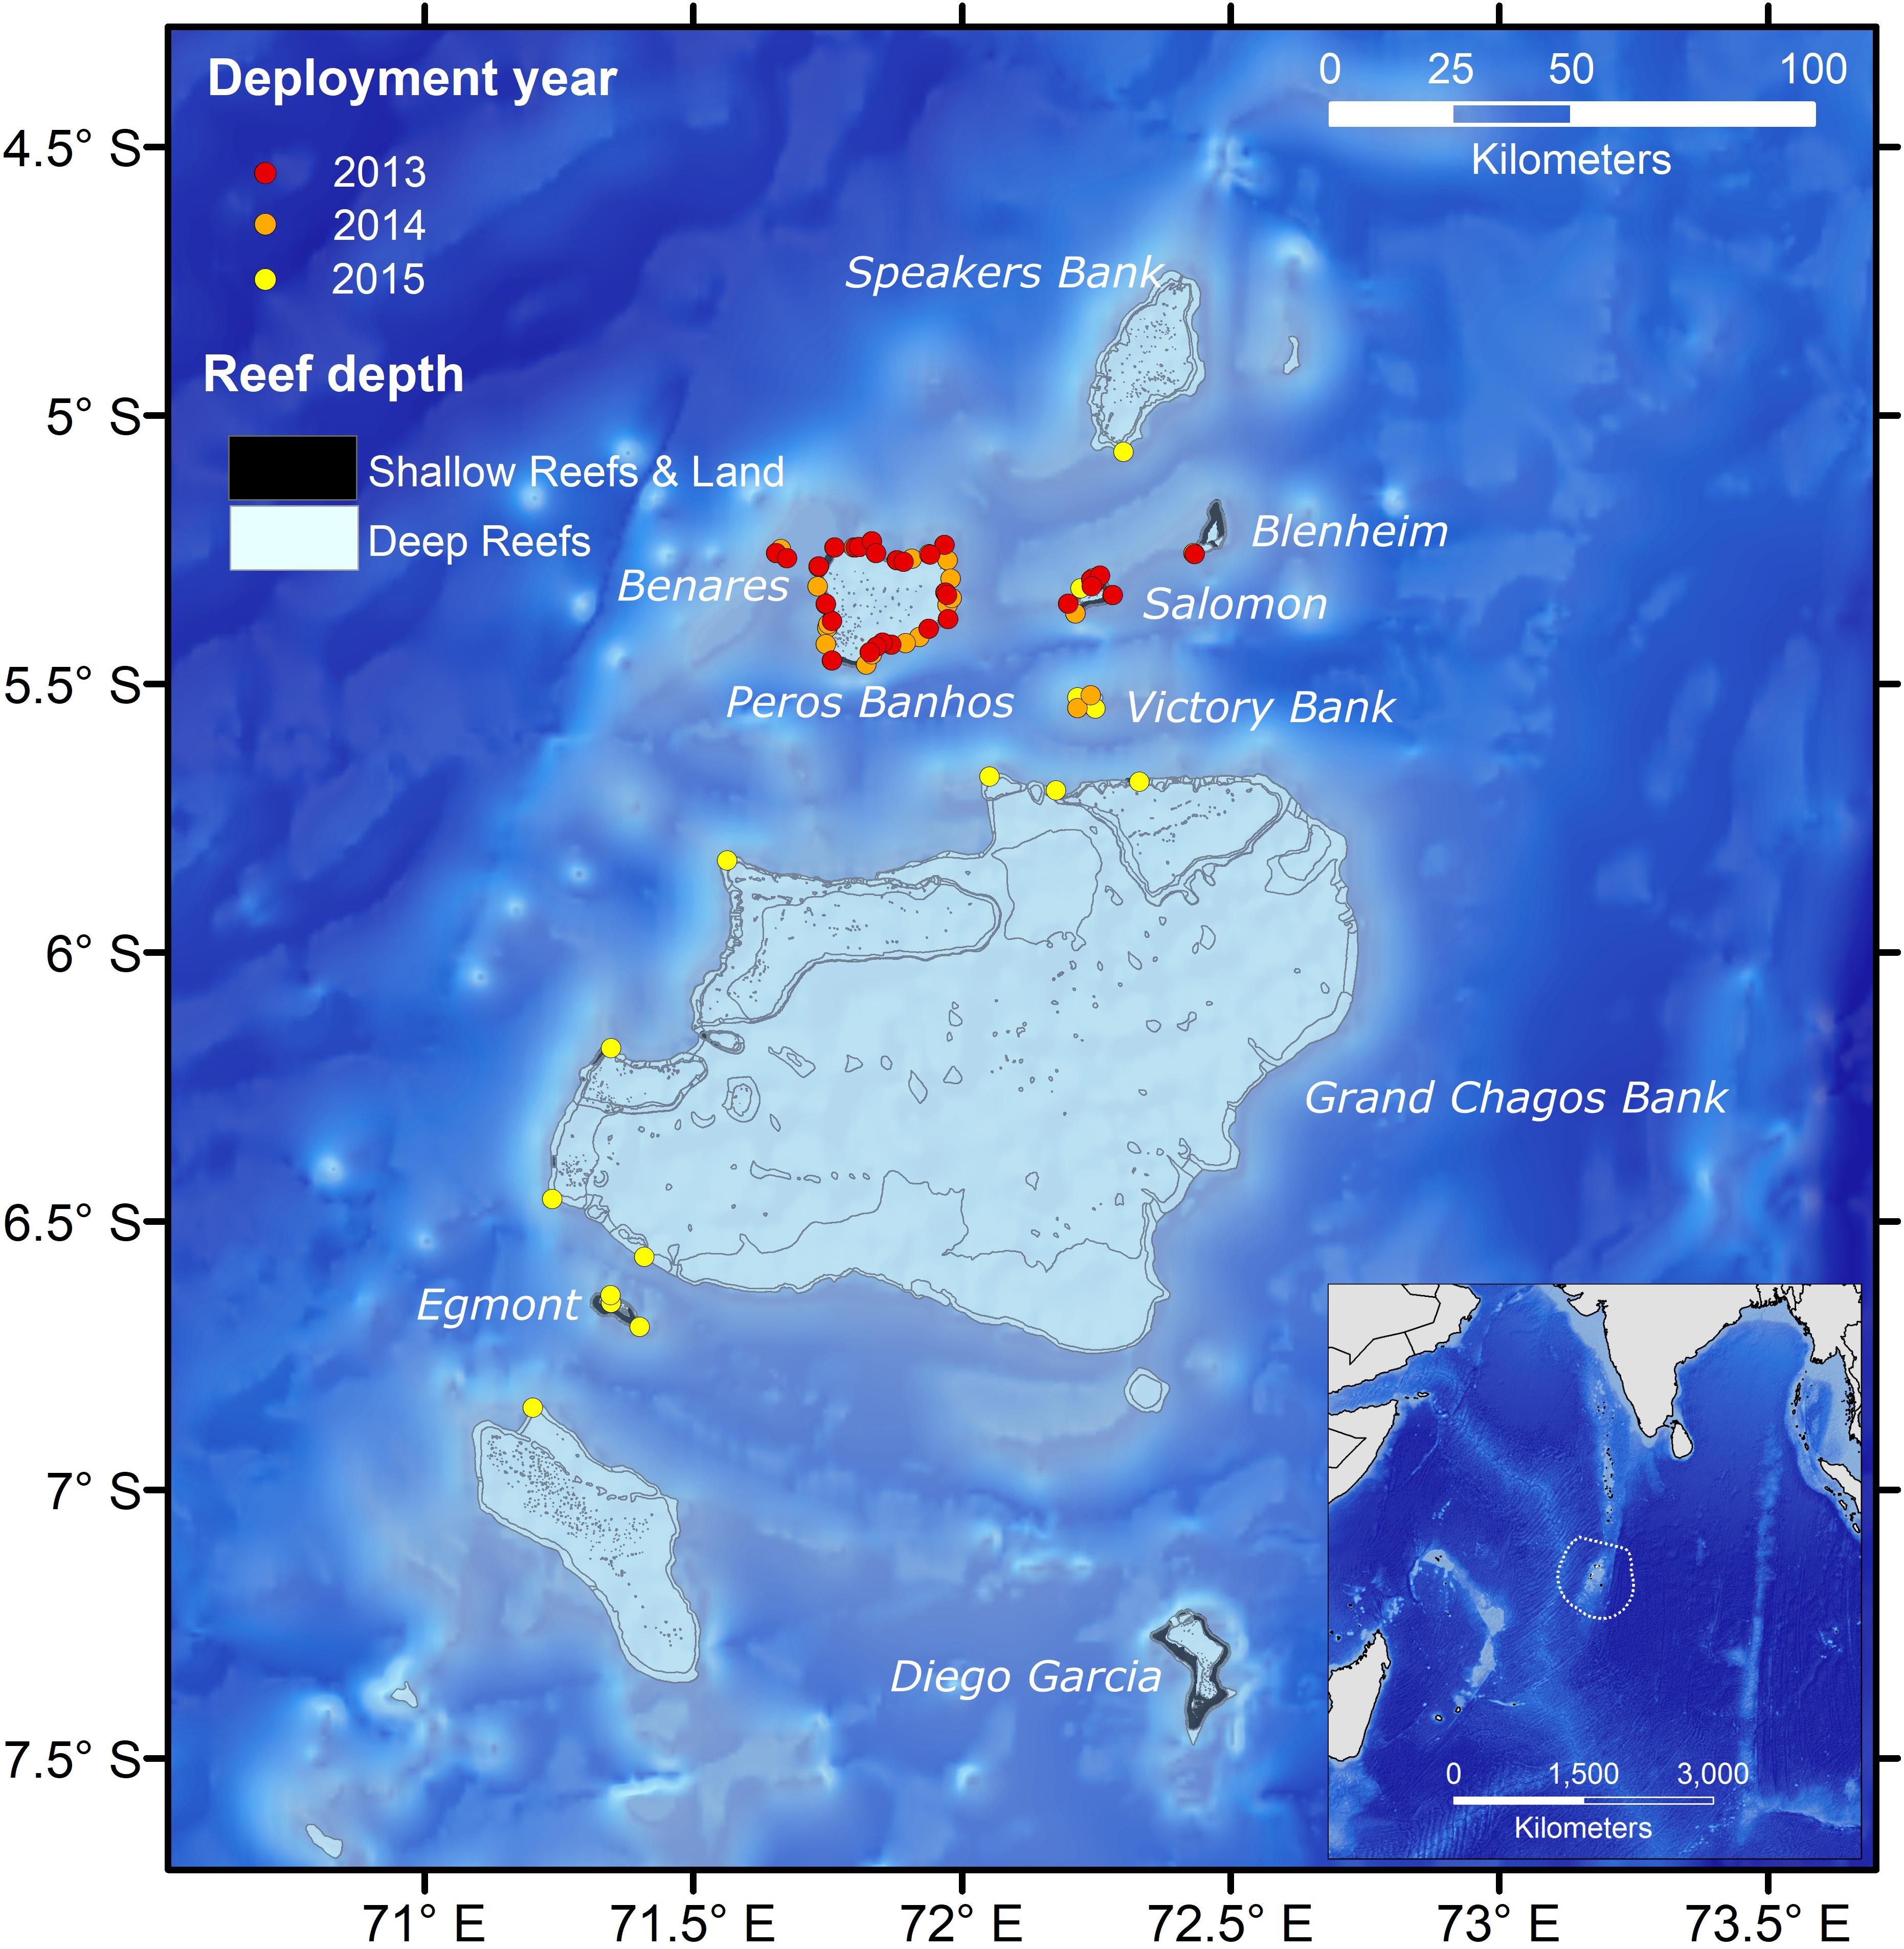
Figure 1. Acoustic array in the BIOT MPA showing year of deployment for acoustic receivers. The inset shows the location of the BIOT MPA with the extent of the MPA being shown by the dotted line. Shallow reefs are <∼20 m, deep reefs are ∼100 to 20 m in depth. Gray lines show contours of major submerged features. Note that there is little land in the archipelago.
Since 2013, a research program has been working to better understand the ecology of the MPA, sponsored by the Bertarelli Programme in Marine Science1 and supported by the United Kingdom Foreign and Commonwealth Office and British Indian Ocean Territory Administration. As part of this program, a variety of species of sharks and predatory fishes have been tagged with satellite and acoustic tags. These tags have not only provided information on the species’ fine-scale spatial and temporal ecology, but also allowed us to investigate the ability of the BIOT MPA to effectively protect a range of pelagic and reef-associated teleost and chondrichthyan fishes. In this paper we estimate the activity space of seven mobile reef and pelagic species in the BIOT MPA using a combination of electronic tag technologies, and present a preliminary assessment of the potential effectiveness of this MPA for their protection. We also describe several factors that influence the ability of electronic tags to fully describe the spatial ecology of mobile marine species, including choice of electronic tagging technology, study duration and, in the case of acoustic tagging, the design of the acoustic receiver array.
Materials and Methods
Between 2013 and 2016, seven species of teleost and chondrichthyan fishes were tagged in the BIOT MPA with pop-up archival transmitting satellite tags (MiniPAT models 247A and 348A, Wildlife Computers, Redmond, WA United States), acoustic tags (VR16 coded tags, 69 kHz, transmission interval 30–90 s, Vemco, Halifax, Nova Scotia, Canada), or both. Pelagic species were tagged opportunistically and included Blue Marlin (Makaira nigricans), Sailfish (Istiophorus platypterus), Silky Sharks (Carcharhinus falciformis), and Yellowfin Tuna (Thunnus albacares). Reef species included Grey Reef Sharks (Carcharhinus amblyrhynchos), Reef Mantas (Manta alfredi), and Silvertip Sharks (Carcharhinus albimarginatus). All sharks were caught from small boats using hand lines with barbless circle hooks. Billfish and tunas were caught on lures, with billfish tagged in the water alongside the boat. Reef Mantas were all tagged in the water by free divers. Except for larger sharks (>∼1.5 m) which were kept in the water, all other animals were brought onto the boat and restrained, a seawater hose inserted into their mouth to irrigate the gills, and a wet cloth placed over their eyes. Once restrained, the animals were measured, tagged, and had tissue samples collected for genetic and stable isotope analyses.
Externally attached satellite tags were leadered with ∼15 cm of 180 kg monofilament (Moimoi, Kobe, Japan), covered with a layer of Spectra and shrink wrap, and attached to a titanium dart. External tags were embedded in the dorsal musculature below the dorsal fin in sharks and fishes and off the midline of the posterior disc in Reef Mantas. For sharks, acoustic tags were implanted intraperitoneally through a small incision (∼2–3 cm) just off the midline of their abdomen. Total handling time was generally less than 5 min. All procedures were approved by the Stanford University Administrative Panel on Laboratory Animal Care (APLAC) under permit APLAC-10765.
Satellite Tag Analysis
MiniPATs recorded temperature, depth, and light data for the duration of the tag deployments and detached after a user defined period of time and transmitted summaries of archived data sets to orbiting Argos receivers. Light data from MiniPATs were processed using the manufacturer’s software (Wildlife Computers DAP Processor 3.0) and geolocations estimated following Teo et al. (2004). A Bayesian state space model (SSM) was used to generate the most probable track while quantifying the uncertainty associated with each daily position (Block et al., 2011; Winship et al., 2012). We saved the full posterior distribution of daily location estimates (20,000 estimates of position for each day) from the SSM for all tags for use in further analysis.
We used the Geospatial Modeling Environment version 0.7.3.0 (Beyer, 2012) to estimate 50% (core activity space) and 95% (total activity space) kernel utilization distributions (KUDs) for satellite tag tracks. To incorporate SSM model error into analysis of space use, we calculated KUDs for both the SSM track and the full posterior distribution of estimated positions used to generate the most probable SSM track (hereafter PD positions) (Supplementary Figure S1). The KUDs for the SSM tracks represent the least conservative (smallest) estimate of space use of the tagged animals, while the PD KUDs take into account SSM model error and represent the most conservative (largest) estimate of space use. For each tag we also calculated the proportion of the full dataset of PD positions that were inside the boundary of the BIOT MPA.
We analyzed the SSM tracks to investigate how long animals spent in areas of a given scale using residence time analysis (Barraquand and Benhamou, 2008), which is an extension of first passage time analysis (Johnson et al., 1992). Residence time analysis estimates the time an animal spends within a circle of a given radius centered on a given location, including travel time to and from that location. The animal is not considered to have left the circle until it has spent more than a user defined maximum time threshold outside the circle, which we set to 1 day. We used that threshold because it would provide the most conservative (lowest) estimate of time spent in an area of a given radius, and would reduce the risk of overestimating duration of residency. Residence time analysis was implemented in R (version 3.4) using the package ‘adehabitat’ version 1.8.18 (Calenge, 2006).
Acoustic Receiver Array
An array of acoustic receivers, primarily comprised of VR2W receivers (Vemco Inc., Nova Scotia, Canada), was deployed around the BIOT MPA starting in 2013 and then expanded during 2014 and 2015 (Figure 1). VR2W acoustic receivers were attached to a subsurface mooring consisting of an anchor, three meters of polypropylene line, and a float. Due to permitting and diving regulations, receivers were predominantly placed on the fore reefs of the atolls between 15 and 20 m depth. The northern atolls (Benares Shoal, Peros Banhos, Salomon, Victory Bank) had the highest density of receivers as they were the geographic focus of the study, which over time expanded to cover a broader area of the archipelago. In 2013, 20 VR2W receivers were deployed around Peros Banhos, five at Salomon Atoll and three at Benares Shoals and Blenheim Reef. In subsequent years the array in the northern atolls was further expanded while the broader array was also extended to other areas of the archipelago. In 2014 and 2015, 36 additional VR2W units were added (22 in 2014; 14 in 2015) to include Victory Bank, Great Chagos Bank, Egmont Island, and Speakers Bank. Two VR4 Global units were also deployed in 2013 and four VR4 Underwater Monitors in 2014. Receivers were downloaded and serviced annually.
Acoustic Tag Analysis
Monthly KUDs were estimated for the acoustic tag data using a dynamic Brownian Bridge Movement Model (dBBMM) (Kranstauber et al., 2012) implemented in R statistical software version 3.3.1 using the package ‘move’ (Kranstauber et al., 2013). The dBBMM is an extension of the Brownian Bridge Movement Model (BBMM) which approximates the movement between consecutive data points using a conditional random walk, taking into account the distance and elapsed time between consecutive data points (Horne et al., 2007). A key parameter of this framework estimated from the data is the variance of Brownian motion (σ2m), which defines the animal’s mobility along a path. Whereas the BBMM uses a constant σ2m along the entire movement path, the dBBMM allows the σ2m to vary along the path based on estimates within a sliding window providing a more precise estimate of the KUD by incorporating behavioral changes in the estimate of σ2m (Kranstauber et al., 2012). For each month of an animal’s detection data, a 95% KUD was estimated using the dBBMM. Individual monthly polygons, starting with the first month of data, were incrementally overlaid and a union operation performed in order to investigate how the cumulative space (i.e., total area of the union at each time step) use increased over time.
The cumulative space use of individual animals over time changed following a sigmoid curve. We modeled this process to estimate total space use for each species and understand how monitoring time affects estimates of space use. We applied non-linear mixed effect models to the monthly dBBMM KUD estimates. The non-linear model was a sigmoid model with three parameters
where ϕ1 is the asymptote, ϕ2 is x at ϕ1/2 and ϕ3 is a scale parameter. Initially, we tested a random effect (shark ID) for the three parameters. The analysis suggested that the inter-individual variation of ϕ2 and ϕ3 was marginal, and significant only on ϕ1, especially for Silvertip Sharks. Therefore, we eventually left the random effect only on ϕ1j[i]
For j = 1,...,J, where J are individual sharks. Additionally, we tested whether the individual variation on the curve asymptote could be explained by changes in the size of the array, expressed by the minimum convex polygon (MCP) of the array receiver locations at any time in the study period (see section “Acoustic Receiver Array”), but the effect was not significant (Supplementary Tables S1, S2), so array size did not influence estimated patterns of space use. Before fitting the models we removed the individuals with less than five months of observations (n = 33 Grey Reefs and 21 Silvertips) and sharks with activity spaces greater than 800 km2 (two Grey Reefs) as these emerged as outliers compared to all other individuals in the dataset. This left 26 Grey Reefs and 33 Silvertips for further analyses.
We used the duration of gaps in acoustic detection to estimate whether a shark could have left the BIOT MPA assuming a straight-line movement from location of the last detection before the gap toward the MPA boundary and then back to the location of the first detection after the gap. The distance from the center of the MPA to the boundary was ∼450 km. Time intervals between consecutive detection events were combined with mean cruising swim speeds of both species (Ryan et al., 2015) to calculate the maximum distance an individual could have traveled. This was compared with the minimum round-trip distance from the starting point to the nearest part of the MPA boundary to the finish point. Where the computed swim distance exceeded the boundary round trip distance, it was determined that the shark theoretically could have left the MPA. The number and total time for all such events was summed by individual and species and compared with total monitoring period and total number of movement events.
Array Design Modeling
The ability of acoustic monitoring to describe the distribution of an acoustically tagged animal will be determined by how the spatial ecology of the animal overlaps with the acoustic array, hence array design fundamentally constrains the types of observations and questions that acoustic monitoring can be used to address (Clements et al., 2005; Heupel et al., 2006). Optimally, something is known about the spatial ecology of the species of interest which can guide the array design. However, often there is no a priori information on the patterns of space use of a species of interest to guide array design, as obtaining that type of information is often a goal of these types of studies. Furthermore, once the data are collected from an acoustic receiver array, rarely are there any sensitivity analyses conducted to understand how array design might have influenced the results.
To investigate the effect of array design on different analyses of acoustic tag data (residency indices, gaps in detection, and dBBMM estimates), we investigated two aspects of receiver placement: receiver location (i.e., array size relative to tagging location), and array density (i.e., distance between adjacent receivers), by subsampling our existing dataset. For these analyses we used data from the densest part of the BIOT array in the northern atolls and banks at Peros Banhos, Benares Shoal, Salomon Atoll, and Victory Bank. Detection data for 2014 and 2015 were used, but only data from array elements present in the 2014 season were retained since all array elements deployed in 2014 were used over both years, providing a consistent baseline for our analyses. Shark tags with fewer than 30 days of detections were excluded (n = 39).
To investigate the effect of receiver distance relative to shark tagging location, a matrix of distances between shark tagging locations and receivers was produced using the function dist() in the package ‘vegan’. We used a Euclidean distance measure calculated on the matrix of individual shark tagging and receiver locations, and the mean residency index (days detected per total days monitored) of each shark at receivers 5, 10, 15, 20 …. 70 km from their tagging location was calculated, as well as a weighted average per species. The number of individual sharks of each species detected at increasing distances from their tagging location was also calculated. The probability of detecting a shark at different radii from tagging location was then modeled using a generalized linear model with a logit link function, with ‘successes’ being the number of tags of a species detected at a given distance and ‘failures’ the number of undetected tags based on the total tags for that species. An interaction between species, as a factor, and tagging location-receiver distance was used to test the hypothesis that Silvertip Sharks range further, on average, than Grey Reef Sharks.
To model the effect of array density on detection metrics (residency indices, gaps in detection), we filtered the detection data based on subsets of the existing receiver array. Subsets of receivers from the northern array were selected based on a minimum threshold distance between adjacent receivers, which was varied from 0 to a maximum of 20 km. At spacing greater than 20 km between receivers, the simulated arrays had too few elements to produce data that could be usefully analyzed. To generate the sub-arrays, a matrix of array distances was calculated using the function dist() in the package ‘vegan’ with a Euclidean distance measure as above. For each threshold distance, a random starting node in the array was chosen and the distance to the remaining receivers tested iteratively. On each iteration an additional receiver was added only if it was at least the threshold distance from all receivers previously selected. This process was repeated until no further receivers could be added to the subsampled array. The subsampling was repeated 1,000 times for each distance step, with duplicate sub-arrays discarded. This process generated a group of receiver sub-arrays that was comprised only of receivers that were above a given threshold distance from each other. The raw detection data were filtered based on the subsampled arrays and the observed residency index and mean time interval between pairs of consecutive detections was calculated for each individual shark. Median and IQR of these metrics were then calculated for each array spacing.
We investigated the potential effect of array density on observed activity space using data from a Silvertip with a high overall residency, long monitoring period, and relatively high mobility (visiting 18 receivers). Sub-setting this shark’s detection data for smaller/less dense arrays provides a reasonable indication of the effect of reduced receiver coverage on estimates of activity space. For each distance step, ten subsets of the array were randomly generated and used the distance based method described above, subject to the additional condition that they contained at least two of the receivers visited by the shark (the dBBMM model requires at least two different locations in the data to make a UD estimate). The 95% KUD using the dBBMM implementation described above was calculated for each iteration, and the mean and CI for each distance step plotted against array spacing.
We also evaluated the potential effect that the size of the array, in terms of receiver coverage relative to tagging location, had on dBBMM 95% KUD estimates. We used data from nine Silvertip Sharks with relatively high residency (>33% of days) and which were detected at 8 or more receivers, in order to have enough data to model, and sequentially added data from receivers in order of their distance from a shark’s tagging location. For each array iteration, we estimated the 95% KUD using dBBMM as described above. Although we attempted the same analysis with Grey Reef Sharks, their high level of residency to often a single receiver made the analysis uninformative, and hence we analyzed data for Silvertip Sharks only.
Results
Satellite Tagging
Twenty-six MiniPATs were deployed on six species in the BIOT MPA (Blue Marlin, Reef Mantas, Sailfish, Silky Shark, Silvertip Shark, and Yellowfin Tuna) between 2013 and 2016. (Figure 2 and Table 1). Tags transmitted time series and summarized data sets of temperature, depth, and light to the Argos system. However, here we only report on patterns of horizontal space use in tagged animals. Deployment lengths ranged from 7 to 269 days (median 104.5, 23–180 days interquartile range, IQR).
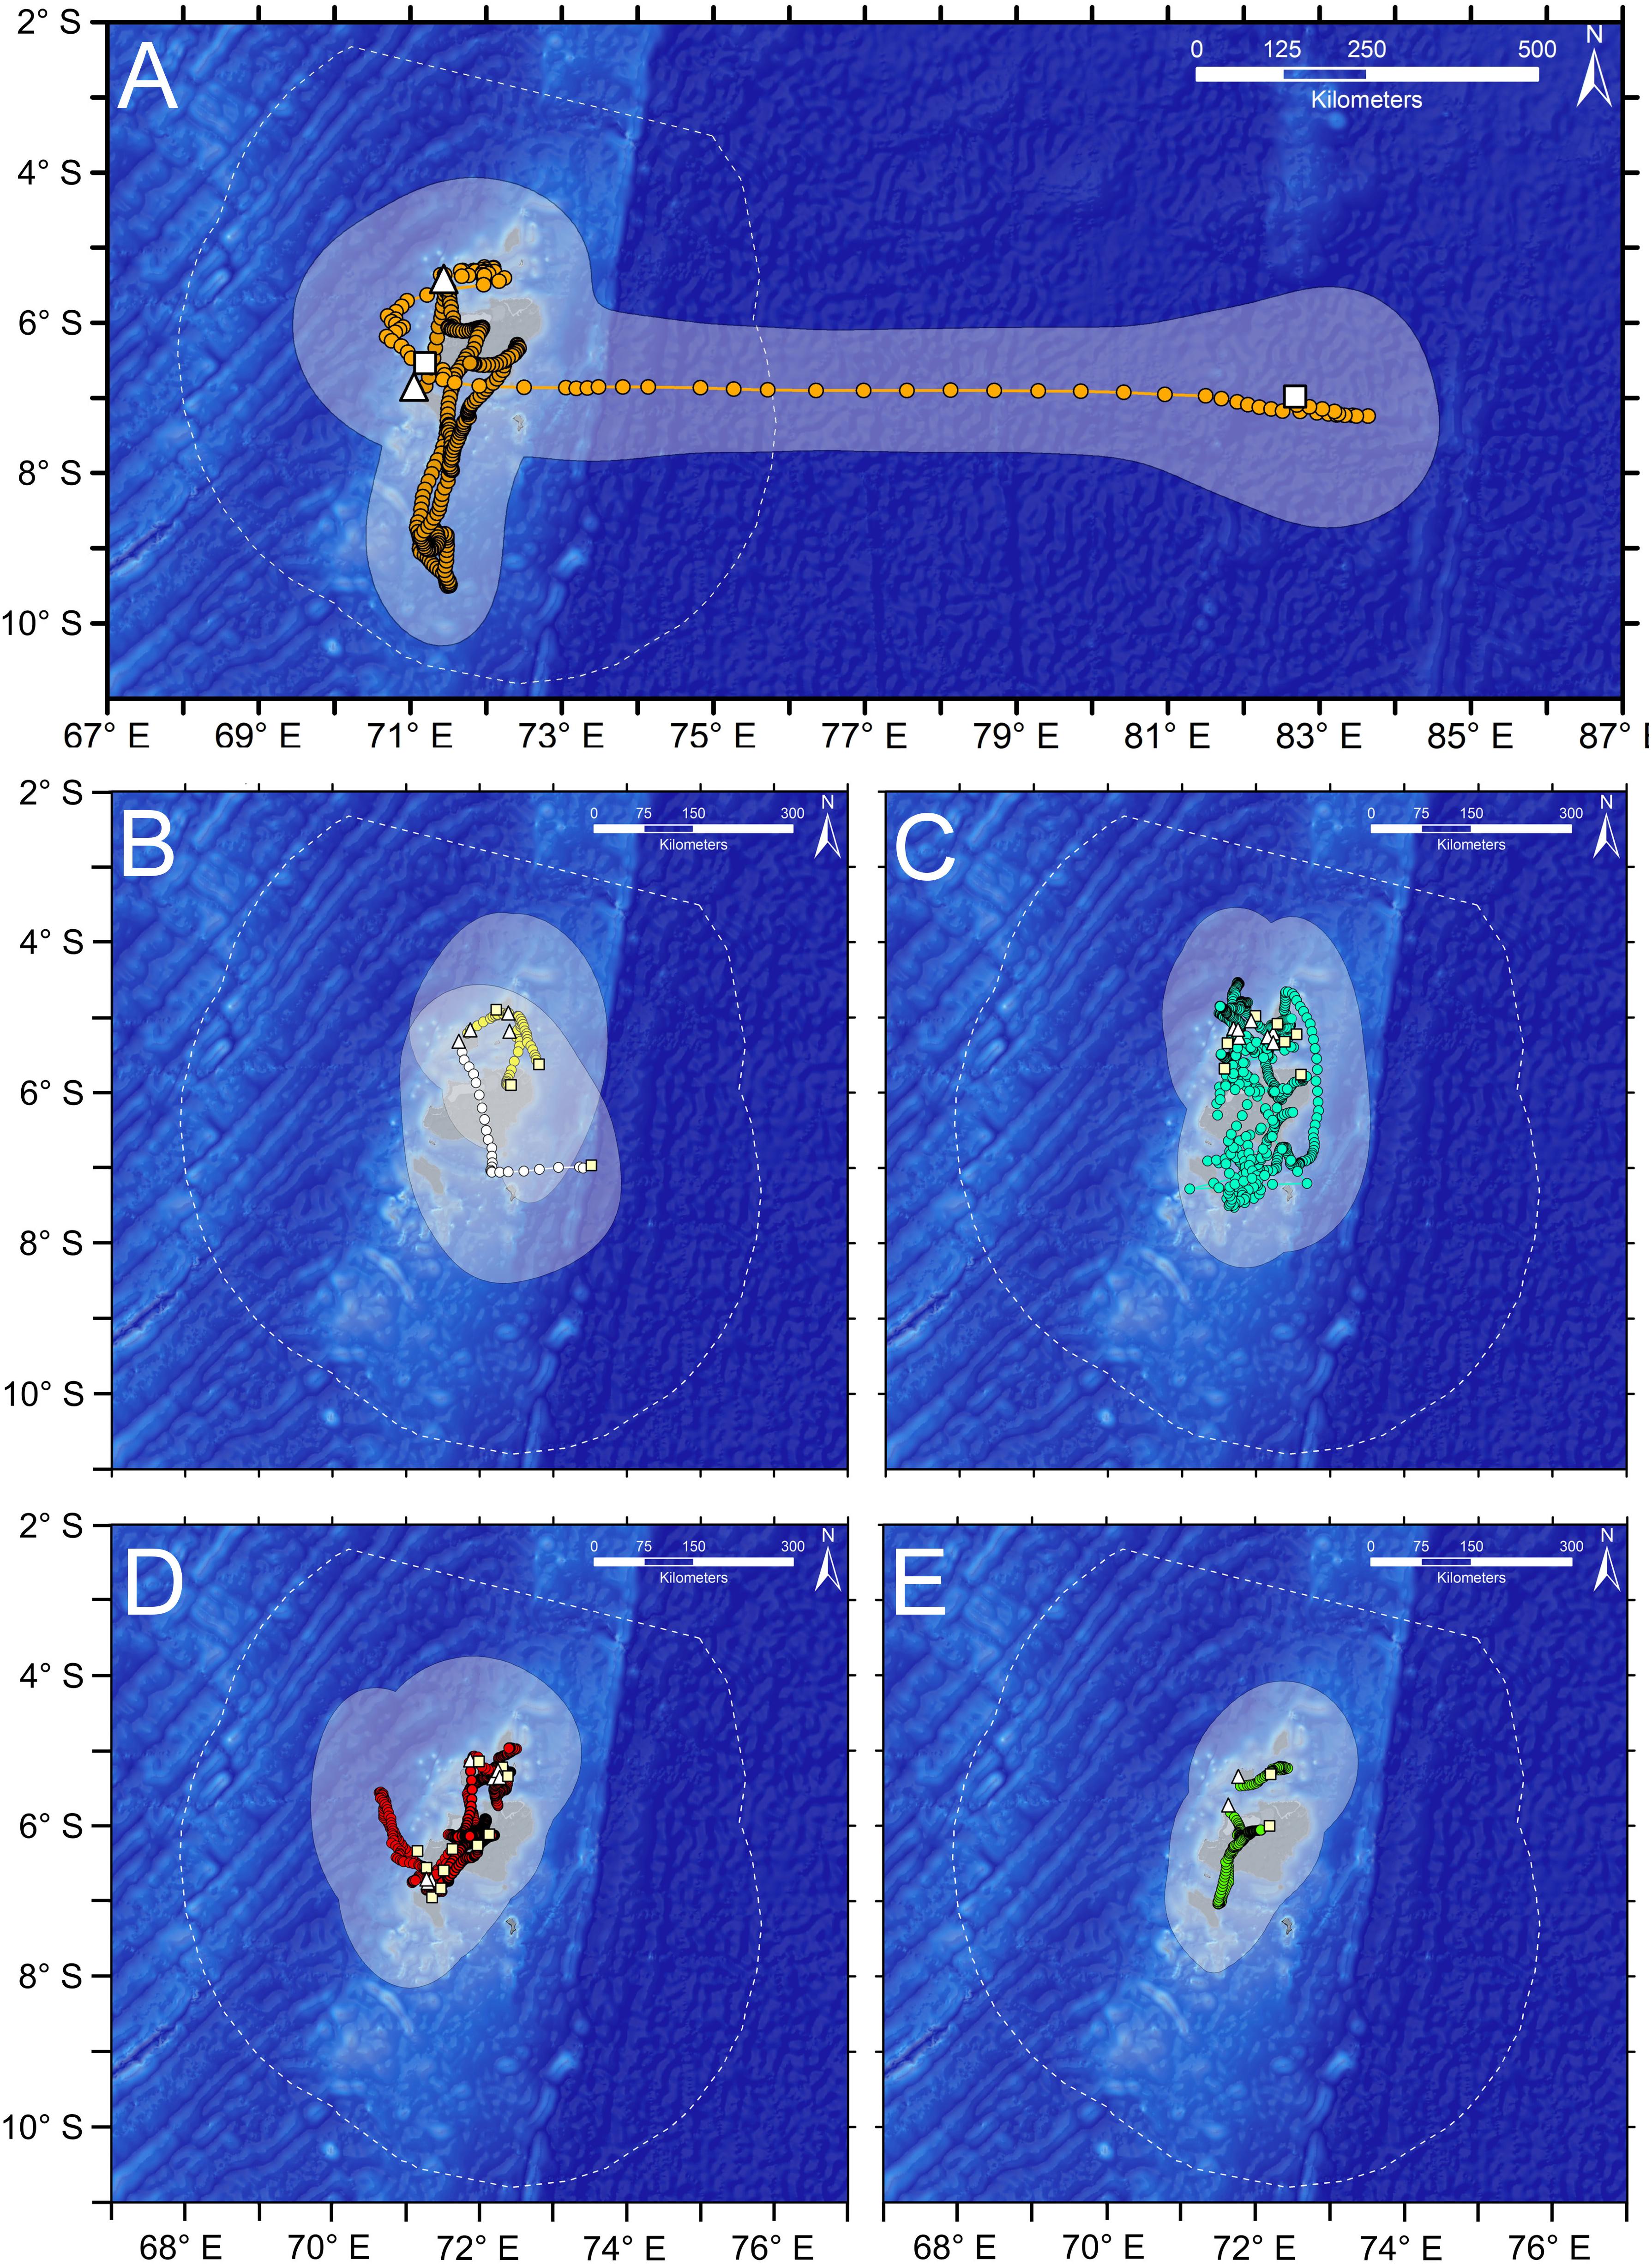
Figure 2. State space model tracks, and 95% KUD (shaded polygon) of full posterior distribution of estimated positions from SSM model for satellite-tagged pelagic fishes and elasmobranchs in BIOT MPA. Tagging location is indicated with the white triangle, pop-up position with white square. Boundary of the BIOT MPA is shown with the dotted white line. (A) Silky Sharks (SKY, n = 2), (B) Blue Marlin (BLM, white, n = 1) and Yellowfin Tuna (YFT, yellow, n = 3), (C) Silvertip Sharks (STP, n = 7), (D) Reef Mantas (MAN, n = 11), and (E) Sailfish (SAI, n = 2).
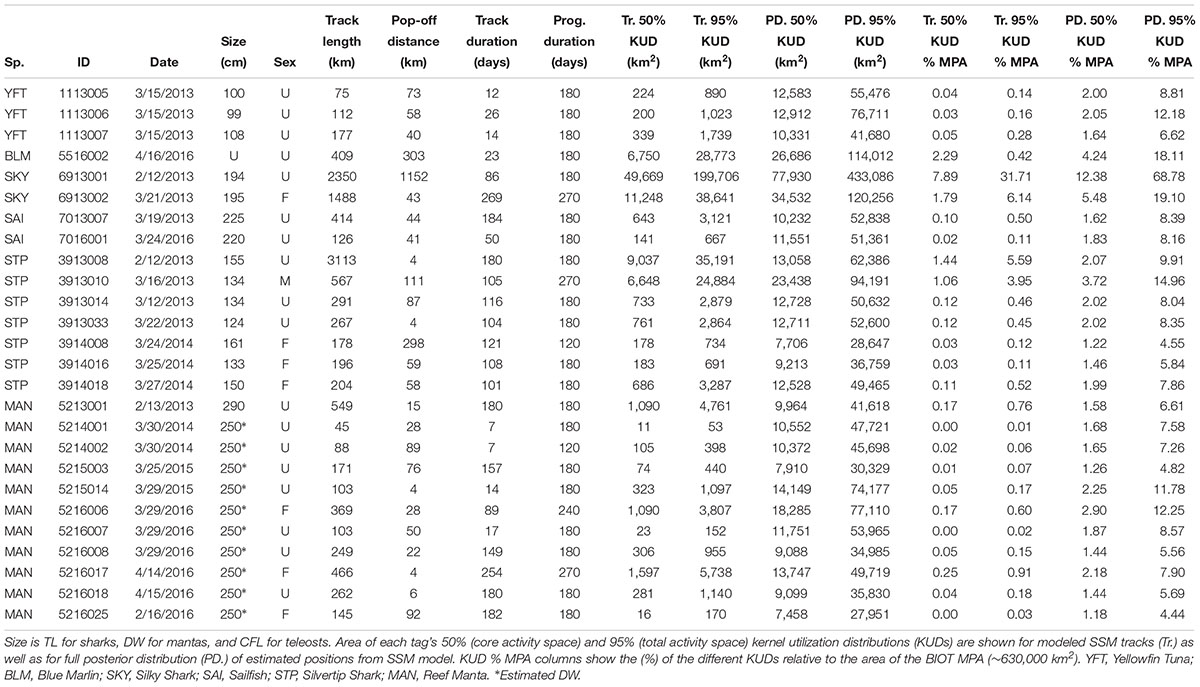
Table 1. Activity space of fishes and elasmobranchs tagged with satellite tags (miniPATs) in BIOT MPA.
Activity Space From Satellite Tags
Overall, activity spaces (50 and 95% KUDs) of the SSM tracks of tagged animals were much smaller than those estimated from the PD positions, and all KUDs were all much smaller than the area of the BIOT MPA (Table 1). All but one of the tagged animals remained within the BIOT MPA for the duration of the tag deployments (up to 269 days), even taking into account model error (Figure 2 and Table 1). The median of all 95% KUDs of PD positions, the most conservative (largest) estimate of activity space, was 8.1% (6.6–11.3% IQR) the size of the MPA, whereas for the 50% KUDs of PD positions it was 1.9% (1.6–2.2% IQR) (Table 1). A Silky Shark (6913001) was the only animal observed leaving the BIOT MPA. Over the course of the 86 days track, it remained in the vicinity of the archipelago for ∼2 months before making a directed easterly movement to about 83°E, where it remained for several weeks. This shark had the largest activity space of any tagged animal, with a 95% KUD of the SSM track being 199,706 km2 (∼32% size of the BIOT MPA) and the 95% KUD of the PD positions being 433,086 km2 (∼69% size of the BIOT MPA). The other Silky Shark, which remained within the BIOT MPA around the archipelago for 269 days, used a much smaller area with 95% KUDs that were ∼20–30% the size of its conspecific.
Based on the SSM tracks, Silvertip Sharks generally had larger activity spaces, about three times larger, than Reef Mantas. They also had much more variability in KUD estimates than Reef Mantas, which had narrower interquartile ranges for both 50 and 95% KUDs. Two Silvertip Sharks (3913008 and 3913010) had the longest tracks of the reef-associated species (Table 1). These two animals appeared to move across much of the archipelago, while the others all generally remained around the northern atolls, where they were tagged (Figure 2 and Table 1). However, the tag attached to Silvertip Shark 3913008, which had the longest track and largest KUD, detached several km from the original tagging location. Reef Manta 5216006 was the only reef species that appeared to make an extended (∼2 months, ∼100 km offshore) pelagic excursion away from the archipelago though it returned to its tagging location (Egmont) prior to its tag detaching. Even considering uncertainty around the SSM tracks, based on distance between tagging location and pop-up location, Silvertip Sharks and Reef Mantas were moving between atolls, islands, and other features of the archipelago which are generally separated by distances < 20–40 km. This is supported by data from a Silvertip Shark that was double tagged with both acoustic and satellite tags. The animal was detected frequently on the receivers while the satellite tag was attached, allowing the mean daily position obtained by acoustic detections to be compared directly with the estimated SSM positions. The difference between daily SSM positions and the mean daily location derived from acoustic detections differed by less than 0.25 degrees of longitude or latitude, approximately 25 km at the latitude of the BIOT MPA (Supplementary Figure S2). This provides some evidence that our SSM positions were relatively accurate, and also suggests that the double tagged shark was moving within a relatively tight radius of the reefs, even when not detected by receivers.
Residence time analysis suggested that reef-associated species and some pelagic species exhibit a high degree of residency in areas much smaller than the size of the BIOT MPA (Figure 3), which is consistent with activity space estimates for pelagic and reef species. Reef Mantas exhibited the highest degree of residency, spending extended periods of time in areas with radii 5–25% that of the MPA. Silvertip Sharks were generally less resident (spent less time) in areas of a given radius relative to Reef Mantas, exhibiting wider ranging, more directed movements. Sailfish were the most residential pelagic fish, spending extended periods of time in areas much smaller than the BIOT MPA. Yellowfin Tuna and Blue Marlin exhibited directed movements and were less resident although animals were only tracked for very short periods of time (<26 days). The two Silky Sharks showed completely different patterns, with one spending ∼200 days in an area with a radius ∼80% the size of the MPA and the other being the only animal to be observed leaving the BIOT MPA, having very low residency across all spatial scales. While caution should be used when interpreting these results as they are based on modeled tracks, we believe that the relative differences in residency patterns are generally valid, as even modeled tracks are able to distinguish between directed movements and more residential behaviors.
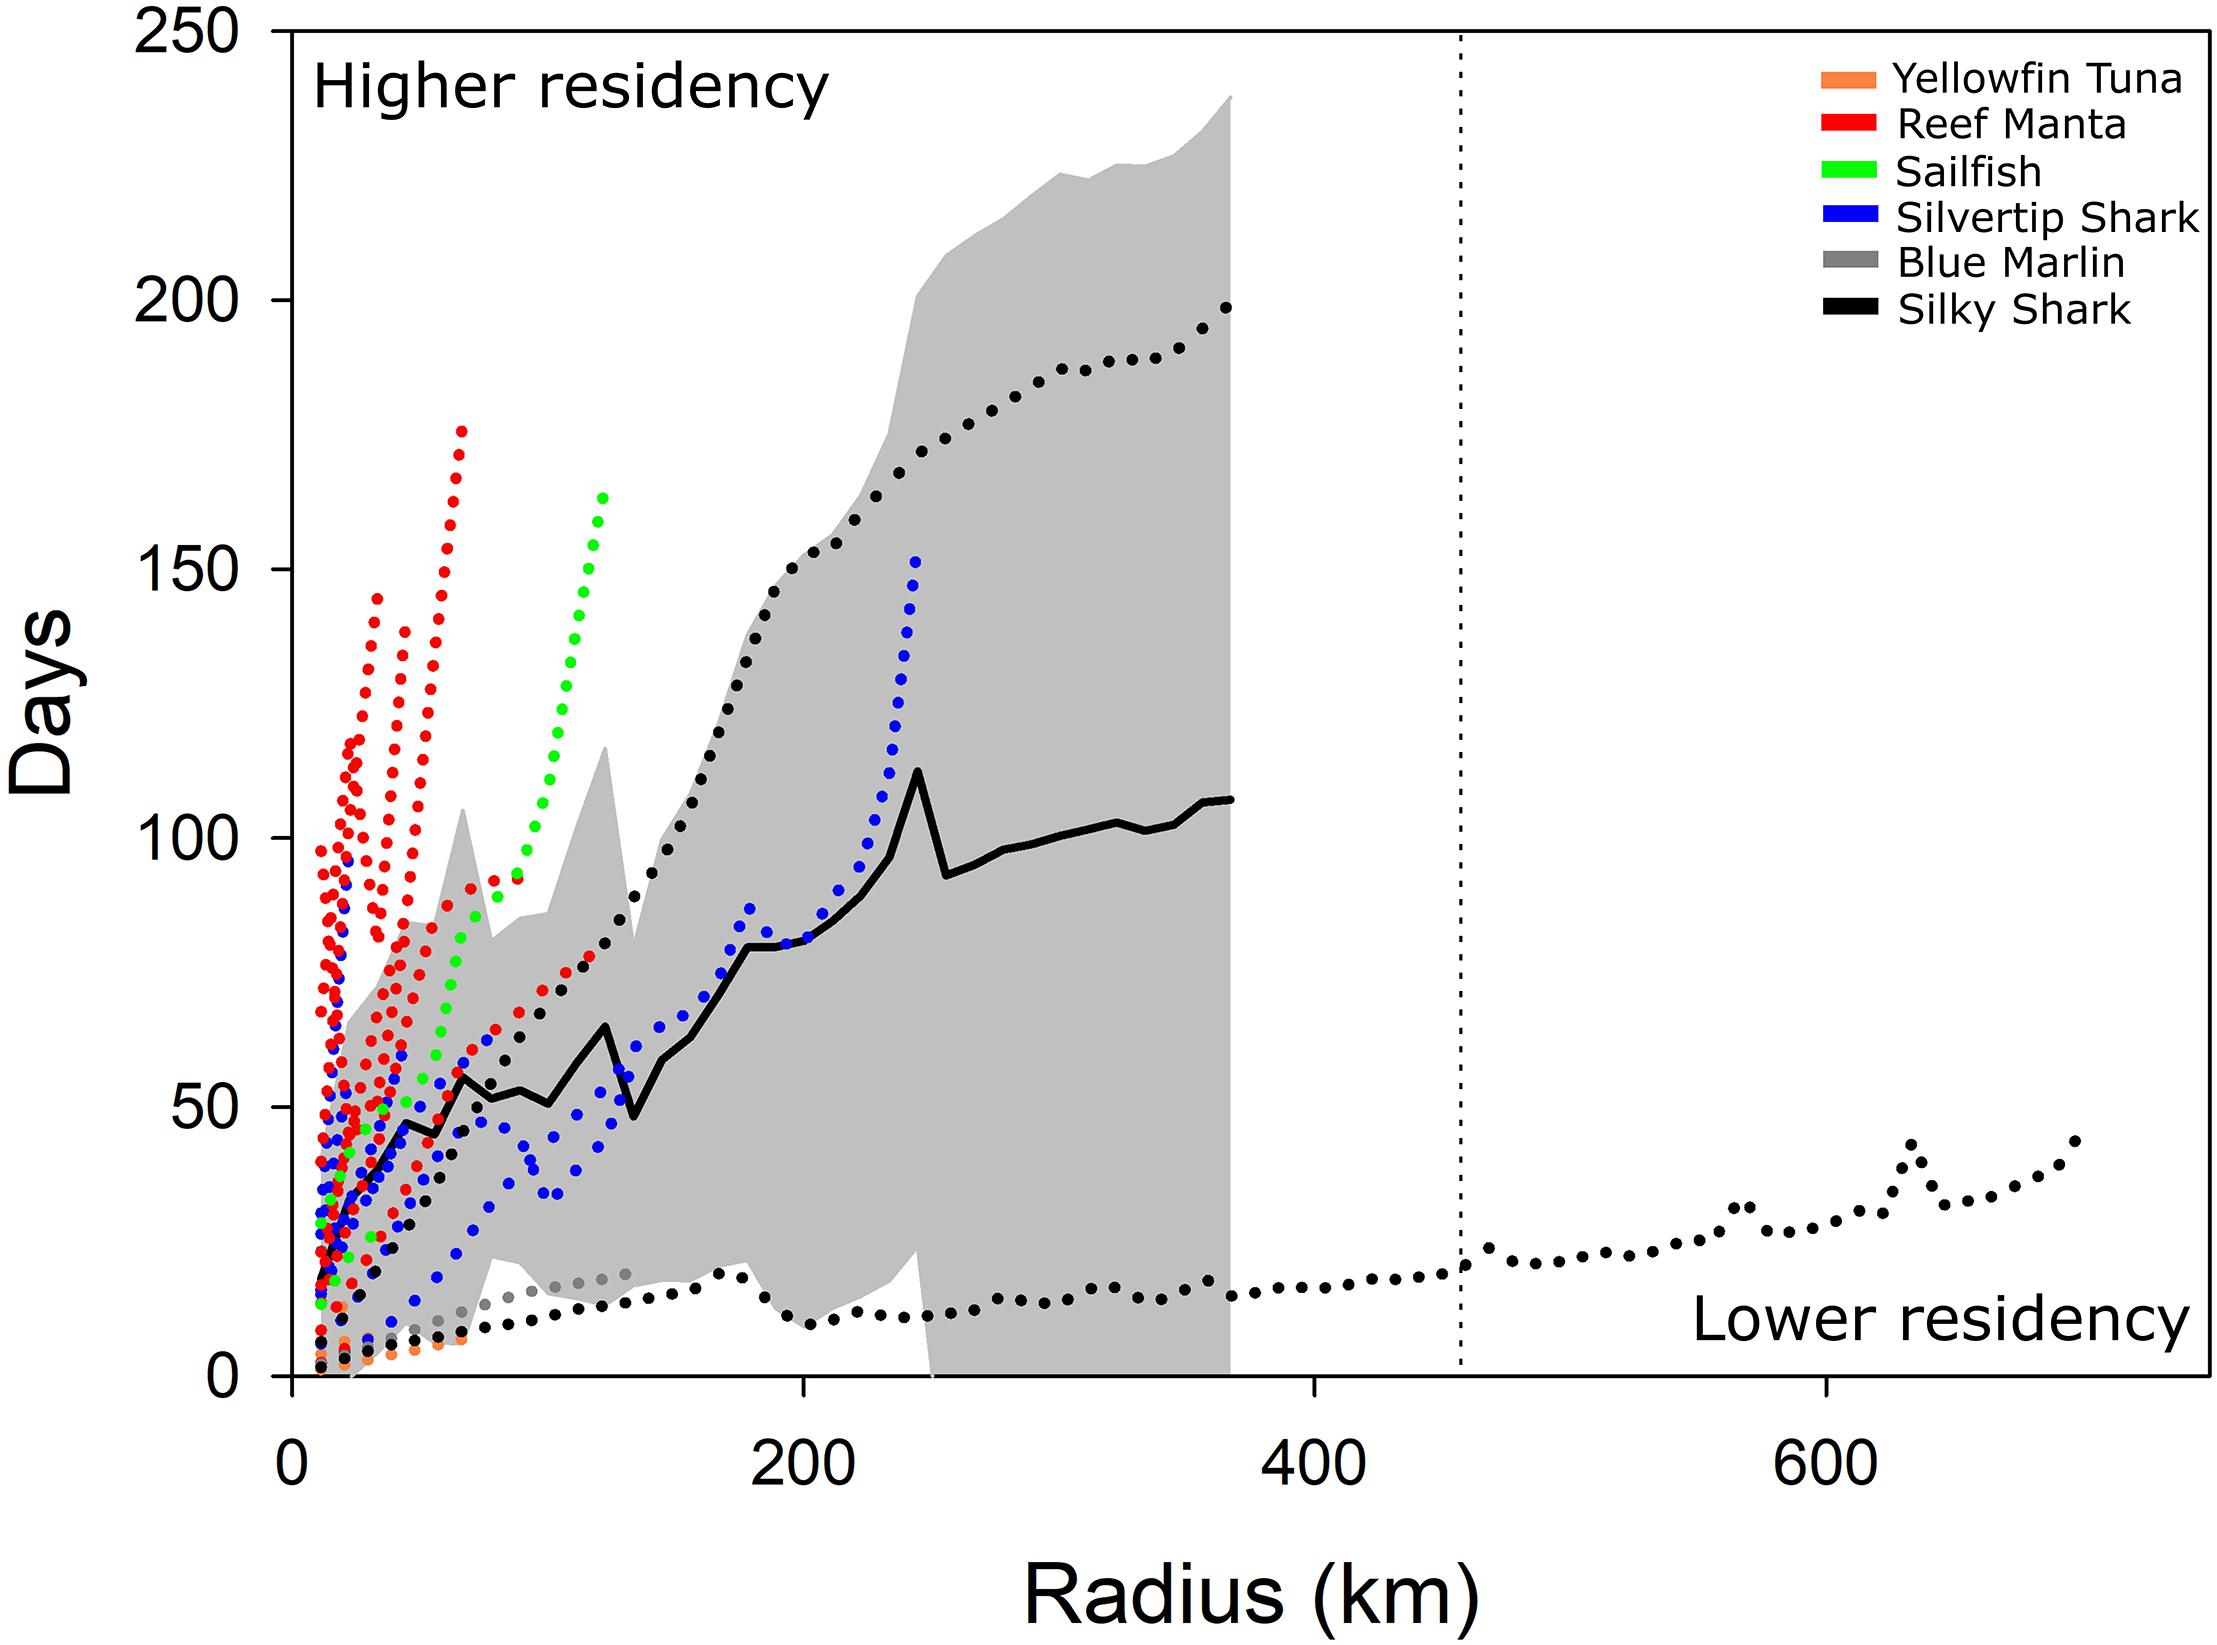
Figure 3. Spatial and temporal changes in residence time (time spent in circles with various radii) of satellite-tagged animals in the BIOT MPA. Overall mean residence time (black line, ±SD shaded area) is shown as is residence time for all individual animals (dotted colored lines). Approximate radius of BIOT MPA is ∼450 km (dashed vertical line).
Acoustic Tagging
A total of 121 Grey Reef and Silvertip Sharks were acoustically tagged and monitored from February 2013 to March 2016 (Table 2). Our tagging of Grey Reef Sharks was biased toward females but had an even mix of mature and immature animals (Last and Stevens, 2009), whereas Silvertips had a relatively equal representation between the sexes but were primarily immature animals (Last and Stevens, 2009). Cumulative 95% KUDs were estimated for 61 Grey Reef Sharks (mean TL 112.7 cm ± 17.4 SD) and 60 Silvertip Sharks (mean TL 121.9 cm ± 22.4 SD). Animals tagged in 2013 were monitored for up to a maximum of 40 months (Grey Reef: maximum 1,197 days, Silvertip: 1,122 days), while animals tagged later in the study had shorter monitoring periods.
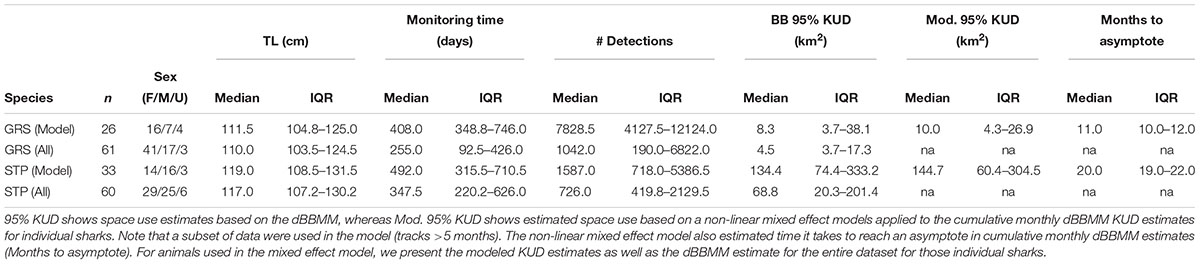
Table 2. Metadata and median and interquartile range (IQR) 95% KUD estimates for acoustically tagged Grey Reef (GRS) and Silvertip (STP) Sharks based on the dynamic Brownian Bridge movement model (dBBMM).
Dynamic Brownian Bridge Movement Model estimates of space use based on cumulative monthly 95% KUD estimates for the full data sets of Grey Reef and Silvertip Sharks were roughly half the size of those of the subsets of animals used in the non-linear mixed effects model, reflecting shorter tracks with more restricted movements across the array (Table 2 and Figure 4). Based on the cumulative dBBMM, Grey Reef Sharks used in the model (n = 26) had a median space use of 8.3 km2 (3.7–38.1 IQR, mean 50.4 km2 ± 107.2 SD), whereas for all Grey Reef Sharks (n = 61) it was 4.5 km2 (2.8–17.3 IQR, mean 41.4 km2 ± 124.4 SD). On average the tagged Grey Reef Sharks reached this level of space use after approximately 11 months (median, 10.0–12.0 IQR) (Figure 4). Silvertip Sharks used in the model (n = 33) had a median cumulative 95% KUD of 134.4 km2 (74.4–333.2 IQR, mean 278.6 km2± 331.7 SD), while for all tagged Silvertips (n = 60) it was 68.8 km2 (20.3–201.4 IQR, mean 170.1 km2 ± 274.6 SD), which was reached after approximately 20 months (19.0–22.0 IQR) (Figure 4). For the subset of sharks used in the non-linear mixed effects model, the estimated space use from the model was consistent with estimates from the cumulative dBBM for all tagged sharks (Table 2). Both species exhibited a high degree of intraspecific variability in space use.
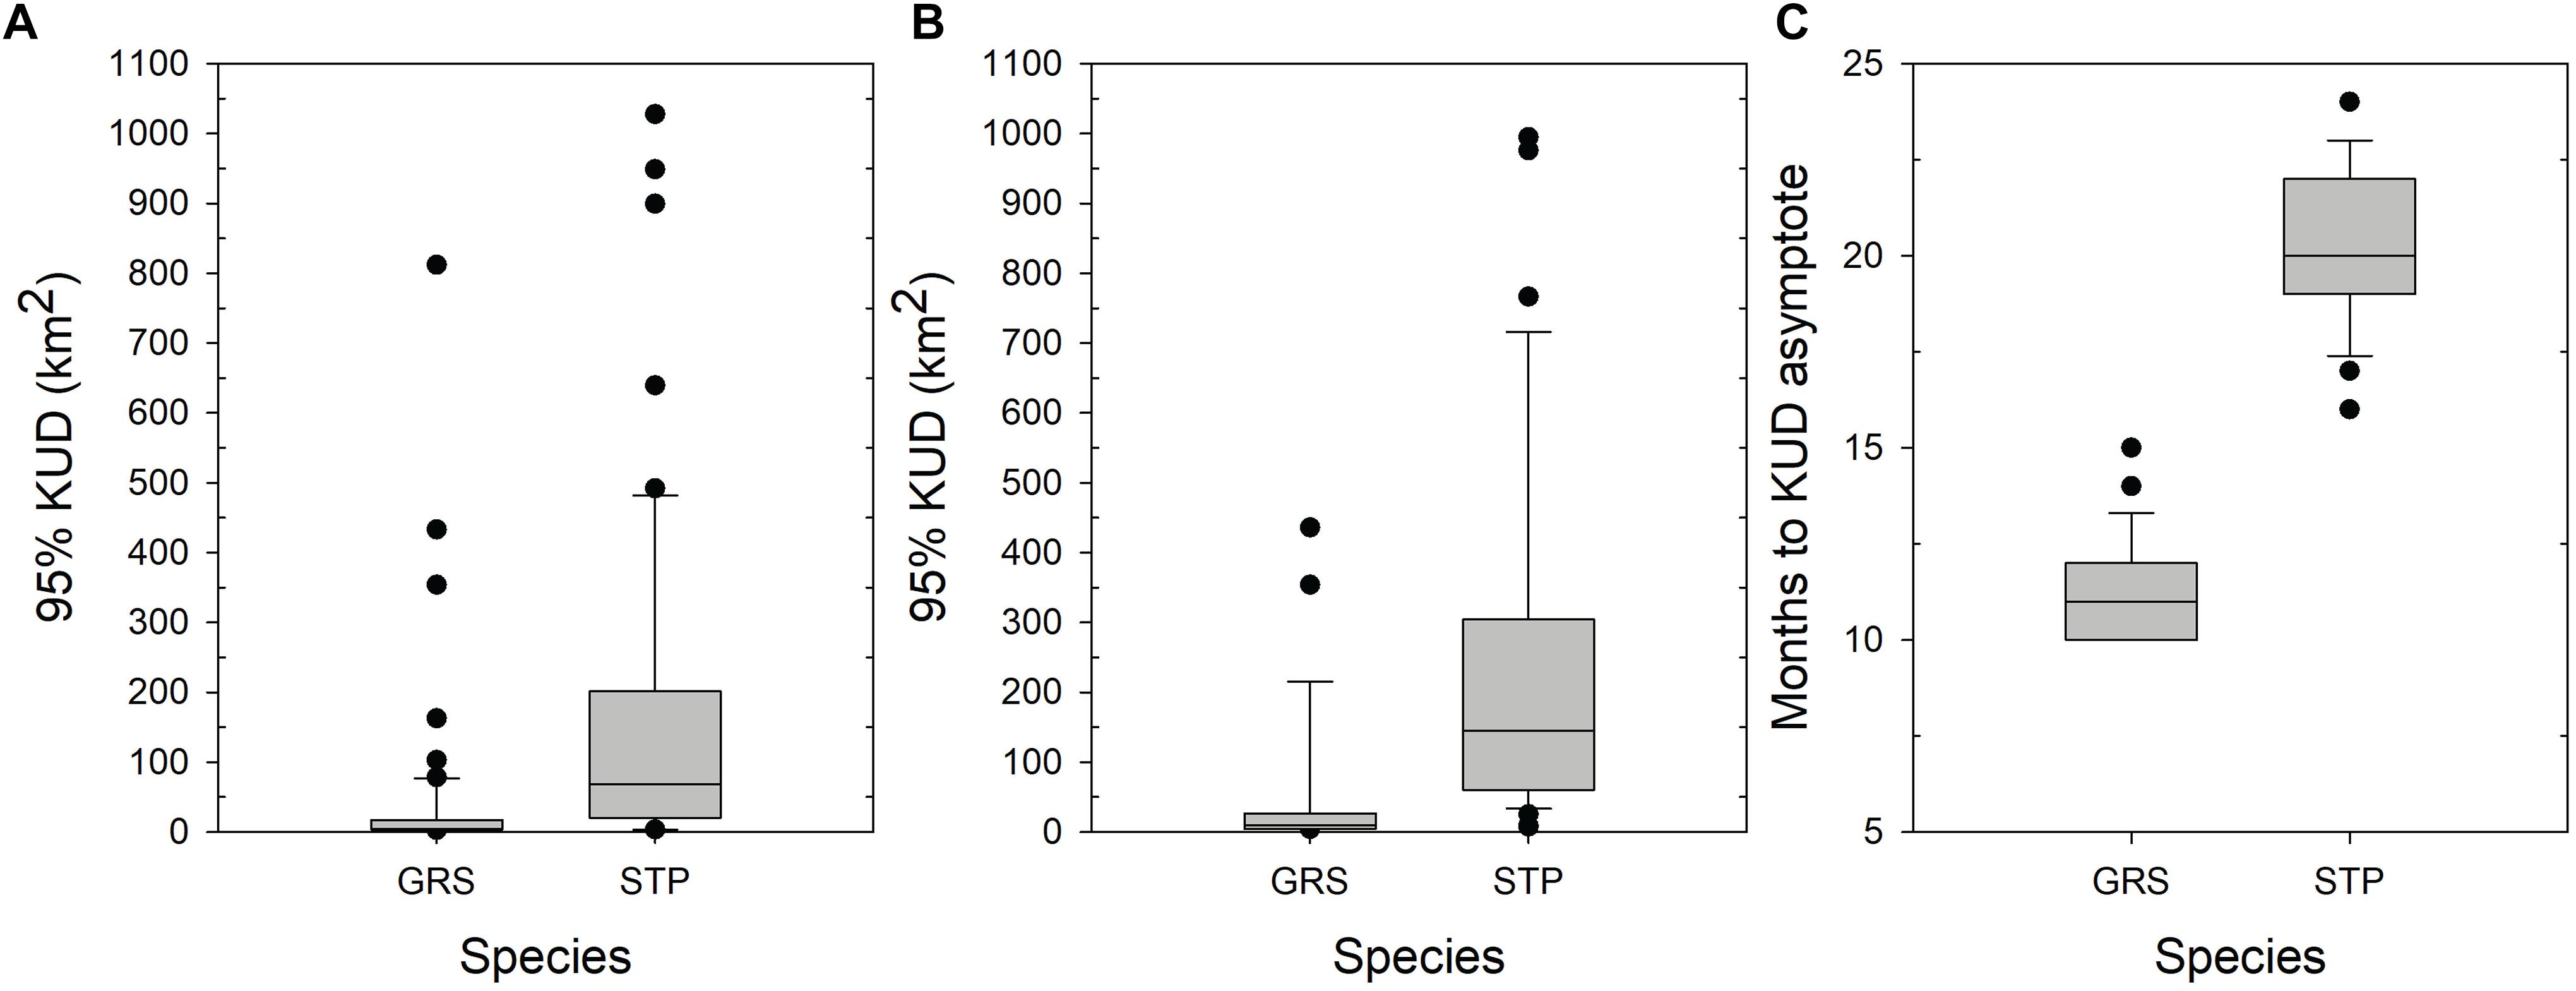
Figure 4. Estimates of space use (95% KUD) from the dynamic Brownian Bridge movement model (dBBMM) applied to acoustically tagged Grey Reef (GRS) and Silvertip Sharks (STP). (A) Total space use of all acoustically tagged sharks based on cumulative monthly estimates of 95% KUD. (B) Total space use of subset of tagged sharks based on non-linear mixed effect models applied to a monthly cumulative estimates of 95% KUD for sharks with monitoring periods >5 months. (C) Estimated number of months to reach an asymptote in monthly cumulative estimates of 95% KUD based on the non-linear mixed effect model.
Based on the duration of the gaps in detection and average swimming speed of both species, 52% of the acoustically tagged Grey Reef Sharks and 78% of the Silvertip Sharks could have left the BIOT MPA during gaps in detection (Supplementary Table S4). Of the sharks that potentially left the MPA, on average they had 2–3 gaps of sufficient duration (>7–8 days) to allow them to have potentially crossed the MPA boundary and returned. This does not indicate that sharks actually left the BIOT MPA, just that they theoretically could have under the least conservative scenario (swimming straight to the MPA boundary).
Array Spacing Simulations
Grey reef and Silvertip Sharks both showed a steep decline in detection probability with distance from their tagging site, with the effect more pronounced for Grey Reef Sharks. The maximum distance recorded in a Grey Reef Shark was 45 km, but over half of the animals were never detected more than 5 km from their tagging site. Silvertips on the other hand roamed further afield, with 70% traveling more than 5 km from their tagging site, visiting an average of 6.5 sites each versus 3.3 for Grey Reefs (t = 3.316, p < 0.001), and moving up to 70 km from their original location (Figure 5). The odds of detecting a Grey Reef Shark 5 km from its tagging site was three times that of detecting it at 10 km. The probability of Silvertip Shark detection declined more slowly with distance, with detection at 5 km only 1.5 times that at 10 km (Figure 5). A binomial generalized linear model (GLM) found a significant interaction between species and tagging-site-to-receiver distance, with the probability of detection remaining consistently higher for Silvertips with increasing distance (Supplementary Table S3). The probability of detecting individuals of both species declined with distance away from the tagging site, but detection probability declined more gradually for Silvertips (Figure 5 and Supplementary Table S3).
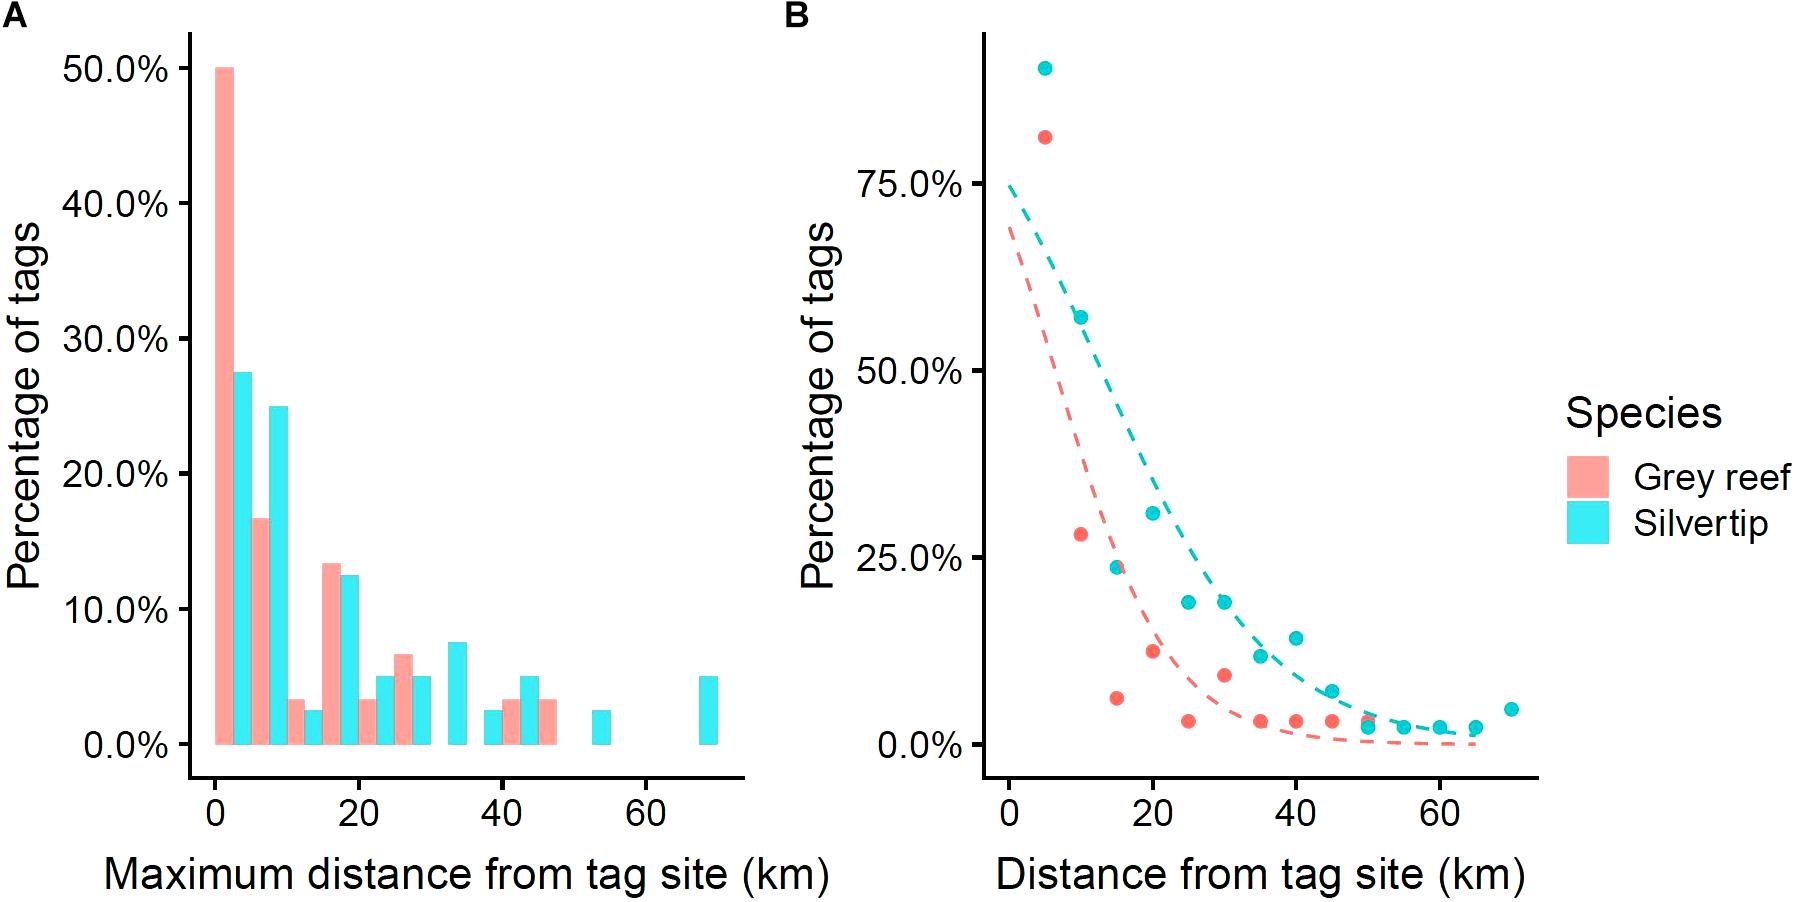
Figure 5. (A) Distribution of tags of each species by maximum distance detected from tagging location. (B) Probability of detecting tags by distance of receiver from initial tagging location, by species. Points are observed values. Dashed lined are predictions from a binomial GLM of detection probability, including an interaction between receiver distance and species.
When we modeled the effect of decreasing array density by subsampling the receiver array based on minimum distance thresholds, the residency index of both species declined with increasing separation of the receivers (Figure 6). Consistent with the species-specific relationships between detection probability and tagging-site-to-receiver distance reported above, Grey Reef Sharks showed a greater sensitivity to array spacing than Silvertips, although observed residency and tag detection declined to similar levels for both once receiver spacing exceeded 10–15 km and this plateau was reached earlier in Grey Reef Sharks than Silvertips.
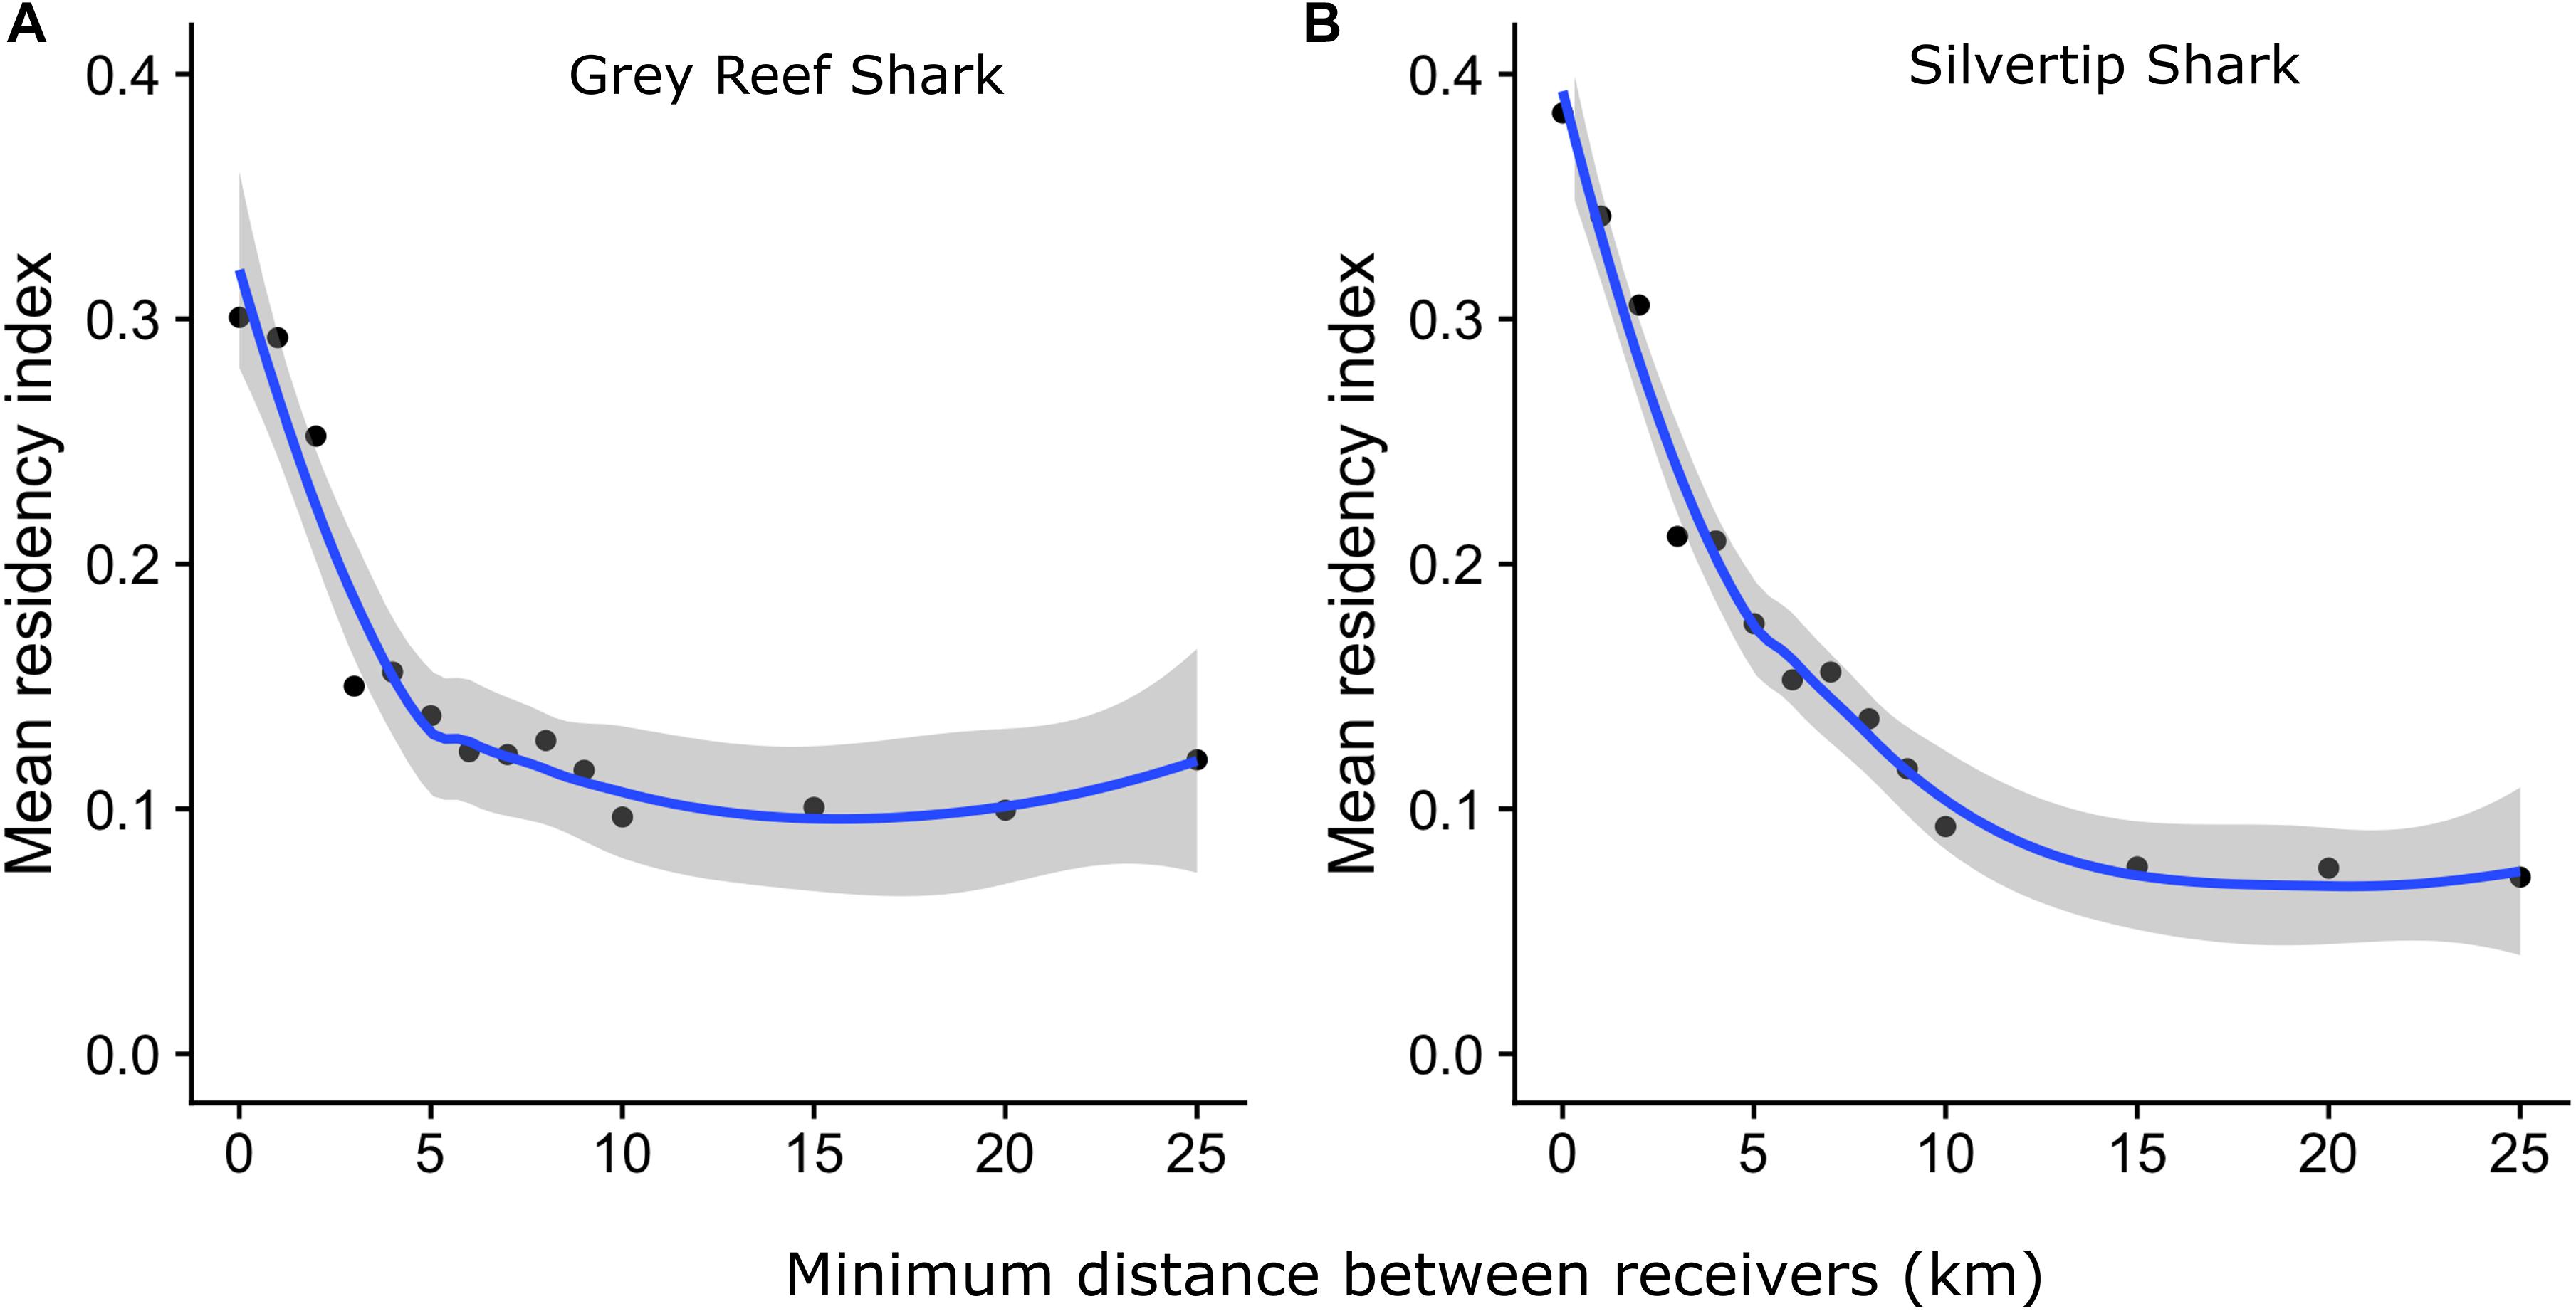
Figure 6. Change (blue line: mean, shaded area: 95% confidence interval) in observed residency index (days detected per days monitored) for (A) Grey Reef Sharks and (B) Silvertip Sharks as minimum distance between receivers is increased.
The mean duration of gaps in detection increased with increasing receiver separation for both species (Figure 7). The mean duration of gaps in detection increased sharply for Grey Reef Sharks as the spacing between receivers increased, plateauing at around 120 h in arrays with 10 km receiver spacing. The mean detection gap for Silvertips increased more slowly and plateaued once receiver spacing exceeded 15 km. Since acoustic telemetry provides presence-only data, such gaps represent blind spots in our monitoring of animals. Dynamic Brownian Bridge Movement Models attempt to fill in these gaps by assuming that animals follow a conditional random walk (a random walk between known starting and ending positions) between subsequent detections. However, the randomness of a movement increases with detection gap length, all other things being equal, as the animal has more time to wander and so certainty over where it might go decreases. We tested the effect of reduced receiver coverage on the activity space estimates generated by a dBBMM, by generating KUD estimates for detections within different sub-arrays for a single shark with high baseline residency and broad use of the receiver network. 95% KUD estimates increased with receiver separation (Figure 8), consistent with the increase in detection gap length (Figure 7) and reduction in number of total detections (Supplementary Figure S3).
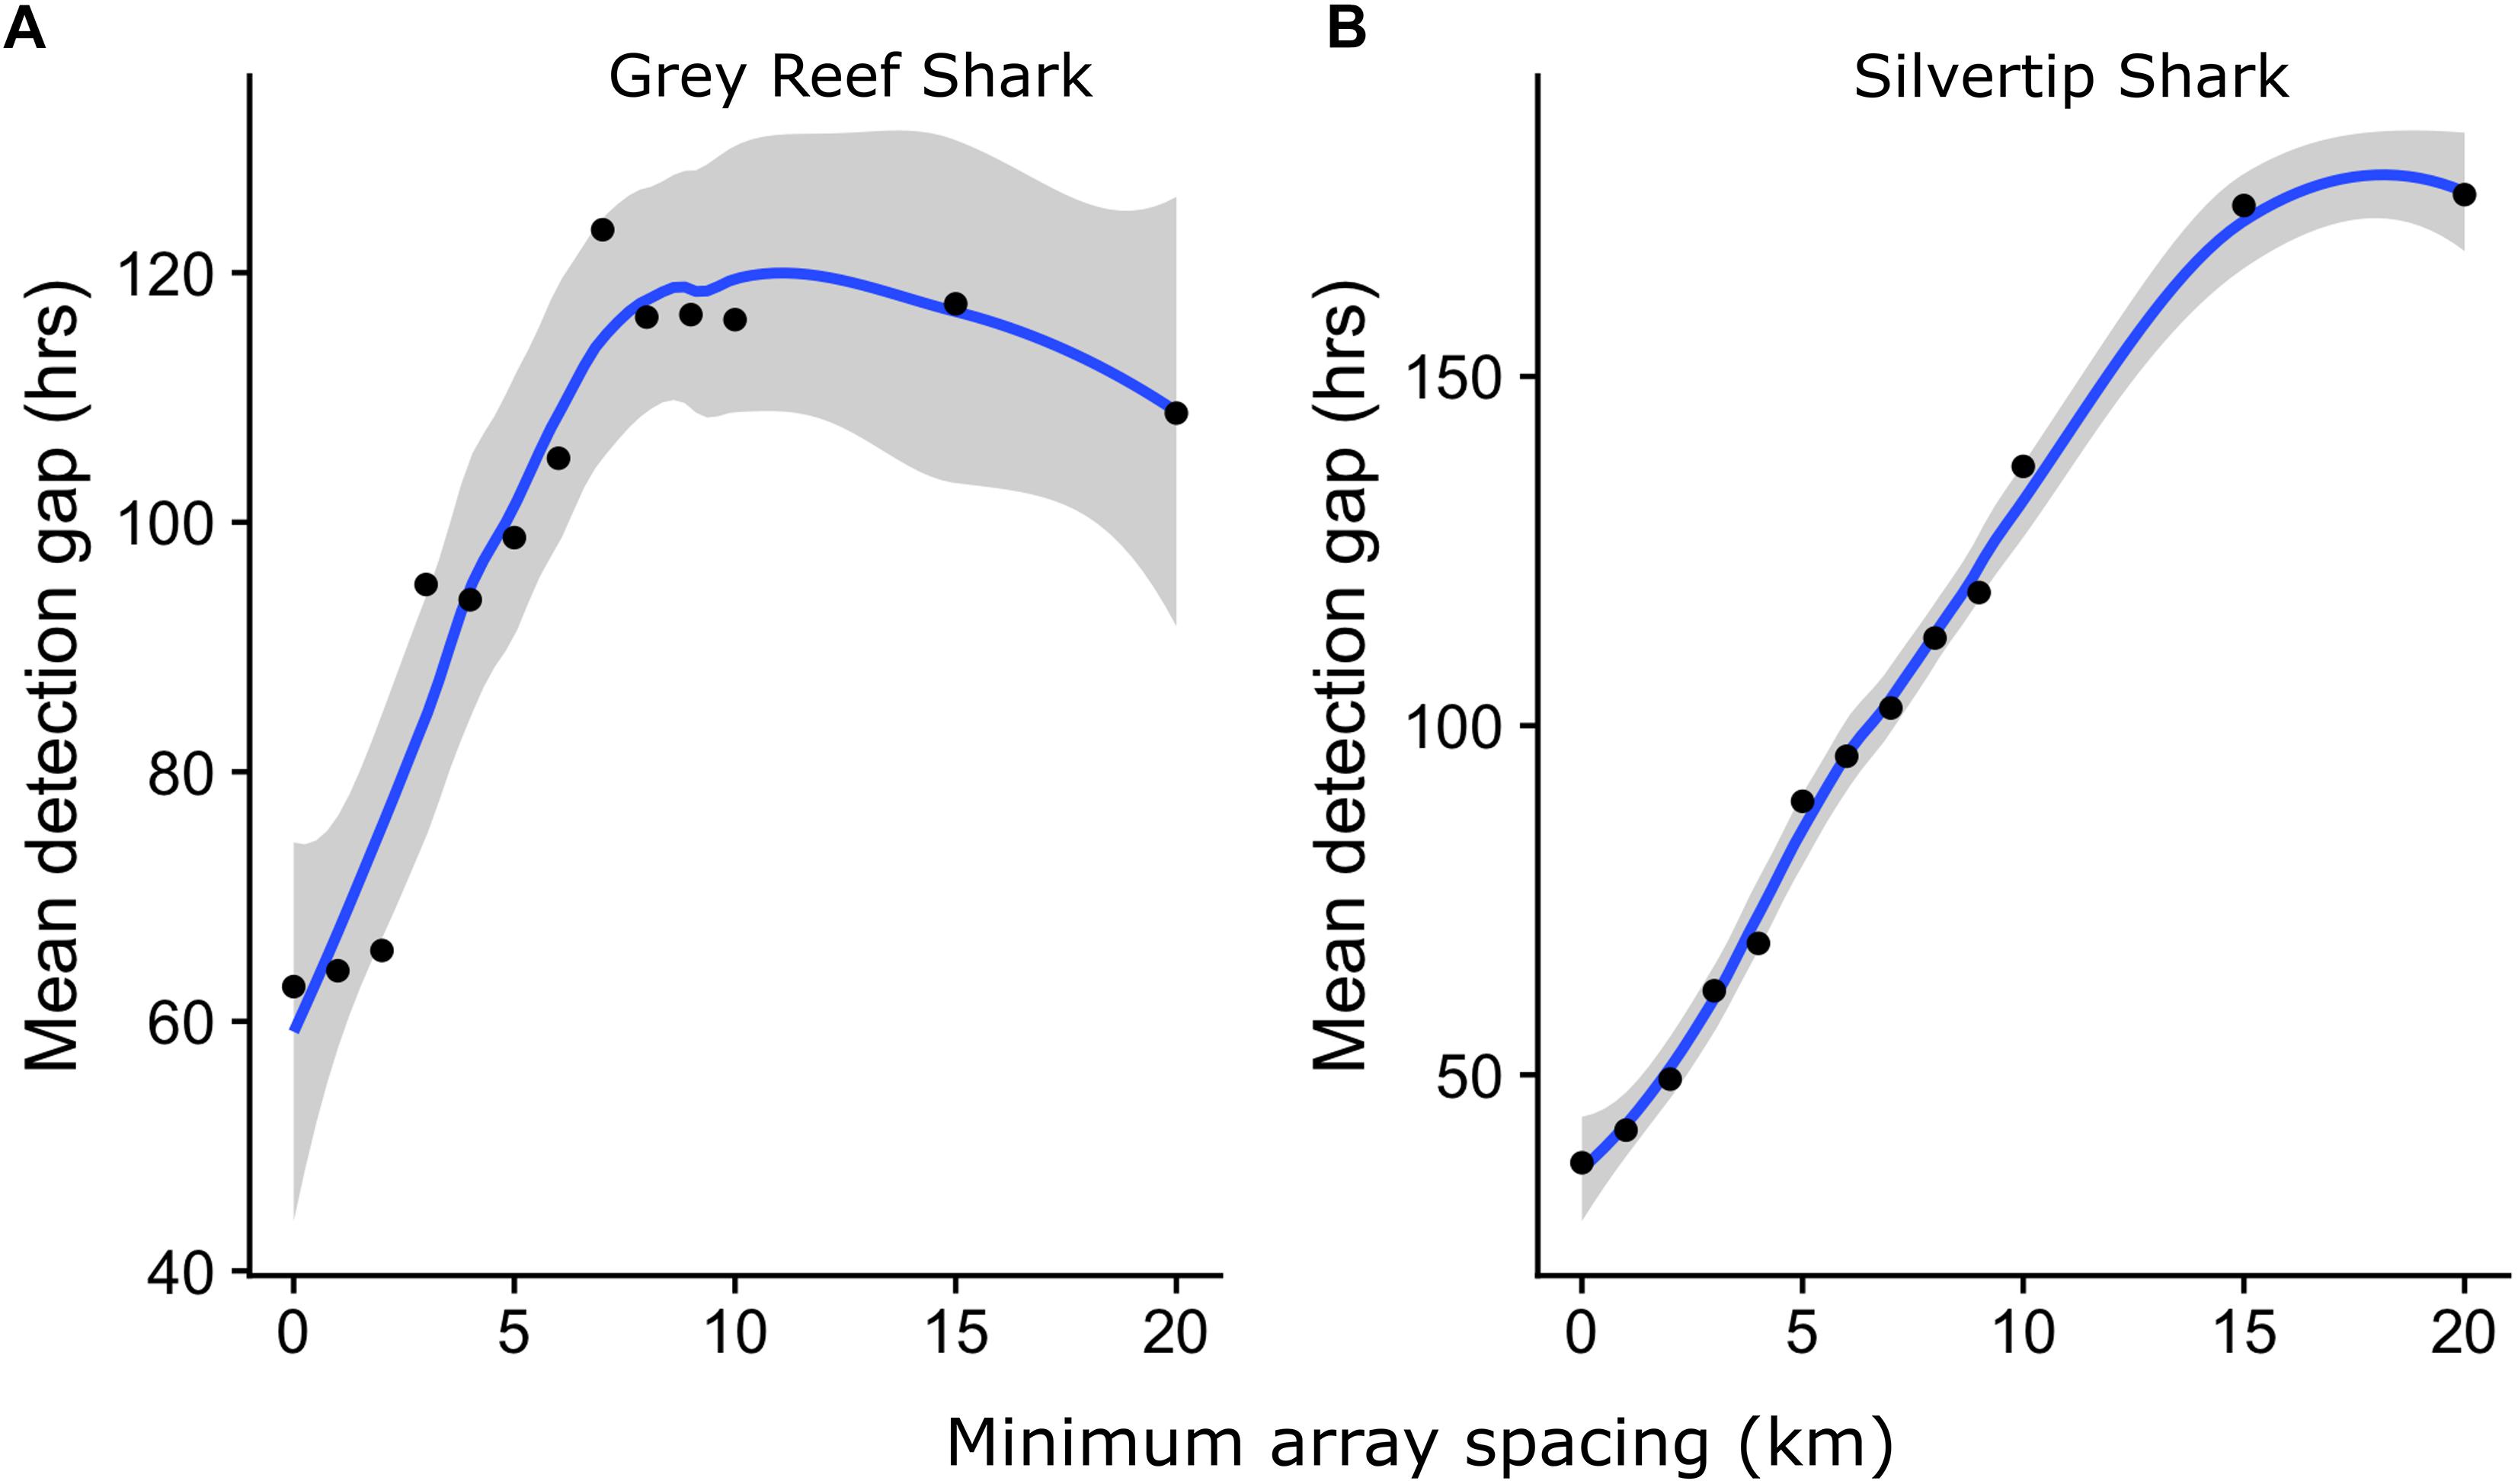
Figure 7. Mean (blue line, shaded area 95% confidence interval) duration of gaps in detection for (A) Grey Reef and (B) Silvertip Sharks, by minimum receiver distance in array.
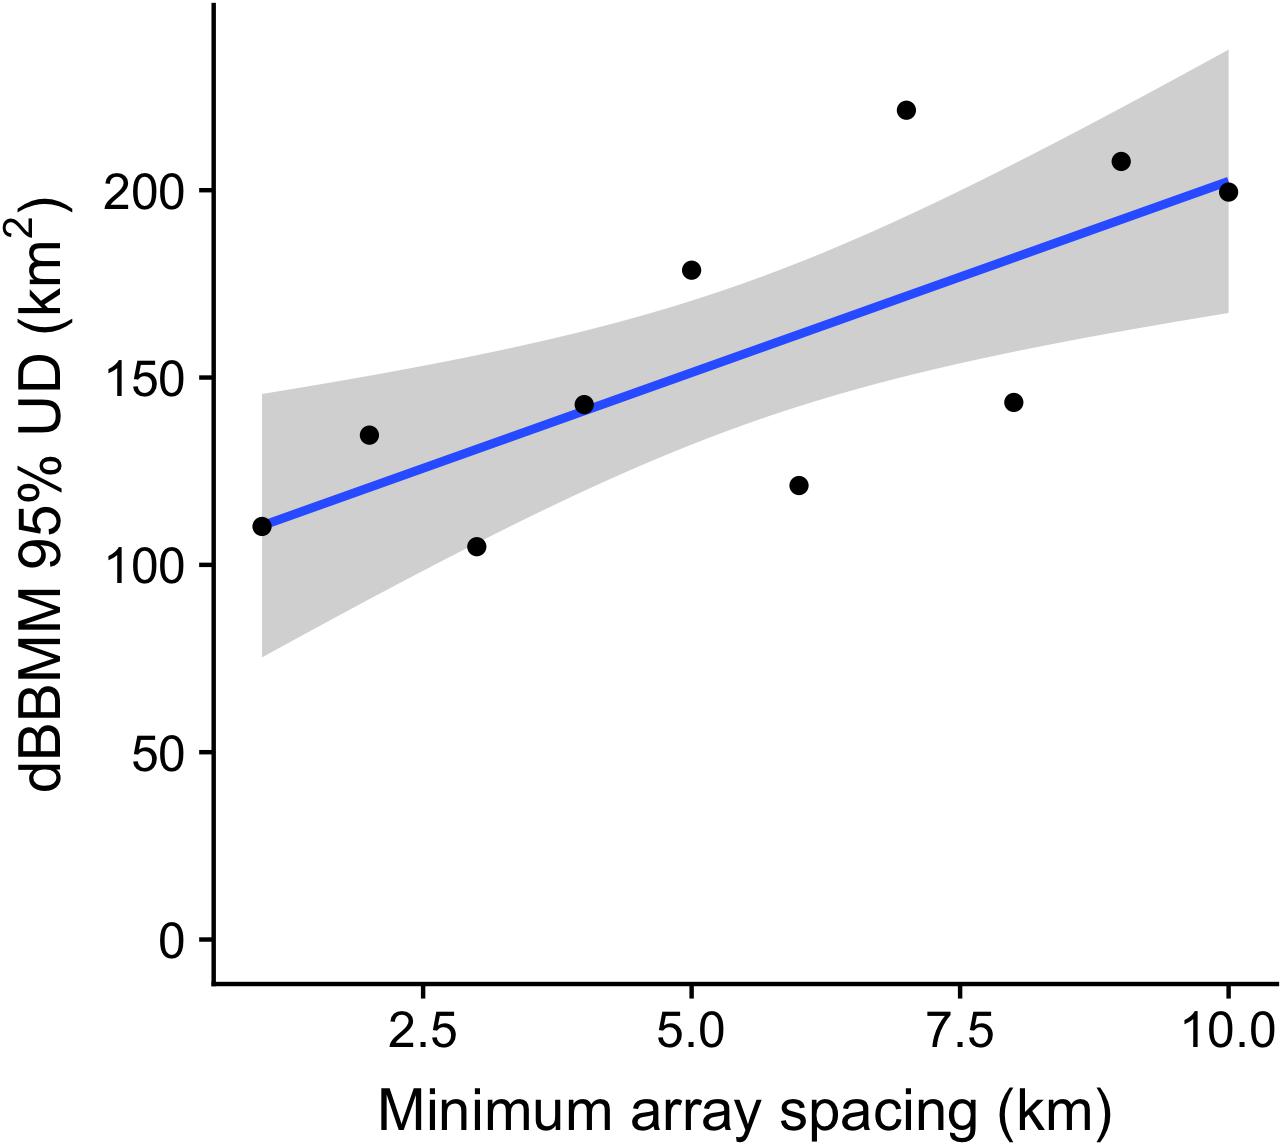
Figure 8. 95% KUD estimates relative to spacing of acoustic receivers in the array based on dBBMM. Model used the data from a single tag, for simulated arrays with minimum receiver spacing varying from 0 to 10 km. 10 random array simulations were used to generate mean values at each density value. Black line and gray band shows mean and 95% confidence interval, respectively, of the log-linear relationship between dBBMM estimates and array density (R2 = 0.54, p = 0.016).
Finally, we looked at the role of receiver coverage, relative to tagging location, in influencing KUD estimates derived by dBBMM. KUD estimates for a subset of Silvertip Sharks increased as receivers were added to the area around their tagging site, up to a distance of approximately 30 km whereupon data from additional receivers made little difference to KUD estimates (Figure 9). This is consistent with the overall pattern of Silvertip Sharks which showed that the majority of animals were only ever detected within 30 km of their tagging site (Figure 4A).
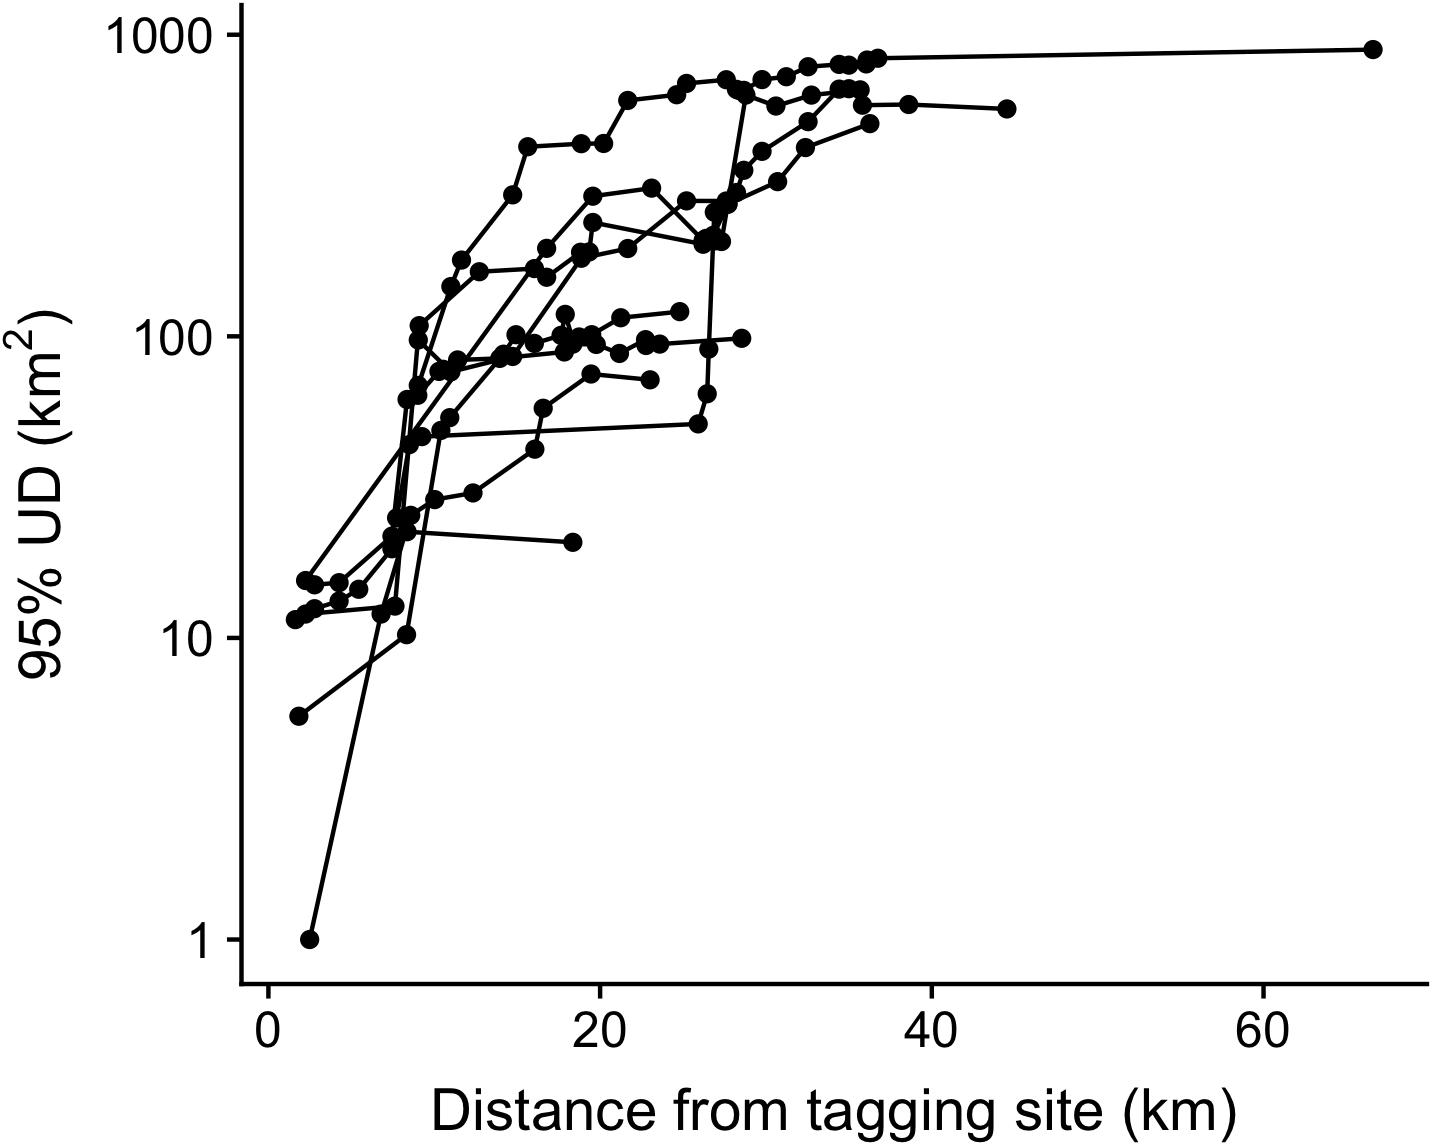
Figure 9. Cumulative 95% KUDs of nine Silvertip Sharks, relative to distance from tagging site based on dBBMM. Sequentially adding data from receivers in order of their distance from a shark’s tagging location.
Discussion
Electronic tagging of pelagic and reef species in the BIOT MPA suggests that the MPA is large enough to provide significant spatial protection to marine species with diverse spatial ecologies, and that even some highly mobile pelagic species may spend extended periods within its borders. This result was consistent across all approaches, and did not change even when incorporating the error associated with different tag technologies. Hence, with effective enforcement, MPAs on the scale of the BIOT MPA potentially offer considerable protection to a range of pelagic and reef species. However, intraspecific variability in movement dynamics suggests that, in particular for pelagic species, only a portion of a given population may be sufficiently resident within an MPA to benefit from protection, with the most mobile individuals, or life history stages, remaining vulnerable to fishing outside of the MPA boundaries, regardless of the size of the MPA. However, our ability to fully characterize the full space use of animals in the BIOT MPA is hindered by limitations that are typical of electronic tagging studies, including low sample size, limited deployment duration, acoustic receiver coverage, and a limited ability to tag both sexes across ontogenetic stages and seasons.
While sample size and deployment duration were limited for all pelagic animals in this remote archipelago, tagging data provided evidence that even some highly mobile pelagic species may derive some protection from the BIOT MPA. A Silky Shark was the only animal observed outside the boundaries of the BIOT MPA, even accounting for significant error in estimated positions, and the areas used by all other tagged pelagic animals, based on all metrics, were much smaller than the size the BIOT MPA. Some pelagic species spent extended periods of time within the BIOT MPA as well. For example, Sailfish spent the duration of their tag deployments within the BIOT MPA (up to 180 days), consistent with other studies showing that they are more abundant around islands, reefs, and other neritic habitats, relative to other pelagic species (Nakamura, 1985). This suggests a higher degree of residency around neritic habitats, and that this species should be more amenable to protection by large MPAs that enclose such features.
Satellite tagging demonstrated that MPAs on the scale of the BIOT MPA are large enough to provide protection to mobile reef species (Silvertips and Reef Mantas). All tagged Silvertips and Reef Mantas spent the duration of their satellite tag deployments within the boundary of the BIOT MPA, had high residency estimates for areas much smaller than the MPA, and had activity spaces smaller than pelagic species and much smaller than the area of the BIOT MPA. While a pelagic Silky Shark was observed leaving the MPA, a Reef Manta was the only satellite-tagged reef-associated species to exhibit a potential pelagic excursion away from the archipelago. It is unclear whether or not this apparent movement was a result of SSM error, however, the estimated location error (∼60 km) during the offshore movement was less than the minimum distance to land at its furthest point (∼100 km), suggesting the offshore movement was real. However, the manta returned to the tagging location (Egmont Atoll) prior to the tag popping up, suggesting that if it did move offshore then it had some degree of fidelity to that site.
Intraspecific Variability in Space Use
Our results demonstrate that intraspecific variability in spatial ecology can impact the ability of MPAs to protect both pelagic and reef species. While there are populations or sub-populations of teleosts and elasmobranchs that show high fidelity to oceanic archipelagos, particularly isolated ones such as the BIOT MPA (Cowen et al., 2000; Planes et al., 2009), even reef-associated species such as reef sharks often display some degree of large scale dispersal or movements (Whitney et al., 2012; Chin et al., 2013; White et al., 2017). These large scale movements outside the MPA’s boundary can expose them to fishing, which often is focused around MPA boundaries to take advantage of ‘spillover’ effects (Kellner et al., 2007; Boerder et al., 2017). Both satellite and acoustic tags demonstrated that intraspecific variability in space use will affect the ability of large MPAs, like the BIOT MPA, to protect all individuals of a species. For example, the two Silky Sharks tagged in this study displayed completely different patterns of residency within the MPA, despite being a similar size (∼2 m): one spent the entire 270-day deployment within the BIOT MPA, while the other one was the only tagged animal to be observed leaving the MPA (Figures 2, 3). Even amongst reef-associated species, individual activity spaces could vary by orders of magnitude. The high degree of intraspecific variability in activity space for Silvertip Sharks based on acoustic and satellite tag data suggests vulnerability to fishing outside MPAs, especially for MPAs of smaller scale, may vary significantly within a population. Reef Mantas, due to their smaller activity spaces and lower intra-specific variability (Table 1), may be more amenable to protection at smaller spatial scales compared to Silvertip Sharks.
Importance of Study Duration
For reef-associated species, or pelagic species that exhibit some degree of association with atolls, reefs, or other bathymetric features, acoustic tags and arrays can provide insight into their space use. One major benefit of acoustic tags is that tag batteries can last >10 years, meaning that data from monitored animals can provide insight into changes in activity space across years and ontogenetic stages. This approach would offer a more complete understanding of the activity space of these species, as well as provide the opportunity to estimate their full activity space, or home range. Using cumulative dBBMM KUDs we were able to show that estimates of activity space are sensitive to study duration, and that the time required for space use estimates to reach an asymptote is species dependent, and variable across individuals. Grey Reef Sharks required at least 11 months of acoustic monitoring before KUD estimates approached an asymptote. For Silvertips this period was 20 months, reflecting their higher mobility and lower residency to individual reefs. However, the sample size, skewed sex ratio for Grey Reef Sharks, skewed size distribution in Silvertip Sharks, and current study duration limited our ability to evaluate longer term changes related to ontogeny and sex. Continued monitoring should start to reveal ontogenetic changes in activity space, and begin to outline the actual full home range of individual animals, loosely defined as “the area traversed by the individual in its normal activities of food gathering, mating and caring for young” (Burt, 1943). These results show the necessity of maintaining acoustic monitoring infrastructure over extended periods if reliable estimate of species’ activity spaces are to be achieved.
Effect of Array Design
To provide insight into how receiver spacing influences the ability of our acoustic receiver array to characterize the space use of species with different spatial ecologies, we modeled the hypothetical impact of different array designs by varying the minimum distance between receiver elements in subsets of the real array, treating our actual array and full dataset as the baseline. Movement and residency metrics calculated on the resulting detection data subsets from arrays of different receiver densities were compared with baseline results, by species, and showed clear inter-specific differences in the impact of array design choices, which were related to differences in species spatial ecology. Consistent with the activity space analysis discussed above, Grey Reef Sharks generally showed higher site fidelity and dispersed shorter distances from their tagging sites, with over half the individuals never detected more than 5 km from their original location. While these limited movements are consistent with prior studies of Grey Reef Sharks (Bond et al., 2012; Vianna et al., 2013; Espinoza et al., 2015), our study was biased toward females, which have been reported to exhibit a higher degree of site fidelity than males (Espinoza et al., 2015), suggesting that we may be underestimating space use for the Grey Reef Shark population in the BIOT MPA. Silvertips were further ranging, with 70% traveling more than 5 km from their tagging site and sharks being detected up to 70 km from their original tagging location.
Residency indices were sensitive to reductions in array density (increased spacing between receivers). Residency indices declined to 30% of baseline values once spacing exceeded 5 km for Grey Reef Sharks and 10 km for Silvertips, suggesting that residency estimates for both species are biased downward in sparse receiver arrays. The shape of the curves suggests that our baseline metrics, and acoustic receiver array, may also underestimate true residency since both increase sharply as receiver spacing is reduced and reached a maximum of between 0.3 and 0.4 for both species.
The length of gaps between detections also increases with the distance between receivers, an intuitive finding that has the potential to bias space estimates obtained using Brownian Bridge based methods that seek to overcome the “presence only” nature of acoustic telemetry data. This is potentially important, for during extended gaps with no detection, we are unable to evaluate whether an animal could have left the MPA boundaries or was simply outside the detection range of the receivers. However, our results suggest that overall our tagged animals had relatively few gaps long enough (>7–8 days) for them to leave the MPA under the least conservative scenarios (straight line movement to MPA boundaries and back). Importantly, satellite tag data indicated that no Silvertips left the MPA, so extended gaps in the acoustic detection record for this species (and Grey Reef Sharks as well) likely do not indicate that sharks left the MPA. Thus, the MPA can potentially provide significant conservation value for mobile reef and pelagic fishes. However, the efficacy of any MPA is also largely dependent on effective enforcement (Edgar et al., 2014). In the case of the BIOT MPA, IUU (Ferretti et al., 2018; Tickler et al., 2019) and drifting fish aggregation devices (dFADs) (Davies et al., 2017) still pose significant management concerns within the MPA boundary.
Using dBBMM to estimate space use for a single Silvertip Shark, which exhibited a high degree of residency to the array but which moved widely within the array, we found that 95% KUD estimates increased as array spacing was reduced, with estimates showing a high degree of variability between different receiver sub-arrays. Furthermore, using data from a subset of Silvertips, we demonstrate that increasing the size of the array in terms of distance from tagging location increases 95% KUD dBBMM estimates. However, we found that extending the array to distances beyond ∼30 km from tagging location did not have a large effect on 95% KUD estimates for Silvertip Sharks. dBBMMs using acoustic telemetry data appear highly sensitive to the size, location and number of elements in the array generating the detection data, and extended and irregular gaps in detections. Hence, any inferences about space use will likely be heavily biased by the interaction between the tagging location and home range of an individual sharks and the size and density of the array. This calls into question the reliability of these techniques for estimating home range from aquatic acoustic data sets that are inherently irregular in periodicity, as opposed to the terrestrial tracking data for which they were developed (Horne et al., 2007). However, our results do indicate that relative differences between species, within a given array, can be detected. This is useful information for management, even if the absolute values of the home range estimates are likely a consequence, in part, of how the model data were collected.
Consistent with previous studies (Bond et al., 2012; Vianna et al., 2013; Espinoza et al., 2015), the movements of individual Grey Reef Sharks are much more restricted than Silvertips, hence a denser, smaller array (maximum receiver spacing 1–5 km) will provide better estimates of space use for Grey Reef Sharks than for Silvertips, which require a larger array (maximum spacing 1–10 km) to capture their wider ranging movements. Hence, in areas with similar habitat types as this study (series of coral reef atolls and submerged shoals in relatively close proximity), having smaller, more dense receiver arrays will provide more robust estimates of space use than would ones that are less dense but geographically more expansive. Furthermore, tagging should occur near the center of the receiver array in order to optimize the efficiency of the receiver array. We suggest that tagging locations be identified prior to deployment of the array if working in larger scale atolls or reef systems or if that is not possible to attempt to tag within the center of the array. Based on our data, an array that extends further than 20 km or 30 km from the tagging location will provide little added value for Silvertips and Grey Reef Sharks, respectively, though how applicable this result is to these species in other parts of their distribution remains to be tested.
Overall, our array modeling exercise demonstrates how array design can affect common estimates of space use derived from acoustic receiver data and how this sensitivity will be driven by the underlying spatial ecology of the study species. In most acoustic tagging studies, data are analyzed and interpreted without directly assessing how the array design may be influencing the results. Our results suggest that sensitivity analyses, similar to what we have done, should be conducted to understand how array design may be influencing the results and interpretations. These types of analyses can provide valuable insight into what the data are and are not able to reliably tell you, and can provide useful insight into the spatial ecology of the species as well.
Other Methodological Considerations
Electronic tagging remains one of the best ways to understand the spatial ecology of mobile marine fishes, however, there are important limitations to this approach. Due to logistical challenges, expense of tags, and battery and tag retention limitations, it can be challenging to use electronic tags to fully characterize the space use of mobile marine taxa. Tags are generally applied to animals that can be caught and tagged, which often leads to particular size classes and ontogenetic stages being studied (Hazen et al., 2012). In order to fully characterize the home range of a species and understand the ability of MPAs to provide protection to a given population, the space use of animals of all life history stages needs to be characterized and understood. Ontogenetic shifts in habitat are ubiquitous in the natural world, including in teleosts and chondrichthyan fishes (Grubbs, 2010). As a result, the habitats used and space required by juveniles will be very different than that of adults, affecting their vulnerability to different stressors (e.g., fishing pressure). Tagging can also be limited to times or seasons when animals are available for study, or by whether field work can occur, leading to seasonal bias in tagging, which will affect our understanding of species movement dynamics and vulnerability to different sources of mortality.
Even if the full activity space of a species has been characterized, this information may not capture the full ecological requirements of a species within an MPA. Stable isotope analysis suggests that Grey Reef Sharks at Palmyra Atoll in the Pacific may receive a substantial trophic subsidy from offshore pelagic ecosystems outside of the MPA, whether through movements of the sharks or their prey (McCauley et al., 2012b; White et al., 2017). Seabirds return to colonies on islands and atolls and fertilize local ecosystems with resources from distant pelagic habitats (McCauley et al., 2012a). Other isolated oceanic habitats, such as seamounts, also may require trophic subsidies to support populations of large, upper trophic level predators (Koslow, 1997). Hence, factors from outside the boundary of an MPA can still affect the ecosystem function and ecology of species within an MPA through cross-system trophic linkages and subsidies (Curnick et al., 2019). Hence, these potential linkages need to be characterized and understood to understand how an MPA, and the species it supports, fits into the broader regional and oceanic context.
Logistical and financial challenges associated with electronic tagging in a remote location, tag attachment, and the difficulty of finding and tagging species on short expeditions make it difficult to fully characterize seasonal, interannual, or longer term (decadal or ontogenetic) changes in animal behaviors. Hence to fully characterize the space use of these animals, and to understand how effective MPAs of various sizes will be at protecting them across their full life history, there must be significant investment in long term studies that are able to capture the full temporal and spatial dynamics of monitored populations. This is important as fully characterizing the spatial ecology of marine species, and understanding its variability, is a prerequisite for designing effective MPAs able to protect animal populations occurring within their boundaries. Yet MPAs are often designed and implemented without having access to or considering this type of information. However, by fully characterizing the spatial ecology of marine species, and understanding its variability, it should be possible to design MPAs that confer protection on a meaningful proportion of the population, thus achieving the desired conservation outcomes. This suggests that, if properly enforced, the expansion of very large oceanic MPAs that has occurred over the last decade should provide effective protection to local populations of mobile reef-associated species as well as several pelagic species that exhibit the necessary degree of site fidelity. However, our results demonstrate that to develop effective science-based conservation and management strategies that account for the spatial ecology of a mobile marine species requires sustained investment in research that uses technologies and study designs that are able to fully account for the intraspecific diversity in movement patterns across sexes and ontogeny.
Data Availability
The datasets generated for this study are available on request to the corresponding author.
Ethics Statement
All procedures were approved by the Stanford University Administrative Panel on Laboratory Animal Care (APLAC) under permit APLAC-10765.
Author Contributions
AC, DT, JD, FF, DC, TC, RS, MC, and BB contributed to the design and implementation of the research. AC, DT, JD, and FF collected, processed, and analyzed the data and wrote the manuscript. DC, TC, RS, MC, and BB collected data and helped to writing the manuscript.
Funding
Funding for this project was provided by the Bertarelli Foundation and contributed to the Bertarelli Programme in Marine Science.
Conflict of Interest Statement
The authors declare that the research was conducted in the absence of any commercial or financial relationships that could be construed as a potential conflict of interest.
Acknowledgments
We would like to thank the United Kingdom Foreign and Commonwealth Office and the British Indian Ocean Territory Administration for granting us permission to undertake the research.
Supplementary Material
The Supplementary Material for this article can be found online at: https://www.frontiersin.org/articles/10.3389/fmars.2019.00256/full#supplementary-material
Footnotes
References
Acolas, M., Le Pichon, C., and Rochard, E. (2017). Spring habitat use by stocked one year old European sturgeon Acipenser sturio in the freshwater-oligohaline area of the Gironde estuary. Estuar. Coastal Shelf Sci. 196, 58–69. doi: 10.1016/j.ecss.2017.06.029
Arnold, G., and Dewar, H. (2001). “Electronic tags in marine fisheries research: a 30-year perspective,” in Electronic Tagging and Tracking in Marine Fisheries, eds J. Sibert and J. L. Nielsen (Dordrecht: Kluwer Academic Publishers), 7–64. doi: 10.1007/978-94-017-1402-0_2
Barraquand, F., and Benhamou, S. (2008). Animal movements in heterogeneous landscapes: identifying profitable places and homogeneous movement bouts. Ecology 89, 3336–3348. doi: 10.1890/08-0162.1
Becker, S. L., Finn, J. T., Danylchuk, A. J., Pollock, C. G., Hillis-Starr, Z., Lundgren, I., et al. (2016). Influence of detection history and analytic tools on quantifying spatial ecology of a predatory fish in a marine protected area. Mar. Ecol. Prog. Ser. 562, 147–161. doi: 10.3354/meps11962
Beyer, H. L. (2012). Geospatial Modelling Environment (Version 0.7.3.0) (Software). Available at: http://www.spatialecology.com/gme (accessed February 4, 2014).
Block, B. A., Jonsen, I. D., Jorgensen, S. J., Winship, A. J., Shaffer, S. A., Bograd, S. J., et al. (2011). Tracking apex marine predator movements in a dynamic ocean. Nature 475, 86–90. doi: 10.1038/nature10082
Boerder, K., Bryndum-Buchholz, A., and Worm, B. (2017). Interactions of tuna fisheries with the Galápagos marine reserve. Mar. Ecol. Prog. Ser. 585, 1–15. doi: 10.3354/meps12399
Bond, M. E., Babcock, E. A., Pikitch, E. K., Abercrombie, D. L., Lamb, N. F., and Chapman, D. D. (2012). Reef sharks exhibit site-fidelity and higher relative abundance in marine reserves on the Mesoamerican Barrier Reef. PLoS One 7:e32983. doi: 10.1371/journal.pone.0032983
Burt, W. H. (1943). Territoriality and home range concepts as applied to mammals. J. Mammal. 24, 346–352.
Calenge, C. (2006). The package “adehabitat” for the R software: a tool for the analysis of space and habitat use by animals. Ecol. Modell. 197, 516–519. doi: 10.1016/j.ecolmodel.2006.03.017
Carlisle, A. B., Goldman, K. J., Litvin, S. Y., Madigan, D. J., Bigman, J. S., Swithenbank, A. M., et al. (2015). Stable isotope analysis of vertebrae reveals ontogenetic changes in habitat in an endothermic pelagic shark. Proc. R. Soc. B Biol. Sci. 282:20141446. doi: 10.1098/rspb.2014.1446
Carlisle, A. B., Perle, C. R., Goldman, K. J., and Block, B. A. (2011). Seasonal changes in depth distribution of salmon sharks (Lamna ditropis) in Alaskan waters: implications for foraging ecology. Can. J. Fish. Aquat. Sci. 68, 1905–1921. doi: 10.1139/f2011-105
Chin, A., Heupel, M., Simpfendorfer, C., and Tobin, A. (2013). Ontogenetic movements of juvenile blacktip reef sharks: evidence of dispersal and connectivity between coastal habitats and coral reefs. Aquat. Conserv. Mar. Freshw. Ecosyst. 23, 468–474. doi: 10.1002/aqc.2349
Clements, S., Jepsen, D., Karnowski, M., and Schreck, C. B. (2005). Optimization of an acoustic telemetry array for detecting transmitter-implanted fish. N. Am. J. Fish. Manage. 25, 429–436. doi: 10.1577/m03-224.1
Cowen, R. K., Lwiza, K. M., Sponaugle, S., Paris, C. B., and Olson, D. B. (2000). Connectivity of marine populations: open or closed? Science 287, 857–859. doi: 10.1126/science.287.5454.857
Curnick, D. J., Carlisle, A. B., Gollock, M., Schallert, R. J., and Hussey, N. E. (2019). Evidence for dynamic resource partitioning between two sympatric reef shark species within the British Indian Ocean Territory. J. Fish Biol. 94, 680–685. doi: 10.1111/jfb.13938
Dahlgren, C. P., and Eggleston, D. B. (2000). Ecological processes underlying ontogenetic habitat shifts in a coral reef fish. Ecology 81, 2227–2240. doi: 10.1890/0012-9658(2000)081
Davies, T. K., Curnick, D. J., Barde, J., and Chassot, E. (2017). “Potential environmental impacts caused by beaching of drifting Fish Aggregating Devices and identification of management solutions and uncertainties,” in Proceedings of the Conference: First IOTC ad hoc Working Group on FADs, Madrid.
Drymon, J. M., and Wells, R. D. (2017). Double tagging clarifies post-release fate of great hammerheads (Sphyrna mokarran). Anim. Biotelem. 5:28.
Edgar, G. J., Stuart-Smith, R. D., Willis, T. J., Kininmonth, S., Baker, S. C., Banks, S., et al. (2014). Global conservation outcomes depend on marine protected areas with five key features. Nature 506:216. doi: 10.1038/nature13022
Espinoza, M., Heupel, M. R., Tobin, A. J., and Simpfendorfer, C. A. (2015). Residency patterns and movements of grey reef sharks (Carcharhinus amblyrhynchos) in semi-isolated coral reef habitats. Mar. Biol. 162, 343–358. doi: 10.1007/s00227-014-2572-x
Ferreira, L. C., Thums, M., Meeuwig, J. J., Vianna, G. M. S., Stevens, J., McAuley, R., et al. (2015). Crossing latitudes-long-distance tracking of an apex predator. PLoS One 10:e0116916. doi: 10.1371/journal.pone.0116916
Ferretti, F., Curnick, D. J., Liu, K., Romanov, E., and Block, B. (2018). Shark baselines and the conservation role of remote coral reef ecosystems. Sci. Adv. 4:eaaq0333. doi: 10.1126/sciadv.aaq0333
Graham, N. A., and McClanahan, T. R. (2013). The last call for marine wilderness? Bioscience 63, 397–402. doi: 10.1525/bio.2013.63.5.13
Graham, N. A., Pratchett, M. S., McClanahan, T. R., and Wilson, S. K. (2013). “The status of coral reef fish assemblages in the Chagos Archipelago, with implications for protected area management and climate change,” in Coral Reefs of the United Kingdom Overseas Territories, ed. C. Sheppard (Berlin: Springer), 253–270.
Graham, N. A., Spalding, M. D., and Sheppard, C. R. (2010). Reef shark declines in remote atolls highlight the need for multi-faceted conservation action. Aquat. Conserv. Mar. Freshw. Ecosyst. 20, 543–548. doi: 10.1002/aqc.1116
Grubbs, R. D. (2010). “Ontogenetic shifts in movements and habitat use,” in Sharks and Their Relatives II: Biodiversity, Physiology, and Conservation, eds J. C. Carrier, J. A. Musick, and M. R. Heithaus (Boca Raton, FL: CRC Press), 319–350. doi: 10.1201/9781420080483-c7
Hays, G. C., Bailey, H., Bograd, S. J., Bowen, W. D., Campagna, C., Carmichael, R. H., et al. (2019). Translating marine animal tracking data into conservation policy and management. Trends Ecol. Evol. 34, 459–473. doi: 10.1016/j.tree.2019.01.009
Hazen, E. L., Maxwell, S. M., Bailey, H., Bograd, S. J., Hamman, M., Gaspar, P., et al. (2012). Ontogeny in marine tagging and tracking science: technologies and data gaps. Mar. Ecol. Prog. Ser. 457, 221–240. doi: 10.3354/meps09857
Heupel, M. R., Semmens, J. M., and Hobday, A. J. (2006). Automated acoustic tracking of aquatic animals: scales, design and deployment of listening station arrays. Mar. Freshw. Res. 57, 1–13.
Horne, J. S., Garton, E. O., Krone, S. M., and Lewis, J. S. (2007). Analyzing animal movements using Brownian bridges. Ecology 88, 2354–2363. doi: 10.1890/06-0957.1
Hussey, N. E., Kessel, S. T., Aarestrup, K., Cooke, S. J., Cowley, P. D., Fisk, A. T., et al. (2015). Aquatic animal telemetry: a panoramic window into the underwater world. Science 348:1255642. doi: 10.1126/science.1255642
Jaine, F., Rohner, C., Weeks, S., Couturier, L., Bennett, M., Townsend, K., et al. (2014). Movements and habitat use of reef manta rays off eastern Australia: offshore excursions, deep diving and eddy affinity revealed by satellite telemetry. Mar. Ecol. Prog. Ser. 510, 73–86. doi: 10.3354/meps10910
Johnson, A., Milne, B., and Wiens, J. (1992). Diffusion in Fractcal landscapes: simulations and experimental studies of tenebrionid beetle movements. Ecology 73, 1968–1983. doi: 10.2307/1941448
Kaplan, D. M., Chassot, E., Amandé, J. M., Dueri, S., Demarcq, H., Dagorn, L., et al. (2014). Spatial management of Indian Ocean tropical tuna fisheries: potential and perspectives. ICES J. Mar. Sci. 71, 1728–1749. doi: 10.1093/icesjms/fst233
Kellner, J. B., Tetreault, I., Gaines, S. D., and Nisbet, R. M. (2007). Fishing the line near marine reserves in single and multispecies fisheries. Ecol. Appl. 17, 1039–1054. doi: 10.1890/05-1845
Kessel, S., Cooke, S., Heupel, M., Hussey, N., Simpfendorfer, C., Vagle, S., et al. (2014). A review of detection range testing in aquatic passive acoustic telemetry studies. Rev. Fish Biol. Fish. 24, 199–218. doi: 10.1007/s11160-013-9328-4
Koslow, J. A. (1997). Seamounts and the ecology of deep-sea fisheries: The firm-bodied fishes that feed around seamounts are biologically distinct from their deepwater neighbors-and may be especially vulnerable to overfishing. Am. Sci. 85, 168–176.
Kranstauber, B., Kays, R., LaPoint, S. D., Wikelski, M., and Safi, K. (2012). A dynamic Brownian bridge movement model to estimate utilization distributions for heterogeneous animal movement. J. Anim. Ecol. 81, 738–746. doi: 10.1111/j.1365-2656.2012.01955.x
Kranstauber, B., Smolla, M., and Kranstauber, M. (2013). Move: visualizing and analyzing animal track data. R Package Version 1:r365.
Letessier, T. B., Bouchet, P. J., and Meeuwig, J. J. (2017). Sampling mobile oceanic fishes and sharks: implications for fisheries and conservation planning. Biol. Rev. 92, 627–646. doi: 10.1111/brv.12246
McCauley, D. J., DeSalles, P. A., Young, H. S., Dunbar, R. B., Dirzo, R., Mills, M. M., et al. (2012a). From wing to wing: the persistence of long ecological interaction chains in less-disturbed ecosystems. Sci. Rep. 2:409. doi: 10.1038/srep00409
McCauley, D. J., Young, H. S., Dunbar, R. B., Estes, J. A., Semmens, B. X., and Micheli, F. (2012b). Assessing the effects of large mobile predators on ecosystem connectivity. Ecol. Appl. 22, 1711–1717. doi: 10.1890/11-1653.1
Mee, J. A., Otto, S. P., and Pauly, D. (2017). Evolution of movement rate increases the effectiveness of marine reserves for the conservation of pelagic fishes. Evol. Appl. 10, 444–461. doi: 10.1111/eva.12460
Meyer, C. G., Clark, T. B., Papastamatiou, Y. P., Whitney, N. M., and Holland, K. N. (2009). Long-term movement patterns of tiger sharks Galeocerdo cuvier in Hawaii. Mar. Ecol. Prog. Ser. 381, 223–235. doi: 10.3354/meps07951
Meyer, C. G., Papastamatiou, Y. P., and Holland, K. N. (2010). A multiple instrument approach to quantifying the movement patterns and habitat use of tiger (Galeocerdo cuvier) and Galapagos sharks (Carcharhinus galapagensis) at French Frigate Shoals, Hawaii. Mar. Biol. 157, 1857–1868. doi: 10.1007/s00227-010-1457-x
Mumby, P. J., Dahlgren, C. P., Harborne, A. R., Kappel, C. V., Micheli, F., Brumbaugh, D. R., et al. (2006). Fishing, trophic cascades, and the process of grazing on coral reefs. Science 311, 98–101. doi: 10.1126/science.1121129
Nakamura, I. (1985). “FAO species catalogue,” in Billfishes of the World: An Annotated and Illustrated Catalogue of Marlins, Sailfishes, Spearfishes and Swordfishes Known to Date, Vol. 5 (Rome: FAO), 65.
Oh, B. Z., Thums, M., Babcock, R. C., Meeuwig, J. J., Pillans, R. D., Speed, C., et al. (2017). Contrasting patterns of residency and space use of coastal sharks within a communal shark nursery. Mar. Fresh. Res. 68, 1501–1517.
O’Toole, A. C., Danylchuk, A. J., Goldberg, T. L., Suski, C. D., Philipp, D. P., Brooks, E., et al. (2011). Spatial ecology and residency patterns of adult great barracuda (Sphyraena barracuda) in coastal waters of the Bahamas. Mar. Biol. 158, 2227–2237. doi: 10.1007/s00227-011-1728-1
Pagès, J. F., Bartumeus, F., Hereu, B., López-Sanz,À, Romero, J., and Alcoverro, T. (2013). Evaluating a key herbivorous fish as a mobile link: a Brownian bridge approach. Mar. Ecol. Prog. Ser. 492, 199–210. doi: 10.3354/meps10494
Papastamatiou, Y. P., Grubbs, R. D., Imhoff, J. L., Gulak, S. J., Carlson, J. K., and Burgess, G. H. (2015). A subtropical embayment serves as essential habitat for sub-adults and adults of the critically endangered smalltooth sawfish. Global Ecol. Conserv. 3, 764–775. doi: 10.1016/j.gecco.2015.03.003
Planes, S., Jones, G. P., and Thorrold, S. R. (2009). Larval dispersal connects fish populations in a network of marine protected areas. Proc. Natl. Acad. Sci. U.S.A. 106, 5693–5697. doi: 10.1073/pnas.0808007106
Runge, C. A., Martin, T. G., Possingham, H. P., Willis, S. G., and Fuller, R. A. (2014). Conserving mobile species. Front. Ecol. Environ. 12:395–402. doi: 10.1890/130237
Ryan, L. A., Meeuwig, J. J., Hemmi, J. M., Collin, S. P., and Hart, N. S. (2015). It is not just size that matters: shark cruising speeds are species-specific. Mar. Biol. 162, 1307–1318. doi: 10.1007/s00227-015-2670-4
Sheppard, C. R., Ateweberhan, M., Bowen, B., Carr, P., Chen, C. A., Clubbe, C., et al. (2012). Reefs and islands of the Chagos Archipelago, Indian Ocean: why it is the world’s largest no-take marine protected area. Aquat. Conserv. Mar. Freshw. Ecosyst. 22, 232–261. doi: 10.1002/aqc.1248
Sibert, J., Senina, I., Lehodey, P., and Hampton, J. (2012). Shifting from marine reserves to maritime zoning for conservation of Pacific bigeye tuna (Thunnus obesus). Proc. Natl. Acad. Sci. U.S.A. 109, 18221–18225. doi: 10.1073/pnas.1209468109
Speed, C. W., Cappo, M., and Meekan, M. G. (2018). Evidence for rapid recovery of shark populations within a coral reef marine protected area. Biol. Conserv. 220, 308–319. doi: 10.1016/j.biocon.2018.01.010
Teo, S. L. H., Boustany, A., Blackwell, S., Walli, A., Weng, K. C., and Block, B. A. (2004). Validation of geolocation estimates based on light level and sea surface temperature from electronic tags. Mar. Ecol. Prog. Ser. 283, 81–98. doi: 10.3354/meps283081
Tickler, D. M., Carlisle, A. B., Chapple, T. K., Curnick, D. J., Dale, J. J., Schallert, R. J., et al. (2019). Potential detection of illegal fishing by passive acoustic telemetry. Anim. Biotelem. 7:1.
Vianna, G. M., Meekan, M. G., Meeuwig, J. J., and Speed, C. W. (2013). Environmental influences on patterns of vertical movement and site fidelity of grey reef sharks (Carcharhinus amblyrhynchos) at aggregation sites. PLoS One 8:e60331. doi: 10.1371/journal.pone.0060331
Ward-Paige, C. A. (2017). A global overview of shark sanctuary regulations and their impact on shark fisheries. Mar. Policy 82, 87–97. doi: 10.1016/j.marpol.2017.05.004
Weng, K. C., Castilho, P. C., Morrissette, J. M., Landeira-Fernandez, A. M., Holts, D. B., Schallert, R. J., et al. (2005). Satellite tagging and cardiac physiology reveal niche expansion in salmon sharks. Science 310, 104–106. doi: 10.1126/science.1114616
White, T. D., Carlisle, A. B., Kroodsma, D. A., Block, B. A., Casagrandi, R., De Leo, G. A., et al. (2017). Assessing the effectiveness of a large marine protected area for reef shark conservation. Biol. Conserv. 207, 64–71. doi: 10.1016/j.biocon.2017.01.009
Whitney, N. M., Robbins, W. D., Schultz, J. K., Bowen, B. W., and Holland, K. N. (2012). Oceanic dispersal in a sedentary reef shark (Triaenodon obesus): genetic evidence for extensive connectivity without a pelagic larval stage. J. Biogeogr. 39, 1144–1156. doi: 10.1111/j.1365-2699.2011.02660.x
Winship, A. J., Jorgensen, S. J., Shaffer, S. A., Jonsen, I. D., Robinson, P. W., Costa, D. P., et al. (2012). State-space framework for estimating measurement error from double-tagging telemetry experiments. Methods Ecol. Evol. 3, 291–302. doi: 10.1111/j.2041-210x.2011.00161.x
Keywords: spatial ecology, marine protected areas, coral reef, acoustic tag, satellite telemetry, conservation
Citation: Carlisle AB, Tickler D, Dale JJ, Ferretti F, Curnick DJ, Chapple TK, Schallert RJ, Castleton M and Block BA (2019) Estimating Space Use of Mobile Fishes in a Large Marine Protected Area With Methodological Considerations in Acoustic Array Design. Front. Mar. Sci. 6:256. doi: 10.3389/fmars.2019.00256
Received: 22 February 2019; Accepted: 30 April 2019;
Published: 22 May 2019.
Edited by:
Rob Harcourt, Macquarie University, AustraliaReviewed by:
Alana Grech, ARC Centre of Excellence for Coral Reef Studies, AustraliaPhil J. Bouchet, University of St Andrews, United Kingdom
Copyright © 2019 Carlisle, Tickler, Dale, Ferretti, Curnick, Chapple, Schallert, Castleton and Block. This is an open-access article distributed under the terms of the Creative Commons Attribution License (CC BY). The use, distribution or reproduction in other forums is permitted, provided the original author(s) and the copyright owner(s) are credited and that the original publication in this journal is cited, in accordance with accepted academic practice. No use, distribution or reproduction is permitted which does not comply with these terms.
*Correspondence: Aaron B. Carlisle, Y2FybGlzbGVAdWRlbC5lZHU=
†Present address: Aaron B. Carlisle, School of Marine Science and Policy, University of Delaware, Lewes, DE, United States