 Yuanli Zhu1,2
 David J. Suggett3
 Chenggang Liu1Jianfeng He4Longshan Lin5Fengfeng Le1Joji Ishizaka2
 Joaquim Goes6Qiang Hao1*
- 1Key Laboratory of Marine Ecosystem and Biogeochemistry, State Oceanic Administration, Second Institute of Oceanography, Ministry of Natural Resources, Hangzhou, China
- 2Institute for Space-Earth Environmental Research, Nagoya University, Nagoya, Japan
- 3Climate Change Cluster, University of Technology Sydney, New South Wales, NSW, Australia
- 4Key Laboratory for Polar Science of State Oceanic Administration, Polar Research Institute of China, Shanghai, China
- 5Third Institute of Oceanography, Ministry of Natural Resources, Xiamen, China
- 6Lamont-Doherty Earth Observatory at Columbia University, New York, NY, United States
Predicting conversion of photosynthetic electron transport to inorganic carbon uptake rates (the so-called electron requirement for carbon fixation, KC) is central to the broad scale deployment of Fast Repetition Rate fluorometry (FRRf) for primary productivity studies. However, reconciling variability of KC over space and time to produce robust algorithms remains challenging, given the large number of factors that influence KC. We have previously shown that light appears to be a proximal driver of Kc in several ocean regions and we therefore examined whether and how light similarly regulated KC variability in the Arctic Ocean, during a summer cruise in 2016. Sampling transited ice-free and ice-covered waters, with temperature, salinity and Chl-a concentrations all higher for the ice-free than ice covered surface waters. Micro- and pico-phytoplankton generally dominated the ice-free and ice-covered waters, respectively. Values of KC, determined from parallel measures of daily integrated electron transport rates and 14C-uptake, were overall lower for the ice-covered vs. ice-free stations. As in our previous studies, KC was strongly linearly correlated to daily PAR (r = 0.68, n = 46, p < 0.001) and this relationship could be further improved (r = 0.84, n = 46, p < 0.001) by separating samples into ice-free (micro-phytoplankton dominated) vs. ice-covered (Nano- and Pico-phytoplankton dominated water. We subsequently contrasted the PAR-KC relationship form the Arctic waters with the previous relationships from the Ariake Bay and East China Sea and revealed that these various PAR-KC relationships can be systematically explained across regions by phytoplankton community size structures. Specifically, the value of the linear slope describing PAR-KC decreases as water bodies have an increasing fraction of larger phytoplankton. We propose that this synoptic trend reflects how phytoplankton community structure integrates past and immediate environmental histories and hence may be a better broad-scale predictor of KC than specific environmental factors such as temperature and nutrients. We provide a novel algorithm that may enable broad-scale retrieval of CO2 uptake from FRRf with knowledge of light and phytoplankton community size information.
Introduction
Accurate estimation of ocean primary productivity (PP) is central to understanding marine carbon geochemical cycling and the transfer of energy through food webs (Hancke et al., 2015). Compared to traditional incubation-based PP methods (Regaudie-de-Gioux et al., 2014), in situ bio-optical active chlorophylla fluorescence methods, notably Fast Repetition Rate fluorometry (FRRf, Kolber et al., 1998), afford unprecedented high spatial and temporal resolution needed to understand how the environment continually fine-tunes primary productivity (e.g., Behrenfeld et al., 2006; Suggett et al., 2009b). However, chlorophylla fluorescence measurements inherently quantify PP through the activity of photosystem II (PSII) light reactions, resulting in a “photosynthetic currency” of PSII photosynthetic electron transfer rate (ETRPSII, mol e− mol RCII s−1, Suggett et al., 2009a; Hughes et al., 2018b). Additional knowledge of the electron requirement for C fixation (termed KC, mol e− [mol C]−1, also termed Φe, C, Lawrenz et al., 2013; Hughes et al., 2018a) is required to convert ETRPSII to more conventional currencies of CO2 uptake rates (Kromkamp et al., 2008). Studies have previously demonstrated that KC appears highly variable in ocean and coastal waters, since numerous factors can cause cellular processes to consume ETRPSII-derived energy and reductant that is otherwise used for CO2 assimilation (e.g., Lawrenz et al., 2013; Halsey and Jones, 2015; Hughes et al., 2018b). Developing approaches to model KC, and hence account for KC variability, are therefore critical for efforts utilizing FRRf-based measurements for highly resolute CO2 uptake rate retrieval.
Early efforts to reconcile conventional CO2 uptake rates with FRRf-derived CO2 uptake attributed FRRf “overestimates” to use of a constant KC value (i.e., 4 or 5 mol e− (mol C)−1) (Kromkamp et al., 2008; Mino et al., 2014), in particular under excess irradiance (Ralph et al., 2010). Subsequent studies demonstrated that miss-matches between CO2 uptake rates and FRRf were largely due to KC variability, which in turn could be explained (predicted) from co-variability with key environmental factors known to regulate PP, i.e., light, temperature and/or inorganic nutrient availability (Lawrenz et al., 2013; Hughes et al., 2018b; Ryan-Keogh et al., 2018). Schuback et al. (2015, 2016, 2017) and (Schuback and Tortell, 2019) further demonstrated that such KC variability correlated with the extent of non-photochemical quenching (NPQ), interpreted as an indication of excess light energy, which leads to a decoupling of ETRPSII and carbon uptake (see also Hughes et al., 2018b). We similarly recently reported that variance of KC, derived from parallel measures of FRRf-derived ETRs and C-uptake rates, could be generally explained by patterns in light availability (Zhu et al., 2016), but importantly was much improved when considering differences in phytoplankton size structures (Zhu et al., 2017). In fact, changes in predominant species within phytoplankton communities appears to be a factor increasingly important in explaining patterns of KC (e.g., Kulk et al., 2018; Xie et al., 2018), likely reflecting selection of taxa by environmental factors that are not specifically measured as part of the assessment exercise of interest (see Hughes et al., 2018a). Patterns of KC variability over space and time therefore remain problematic to fully resolve. For example, the strong linear relationship which we observed previously between light and KC differed across disparate ocean ecosystem, Ariake Bay (Zhu et al., 2016), and East China Sea (ECS)/ Tsushima Strait (Zhu et al., 2017). Schuback et al. (2016) similarly reported differences in comparing KC and NPQ derived from two locations in the subarctic Pacific where the regression slopes differed for two datasets, presumably as a result of alternate specific nutrient regimes and/or phytoplankton species. To therefore further examine, and reconcile cross-regional differences in the regulation of KC variation by light and phytoplankton community structures, we applied our established daily integrated CO2-uptake and FRRf inter-comparison method (Zhu et al., 2016, 2017) to the Arctic Ocean, where the light environment and phytoplankton taxa are very different from those assessed previously.
The Arctic Ocean is recognized as a sentinel marine system that is currently proportionately affected by climate change compared to many other systems worldwide (Wassmann et al., 2011). Near-surface warming in the Arctic has been almost twice as large as the global average (Graversen et al., 2008), and consequently the extent of Arctic sea ice has decreased dramatically (Serreze and Stroeve, 2015) increasing sea ice meltwater to result in surface freshening (McPhee et al., 1998; Yamamoto-Kawai et al., 2009; Timmermans et al., 2011). Arctic ecosystems appear particularly sensitive to spatial and temporal variations in hydrographic properties. Ice cover loss leads to increased light availability and the phytoplankton growing season, thus primary productivity in the Arctic Ocean (Arrigo et al., 2008; Hill et al., 2017). However, ice melt also intensifies freshening and in turn stronger stratification that may act to suppress upward fluxes of nutrients leading to decreased primary productivity and an increase in the fraction of pico-phytoplankton, typical for low-nutrient environments (Li et al., 2009; Coupel et al., 2015; Mills et al., 2018) through selection for low nutrient pico-phytoplankton (see Li et al., 2009). The non-uniform trends associated with changes in sea-ice and primary productivity (Brown and Arrigo, 2012; Fernández-Méndez et al., 2015) fundamentally require more data across a wide variety of assemblages that can more broadly resolve this issue. Notably, understanding how primary productivity is regulated in Arctic systems can be achieved by increasing the spatial and temporal coverage of in situ measurements via active chlorophyll fluorescence techniques (Hancke et al., 2015; Schuback et al., 2017).
In this study, we conducted parallel measures of ETRPSII and (14C) carbon uptake rates for Arctic Ocean surface waters during a 2017 summer cruise. Variability of phytoplankton photophysiology and light-dependency of KC was first examined to identify environmental drivers (e.g., light, nutrients, ice coverage, etc.) and/or phytoplankton community structure differences specific to this region. We then compared these observations with those from our previously reported Ariake Bay and East China Sea datasets to show for the first time that changes in dominated phytoplankton size structure may explain the variation amongst cross-regional light-KC relationships. We discuss how this new insight can further help in applying FRRf based approaches for high resolution primary productivity retrieval.
Materials and Methods
Sampling and Measurements of Physical and Biochemical Properties
Sampling was conducted on board the R/V Chinare (XueLong Arctic cruise), July 18th to September 10 th, 2016. A total of 50 stations were visited spanning three main regions, the Bering strait (12 stations), Chukchi shelf (15 stations) and Chukchi borderland (23 stations) (Figure 1, Supplementary Table 1). Water was sampled from depths of 5, 20, 30, 50, 75, 100, 125, 150, 175, and 200 m using a rosette equipped with 12 × 5L Niskin bottles (General Oceanics, USA) and a conductivity-temperature-depth profiler (CTD, 911+, SeaBird Electronics, USA). For safety reasons, the icebreaker cannot deploy CTD at locations where ice was heavily covered, but only in open water in the ice covered region (Figure 1). Data from the CTD was utilized for establishing hydrographic conditions of each station at the time of sampling. Mixed layer depth (MLD) was calculated using the density difference criterion (σ = 0.1 kg m−3) of Peralta-Ferriz and Woodgate (2015). Incident photosynthetically active radiation (PAR) at the sea surface (PAR(0+) was measured throughout the cruise period with a cosine irradiance sensor (AV-19Q, Avalon, USA) mounted on the ship (see Zhu et al., 2016).
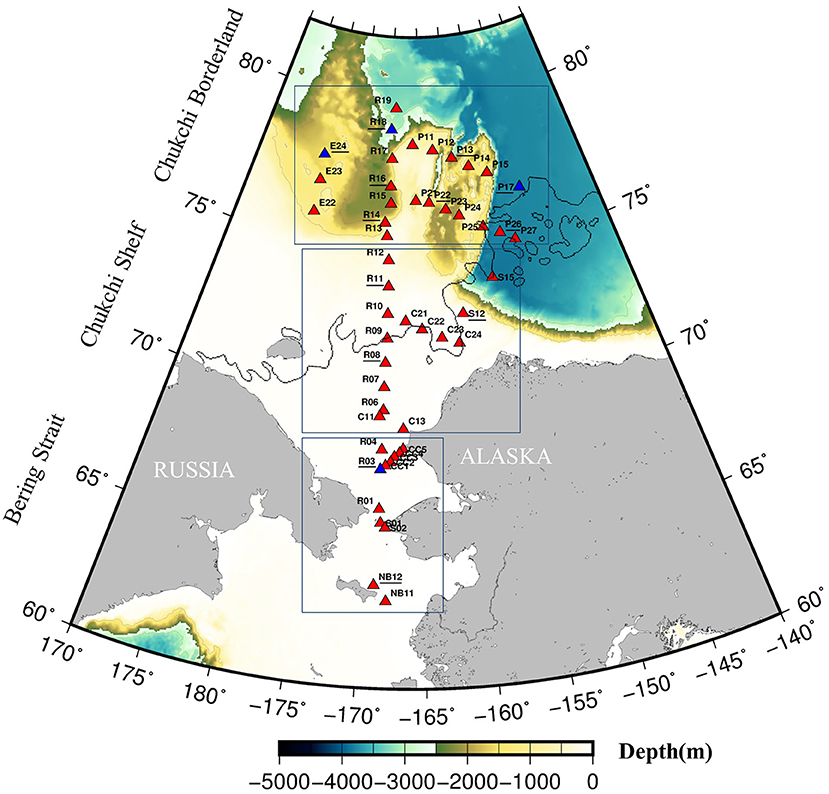
Figure 1. Sampling stations during the CHINARE 2016 cruise performed onboard the R/V XueLong icebreaker. Red triangles indicate stations where FRRf data are measured. Underlined stations numbers indicate the stations where primary productivity data are available. Blue triangles indicate stations where only primary productivity is available but no parallel measured FRRf data. Solid lines indicate the sea ice edge (August sea ice data MASAM2 download from National Snow and Ice Data Center, http://nsidc.org/).
In this study, for phytoplankton size structure measurement, we separated each sample to Micro-, Nano- and Pico in these three groups based on size-fractionated chlorophyll a (Chl-a) measurements, according to standardized methods used in marine phytoplankton size research (Cermeño et al., 2006). Size-fractionated Chl-a concentration was determined on a 250 ml volume sample, which was filtered sequentially through 20 μm nylon membrane, 2 μm polycarbonate, and 0.7 μm pore size GF/F filters. Filtering through 20 and 2-μm was done under gravity and 0.7-μm under low vacuum pressure (<0.02 MPa), and cells retained by the 20 μm filters belong to the micro-phytoplankton whereas those retained by the 2 and 0.7 μm pore size constitute, respectively, nano-phytoplankton and pico-phytoplankton. Filters were extracted in 8 mL 90% acetone for 24 h in darkness under −20°C and the Chl-a concentration determined fluorometrically using a pre-calibrated fluorometer (Turner Trilogy, USA) following Holm-Hansen et al. (1965). A second aliquot of 5 mL for nitrate + nitrite (), phosphate (), and silicate (DSi) was measured using a continuous flow-analyzer (Skalar SA-400, Skalar, Breda, The Netherlands) and concentrations determined following Grasshoff et al. (1999). Detection limits based on this approach were 0.1, 0.03 and 0.1 μM for , and DSi, respectively.
Primary Productivity
14C uptake experiments for surface water samples (~5 m) only, were conducted using 6 h (local time 8:00 to 14:00) on-deck incubations as per Steemann Nielsen (1952) [modified by Evans et al. (1987) and (Ning and Liu, 1988)]. Briefly, water samples were prescreened through 200 μm mesh and then filled into two light and one dark acid-cleaned polycarbonate bottles of 250 mL 10 μCi of NaH14CO3 was added to each bottle, which was then placed in an on-deck incubator. When incubating samples from within the upper mixed layer, light intensity in the bottles was adjusted to its mean value within the mixed layer by covering neutral density screening. However, the effects of ultraviolet radiation were not considered in this study and we will discuss this later. A seawater circulation system-maintained incubators at the in-situ temperature. After incubation, water samples were filtered through GF/F filters under a low vacuum (<0.02 MPa). The filters were then fumed by concentrated HCl overnight to remove inorganic carbon on the filters and preserved within scintillation vials −20°C for later measurement (Ning and Liu, 1988). Upon returning to the laboratory, 10 mL of scintillation counting cocktail (PerkinElmer, US) was added to each vial. Radioactivity was measured with a liquid scintillation counter (Tri-carb Packard 2050, US) that used an internal standard for a quenching correction. Carbon uptake rates (PC, mgC m−3 h−1) were determined as daily rates (mgC m−3 d−1) as,
where day length was calculated as per Kirk (1994). Daily Chl-a specific primary productivity (, mgC mgChl-a−1 d−1) was then calculated as daily PC(z) divided by total Chl-a concentration.
Fast Repetition Rate Fluorometry (FRRf)
At each station, surface water was also taken for FRRf measurements (Act2-Based Laboratory system, Chelsea Technologies, West Molesey, UK) using the ship's seawater intake system (from a depth of ca. 5 m, similar with 14C water sampling depth). All samples were acclimated to dark for ~10 min before measurement. The FRRf was programmed to deliver a single-turnover protocol with a saturation phase comprising 100 blue flashlets (450 nm LED) on a 2 μs pitch and a relaxation phase comprising 40 flashlets on a 50 μs pitch (as per Hoppe et al., 2015; Hughes et al., 2018b). Measurements recorded were from the average of 58 consecutive acquisitions at 100-ms intervals. Each FRRf acquisition was subsequently fitted to the KPF model (Kolber et al., 1998) using FastPRO software (Chelsea Technologies Group) to yield the minimum fluorescence yield, maximum fluorescence yield, effective absorption, and photochemical efficiency of photosystem II (PSII) for darkness (Fo, Fm, and Fv(= Fm − Fo)/Fm) and for each actinic light level (F′, , and ). The normalized Stern-Volmer quenching coefficient (NPQNSV, McKew et al., 2013) was calculated from these parameters as where was estimated as (Oxborough and Baker, 1997) and .
FRRf measurements were made continuously throughout light response protocols following an initial dark step. The sample was sequentially exposed to 10 actinic light levels (0, 48, 106, 175, 258, 358, 477, 621, 793, 1,000 μmol quanta m−2 s−1, white LEDs) within the FastAct2, to retrieve a fluorescence-light response curve, whereby each light step was delivered for 40 s.
The instantaneous PSII reaction center normalized electron transport rate (ETRPSII, mol e− [mol PSII]−1 s−1) for each light level was calculated as per Kolber and Falkowski (1993),
where PAR is in units of μmol quanta m−2 s−1 and is the effective absorption cross section of PSII specific to light of 450 nm wavelengths. ΦRC (electrons quanta−1) accounts for the assumption that one electron is produced from each RCII charge separation (see Kolber and Falkowski (1993)), and the constant value 6.022 × 10⁻³ that converts μmol quanta to quanta, PSII to mol PSII and A2 to m2 (e.g., Suggett et al., 2001). The term qp (dimensionless) is the PSII operating efficiency and accounts for the extent of photochemical energy conversion by PSIIs, determined as . To account for a lack of phytoplankton absorption and in situ light spectral measurements, an empirical relationship between “correction factor” (f, dimensionless) and optical depth was applied to spectrally correct values of σPSII (see Suggett et al., 2006b for detail). Specifically, for our surface data, an f value of 1.6 was used as optical depth was 0. As such, the spectrally corrected ETRPSII is equal to ETRPSII /f.
ETRPSII and PAR data from the FRRf-light response curves were then fit to the photosynthesis-light dependency model of Jassby and Platt (1976), Equation (3).
Using knowledge of α and , we were then able to retrieve the surface ETRRCII for any given value of surface PAR at any given time. As such, the daily integrated ETRPSII (mol e− [mol PSII]−1 d−1) at the surface was finally determined as:
where the period between t1 and t2 is daylength (h).
In order to convert ETR normalized to PSII content (ETRPSII), normalized to Chl-a content, and hence ETRs that could be directly compared with parallel measures of carbon uptake to retrieve KC (Lawrenz et al., 2013), knowledge of the RCII per Chl-a (i.e., nPSII, mol RCII [mol Chl-a]−1) is required. Direct measurement of nPSII under natural conditions is extremely challenging (Moore et al., 2006; Suggett et al., 2006a) often requiring that the RCII concentration be determined indirectly (see Suggett et al., 2010). Since there are almost no cyanobacteria that exist in the Arctic region (Pedrós-Alió et al., 2015), here we assumed a “standard” nPSII value of 0.002 mol RCII [mol chl]−1 for eukaryotes (Kolber and Falkowski, 1993) in our ETR calculation.
Thus, a daily Chl-a specific ETR (mmol e− mg Chl-a−1 d−1) was calculated as follows:
the constant factor 893 converts mol Chl-a to mg Chl-a and mol e− to mmol e−.
Finally, KC (mol e− (mol C)−1) was defined to be the ratio of the two independently determined variables, ETR and as per Zhu et al. (2016, 2017):
where is the daily-integrated carbon assimilation per unit Chl-a (mgC mg Chl-a−1 d−1), and the factor 12 converts g C to mol C.
Sea Ice Concentration
In this study the sea ice information was derived from MASAM2 sea ice concentration product (3 July 2012 to present; Fetterer et al., 2015) with 4 km resolution, which is bundled into monthly NetCDF data (https://nsidc.org/data/g10005#). We applied August 2016 data to obtain the ice concentration in the Arctic Ocean (60°N- 90°N) (ftp://sidads.colorado.edu/pub/DATASETS/NOAA/G10005/). Sea ice concentration values >70% was defined as an ice cover area, for plotting the boundary of the ice free/ice cover region (Figure 1).
Statistical Analyses
Spearman and Pearson rank correlation analysis was utilized to examine the covariance of KC with physico-chemical (or taxonomic) parameters. Kolmogorov Smirnov tests were applied to examine for data normality. Welch t-test, ANOVA and ANCOVA were then applied for testing the significant differences between clusters or groups of data and the linear regression models (as per Zhu et al., 2017). All statistical analyses and curve fittings were performed using open source statistical software R version 3.2.3 (R Core Team, 2014). Figures were plotted by GMT 4, Ocean Data View 5 (Schlitzer, 2018) and R software.
Results
Physical and Nutrient Properties in the Study Area
Transiting across the Bering strait, Chukchi shelf and Chukchi borderland captured a gradient of physico-chemical conditions in the Arctic surface waters (Figure 1), whereby sea surface temperature (SST) decreased progressively from lowest (63°N) to highest (79.7°N) latitude, (mean ± standard error, SE) of 8.8 ± 0.3°C in the Bering strait, 2.6 ± 0.8°C in the Chukchi shelf and −1.1 ± 0.1°C in the Chukchi borderland (Supplementary Figure 1A, Figure 2A). Surface salinity exhibited a similar trend than SST, with the highest value of 31.54 at station NB12 in the Bering Strait, and decreasing northward to the lowest salinity (26.5 PSU) at station P26 in the Chukchi borderland (Supplementary Figure 1B, Figure 2A). Parallel changes of SST and salinity were observed between stations R8 and R9, when crossing the boundary of ice free and ice cover regions (Figure 1, Supplementary Figure 1), decreasing from 5°C to <2°C, and 30 to 27 PSU, respectively (Supplementary Figures 1A,B). As such, this area delineated two water mass assemblies in the surface layer of cold, low-salinity water predominantly in the ice-free region and warm high-salinity water in the ice-cover area (T-S plot, Figure 2A). Mean (± SE) SST for the water mass in the ice-free area (stations included from NB11 to R8, n = 17) was 8.0 ± 0.4°C, compared to −0.56 ± 0.2°C in the ice cover region (stations located north than R8, n = 32). Salinity was 30.7 ± 0.2 vs. 27.5 ± 0.1 for the ice-free and ice-cover region, respectively. MLDs generally remained constant across the cruise transect, at ca. 14 ± 2 m (Table 1).
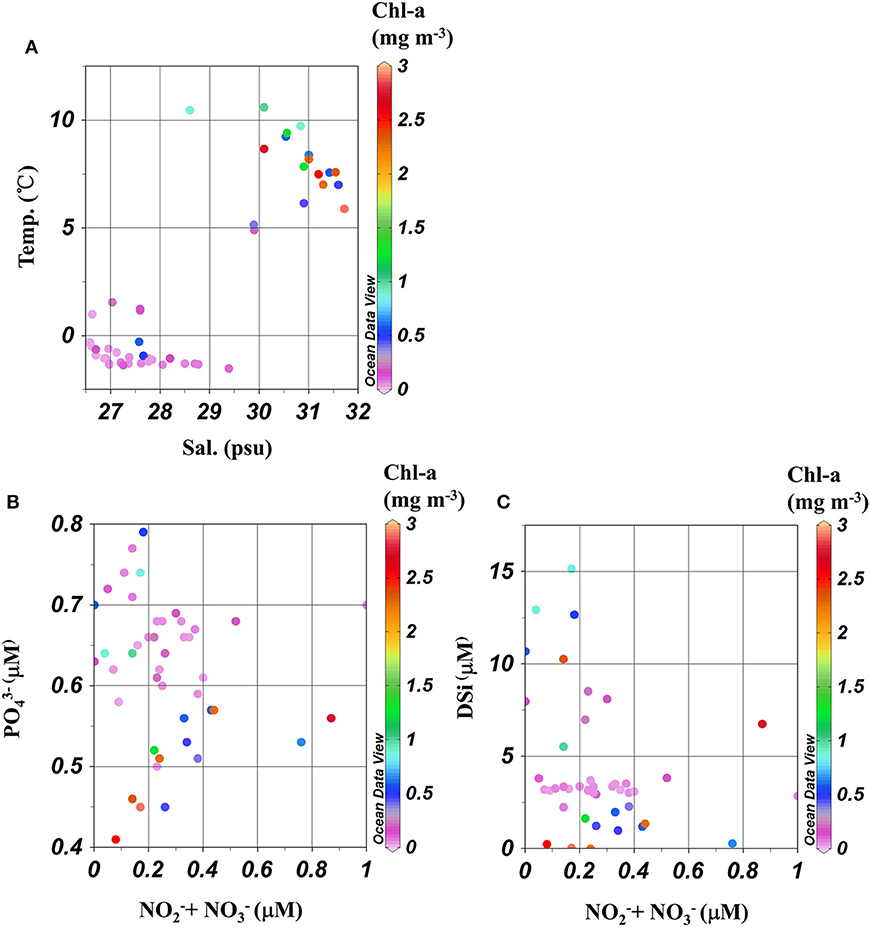
Figure 2. Plot of (A) Salinity–Temperature, (B) Nitrate + Nitrite – Phosphate, and (C) Nitrate + Nitrite – Silicate collected from the surface at each station. Color indicated Chl-a concentration.
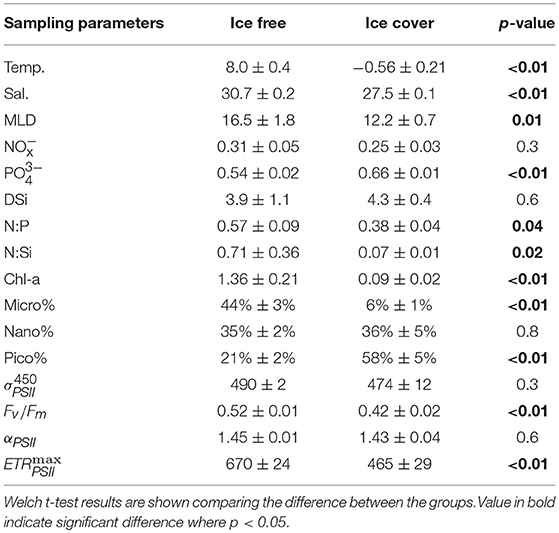
Table 1. Mean ± standard error (SE) of physic-chemical and biological parameters within ice free/ice cover regions.
Relatively higher + surface concentrations were observed for water masses in the ice-free than for the ice-cover waters, with mean (± SE) values of 0.31 ± 0.05 μM and 0.25 ± 0.03 μM (Table 1, Supplementary Figure 1C). In contrast, higher (0.66 ± 0.01 μM) and DSi (4.3 ± 0.4 μM) concentrations were found for the ice cover region than for the ice free waters ( : 0.54 ± 0.02 μM; DSi: 3.8 ± 0.4 μM, Table 1, Supplementary Figures 1D,E). Even so, similarly low ratios of and concentrations were found for both sub-regions (N:P of ca. 0.5), indicating nitrate availability was the limiting nutrient throughout the entire observation area (Tremblay and Gagnon, 2009). Nitrogen to silicate ratios ( and DSi; N:Si) were ca. 10 times higher for the ice free (0.71 ± 0.36), than for the ice cover (0.07 ± 0.01) samples (Table 1, Figures 2B,C).
Phytoplankton Chl-a, Community Size Distribution and Photo-Physiology Variability
Chl-a varied by 2 orders of magnitude across the study area, from 0.01 to 2.73 mg m−3 (with mean ± standard error (SE) of 0.52 ± 0.11 mg m−3 for all samples). As observed for SST and salinity, Chl-a concentration and phytoplankton size structure differed for water masses across the ice-free and ice-cover boundary. Chl-a decreased from 0.4 mg m−3 at R8 to 0.2 mg m−3 of R9, accompanied by a relative decrease in micro- and increase in pico-phytoplankton fractions (32 to 4% and 27 to 64% from R8 to R9, respectively). Higher Chl-a concentrations that were also comprised of more micro-phytoplankton were characteristic of the ice-free area (mean ± SE of 1.4 ± 0.2 mg m−3 and 44 ± 3%) compared to the ice-cover area (0.09 ± 0.01 mg m−3 and 6 ± 1%) (Table 1, Supplementary Figures 2A,B). In contrast, pico-phytoplankton dominated the ice-covered samples, with mean values of 58 ± 5% (Supplementary Figure 2D). The nano-phytoplankton had similar fraction in two regions (34 ± 2% and 35 ± 4% for ice-free and ice-cover area, Supplementary Figure 2C). Overall, Chl-a concentration and the proportion of biomass in the micro-phytoplankton fraction was strongly positively correlated throughout this cruise transect (r = 0.8, n = 50, p < 0.001).
Spatial distribution for photo-physiological parameters was highly variable throughout the region, whereby changes in values likely reflect a changing phytoplankton community structure (Chl-a biomass and size fractionation), (Supplementary Figure 3), as reported previously (Moore et al., 2005; Suggett et al., 2009b). Values of and Fv/Fm ranged from 370 to 654 Å2 quanta−1 and 0.10 to 0.58 respectively across the study area. However, Fv/Fm was higher (mean ± SE) for samples in the ice free waters (0.52 ± 0.01) than for ice covered waters (0.42 ± 0.02) (Table 1, Supplementary Figure 3E) whereas values of were generally similar for both (490 ± 2 vs. 474 ± 12 Å2 quanta−1, respectively (Table 1, Supplementary Figure 3D). Values of αPSII ranged from 1.2 to 2.4 mol e− mol PSII−1 s−1 (μmol quanta m−2 s−1)−1, varying little throughout the cruise (mean ± SE of 1.44 ± 0.18 mol e− mol RCII−1 s−1 (μmol quanta m−2 s−1)−1 (Supplementary Figure 3A). In contrast, ranged from 119 to 831 mol e− mol PSII−1 s−1 with higher values in the ice free waters than in the ice covered waters (670 ± 24 vs. 465 ± 29 mol e- mol PSII−1 s−1, Table 1, Supplementary Figure 3B). As such, the light saturation of PSII charge separation, EK () were also higher for samples taken from ice free waters (460 ± 17 μmol quanta m−2 s−1) compared to ice covered waters (335 ± 22 μmol quanta m−2 s−1 (Supplementary Figure 3C). The extent of non-photochemical quenching (dark acclimated NPQNSV at light intensity of 48 μmol quanta m−2 s−1) were all within the range of 0.66–2.07 (1.13 ± 0.06), except three relatively high values (ca. 3, 5, and 10) for stations R15, R16, and R17 (Supplementary Figure 3F).
To further evaluate the potential influence of phytoplankton taxa on photo-physiology and photosynthetic parameters, all data were subsequently binned according to the dominant phytoplankton fraction as per Zhu et al. (2017); specifically selecting samples based on their larger proportion of cells within micro-, nano-, or pico- fraction to yield three effective phytoplankton size dominated groups (f micro-, f nano-, and f pico-dominated consisting of nine, 15 and 26 data points, respectively). Hydrographic properties generally differed for samples binned according to these three size groups (ANOVA test, p < 0.05, df = 2; Table 2). High temperature, salinity and Chl-a concentration was a consistent feature for samples characterized by the dominance of the largest size phytoplankton dominated group (micro fraction > 50%, Table 2, Supplementary Figure 4), and largely for stations from the Bering strait. For f nano and f pico dominated samples, Chl-a, temperature and salinity were always lower. Whilst concentrations exhibited relatively little variation across all 3 size-class bins, higher + associated with lower DSi concentration were a common feature of f micro dominated samples (Table 2, Supplementary Figure 4). and Fv/Fm significantly increased for samples dominated by increasingly larger fractions (ANOVA test, p < 0.01, df = 2, Table 3, Figure 3), whereas αPSII and did not vary amongst the size groups (ANOVA test, p = 0.5 and 0.6, df = 2, Table 3, Figure 3); However, ANOVA test analysis further demonstrated that the and Fv/Fm for fpico were significantly different than for fnano and fmicro (df = 1, p < 0.001) but not for fnano compared to fmicro (df = 1, p = 0.3).
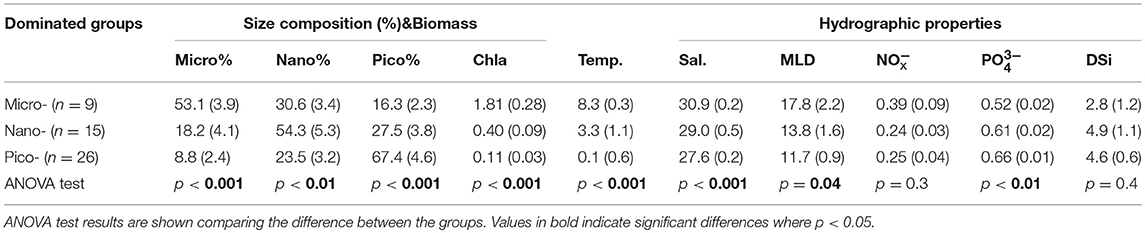
Table 2. Mean (± SE, standard error) of phytoplankton size fractions (Micro%, Nano%, Pico%), biomass (Chl-a, mg m−3) and environmental parameters [Temp., Temperature (°C); Sal, Salinity; MLD, Mixed Layer Depth (m); = (μM), (μM), DSi(μM)] within three dominated size classes of phytoplankton.
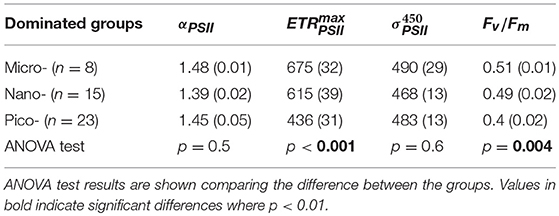
Table 3. Mean (± SE, standard error) of photo-physiology parameters αPSII (mol e− mol RCII−1 s−1 (μ mol quanta m−2 s−1)−1), (mol e- mol RCII−1 s−1), within three dominated size classes of phytoplankton.
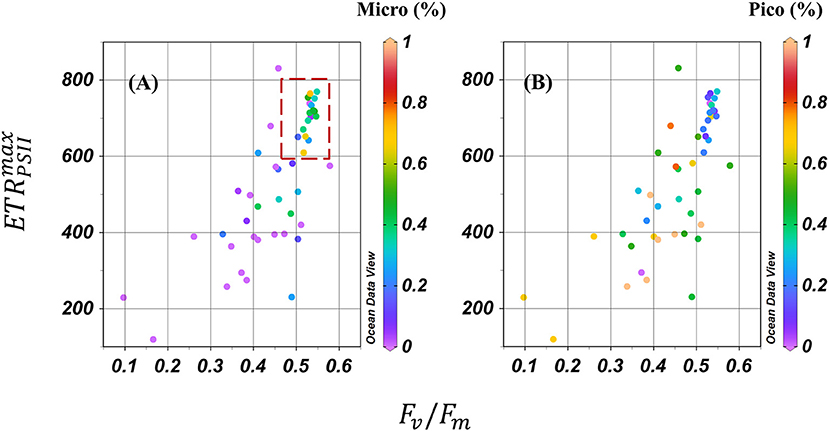
Figure 3. Plot of Fv/Fm-maximum ETRPSII () value collected from the surface at each station. Color indicated (A) micro-phytoplankton fraction and (B) pico-phytoplankton fraction. Micro-phytoplankton dominated when Fv/Fm > 0.5, > 600 (red dashed rectangle).
Variability of ETR, Carbon Uptake Rates, and KC
Daily integrated ETR ranged from 12.7 to 54.9 mmol e− (mg Chl-a)−1 d−1, with a mean (± SE) of 33.6 ± 1.4 mmol e− (mg Chl-a)−1 d−1 from all samples. Daily ETR was significantly linearly correlated with daily integrated PAR (with range of 6.0 to 21.1 mol quanta m−2 d−1) (R2 = 0.86, n = 46, p < 0.001; Supplementary Figure 5A), revealing that variability of daily ETR was highly dependent on light availability throughout this study region, and as previously identified from other regions (Zhu et al., 2016, 2017).
Whilst relatively few 14C uptake rate data points (n = 13) were ultimately obtained from this cruise, values of surface PC were highly correlated with corresponding values of Chl-a, and with a variability best described by a second-order polynomial function (R2 = 0.99, n = 13; Supplementary Figure 5B). We therefore applied this empirical model to derive the carbon uptake rate for all 46 stations where both surface Chl-a and FRRf data were available. From this, surface PC varied from 0.18 mgC m−3 d−1 at the Chukchi Borderland (P21-P26) to 102.5 mgC m−3 d−1 at Bering Strait (S01), with average values of 1.7 ± 0.4 and 37.9 ± 8.2 mgC m−3 d−1 for the ice covered and ice free water masses, respectively. After normalizing to Chl-a, surface appeared higher for stations in the ice free water (mean ± SE: 25.9 ± 1.6 mgC mg Chl-a−1 d−1) than in the ice covered area (17.4 ± 0.2 mgC mg Chl-a−1 d−1). Binning data to the different dominated size phytoplankton groups (i.e., f micro, f nano and f pico) demonstrated that decreased with the phytoplankton size decrease, 30.2 ± 2.8, 19.6 ± 0.6 and 17.5 ± 0.3 mgC mg Chl-a−1 d−1 for f micro-, f nano-, and f pico, respectively (Table 4).
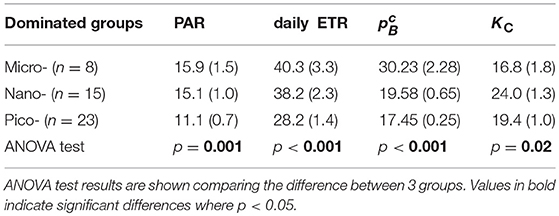
Table 4. Summary of mean value (standard errors) of daily PAR (mol quanta m−2 d−1), daily ETR (mmol e− [mgChl-a]−1 d−1), (mg C [mgChl-a]−1 d−1), and KC (mol e− (mol C)−1) at surface layer of dominated size classes of phytoplankton.
Values of KC derived from corresponding daily ETR and C-uptake rates (Equation 6) are key in understanding phytoplankton electron usage efficiency for carbon fixation. KC exhibited a range from 8.8 to 38.5 mol e− (mol C)−1 with an average of 20.5 ± 6.3 mol e− (mol C)−1 during the cruise. Lower KC values were observed for ice-free than for ice-covered samples (mean ± SE, 19.5 ± 1.6 vs. 21.0 ± 1.2 mol e− (mol C)−1) or for samples dominated by f micro than for f nano and f pico (16.8 ± 1.8 vs. 24.0 ± 1.2 and 19.4 ± 1.0 mol e− (mol C)−1). ANOVA demonstrated that KC was different amongst the 3 phytoplankton size groups, with Welch t-tests identifying that KC was the same for f micro and f nano (df = 1, p = 0.02), f nano and f pico (df = 1, p = 0.05), but not for f micro and f pico (df = 1, p = 0.3).
Relationships between PAR and KC were further examined for data binned according to water mass (ice-free vs. ice-cover samples) and then according to the three dominated size groups. Variability of KC for the entire dataset could be described by a simple PAR-dependent linear model (KC = 0.98PAR + 7.4, R2 = 0.43, n = 46, p < 0.001, Figure 4A) as we have demonstrated previously for other regions in the Ariake Bay and East China Sea (Zhu et al., 2016, 2017). However, linear regression models describing the relationship between KC and PAR were different for samples pooled for ice free (KC = 0.98PAR + 4.02, R2 = 0.35, n = 16, p = 0.01) vs. ice cover (KC = 1.42PAR + 3.93, R2 = 0.77, n = 30, p < 0.001) regions (Figure 4B), or fmicro (KC = 0.54PAR + 8.2, R2 = 0.21, n = 8 p = 0.25), fnano (KC = 1.62PAR – 0.4, R2 = 0.75, n = 15 p < 0.001), and fpico (KC = 1.2PAR + 5.7, R2 = 0.69, n = 23 p < 0.001) (Figure 4C). For the water mass bins, the linear regression slopes appeared lower for ice free (0.98) than for ice cover (1.42) samples, but were not significantly different (ANCOVA, df = 1, p = 0.2). In contrast, for the size group bins, ANCOVA analysis demonstrated that the regression slope describing the KC vs. PAR relationships for fmicro was significantly lower than for fnano and fpico (df = 1, p = 0.03 and 0.05) but not for fnano compared to fpico (df = 1, p = 0.2). As such, data from f nano and f pico bins were subsequently pooled to generate the PAR- KC linear relationship for samples dominated by small phytoplankton (f nano+pico, < 20 μm) (Figure 4D). In this case, the regression slope was lower for samples dominated by micro-phytoplankton (f micro >20 μm) than those dominated by small phytoplankton (f nano+pico, < 20 μm) (slope: 0.54 vs. 1.36, ANCOVA, df = 1, p = 0.02). The correlation coefficient between KC and PAR was much improved for data binned by water mass for the ice free region (R2 = 0.77, Figure 4B) or by taxa for the f nano+pico group (R2 = 0.74, Figure 4D) compared to that previously where all data was pooled together (R2 = 0.43, Figure 4A). Overall, the data pooled as two taxonomic groups (compared to two water masses) appeared best at explaining covariation between PAR and KC.
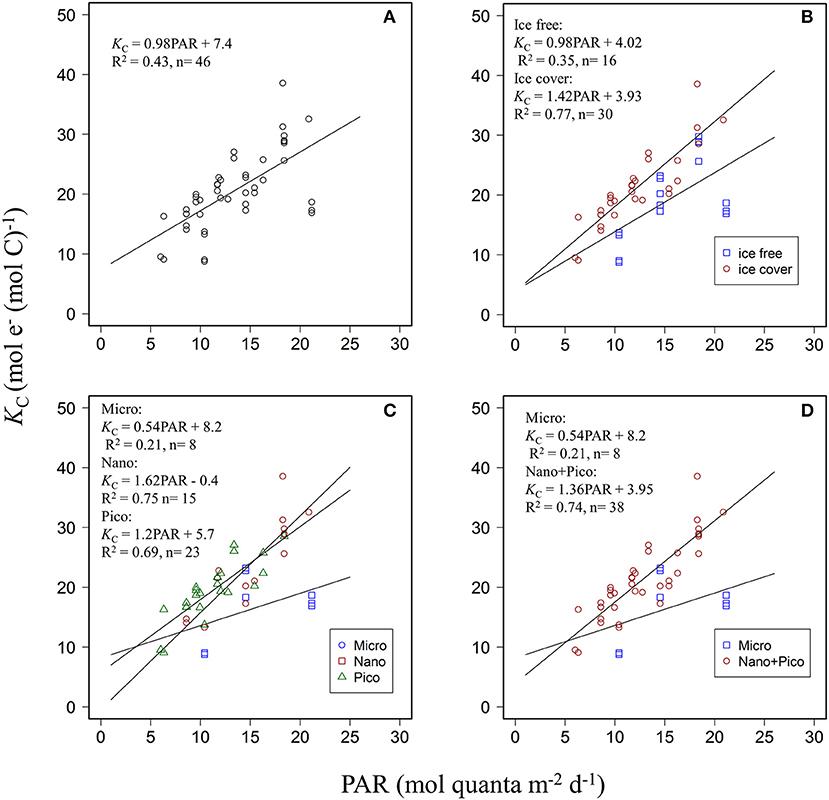
Figure 4. Scatter plots of daily PAR (mol quanta m−2 d−1) and KC (mol e− (mol C)−1) for (A) pooled data (B) data in the ice free and ice cover areas (C) for three size (micro, nano, pico) dominated groups. (D) for two size (micro and nano + pico) dominated groups. Blue, red, and green colors in (B–D) represent different grouped data.
Discussion
Summer has been a recent focus of study within the Arctic Ocean because of the rapid reduction of sea ice that appears to drive a series of dramatic changes in ocean biogeochemistry. Sea ice melting results in warming and freshening of surface waters (Screen and Simmonds, 2010), which subsequently enhances the stratification of the upper Arctic Ocean. Stratification suppresses the water exchange between the surface and deep layers resulting in nutrient deficiency in the upper Arctic Ocean waters after phytoplankton blooms (Li et al., 2009). As a result, phytoplankton must respond to evolving physico-chemical conditions through changes in community structure (Ardyna et al., 2011), growth period (Arrigo and van Dijken, 2004; Ardyna et al., 2014), and biomass (Pabi et al., 2008; Wassmann et al., 2011), which together influence the entire food web (Palmer et al., 2013) and ecosystem dynamics (Smetacek and Nicol, 2005). We used parallel measures of FRRf and 14C uptake to better understand phytoplankton responses to dynamically changing Arctic Ocean surface waters in the summer, encompassing both ice free and ice cover water masses. It needs to be noted that this study, concerning the surface (upper mixed layer) only, may not fully reflect photo-physiology and primary productivity characteristics of the Arctic Ocean, especially in the lack of sub-surface Chla maximum (SCM), which has great importance in Arctic regions. Hill et al. (2013) recently suggested a constant PP underestimation of 75% throughout the summer for the entire Arctic Ocean when smoothing out the SCM. Moreover, the light-Kc relationship derived from the surface may be different, or not applicable for data from below the mixed layer (Schuback et al., 2017), especially for the SCM where the phytoplankton size structure differs with regards to the surface layer (Wang et al., 2014). We also acknowledge that taxa could change in situ with a similar cell size and only focusing on phytoplankton cell size structures may not be enough to fully explain our results (Suggett et al., 2004). Unfortunately, the data cannot address it currently, but we have noted that it may have contributed to the unexplained variance (Figures 4C,D). Arctic Ocean surface/upper waters were our focus because of the sensitivity to ocean warming, ice retreat etc., which further affects primary production and organic matter circulation (Benner et al., 2005; Arrigo et al., 2008; Steele et al., 2008; Brown and Arrigo, 2012). Thus, we are confident our work contributes to a better understanding of the relationship between phytoplankton size structure and photo-physiology of Arctic Ocean upper water. Our observations of distinct photophysiological and phytoplankton community signatures for both ice free and ice cover water masses in the summer Arctic Ocean, is consistent with previous investigation in this area (2010–2011), where differences in light and nutrient availability associated with the seasonal sea ice zone resulted in strong patterns of (carbon-based) photophysiology (Palmer et al., 2013). However, we demonstrate that different water masses also display inherently distinct properties in how PSII electron transport (ETRPSII) is invested into carbon uptake, and hence values of KC. In the following sections, we consider how such differences in KC may contribute to PP dynamics in the Arctic Ocean surface water, and how these observations compare to environmental (notably light) -dependency of KC in other ocean systems.
Environmental and Phytoplankton Community Characteristics of Summer Waters in the Arctic Ocean
The Arctic Ocean has been warming over the past few decades (Zhang, 2005) whereby increasing surface atmospheric heat fluxes have effectively entered through the Bering Strait due to the absence of ice cover (Woodgate et al., 2006; Steele et al., 2008). At the same time, accelerating ice melt has been enhancing summer Arctic Sea freshening (Li et al., 2009; Cai et al., 2010). Significant regional variability for temperature and salinity from our study appears to be most associated with sea ice cover and crossing the ice cover edge (i.e., R8 to R9, Figure 1, Supplementary Figure 1). Lower salinity within the upper layer of ice melt is likely to result in stronger stratification (Frey et al., 2014). Weaker mixing will in turn reduce winter nutrient renewal to the euphotic layer and thus limit summer primary productivity (McLaughlin and Carmack, 2010). Indeed, whilst MLD remained constrained throughout the transect, MLD was generally deeper in ice-free waters (16.5 m) than for ice-covered water (12 m) (see Table 1). Less nutrient availability is expected for phytoplankton in the upper layer of ice covered waters since nutrient rich Pacific winter water is much deeper over the Chukchi Borderland (100 m) than the Chukchi Shelf (20–50 m) (Coupel et al., 2015). However, in our study, + was only slightly higher for the ice free than for the ice covered waters (and DSi and in fact lower) and similar results were also observed in Palmer et al. (2013). Whilst our data therefore appears at odds with the expected trends, it possibly reflects enhanced phytoplankton nutrient uptake in the ice free water mass (Cermeño et al., 2006). We return to this point below.
Phytoplankton biomass and size structure observed in our study agree well with values for summer Arctic phytoplankton communities previously reported in the same region (Coupel et al., 2012, 2015). Our range and spatial distribution for Chl-a is consistent with Coupel et al. (2015), who showed high mean concentrations (~1 mg m−3) on the Chukchi shelf compared to <0.1 mg m−3 further north. Large cells, such as diatoms Chaetoceros sp., Fragilaria sp., Cylindrotheca sp., and dinoflagellates dominate the Bering Strait and Chukchi shelf (Coupel et al., 2012), and thus presumably contribute to the high micro-phytoplankton fraction found throughout this similar area (Supplementary Figure 2B). In contrast, prasinophytes such as Micromonas sp. (<2 μm diameter) mainly dominate surface waters with low Chl-a (< 0.1 mg m−3), i.e., values consistent with our pico-phytoplankton fraction (Supplementary Figure 2D). Nutrient availability is often the major factor influencing phytoplankton size structure (e.g., Maranón et al., 2015), and we observed larger cell fractions (and more Chl-a biomass) associated with slightly more (but less DSi and ) within the ice free waters. Decoupling between dissolved nutrient supply and apparent concentrations may reflect alternate utilization rates by prevailing phytoplankton communities (Cermeño et al., 2006), and thus it is plausible that nutrients may have been consumed and invested into biomass (higher Chl-a) in the ice-free waters immediately prior to the observation period. This notion is supported by the significant negative relationship between nutrient (, DSi) and micro%, (: r = −0. 42, p < 0.01; DSi: r = −0.3, p = 0.04, spearman, Supplementary Figure 5), suggesting a large draw down by diatoms in the ice free region (see also Lewis et al., 1996), and the increase in large phytoplankton in parallel with total biomass is in agreement with many studies indicating fast opportunistic growth by diatoms in response to nutrient and light availability (Cermeño et al., 2005a; Kameda and Ishizaka, 2005;Brewin et al., 2010).
FRRf-based photophysiology parameters (i.e., Fv/Fm and ) are expected to covary with phytoplankton taxa (Moore et al., 2005; Suggett et al., 2009b), where larger Fv/Fm and smaller are expected for larger taxa (cells). Our FRRf values of Fv/Fm were higher for larger size phytoplankton dominated samples (Table 3), which further corroborates these dynamics. That said, Fv/Fm was also significantly positively correlated with Chla and micro% (r = 0.5 and 0.6, respectively; p < 0.01, Supplementary Figure 4), but negatively correlated with and DSi (r = −0.5 and −0.3, respectively; p < 0.05, Supplementary Figure 4) again consistent with possible recent relief from nutrient limitation for large size phytoplankton. Whilst is also expected to increase as cell size declines (Suggett et al., 2009b), we observed no differences in amongst sizes bins (p = 0.6, Table 3) and the reason for this is unclear. However, examining for the pico-phytoplankton dominated dataset in more detail along the R section from R17 to R11 (Figure 1), in fact demonstrates that was relatively large (mean ± SE, 553 ± 151 Å2 quanta−1) compared to the P section (P27 to P21; 405 ± 70 Å2 quanta−1, Supplementary Figure 3D) suggesting additional localized environmental regulation of within this region that presumably confounds the role of taxa alone in predominantly influencing .
Phytoplankton Size Related ETR, Production, and KC Variation in the Summer Arctic Ocean
Whilst values of were unrelated to phytoplankton size (see above, Table 3), both and Fv/Fm were higher for the larger size fractions (fmicro and fnano) (Table 3). Higher values of both Fv/Fm and are expected for larger size phytoplankton (Cermeño et al., 2005b; Giannini and Ciotti, 2016) and from laboratory cultures (Suggett et al., 2009a; Blache et al., 2011), suggesting larger cell phytoplankton are indeed growing under more favorable conditions (Cermeño et al., 2005a,b). Larger phytoplankton dominating in the ice free area were acclimated to higher light regimes as compared to those under ice cover (Ek: 455 ± 23 vs. 218 ± 18 μmol quanta m−2 s−1), which also explains higher achieved for this group (Schuback et al., 2017, Table 4). Average surface instantaneous PAR was ca. 190 μmol quanta m−2 s−1 (=13 mol quanta m−2 d−1) and hence below values of Ek, suggest that phytoplankton in both ice free and ice cover waters were growing under light limitation, and as such one would expect PAR and ETR to highly co-vary (Supplementary Figure 5A, Table 4, Hancke et al., 2015).
Values of were higher in samples where the large size fraction dominated (Table 4), indicating that larger phytoplankton have higher photosynthetic efficiency when growing under optimum environmental conditions, such as higher light, temperature and nutrients (Palmer et al., 2013). Higher Fv/Fm and enhanced photochemical efficiency of PSII for larger phytoplankton dominated samples may provide a possible mechanism to account for the higher (Cermeño et al., 2005b). Furthermore, phytoplankton acclimated to higher irradiance appeared to lower Chl-a concentration per cell, leading to an increase of Chl-a normalized productivity, which also explains our results that value appeared larger in the ice free region than in the ice cover area.
Concomitant changes in ETRs and C-uptake rates resulted in lower values of quantum requirement for carbon fixation (i.e., KC) for f micro than for f nano and f pico (16.8 ± 1.8 vs. 24.0 ± 1.3 and 19.4 ± 1.0 mol e− (mol C)−1). This observation (lowest KC was observed for f micro, Table 4) is consistent with the observations of Suggett et al. (2009a) that KC was smallest for diatoms among six different eukaryotic algal taxa grown under identical nutrient replete conditions in the laboratory but contrasts with our recent observations from the East China Sea where KC was higher for the large phytoplankton dominated community (Zhu et al., 2017). Phytoplankton productivity is however expected to vary under different environmental conditions (e.g., temperature, light, nutrient etc.) even for the same size community (Shiomoto et al., 1997; Staehr et al., 2002; Halsey et al., 2011; Zhu et al., 2017), and confirms that both environment and taxonomy interact to regulate KC variation (Lawrenz et al., 2013).
Light availability has previously been shown to strongly regulate KC (e.g., Brading et al., 2013; Zhu et al., 2016), and we therefore examined the variation of PAR-KC relationships as a result of phytoplankton community changes as per Zhu et al. (2016, 2017). Spearman correlation and nMDS analyses revealed that PAR indeed had the highest correlation coefficient with KC (Supplementary Table 2; Supplementary Figure 6, r = 0.66, p < 0.001), which is consistent with our previous results (Zhu et al., 2016, 2017). Changes in light availability drive an increase in the need to dissipate absorbed excitation energy through non-photochemical dissipation (McKew et al., 2013) and hence a positive association between KC and NPQ may also be expected, as broadly observed previously (Schuback et al., 2015, 2016, 2017; Hughes et al., 2018b; Ryan-Keogh et al., 2018). Since the KC of this study was derived from ETR and primary productivity in daily scales, similar to the method applied for daily ETR calculation, we also integrated the NPQNSV values according to their light dependent functions (Supplementary Figure 7A). However, no positive relationship between NPQNSV and KC was evident for this data set (Supplementary Figure 7B). Lack of a relationship (or negative relationship) between NPQ or PAR with KC was also reported before (Schuback et al., 2017; Ryan-Keogh et al., 2018). Whilst the reason is not well-known yet, it may reflect a decoupling of the NPQNSV (or PAR)-KC relationship under relatively low light (Schuback et al., 2017) and further investigation is needed.
Lower vs. higher KC observed for larger vs. smaller phytoplankton (i.e., f micro and f pico+nano) resulted in differences in PAR–KC linear regressions (Figure 4D), confirming that knowledge of the dominant phytoplankton taxa (or at least size class) present is crucial for the improvement of light-dependent retrieval of KC (Zhu et al., 2017). The smaller slope value of the PAR–KC linear regression for large phytoplankton, presumably diatoms, suggests that under relatively high light intensities micro-phytoplankton have a higher efficiency of electron usage for carbon fixation. When grown at higher and/or fluctuant irradiances, warmer temperature and without nutrient limitation, diatoms tend to express higher Fv/Fm values (Cermeño et al., 2005b; Suggett et al., 2009b), which inherently increases the transfer of excitation energy to the PSII reaction center to sustain electron transport activity compared to other species (Owens, 1986; Ott et al., 1999; Nymark et al., 2009; Brunet and Lavaud, 2010). Higher Fv/Fm values lead to higher Chl-a normalized C-assimilation rates (Falkowski, 1980; Zhao et al., 2015). Such inherent physiology may explain the lower KC observed for f micro than for f pico+nano, especially when daily PAR was relatively high (i.e., >20 mol quanta m−2 d−1, Figure 4D).
Contrasting PAR- KC Estimate Models Between Different Study Regions
A major factor in the power of FRRf-type sensors is the potential for describing primary productivity over extremely broad but resolute temporal and spatial scales (Fujiki et al., 2008; Suggett et al., 2009b; Cheah et al., 2011; Hughes et al., 2018a). To further improve the accuracy with which carbon uptake rates are estimated from FRRf, many recent studies have attempted to develop KC prediction models from environmental variables to avoid errors introduced by assuming KC is constant (Lawrenz et al., 2013; Schuback et al., 2015; Zhu et al., 2016, 2017; Hughes et al., 2018b). Light variability appears to be the primary driver of variability in KC, which is reflective of ETRs decoupled from C-fixation under light stress. However, it is important to note that the tight correlation between PAR (or NPQ) and KC may be due to the two parameters not being entirely independent of KC, since PAR (or Fv) is used in the derivation of both ETR (or NPQ) and KC, (Schuback et al., 2015; Zhu et al., 2017). Nevertheless, using NPQ or PAR as a predictor of KC is highly desirable over regional scales (Schuback et al., 2015, 2016, 2017; Zhu et al., 2016, 2017; Hughes et al., 2018b; and Ryan-Keogh et al., 2018). While examining the empirical light- KC regression with larger data sets, however, variations of this relationship (e.g., their regression slopes differ) have been observed within different water layers, water mass types (Schuback et al., 2017; Zhu et al., 2017; Ryan-Keogh et al., 2018), nutrient conditions (Schuback et al., 2016; Hughes et al., 2018b) as well as phytoplankton taxa (Robinson et al., 2014; Zhu et al., 2017 and this study), which limits the application of this approach for wide use. Thus, further understanding variability of light-KC relationships collected using similar approaches from datasets spanning multiple oceanic regions is highly desirable.
We compared several PAR- KC relationships developed from upper water samples from three different ocean regions, including a semi-closed bay (Ariake Bay, AB, Zhu et al., 2016), marginal sea (East China Sea, ECS, Zhu et al., 2017) and the Arctic Ocean (AO, this study) The highest regression slope value (0.98) was observed for the Arctic Ocean dataset, followed by the East China Sea (0.74), and the lowest value for Ariake Bay (0.51) (Figure 5A). ANCOVA analysis revealed that these slopes were only different for AO and AB datasets (df = 1, p = 0.01), and not for AO and ECS or ECS and AB (df = 1, p = 0.3). Supplementary Table 3 summarizes the physical and biochemical parameters associated with these PAR- KC regression slope values across the three regions. Subsequent correlation analysis of environmental variables vs. KC-light regression slope values revealed that accounting for phytoplankton size structures yields better correlation with slope value (spearman, r = 0.98 for pico-phytoplankton fraction, p = 0.09, and = −0.94 for micro-phytoplankton fraction, p = 0.2) than other environmental parameters (Table 5, Figures 5B,C). As such, phytoplankton community composition appears to be a key descriptor of the overall phytoplankton physiological status that integrates immediate and historical environmental exposure (Boyd and Abraham, 2001; Koblizek et al., 2001; Cermeño et al., 2005a,b; Moore et al., 2005; Suggett et al., 2009a,b), better than the immediate environmental state, such as nutrient concentration (Behrenfeld et al., 2006; Moore et al., 2008) or phytoplankton species (Geider et al., 1986; Cermeño et al., 2005b) that may in fact be decoupled from the physiological status. We therefore observed that the phytoplankton community composition co-varies well with KC as well as PAR-KC regression slopes (Figures 5B,C).
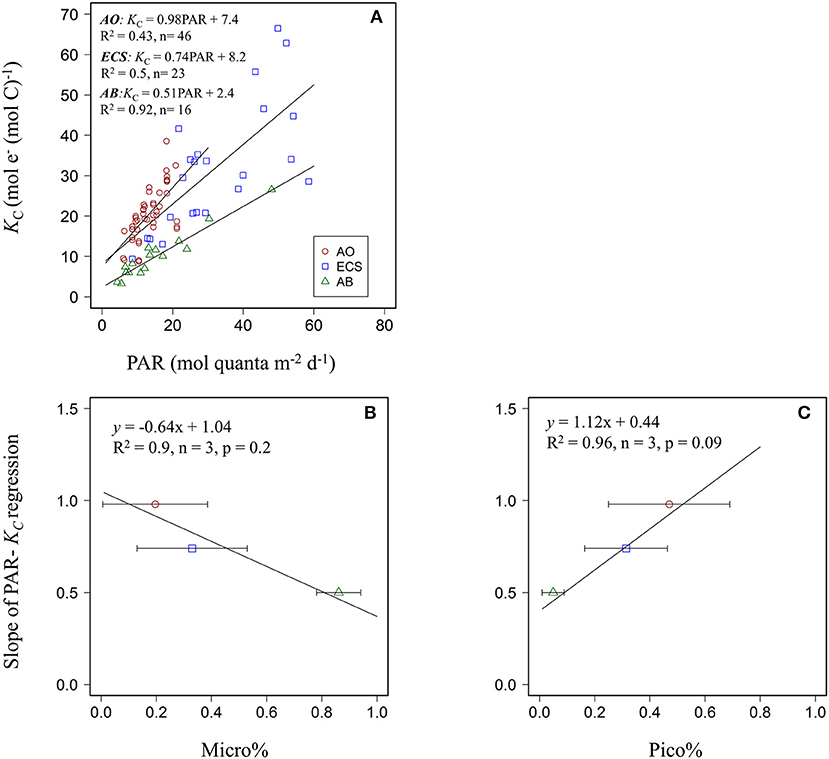
Figure 5. (A) Scatter plots of daily PAR (mol quanta m−2 d−1) and KC (mol e− (mol C)−1) of upper water for Arctic Ocean (AO), East China Sea (ECS) and Ariake Bay (AB). (B) Linear relationship between large phytoplankton structure (Micro%) and slope of PAR- KC linear regression derived from 3 datasets (C) same description as it in (B) except the size fraction is for small phytoplankton (Pico %). Horizontal bars indicate the standard deviations of data. Blue, green and red colors in figures represent different dataset for three regions.
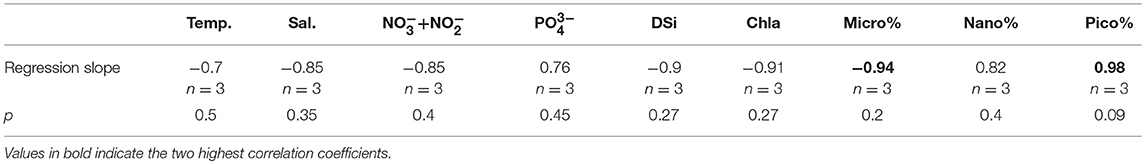
Table 5. Pearson correlation coefficients for correlations between slopes of Par-KC regression derived from 3 datasets and environmental variables.
Here we show a novel correlated factor of KC in the complex summer waters of the Arctic Ocean. Our observations suggest that a large fraction of the variation in KC can be best explained by PAR on a daily timescale. However, we acknowledge that in this study, the limitation of approaches, for example the correction method for σPSII, the assumption for nPSII(0.002 mol RCII [mol Chla]−1), ignoring the variability of ETR-I curve over the daytime and lack consideration of UV effects on primary production would raise uncertainty and weaken our results (Gao et al., 2007; Schuback et al., 2016). We thus applied an uncertainty assessment of the linear relationship between PAR and KC, as per (Zhu et al., 2017), to examine its reliability. Specifically, ±20% and ±50% random error was added to ETR, respectively, to account for the overall uncertainty caused by the methods limitation. Determination of uncertainty totally repeated 50 times. The resultant KC was calculated for each new ETR and and compared against daily PAR, as per the original data. We then calculated the mean for each correlation coefficient (R2), slope and intercept from the entire 50 simulations combined, which is KC = 1.03 × PAR + 6.8 with R2 = 0.40 and KC = 1.2 × PAR + 5.8 with R2 = 0.38, for 20% and 50% error, respectively. Compared to the original data (KC = 0.98 × PAR + 7.4, R2 = 0.43), although absolute terms changed and R2 decreased with error adding, the extent of covariance explained by a linear model is broadly equivalent, which confirms that the linear relationship between light and KC observed in the Arctic Ocean is robust.
Further comparing the present data from the Arctic with parallel data sets collected elsewhere, allows us to constrain factors regulating variance of KC as well as PAR- KC regressions. Our study thus shows, for the first time, that the variation of the PAR- KC relationship under different ocean regimes can be correlated by phytoplankton size structure, which partially overcomes previous FRRf application limitations and represents a step forward for the application of the FRRf technique to derive net primary productivity. Moreover, the cell size (or particle size), is actually a parameter quite amiable to monitoring by optical sensors (i.e., backscattering, which is also a satellite product, as per Dall'Olmo et al., 2009), and our study provides the opportunity for combing FRRf and other techniques to estimate primary productivity across broad regions.
Author Contributions
We confirm that all individuals listed as authors have agreed to be listed as such and approve the submitted version of the manuscript. YZ analyzed the FRRf and 14C data, developed the methods of this study and wrote the first draft of this manuscript. DS was responsible for the partial FRRf-ETR calculation and data analyses. He contributed to the interpretation of the results, manuscript writing and revision. CL and FL contributed to the FRRf and primary productivity in field measurements. JH and LL were responsible for nutrient and Chl-a data collection and analyzing. JI and JG specified the structure and the logic of this manuscript and contributed to the manuscript revision. QH developed the research design and interpreted the nutrient and phytoplankton community results. He also contributed to the writing and revisions of the manuscript.
Funding
This research was supported by the National Natural Science Foundation of China (Grant No: 41206181), Special Foundation for Polar Research (Grant No: CHINARE2016-03-05), and partially supported by Global Change Observation Mission-Climate (GCOM-C) Project of Japan Aerospace Exploration Agency. The contribution by DS was supported by an Australian Research Council Future Fellowship (FT130100202); the contribution by JG was supported by the National Aeronautics and Space Administration (NNX16AD40G).
Conflict of Interest Statement
The authors declare that the research was conducted in the absence of any commercial or financial relationships that could be construed as a potential conflict of interest.
Acknowledgments
We would like to thank the captain, officers and crew of the R/V Chinare for their admirable assistance during onboard sampling and measurements. Many thanks to Dr. Yinning Zhang for the FRRf technique and data analysis support.
Supplementary Material
The Supplementary Material for this article can be found online at: https://www.frontiersin.org/articles/10.3389/fmars.2019.00275/full#supplementary-material
References
Ardyna, M., Babin, M., Gosselin, M., Devred, E., Rainville, L., and Tremblay, J. É. (2014). Recent Arctic Ocean sea ice loss triggers novel fall phytoplankton blooms. Geophys. Res. Lett. 41, 6207–6212. doi: 10.1002/2014GL061047
Ardyna, M., Gosselin, M., Michel, C., Poulin, M., and Tremblay, J. É. (2011). Environmental forcing of phytoplankton community structure and function in the Canadian High Arctic: contrasting oligotrophic and eutrophic regions. Mar. Ecol. Prog. Ser. 442, 37–57. doi: 10.3354/meps09378
Arrigo, K. R. G., and van Dijken, G. L. (2004). Annual cycles of sea ice and phytoplankton near Cape Bathurst, southeastern Beaufort Sea, Canadian Arctic. Geophys. Res. Lett. 31:L08304. doi: 10.1029/2003GL018978
Arrigo, K. R. G., van Dijken, G. L., and Pabi, S. (2008). Impact of a shrinking Arctic ice cover on marine primary production. Geophys. Res. Lett. 35:L19603. doi: 10.1029/2008GL035028
Behrenfeld, M. J., O'Malley, R. T., Siegel, D. A., McClain, C. R., Sarmiento, J. L., Feldman, G. C., et al. (2006). Climate-driven trends in contemporary ocean productivity. Nature 444:752. doi: 10.1038/nature05317
Benner, R., Louchouarn, P., and Amon, R. M. (2005). Terrigenous dissolved organic matter in the Arctic Ocean and its transport to surface and deep waters of the North Atlantic. Global Biogeochem. Cycles 19:2398. doi: 10.1029/2004GB002398
Blache, U., Jakob, T., Su, W., and Wilhelm, C. (2011). The impact of cell-specific absorption properties on the correlation of electron transport rates measured by chlorophyll fluorescence and photosynthetic oxygen production in planktonic algae. Plant. Physiol. Biochem. 49, 801–808. doi: 10.1016/j.plaphy.2011.04.010
Boyd, P. W., and Abraham, E. R. (2001). Iron-mediated changes in phytoplankton photosynthetic competence during SOIREE. Deep. Sea. Res. II 48, 2529–2550. doi: 10.1016/S0967-0645(01)00007-8
Brading, P., Warner, M. E., Smith, D. J., and Suggett, D. J. (2013). Contrasting modes of inorganic carbon acquisition amongst Symbiodinium (Dinophyceae) phylotypes. New. Phytol. 200, 432–442. doi: 10.1111/nph.12379
Brewin, R. J. W., Sathyendranath, S., Hirata, T., Lavender, S. J., Barciela, R. M., and Hardman-Mountford, N. J. (2010). A three component model of phytoplankton size class for the Atlantic Ocean. Ecol. Model. 221, 1472–1483. doi: 10.1016/j.ecolmodel.2010.02.014
Brown, Z. W., and Arrigo, K. R. (2012). Contrasting trends in sea ice and primary production in the Bering Sea and Arctic Ocean. ICES J. Mar. Sci. 69, 1180–1193. doi: 10.1093/icesjms/fss113
Brunet, C., and Lavaud, J. (2010). Can the xanthophyll cycle help extract the essence of the microalgal functional response to a variable light environment? J Plankton Res. 32,1609–1617. doi: 10.1093/plankt/fbq104
Cai, W. J., Chen, L., Chen, B., Gao, Z., Lee, S. H., Chen, J., et al. (2010). Decrease in the CO2 uptake capacity in an ice-free Arctic Ocean basin. Science 329, 556–559. doi: 10.1126/science.1189338
Cermeño, P., Estévez-Blanco, P., Maranón, E., and Fernóndez, E. (2005b). Maximum photosynthetic efficiency of size-fractionated phytoplankton assessed by 14C uptake and fast repetition rate fluorometry. Limnol. Oceanogr. 50, 1438–1446. doi: 10.4319/lo.2005.50.5.1438
Cermeño, P., Maranón, E., Pérez, V., Serret, P., Fernández, E., and Castro, C. G. (2006). Phytoplankton size structure and primary production in a highly dynamic coastal ecosystem (Ría de Vigo, NW-Spain): seasonal and short-time scale variability. Estuar. Coast. Shelf. Sci. 67, 251–266. doi: 10.1016/j.ecss.2005.11.027
Cermeño, P., Marañón, E., Rodríguez, J., and Fernández, E. (2005a). Large-sized phytoplankton sustain higher carbon-specific photosynthesis than smaller cells in a coastal eutrophic ecosystem. Mar. Ecol. Prog. Ser. 297, 51–60. doi: 10.3354/meps297051
Cheah, W., Mcminn, A., Griffiths, F. B., Westwood, K. J., Wright, S. W., Molina, E., et al. (2011). Assessing Sub-Antarctic Zone primary productivity from fast repetition rate fluorometry. Deep. Sea. Res. II 58, 2179–2188. doi: 10.1016/j.dsr2.2011.05.023
Coupel, P., Jin, H. Y., Joo, M., Horner, R., Bouvet, H. A., Sicre, M. A., et al. (2012). Phytoplankton distribution in unusually low sea ice cover over the Pacific Arctic. Biogeosciences 9, 4835–4850. doi: 10.5194/bg-9-4835-2012
Coupel, P., Ruiz-Pino, D., Sicre, M. A., Chen, J. F., Lee, S. H., Schiffrine, N., et al. (2015). The impact of freshening on phytoplankton production in the Pacific Arctic Ocean. Prog. Oceanogr. 131, 113–125. doi: 10.1016/j.pocean.2014.12.003
Dall'Olmo, G., Westberry, T. K., Behrenfeld, M. J., Boss, E., and Slade, W. H. (2009). Significant contribution of large particles to optical backscattering in the open ocean. Biogeosciences 6, 947–967. doi: 10.5194/bg-6-947-2009
Evans, C. A., Reilly, J. E. O., and Thomas, J. P. (1987). “A Handbook for the Measurement of Chlorophyll a and Primary Production,” in BIOMASS Science Series, Vol. 8, eds C. A. Evans, J. E. O'Reilly, and J. P. Thomas, (College Station, TX: Texas A&M University), 114.
Falkowski, P. (1980). Primary Productivity in the Sea. Boston, MA: Springer. doi: 10.1007/978-1-4684-3890-1
Fernández-Méndez, M., Katlein, C., Rabe, B., Nicolaus, M., Peeken, I., Bakker, K., et al. (2015). Photosynthetic production in the central Arctic Ocean during the record sea-ice minimum in 2012. Biogeosciences 12, 3525–3549. doi: 10.5194/bg-12-3525-2015
Fetterer, F., Stewart, J. S., and Meier, W. (2015). MASAM2: Daily 4 km Arctic Sea Ice Concentration, Version 1. [Indicate subset used]. (Boulder, CO: NSIDC: National Snow and Ice Data Center).
Frey, K. E., Maslanik, J. A., Kinney, J. C., and Maslowski, W. (2014). “Recent variability in sea ice cover, age, and thickness in the Pacific Arctic region,” in The Pacific Arctic Region (Dordrecht:Springer), 31–63. doi: 10.1007/978-94-017-8863-2_3
Fujiki, T., Hosaka, T., Kimoto, H., Ishimaru, T., and Saino, T. (2008). In situ observation of phytoplankton productivity by an underwater profiling buoy system: use of fast repetition rate fluorometry. Mar. Ecol. Prog. Ser. 353, 81–88. doi: 10.3354/meps07151
Gao, K., Guan, W., and Helbling, E. W. (2007). Effects of solar ultraviolet radiation on photosynthesis of the marine red tide alga Heterosigma akashiwo (Raphidophyceae). J. Photochem. Photobiol. B 86,140–148. doi: 10.1016/j.jphotobiol.2006.05.007
Geider, R. J., Platt, T., and Raven, J. A. (1986). Size dependence of growth and photosynthesis in diatoms: a synthesis. Mar. Ecol. Prog. Ser. 30, 93–104. doi: 10.3354/meps030093
Giannini, M. F. C., and Ciotti, M. (2016). Parameterization of natural phytoplankton photo-physiology: effects of cell size and nutrient concentration. Limnol. Oceanogr. 61, 1495–1512. doi: 10.1002/lno.10317
Grasshoff, K., Kremling, K., and Ehrhardt, M. (1999). Methods of Seawater Analysis. Weinheim: WileyVCH. doi: 10.1002/9783527613984
Graversen, R. G., Mauritsen, T., Tjernström, M., Källén, E., and Svensson, G. (2008). Vertical structure of recent Arctic warming. Nature 451:53. doi: 10.1038/nature06502
Halsey, K. H., and Jones, B. M. (2015). Phytoplankton strategies for photosynthetic energy allocation. Annu. Rev. Mar. Sci. 7, 265–297. doi: 10.1146/annurev-marine-010814-015813
Halsey, K. H., Milligan, A. J., and Behrenfeld, M. J. (2011). Linking time-dependent carbon- fixation efficiencies in Dunaliella tertiolecta (Chlorophyceae) to underlying metabolic pathways. J. Phycol. 47, 66–76. doi: 10.1111/j.1529-8817.2010.00945.x
Hancke, K., Dalsgaard, T., Sejr, M. K., Markage, S., and Glud, R. N. (2015). Phytoplankton productivity in an Arctic Fjord (West Greenland): estimating electron requirements for carbon fixation and oxygen production. PLoS ONE 10:e0133275. doi: 10.1371/journal.pone.0133275
Hill, V. J., Ardyna, M., Lee, S. H., and Varela, D. E. (2017). Decadal trends in phytoplankton production in the Pacific Arctic Region from 1950 to 2012. Deep. Sea. Res. II 152, 82–94. doi: 10.1016/j.dsr2.2016.12.015
Hill, V. J., Matrai, P. A., Olson, E., Suttles, S., Steele, M., Codispoti, L. A., et al. (2013). Synthesis of integrated primary production in the Arctic Ocean: II. In situ and remotely sensed estimates. Prog. Oceanogr. 110, 107–125. doi: 10.1016/j.pocean.2012.11.005
Holm-Hansen, O., Lorenzen, C. J., Holmes, R. W., and Strickland, J. D. (1965). Fluorometric determination of chlorophyll. ICES J. Mar. Sci. 30, 3–15. doi: 10.1093/icesjms/30.1.3
Hoppe, C. J., Holtz, L. M., Trimborn, S., and Rost, B. (2015). Ocean acidification decreases the light use efficiency in an Antarctic diatom under dynamic but not constant light. New. Phytol. 207, 159–171. doi: 10.1111/nph.13334
Hughes, D., Campbell, D., Doblin, M. A., Kromkamp, J., Lawrenz, E., Moore, C. M., et al. (2018a). Roadmaps and Detours: Active chlorophyll-a assessments of primary productivity across marine and freshwater systems. Environ. Sci. Technol. 52, 12039–12054. doi: 10.1021/acs.est.8b03488
Hughes, D., Varkey, D., Doblin, M. A., Ingleton, T., Mcinnes, A., Ralph, P. J., et al. (2018b). Impact of nitrogen availability upon the electron requirement for carbon fixation in Australian coastal phytoplankton communities. Limnol. Oceanogr. 63, 1891–1910. doi: 10.1002/lno.10814
Jassby, A. D., and Platt, T. (1976). Mathematical formulation of the relationship between photosynthesis and light for phytoplankton. Limnol. Oceanogr. 21, 540–547. doi: 10.4319/lo.1976.21.4.0540
Kameda, T., and Ishizaka, J. (2005). Size-fractionated primary production estimated by a two-phytoplankton community model applicable to ocean color remote sensing. J. Oceanogr. 61, 663–672. doi: 10.1007/s10872-005-0074-7
Kirk, J. T. O. (1994). Light and Photosynthesis in Aquatic Ecosystems, 2nd Edn, Cambridge: Cambridge University Press. doi: 10.1017/CBO9780511623370
Koblizek, M., Kaftan, D., and Nedbal, L. (2001). On the relationship between the non-photochemical quenching of the chlorophyll fluorescence and the Photosystem II light harvesting efficiency. A repetitive flash fluorescence induction study. Photosynth. Res. 68, 141–152. doi: 10.1023/A:1011830015167
Kolber, Z. S., and Falkowski, P. G. (1993). Use of active fluorescence to estimate phytoplankton photosynthesis in situ. Limnol. Oceanogr. 38, 1646–1665. doi: 10.4319/lo.1993.38.8.1646
Kolber, Z. S., Prášil, O., and Falkowski, P. G. (1998). Measurements of variable chlorophyll fluorescence using fast repetition rate techniques: defining methodology and experimental protocols. Biochim. Biophys. Acta. 1367, 88–106. doi: 10.1016/S0005-2728(98)00135-2
Kromkamp, J. C., Dijkman, N. A., Peene, J., Simis, S. G., and Gons, H. J. (2008). Estimating phytoplankton primary production in Lake IJsselmeer (The Netherlands) using variable fluorescence (PAM-FRRF) and C-uptake techniques. Eur. J. Phycol. 43, 327–344. doi: 10.1080/09670260802080895
Kulk, G., van de Poll, W. H., and Buma, A. G. (2018). Photophysiology of nitrate limited phytoplankton communities in Kongsfjorden, Spitsbergen. Limnol. Oceanogr. 63, 2606–2617. doi: 10.1002/lno.10963
Lawrenz, E., Silsbe, G., Capuzzo, E., Ylöstalo, P., Forster, R. M., et al. (2013). Predicting the electron requirement for carbon fixation in seas and oceans. PLoS ONE 8:e58137. doi: 10.1371/journal.pone.0058137
Lewis, E. L., Ponton, D., Legendre, L., and Leblanc, B. (1996). Springtime sensible heat, nutrients and phytoplankton in the Northwater Polynya, Canadian Arctic. Cont. Shelf. Res. 16, 1775–1792. doi: 10.1016/0278-4343(96)00015-5
Li, W. K., McLaughlin, F. A., Lovejoy, C., and Carmack, E. C. (2009). Smallest algae thrive as the Arctic Ocean freshens. Science 326, 539–539. doi: 10.1126/science.1179798
Maranón, E., Cermeño, P., Latasa, M., and Tadonléké, R. D. (2015). Resource supply alone explains the variability of marine phytoplankton size structure. Limnol. Oceanogr. 60, 1848–1854. doi: 10.1002/lno.10138
McKew, B. A., Davey, P., Finch, S. J., Hopkins, J., Lefebvre, S. C., Metodiev, M. V., et al. (2013). The trade-off between the light-harvesting and photoprotective functions of fucoxanthin-chlorophyll proteins dominates light acclimation in Emiliania huxleyi (clone CCMP 1516). New. Phytol. 200, 74–85. doi: 10.1111/nph.12373
McLaughlin, F. A., and Carmack, E. C. (2010). Deepening of the nutricline and chlorophyll maximum in the Canada Basin interior, 2003–2009. Geophys. Res. Lett. 37:L24602. doi: 10.1029/2010GL045459
McPhee, M. G., Stanton, T. P., Morison, J. H., and Martinson, D. G. (1998). Freshening of the upper ocean in the Arctic: is perennial sea ice disappearing? Geophys. Res. Lett. 25, 1729–1732. doi: 10.1029/98GL00933
Mills, M. M., Brown, Z. W., Laney, S. R., Ortega-Retuerta, E., Lowry, K. E., van Dijken, G. L., et al. (2018). Nitrogen limitation of the summer phytoplankton and heterotrophic prokaryote communities in the Chukchi Sea. Front. Mar. Sci. 5:362. doi: 10.3389/fmars.2018.00362
Mino, Y., Matsumura, S., Lirdwitayaprasit, T., Fujiki, T., Yanagi, T., and Saino, T. (2014). Variations in phytoplankton photo-physiology and productivity in a dynamic eutrophic ecosystem: a fast repetition rate fluorometer-based study. J. Plankton. Res. 36, 398–411. doi: 10.1093/plankt/fbt118
Moore, C. M., Lucas, M. I., Sanders, R., and Davidson, R. (2005). Basin-scale variability of phytoplankton bio-optical characteristics in relation to bloom state and community structure in the Northeast Atlantic. Deep. Sea Res. I 52, 401–419. doi: 10.1016/j.dsr.2004.09.003
Moore, C. M., Mills, M. M., Langlois, R., Milne, A., Achterberg, E. P., La Roche, J., et al. (2008). Relative influence of nitrogen and phosphorous availability on phytoplankton physiology and productivity in the oligotrophic sub-tropical North Atlantic Ocean. Limnol. Oceanogr. 53, 291–305. doi: 10.4319/lo.2008.53.1.0291
Moore, C. M., Suggett, D. J., Hickman, A. E., Kim, Y.-N., Tweddle, J. F., et al. (2006). Phytoplankton photoacclimation and photoadaptation in response to environmental gradients in a shelf sea. Limnol. Oceanogr. 51, 936–949. doi: 10.4319/lo.2006.51.2.0936
Nielsen, E. S. (1952). The use of radio-active carbon (C14) for measuring organic production in the sea. J. Cons. 18, 117–140. doi: 10.1093/icesjms/18.2.117
Ning, X., and Liu, Z. (1988). The patterns of distribution of chlorophyll a and primary production in coastal upwelling area off Zhejiang, Acta Oceanol. Sin. 7, 126–136.
Nymark, M., Valle, K. C., Brembu, T., Hancke, K., Winge, P., Andresen, K., et al. (2009). An integrated analysis of molecular acclimation to high light in the marine diatom Phaeodactylum tricornutum. PLoS ONE 4:e7743. doi: 10.1371/journal.pone.0007743
Ott, T., Clarke, J., Birks, K., and Johnson, G. (1999). Regulation of the photosynthetic electron transport chain. Planta 209, 250–258. doi: 10.1007/s004250050629
Owens, T. G. (1986). Light-harvesting function in the diatom Phaeodactylum tricornutum. II. Distribution of excitation energy between the photosystems. Plant. Physiol. 80, 739–746. doi: 10.1104/pp.80.3.739
Oxborough, K., and Baker, N. R. (1997). Resolving chlorophyll a fluorescence images of photosynthetic efficiency into photochemical and non-photochemical components–calculation of qP and Fv-/Fm-; without measuring Fo. Photosynth. Res. 54,135–142. doi: 10.1023/A:1005936823310
Pabi, S., van Dijken, G. L., and Arrigo, K. R. (2008). Primary production in the Arctic Ocean, 1998– 2006. J. Geophys. Res. 113:C08005. doi: 10.1029/2007JC004578
Palmer, M. A., Van Dijken, G. L., Mitchell, B. G., Seegers, B. J., Lowry, K. E., Mills, M. M., et al. (2013). Light and nutrient control of photosynthesis in natural phytoplankton populations from the Chukchi and Beaufort seas, Arctic Ocean. Limnol. Oceanogr. 58, 2185–2205. doi: 10.4319/lo.2013.58.6.2185
Pedrós-Alió, C., Potvin, M., and Lovejoy, C. (2015). Diversity of planktonic microorganisms in the Arctic Ocean. Prog. Oceanogr. 139, 233–243. doi: 10.1016/j.pocean.2015.07.009
Peralta-Ferriz, C., and Woodgate, R. A. (2015). Seasonal and interannual variability of pan-Arctic surface mixed layer properties from 1979 to 2012 from hydrographic data, and the dominance of stratification for multiyear mixed layer depth shoaling. Prog. Oceanogr. 134, 19–53. doi: 10.1016/j.pocean.2014.12.005
R Core Team (2014). R: A Language and Environment For Statistical Computing. (Vienna: R Foundation for Statistical Computing), Available online at: http://www.R-project.org/
Ralph, P. J., Wilhelm, C., Lavaud, J., Jakob, T., Petrou, K., and Kranz, S. A. (2010). “Fluorescence as a tool to understand changes in photosynthetic electron flow regulation,” in Chlorophyll a Fluorescence in Aquatic Sciences: Methods and Applications, eds D. J. Suggett, O. Prasil, and M. A. Borowitzka (Netherlands: Springer), 75–89 doi: 10.1007/978-90-481-9268-7_4
Regaudie-de-Gioux, A., Lasternas, S., Agust,í, S., and Duarte, C. M. (2014). Comparing marine primary production estimates through different methods and development of conversion equations. Front. Mar. Sci. 1:19. doi: 10.3389/fmars.2014.00019
Robinson, C., Suggett, D. J., Cherukuru, N., Ralph, P. J., and Doblin, M. A. (2014). Performance of fast repetition rate fluorometry based estimates of primary productivity in coastal waters. J. Mar. Syst. 139, 299–310. doi: 10.1016/j.jmarsys.2014.07.016
Ryan-Keogh, T. J., Thomalla, S. J., Little, H., and Melanson, J. R. (2018). Seasonal regulation of the coupling between photosynthetic electron transport and carbon fixation in the Southern Ocean. Limnol. Oceanogr. 63, 1856–1876. doi: 10.1002/lno.10812
Schuback, N., Flecken, M., Maldonado, M. T., and Tortell, P. D. (2016). Diurnal variation in the coupling of photosynthetic electron transport and carbon fixation in iron-limited phytoplankton in the NE subarctic Pacific. Biogeosciences 13, 1019–1035. doi: 10.5194/bg-13-1019-2016
Schuback, N., Hoppe, C. J., Tremblay, J. É., Maldonado, M. T., and Tortell, P. D. (2017). Primary productivity and the coupling of photosynthetic electron transport and carbon fixation in the Arctic Ocean. Limnol. Oceanogr. 62,898–921. doi: 10.1002/lno.10475
Schuback, N., Schallenberg, C., Duckham, C., Maldonado, M. T., and Tortell, P. D. (2015). Interacting effects of light and iron availability on the coupling of photosynthetic electron transport and CO2-assimilation in marine phytoplankton. PLoS ONE 10:e0133235. doi: 10.1371/journal.pone.0133235
Schuback, N., and Tortell, P. D. (2019). Diurnal regulation of photosynthetic light absorption, electron transport and carbon fixation in two contrasting oceanic environments. Biogeosciences 16, 1381–1399. doi: 10.5194/bg-16-1381-2019
Screen, J. A., and Simmonds, I. (2010). The central role of diminishing sea ice in recent Arctic temperature amplification. Nature 464:1334. doi: 10.1038/nature09051
Serreze, M. C., and Stroeve, J. (2015). Arctic sea ice trends, variability and implications for seasonal ice forecasting. Phil. Trans. R. Soc. A 373:159. doi: 10.1098/rsta.2014.0159
Shiomoto, A., Tadokoro, K., Monaka, K., and Nanba, M. (1997). Productivity of picoplankton compared with that of larger phytoplankton in the subarctic region. J. Plankton. Res. 19, 907–916. doi: 10.1093/plankt/19.7.907
Smetacek, V., and Nicol, S. (2005). Polar ocean ecosystems in a changing world. Nature 437:362. doi: 10.1038/nature04161
Staehr, P. A., Henriksen, P., and Markager, S. (2002). Photoacclimation of four marine phytoplankton species to irradiance and nutrient availability. Mar. Ecol. Prog. Ser. 238, 47–59. doi: 10.3354/meps238047
Steele, M., Ermold, W., and Zhang, J. (2008). Arctic Ocean surface warming trends over the past 100 years. Geophys. Res. Lett. 38:L12502. doi: 10.1029/2007GL031651
Suggett, D. J., Kraay, G., Holligan, P., Davey, M., Aiken, J., et al. (2001). Assessment of photosynthesis in a spring cyanobacterial bloom by use of a fast repetition rate fluorometer. Limnol. Oceanogr. 46, 802–810. doi: 10.4319/lo.2001.46.4.0802
Suggett, D. J., Maberly, S. C., and Geider, R. J. (2006a). Gross photosynthesis and lake community metabolism during the spring phytoplankton bloom. Limnol. Oceanogr. 51, 2064–2076. doi: 10.4319/lo.2006.51.5.2064
Suggett, D. J., Macintyre, H. L., and Geider, R. J. (2004). Evaluation of biophysical and optical determinations of light absorption by photosystem II in phytoplankton. Limnol. Oceanogr. Methods 2, 316–332. doi: 10.4319/lom.2004.2.316
Suggett, D. J., Macintyre, H. L., Kana, T. M., and Geider, R. J. (2009a). Comparing electron transport with gas exchange: parameterising exchange rates between alternative photosynthetic currencies for eukaryotic phytoplankton. Aquat. Microb. Ecol. 56, 147–162. doi: 10.3354/ame01303
Suggett, D. J., Moore, C. M., and Geider, R. J. (2010). “Estimating aquatic productivity from active fluorescence measurements,” in Chlorophyll a Fluorescence in Aquatic Sciences: Methods and Applications, eds D. J. Suggett, O. Prasil, and M. A. Borowitzka (Netherlands: Springer), 103–127.
Suggett, D. J., Moore, C. M., Hickman, A. E., and Geider, R. J. (2009b). Interpretation of fast repetition rate (FRR) fluorescence: signatures of phytoplankton community structure versus physiological state. Mar. Ecol. Prog. Ser. 376, 1–19. doi: 10.3354/meps07830
Suggett, D. J., Moore, C. M., Marañón, E., Omachi, C., Varela, R. A., Aiken, J., et al. (2006b). Photosynthetic electron turnover in the tropical and subtropical Atlantic Ocean. Deep. Sea. Res. II 53, 1573–1592. doi: 10.1016/j.dsr2.2006.05.014
Timmermans, M. L., Proshutinsky, A., Krishfield, R. A., Perovich, D. K., Richter-Menge, J. A., Stanton, T. P., et al. (2011). Surface freshening in the Arctic Ocean's Eurasian Basin: an apparent consequence of recent change in the wind-driven circulation. J. Geophys. Res. 116:C8. doi: 10.1029/2011JC006975
Tremblay, J. É., and Gagnon, J. (2009). “The effects of irradiance and nutrient supply on the productivity of Arctic waters: a perspective on climate change,” in Influence of Climate Change on the Changing Arctic and Sub-arctic Conditions, ed J. Nihoul (Springer), 73–93.
Wang, S., Ishizaka, J., Yamaguchi, H., Tripathy, S. C., Hayashi, M., Xu, Y., et al. (2014). Influence of the Changjiang River on the light absorption properties of phytoplankton from the East China Sea. Biogeosciences 11, 1759–1773. doi: 10.5194/bg-11-1759-2014
Wassmann, P., Duarte, C. M., Agusti, S., and Sejr, M. K. (2011). Footprints of climate change in the Arctic marine ecosystem. Glob. Chang. Biol. 17, 1235–1249. doi: 10.1111/j.1365-2486.2010.02311.x
Woodgate, R. A., Aagaard, K., and Weingartner, T. J. (2006). Interannual changes in the Bering Strait fluxes of volume, heat and freshwater between 1991 and 2004. Geophys. Res. Lett. 33:L15609. doi: 10.1029/2006GL026931
Xie, Y., Laws, E. A., Yang, L., and Huang, B. (2018). Diel patterns of variable fluorescence and carbon fixation of picocyanobacteria prochlorococcus-dominated phytoplankton in the South China Sea Basin. Front. Microbiol. 9:1589. doi: 10.3389/fmicb.2018.01589
Yamamoto-Kawai, M., McLaughlin, F. A., Carmack, E. C., Nishino, S., Shimada, K., and Kurita, N. (2009). Surface freshening of the Canada Basin, 2003–2007: River runoff vs. sea ice meltwater. J. Geophys. Res. 114:C1. doi: 10.1029/2008JC005000
Zhang, J. (2005). Warming of the arctic ice-ocean system is faster than the global average since the 1960s. Geophys. Res. Lett. 32:L19602. doi: 10.1029/2005GL024216
Zhao, Y., Wang, Y., and Quigg, A. (2015). The 24 hour recovery kinetics from N starvation in Phaeodactylum tricornutum and Emiliania huxleyi. J. Phycol. 51,726–738. doi: 10.1111/jpy.12314
Zhu, Y., Ishizaka, J., Tripathy, S. C., Wang, S., Mino, Y., Matsuno, T., et al. (2016). Variation of the photosynthetic electron transfer rate and electron requirement for daily net carbon fixation in Ariake Bay, Japan. J. Oceanogr. 72,761–777 doi: 10.1007/s10872-016-0370-4
Keywords: primary productivity, Arctic Ocean, ice free/cover, electron requirement for carbon fixation, phytoplankton community, FRRf
Citation: Zhu Y, Suggett DJ, Liu C, He J, Lin L, Le F, Ishizaka J, Goes J and Hao Q (2019) Primary Productivity Dynamics in the Summer Arctic Ocean Confirms Broad Regulation of the Electron Requirement for Carbon Fixation by Light-Phytoplankton Community Interaction. Front. Mar. Sci. 6:275. doi: 10.3389/fmars.2019.00275
Received: 30 November 2018; Accepted: 07 May 2019;
Published: 29 May 2019.
Edited by:
Hongbin Liu, Hong Kong University of Science and Technology, Hong KongReviewed by:
Peng Jin, University of Guangzhou, ChinaNina Schuback, École Polytechnique Fédérale de Lausanne, Switzerland
Copyright © 2019 Zhu, Suggett, Liu, He, Lin, Le, Ishizaka, Goes and Hao. This is an open-access article distributed under the terms of the Creative Commons Attribution License (CC BY). The use, distribution or reproduction in other forums is permitted, provided the original author(s) and the copyright owner(s) are credited and that the original publication in this journal is cited, in accordance with accepted academic practice. No use, distribution or reproduction is permitted which does not comply with these terms.
*Correspondence: Qiang Hao, aGFvcUBzaW8ub3JnLmNu