 Francisco Leitão
- Centre of Marine Sciences, University of Algarve, Faro, Portugal
Based on fisheries landings data I propose the size-base index (community level) Mean Size of the Landing Catch (MSL). The MSL index was estimated based on high taxonomic resolution data available from auctions (species level) and demographic data acquired during the auction, namely species landed by “size-box” categories, which is assessed mandatorily in all EU members state for fisheries quality and statistic proposes. The MSL was calculated from the average inferred size-box categories of a species weighted by their annual catch. The use of MSL allows determining inter-annual changes in the size of the catch when weighted data is available from the fishery. Using the Portuguese fisheries landing data as an example, the MSL revealed that the landing yield of large fish linearly declined over time while the catch of small fishes increased (i.e., survivors to old age was reduced by fishing). The MSL can be easily used to assess trends in marine exploited commercial communities (community rather than population level) and is fully applicable with any species-size data source (e.g., scientific surveys, visual census data). The MSL can also be applied as a key indicator within the new ecosystem-based Marine Policy Framework Strategy (ecosystem approach to fisheries), which required the use of size-based indicators for the assessment of fisheries trends in exploited marine communities.
Introduction
With the collapse of fisheries at a global scale (Pauly et al., 2003; Leitão, 2015) and the growing risk of overexploitation of several marine fish species, it became evident that stock assessments have not accomplished their objectives. Ecosystem-Based Fisheries Management (EBFM) has been proposed as a new paradigm of fisheries management (Garcia et al., 2003) and the new European Marine Strategy Framework Directive (MSFD) requires the implementation of these approaches along with the development of ecosystem indexes to asses ecological trends (No. 2008/56/CE of EU council, 17 de June).
The interactions between species in communities on many spatial and temporal scales, including the distribution, structure, abundance, demography, and interactions between coexisting populations represents a key issue in ecology. Several ecological indexes are used to study community changes over spatial and temporal scales such as species richness, equitability, productivity, species diversity and evenness, dominance, and biomass to describe trophic levels in coastal marine ecosystems (Karydis and Tsirtsis, 1996). These indexes try to assess changes in community structure as estimators of stress, for instance, environmental or anthropogenic factors. More recently, different ecosystem/ecologically based indexes have been developed to asses and monitor exploited fish assemblages including (i) biodiversity indicators such as the marine trophic index (Pauly et al., 1998), (ii) size-based population indicators (reviewed in Shin et al., 2005, 2010), or (iii) environmental-based fisheries indicators, such as the mean temperature of the fishing catch (Cheung et al., 2013).
The usefulness and relevance of size-based indicators (SBIs) to the MSFD has been under discussion for implementation in the EU. As reviewed by Shin et al. (2005, 2010), SBIs (statistics summarizing the size distribution of fish assemblages and populations) may provide a relevant integration of the fisheries impact on the community structure and in biological processes. Several studies (Frank et al., 2005; Hsieh et al., 2006) considered that the size of organisms is a focal factor to critical ecological processes, and changes in size distribution derived from a substantial number of causes, including environment-induced or genetic variability in life history characteristics, predator-prey relationships, or competitive interactions. Nevertheless, more important is the fact that fishing is always size-selective. Targeting larger and more valuable fishes modifies the size structure and functioning of fish assemblages, with direct consequences for the productivity and resilience of those same stocks. The theoretical basis for the relationship between fish size and ecosystem functioning relies on the assumption that (citing: Shin et al., 2005, 2010 and references therein) […most life history traits are correlated with size, which acts as a constraint on metabolic rates and energy assimilation, so influencing the entire lives of animals, including their growth, reproduction, and survival (Reiss, 1989). Species with smaller adult body mass are generally characterized by faster growth rates (Brey, 1999), higher natural mortality (Beverton and Holt, 1959; Pauly, 1980), higher reproductive output (Gunderson and Dygert, 1988; Charnov, 1993), recruitment, and production per spawning adult (Fenchel, 1974; Denney et al., 2002)…]. In exploited fish communities there is evidence that indicators based on the size of individuals are appropriate to monitor the community structure. It is therefore arguably that if the use of such indicators to assess ecosystem status, such as if the proportion of large fish (by number or weight), reflects the state of an assemblage. That is if communities subject to intensive fishing will have a proportion of large fish smaller than those not subject to fishing or small-scale fishing. However, the development of marine biological indicators reflecting size-based variability on marine assembles (populations rather than species level) is so far lacking.
Several scientific syntheses have highlighted the connection between size reduction and exploitation in wild marine populations. An approach for estimating the mean catch size was developed by Pauly (access available at FishBase)1. The FishBase routine considered that fish species targeted by various fisheries change in age and size structure due to exploitation. In a fishery defined as sustainable, such annual changes in catch composition should have no trend. However, the exploitation of multispecies communities has a changing effect on the relative abundance of the different functional groups supporting community ecosystems. Besides that, it is also noteworthy that large, long-lived species with high trophic levels tend to be replaced by smaller short-lived species feeding at lower trophic levels. These trends will ultimately be reflected in catches as the worldwide decline in mean trophic levels showed (Pauly et al., 1998). Therefore, the latter authors have estimated the average maximum size of organisms (fish and invertebrates) based on the mean of the maximum lengths of species or groups. Using the Atlantic blue marlin as an example, Goodyear (2015) showed that in fast-growing, long-lived species, such as the blue marlin, mean length might decline only slightly even with a considerable fishing-induced population decline. When fishing targets a broad age range, the decline in maximum observed size is the result of reduced survival of older ages, which typically include the largest individuals in the population. Therefore, it is assumed that a consequence of fishing is the length reduction of fishes caught over time because: (i) marine trophic ecology is organized in the way that small forage species with short generation time continuously replace large slow-growing and long-lived species in an exploited ecosystem (Pauly et al., 1998); (ii) the selective removal of organisms subjected to fishing because fishing gear (nets) tends to select for large mature individuals, consequently decreasing average length (Ricker, 2011).
Globally, many highly prized commercial species are under assessment, and substantial data exist to predict their status. However, most fisheries worldwide are data-deficient due to insufficient research funding and support. According to Maynou (2015), this situation changed in the last decades for many target species of major fishing fleets due to the resources made available by the Data Collection Regulation (DCR) and the Data Collection Framework (DCF) programs (EU Reg. 1543/2000 and EU reg. 665/2008, respectively). Likewise, stock assessments were carried out under the authority of the Scientific, Technical and Economic Committee for Fisheries (STECF; Cardinale et al., 2010; Colloca et al., 2013). However, sufficient quality data is inevitably tied to important fisheries producing large amounts of landings and falling within DCR/DCF obligations. Landing data (such as demographic aspects of the fishing), continuously collected over the years and combined with limited additional information on the biology of target species, can later be used to develop ecological indexes which will characterize the time series and status of the global fisheries. In Portugal, the DOCAPESCA (entity responsible for Portuguese fishing auctions) has a size-box classification system for fishing catches. DOCAPESCA2 data collection system follows the EU 1996 regulation (CE No. 2406/96). This regulation establishes the common marketing standards for fishery products. Under this regulation, during the auction each box has fish of a size category, thus generating important information for fisheries biologists. Fish price can have a significant variation (elastic product). Therefore, the prices for the different box size-categories can also vary considerably. During auctions, the boxes are ranked from 1 to 6, where boxes labelled with 1 include larger fish (more prized fish) and boxes labelled with 6 have fish of lower commercial size/value (less prized fishes). As the market demand will make prices fluctuate, size categories are kept constant across time (independently of the market price).
Fisheries can change the community of species in the marine environment. Given the general lack of long time-series, only in a few cases a decreasing trend in the population mean size was directly observed related to fishing exploitation of certain commercial species, and not of communities [e.g., sardine in the Aegean Sea (Antonakakis et al., 2011) or hake in the Balearic area (Hidalgo et al., 2009)]. If populations of many commercial species are already characterized by truncated size-structures, than, size-effects should also become evident at a community level. Understanding and monitoring the size-structure of exploited populations is an objective of the EBFM (Froese et al., 2008). This issue has been seldom studied, which can be related to the lack of a more systematic data collection thus hindering the assessment and management of many fishery resources in several areas (Maynou, 2015).
In European countries, most assessed stocks/populations of many commercial species are characterized by truncated size- and age-structures. Generally, owing to the combined effect of high fishing pressure and low size selectivity, the catch composition of most of the Mediterranean commercial stocks is dominated by age 1 and 2 specimens, with a low occurrence of larger individuals (see STECF, 2009). Population SBIs can be used for evaluating, comparing, and communicating the ecological status of exploited marine ecosystems (Shin et al., 2010). The mean size is easily conceptualized for single species, but so far that is not the case for all fished assemblages. Herein, using the size-box categories data obtained from the commercial fish database, the Mean Size of the Landing Catch (MSL) was estimated. Applying this index will allow a comprehensive perspective of all fished species (community level), rather than just individual species analyses. At the same time, time series are expected to reveal biological size-based trends regarding the exploitation status of fishing communities.
Materials and Methods
Fisheries and Fish Size-Box Frequency Data
This study only pertained to mainland Portugal landings. Despite the lack of routine biological samplings for many landed species, fishing landings by species and fleet sector (trawl, seine, and multigear) can be compiled daily in Portugal from DOCAPESCA auction database (see footnote 2) for statistical or taxing purposes. The DOCAPESCA monthly landings statistical data were combined into annual periods. The multi-species, or multigear artisanal sector, includes mostly (85.9%) fiberglass open deck local boats (<7 m long). This sector uses static/passive gears, namely gill nets, trammel nets, pots and traps, and hook and line gears (Leitão et al., 2014). The size-box classification system for Portuguese fishing catches follows EU 1996 regulation (CE) No. 2406/96 which establish the common marketing standards for specific fishery products. In this regulation box size categories varied considerably with boxes-size with the higher fish size being scored with 1 (most prized fishes) while lower boxes-size fish scored with 6 (less prized fishes). However, some landed fish boxes can be categorized in the auction as zero size. Underlying reasons for that can be because: (i) species were not yet obliged to be assigned according to freshness or size; (ii) small ports (auction) do not assign them due to logistic technical/technological constraints. Based on yearly landings between 2002 and 2016, the percentage of size-box assigned with score #0 (undetermined) from the Portuguese mainland was 15 ± 1.5% of the total landings in weight, and 15 ± 4, 1.5 ± 0.4, and 50 ± 5.7% were respectively assigned to trawl, seine and multigear fishing sectors. As it was not possible to determine size-box category #0 by species, this was removed from further analyses. Between 2002 and 2016 a total of 74 species (Supplementary Material) were landed and sold in the DOCAPESCA auctions, and assigned into box-size categories #1 to #6, contributing to 85% of the total catch in weight. Mix categories such as Diplodus spp. (e.g., include D. sargus, D. vulgaris, D. bellottii), Lophius spp. (e.g., include Lophius piscatorius and L. budegassa) or other co-generic groups (at genus taxon) such as Mullus spp. (include Mullus surmulletus and M. barbatus) were used as they appear at auction discriminated by size-box category.
Mean Size of the Landing Catch Index
The number of the size-box category (or box length-class category) corresponds to the label/score provided in auction by the expert technicians to discriminate the length-class of the fish contained within each fish box, based on pre-determined fish size-categories (CE No. 2406/96). That said, the mean size of the box was considered as a proxy to the size-class which means that this index can be used in other circumstances (e.g., scientific cruises with detail data on weight-size frequencies, etc.). The average yearly frequency distribution of landings in weight, by size-box category, was determined using species size-box categories weight information. The frequency distribution of landings by size-box category was plotted and later used to estimate MSL. We estimate MSL trends considering: (i) species mean landings size cumulative contribution and; (ii) relative contribution in weight of each species, by size-box categories, to overall landings. Taken together, the MSL was calculated and inferred from the cumulative contribution of the average size-box categories of each of the exploited species (Supplementary Material) weighted by their annual landings, as following:
Where yr is the year, i is the species, n is the number of landed species, S is the size-box category, m is the number of size-box categories, is the total landing weight of the species i for that year and is the landing weight of size-box S from species i. Therefore, index values range between 1 and 6 and MSL values close to 1 represent a large percentage of large/size fish in landings while values close to 6 represent a large percentage of small/size fish in the landings. The MLS was estimated for each fleet sector (trawl, seine, and multigear) and overall fleet.
Following the EU 1996 regulation (CE) No. 149 2406/96, the size-categories differ with species and country. However, the systematization process of assigning species size categories at auction is conservative over time and country, and thus the index can display trends along a time series dataset, allowing an application of this approach specific for each country.
Data Analyses
A linear regression model was used to assess the evolution of the percentage of landings over time for each size-box category. The slope parameter of the regression model was used as a proxy for the variability of the percentage of landings for each size-box category. Therefore, the slope of the linear fitted model was used as a proxy for the trend tendency (upward or downward) and to quantify the rate of change in time series data. The statistical significance of the linear model was assessed via a student t-test (P-value < 0.1). The null hypothesis was formulated as no trend that describes an unchanging landing percentage rate.
Results
The size-box categories #1, #5, and #6 have a small weight contribution (relative contribution) to the overall landings, regardless of the fishing gear (Figures 1, 2 and Supplementary Material) whereas, the size-box categories #2, #3, and #4 had a higher contribution to overall landings, regardless of the fishing gear (Figures 1, 2).
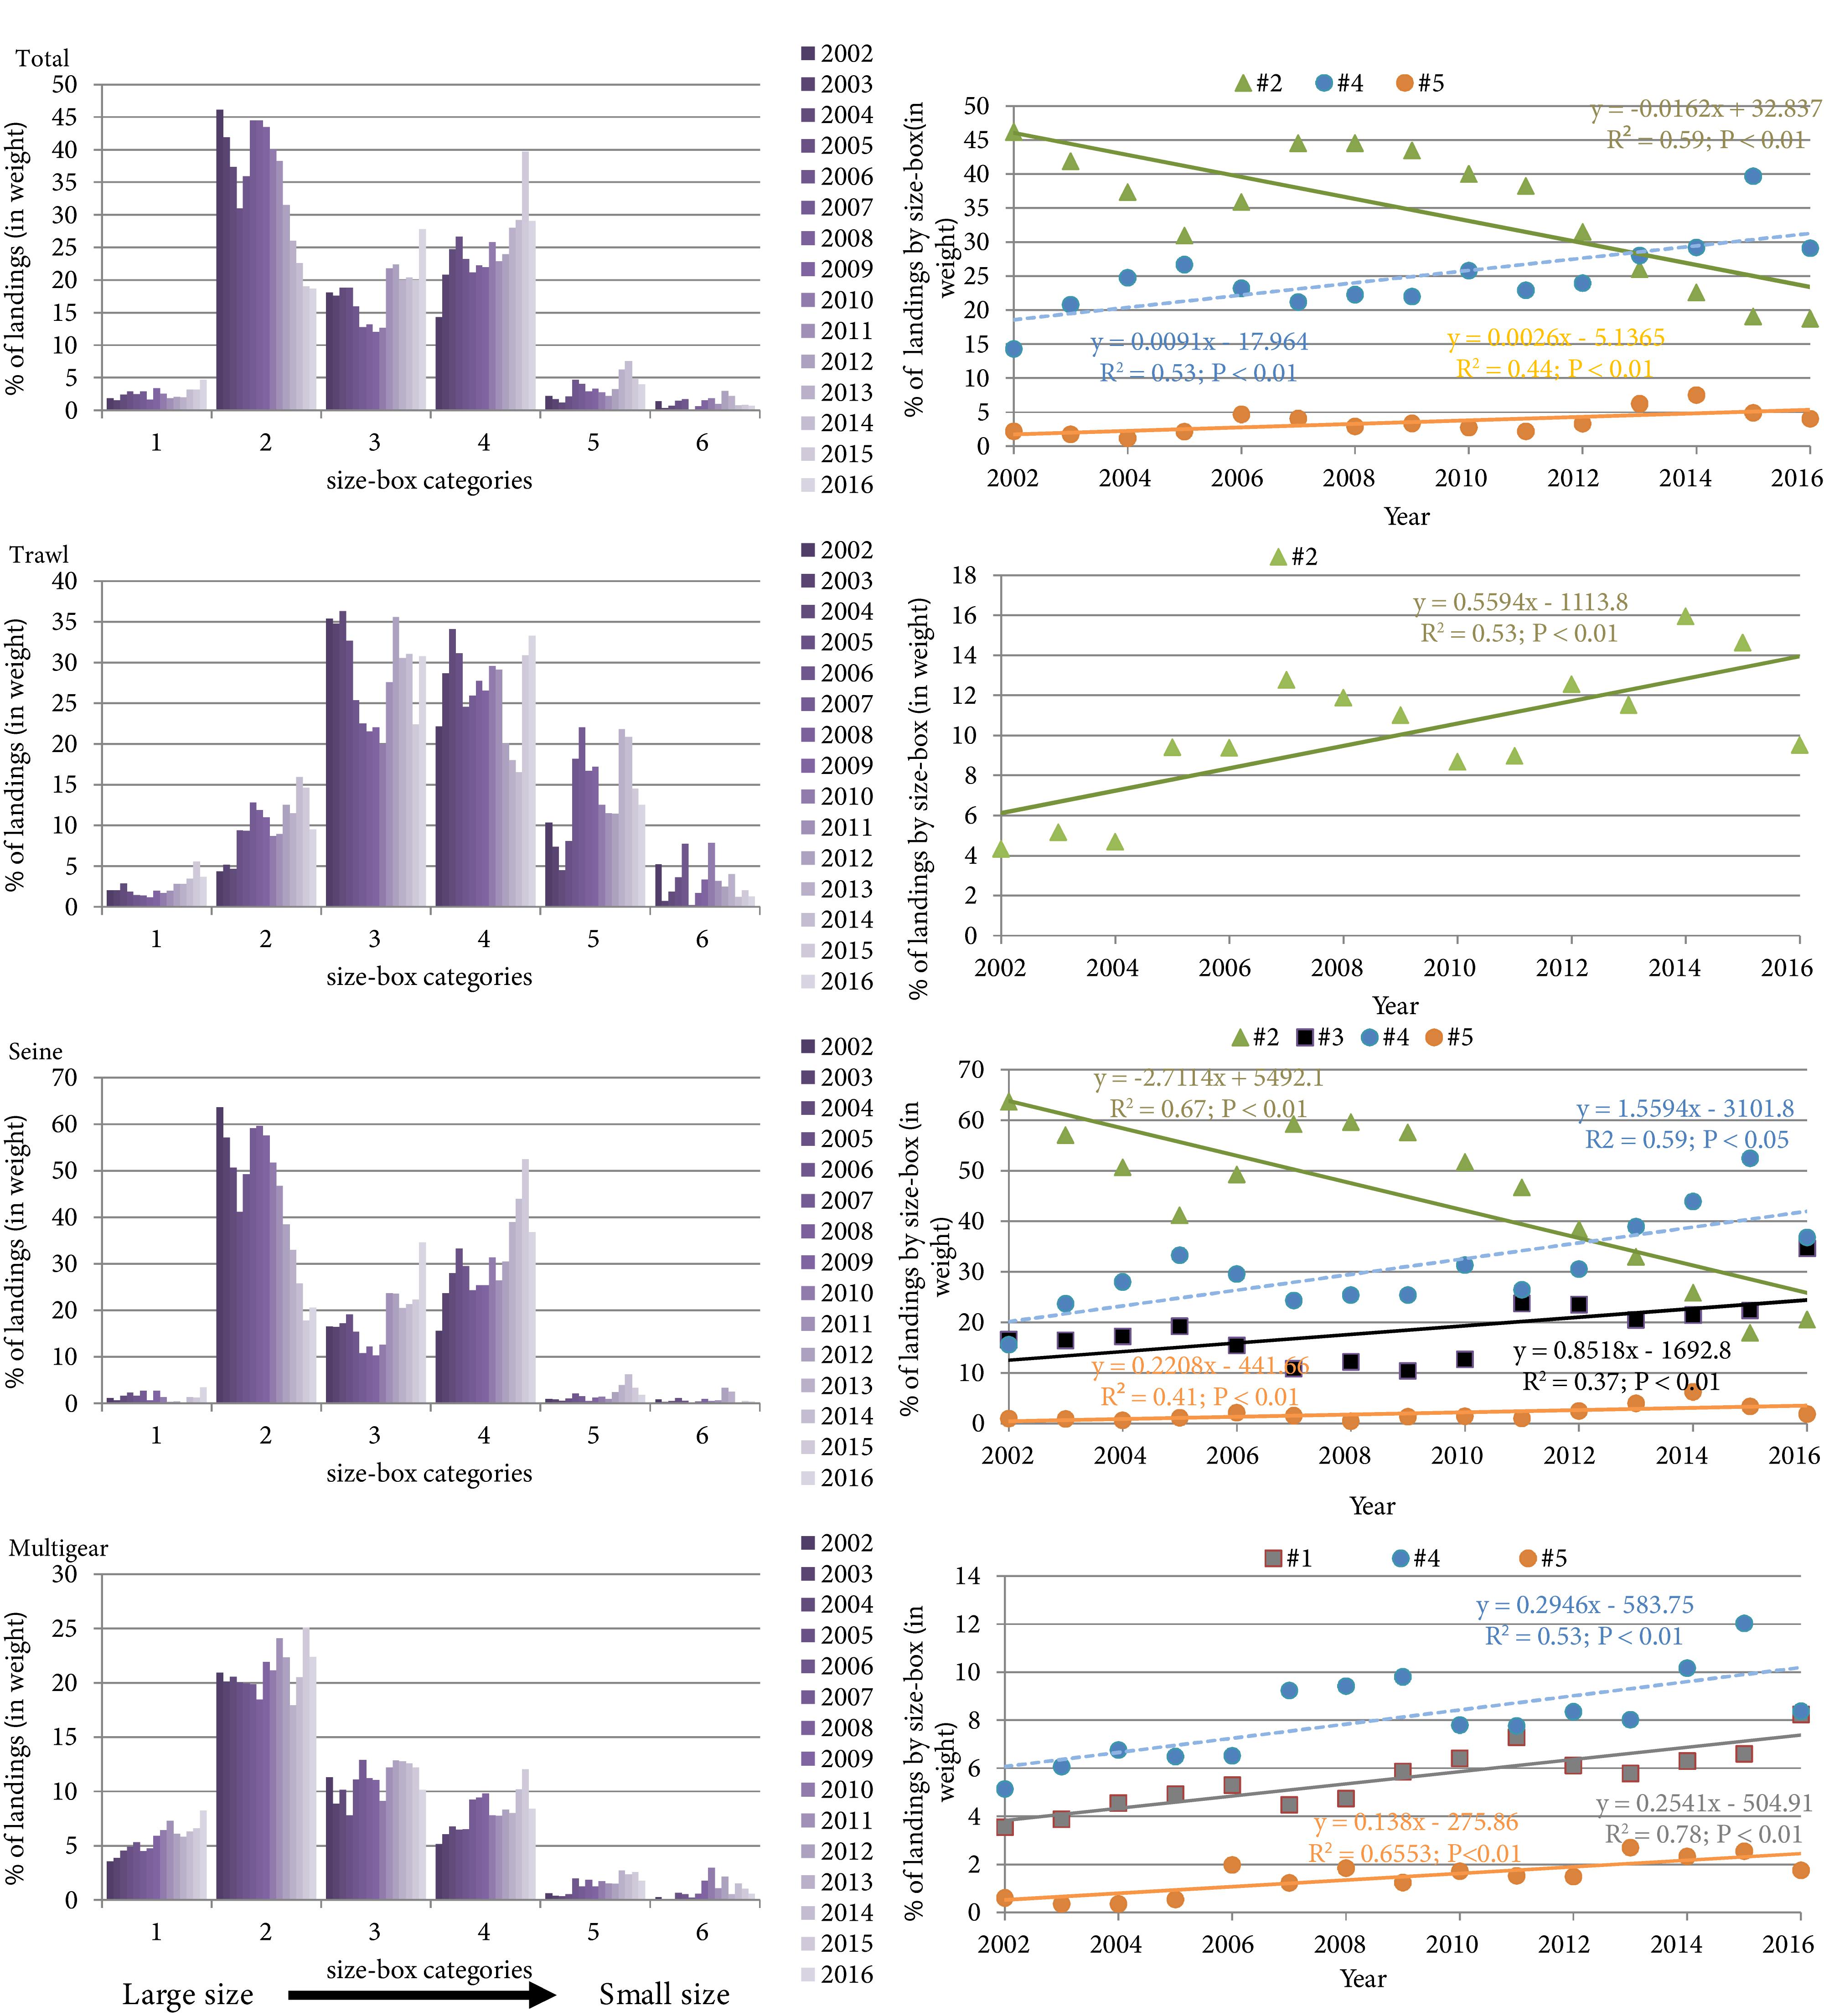
Figure 1. Inter-annual size-box relative frequency distribution for total catch and by fishing sector, Trawl, Seine, and Multigear (left panel) and significant linear regression models between time (years) and percentage of landings per size-box category (right panel; #1 – large size to #6 – small size). R, Coefficient of correlation; P, P-value.
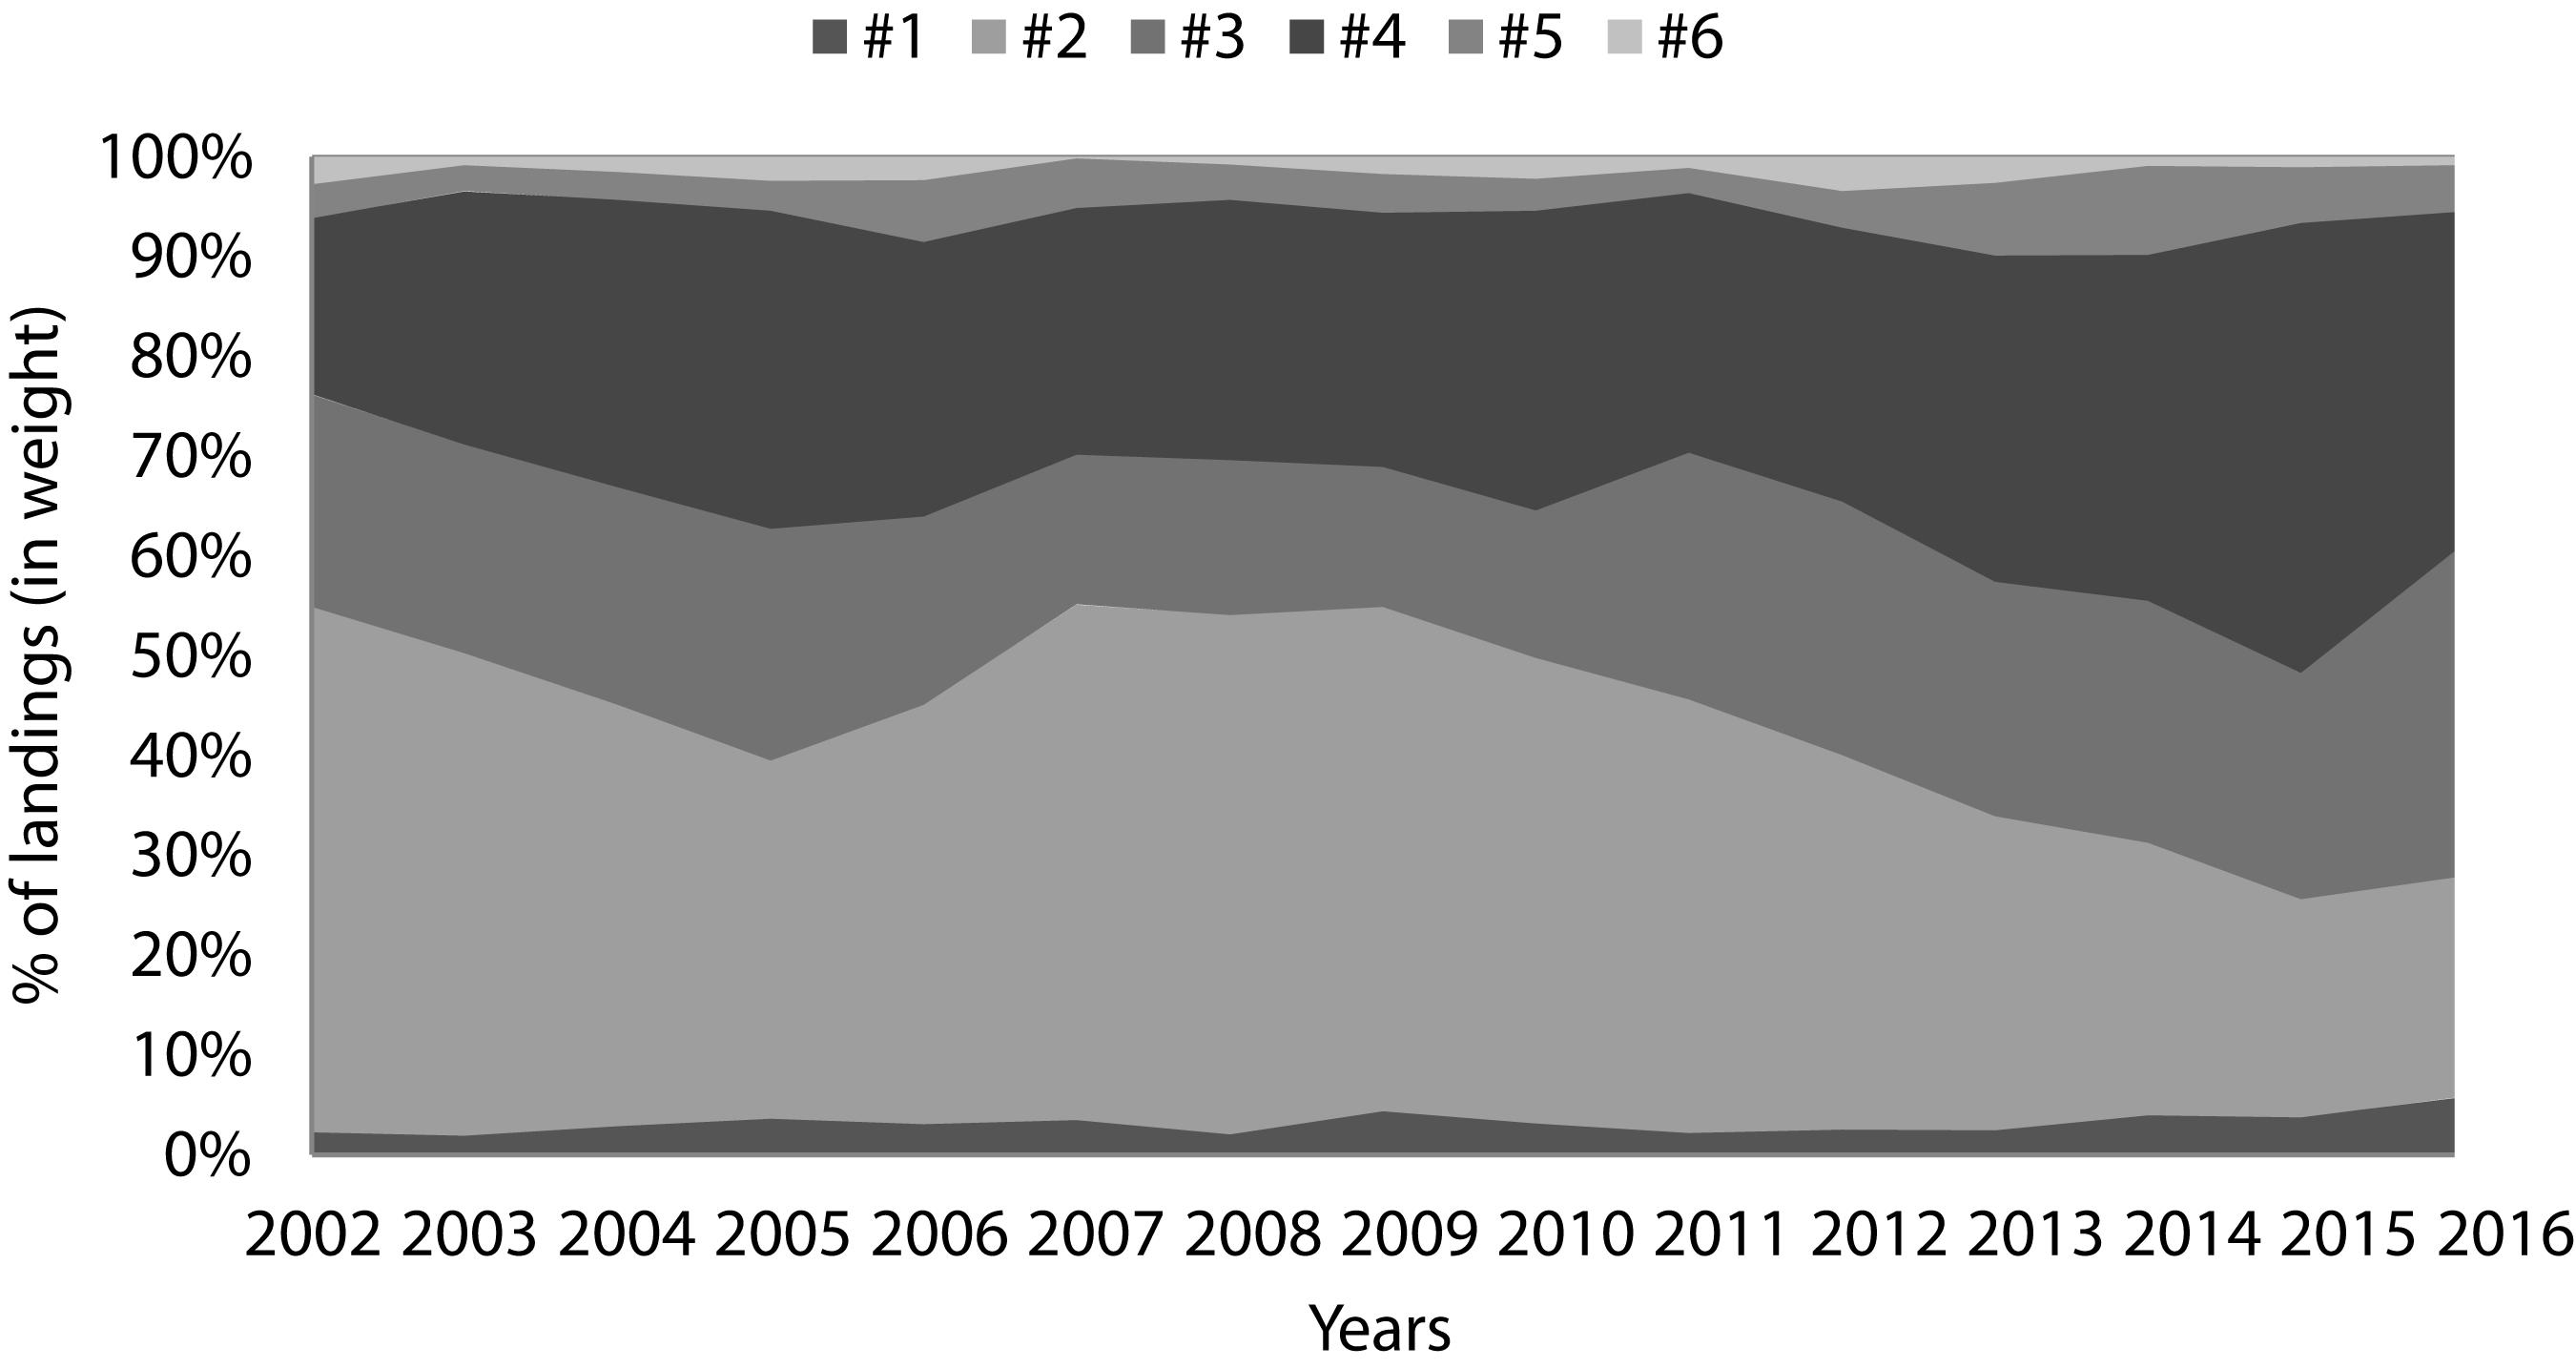
Figure 2. Percentage of landing (in weight) per size-box category (#1 – large size to #6 – small size).
Overall, the larger fish landings (size-box #2) evidenced a linear decline over time while small size-box categories landings increased out by fishery (size-box #4 and #5). The trends of the relative percentage of landings per size-box categories varied among fishing fleet sectors (Figure 1, right panel). For the trawl sector, a significant linear increase (p < 0.05) in the landed percentage of large size fish (size-box #2) was recorded.
For the seine sector a significant linear decline (p < 0.05) in the landed percentage of large size fish (size-box #2) is recorded while an increase of intermediate size-box categories (size-box #2, 3, 4) was observed.
For the multigear sector a significant linear increase (p < 0.05) in the landed percentage of size-box #1 (large size fish landed at auction) was recorded along with the intermediate (size-box #4) and low size-box categories (size-box #5).
The Mean Size of the Landing Catch was lower in the multigear sector and higher and similar in trawl and seine, respectively (Table 1 and Figure 3). The overall MSL, based on auction size-box category, increased significantly at a linear rate of 0.37 units per decade (Figure 4). The linear increase of the MSL means that more small size fish were landed over the considered time frame (2002 to 2016). The increase of the MSL, or the decline of large fish in the landings, was recorded in all fishing sectors (trawling, seine, and multigear). A significant linear increase of 0.25, 0.55, and 0.35 units per decade in MSL were observed respectively for the trawling, seine and multigear sectors.
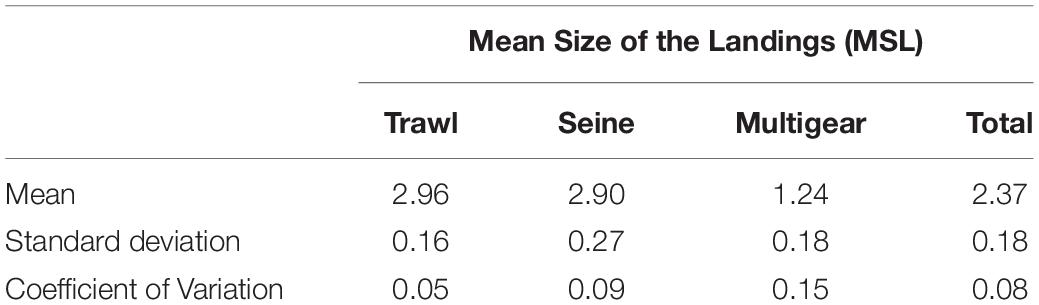
Table 1. Average Mean Size of the Landing Catch (MSL) for total catches and by fishing sector (Trawl, Seine, Multigear) between 2002 and 2016.
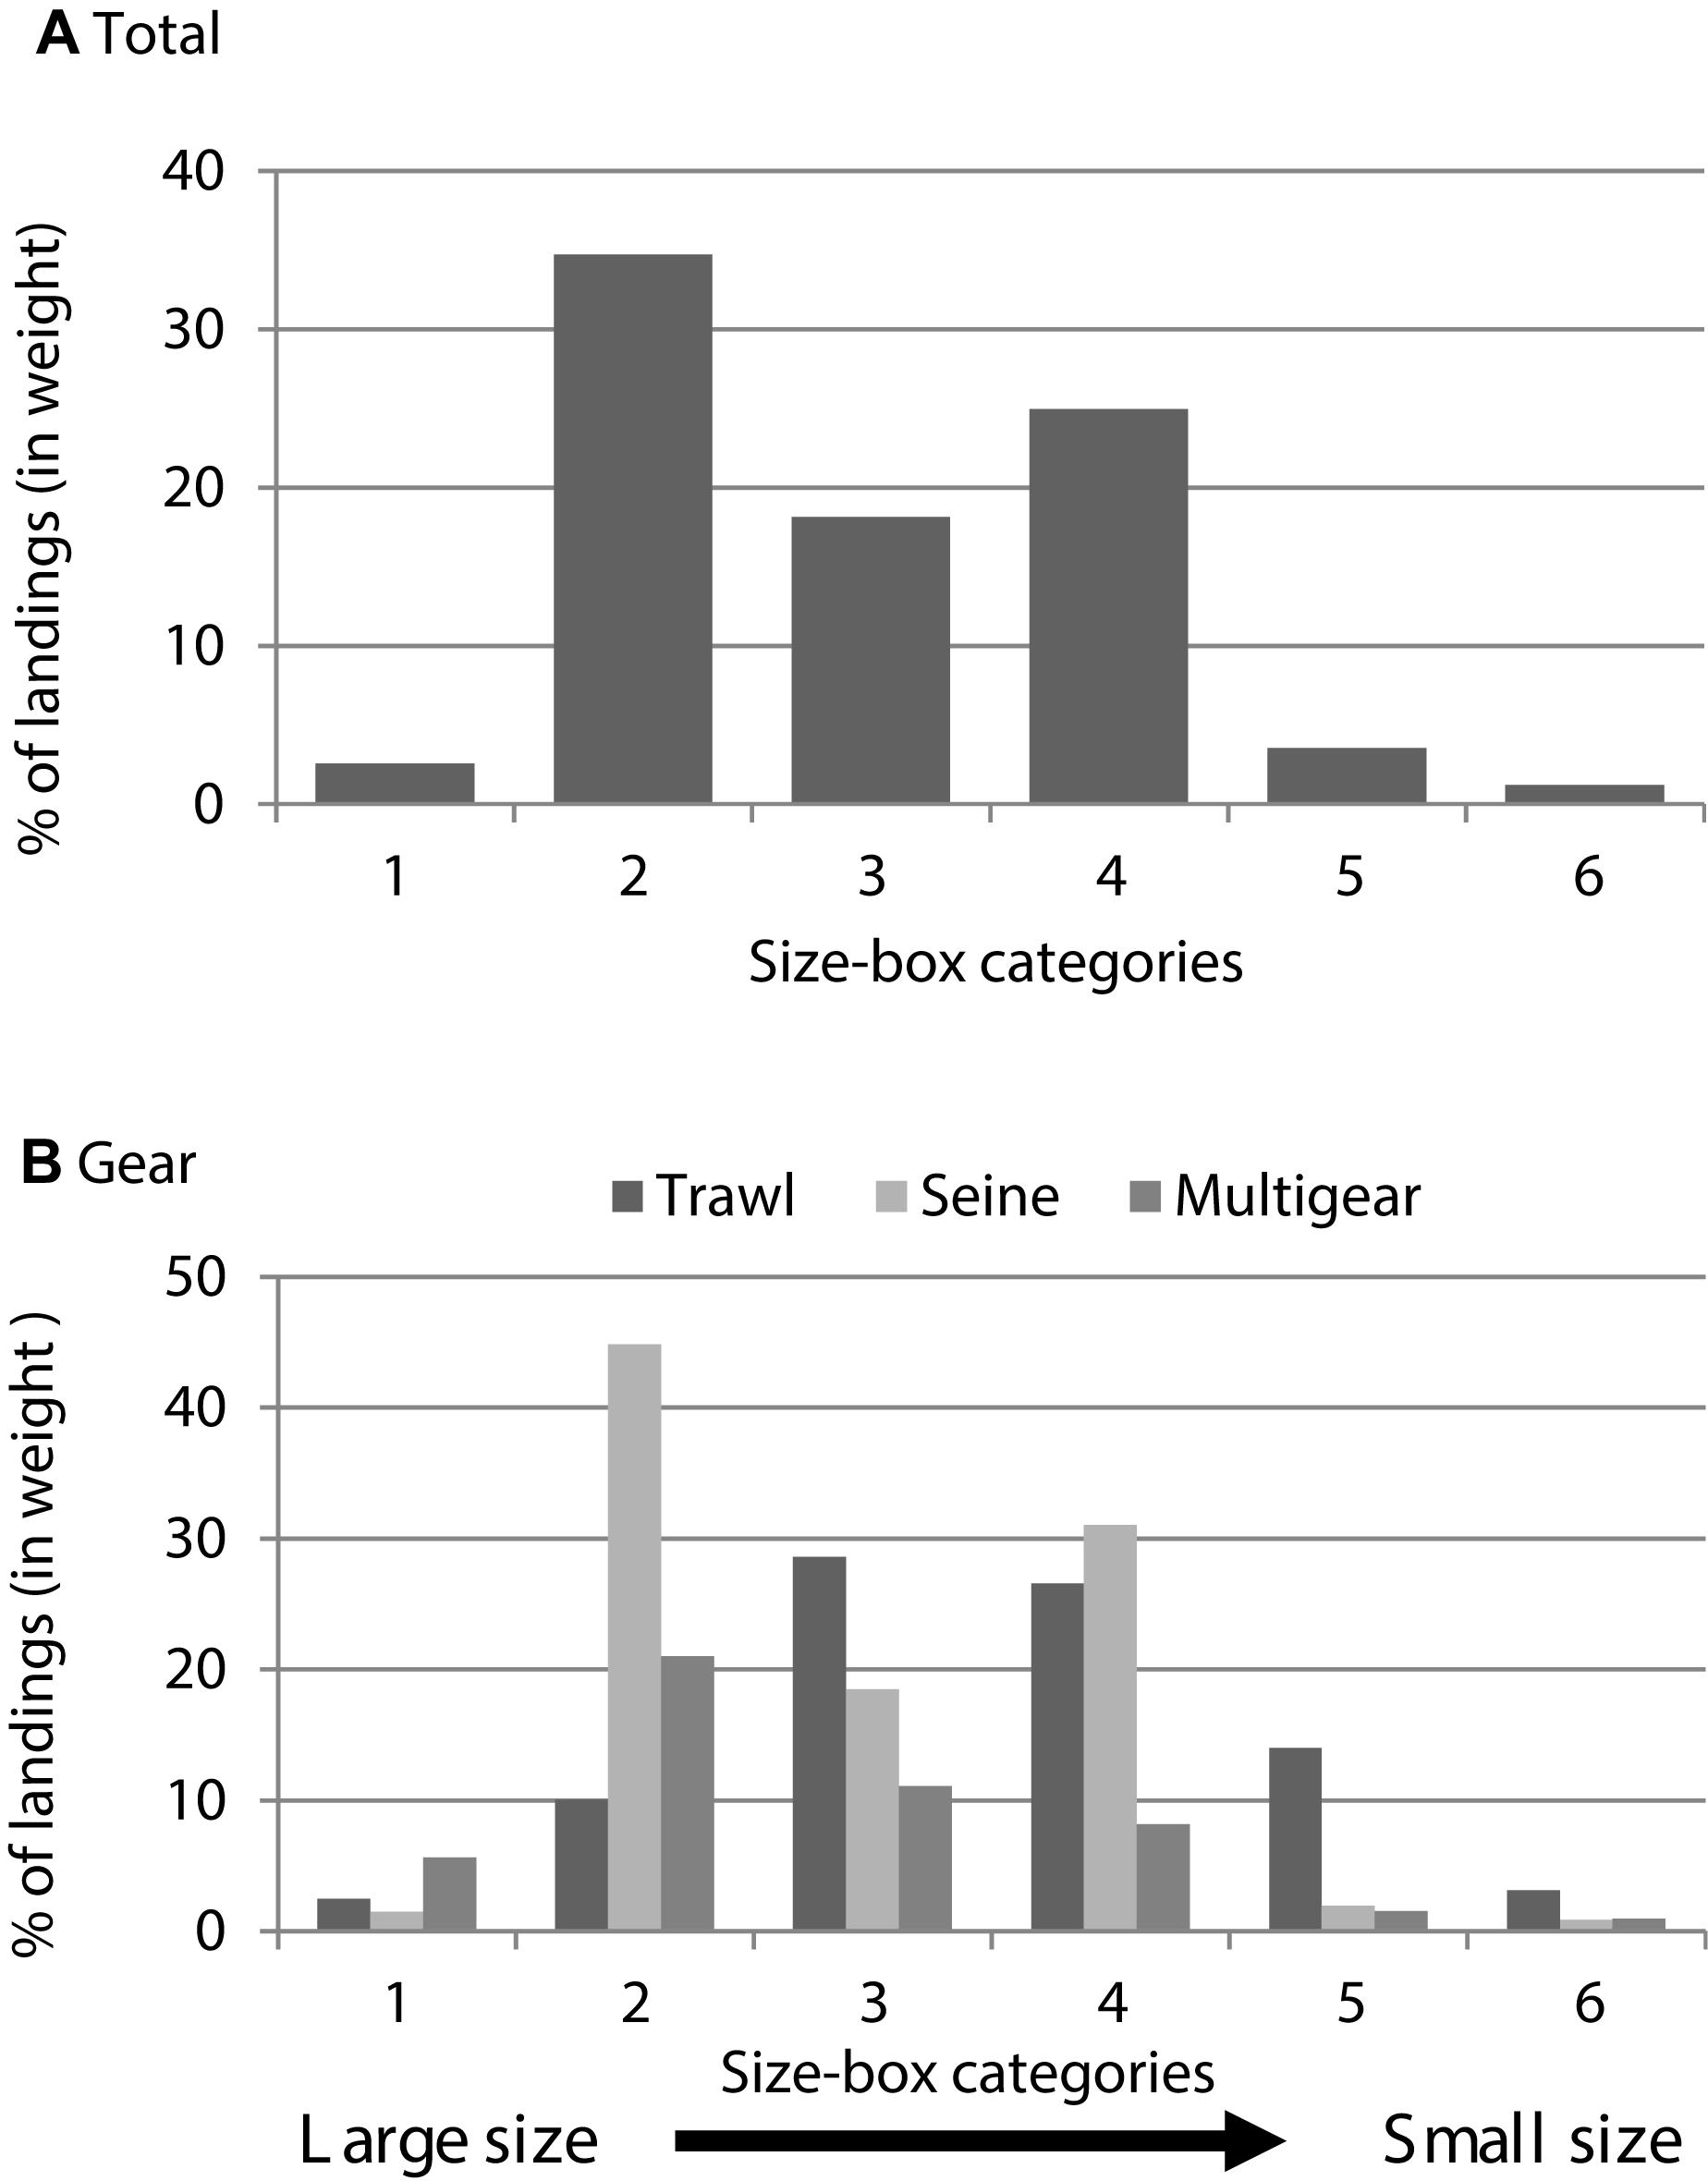
Figure 3. (A) Mean size-box relative frequency distribution for total catch and by (B) fishing sector (Trawl, Seine, and Multigear) between 2002 and 2016.
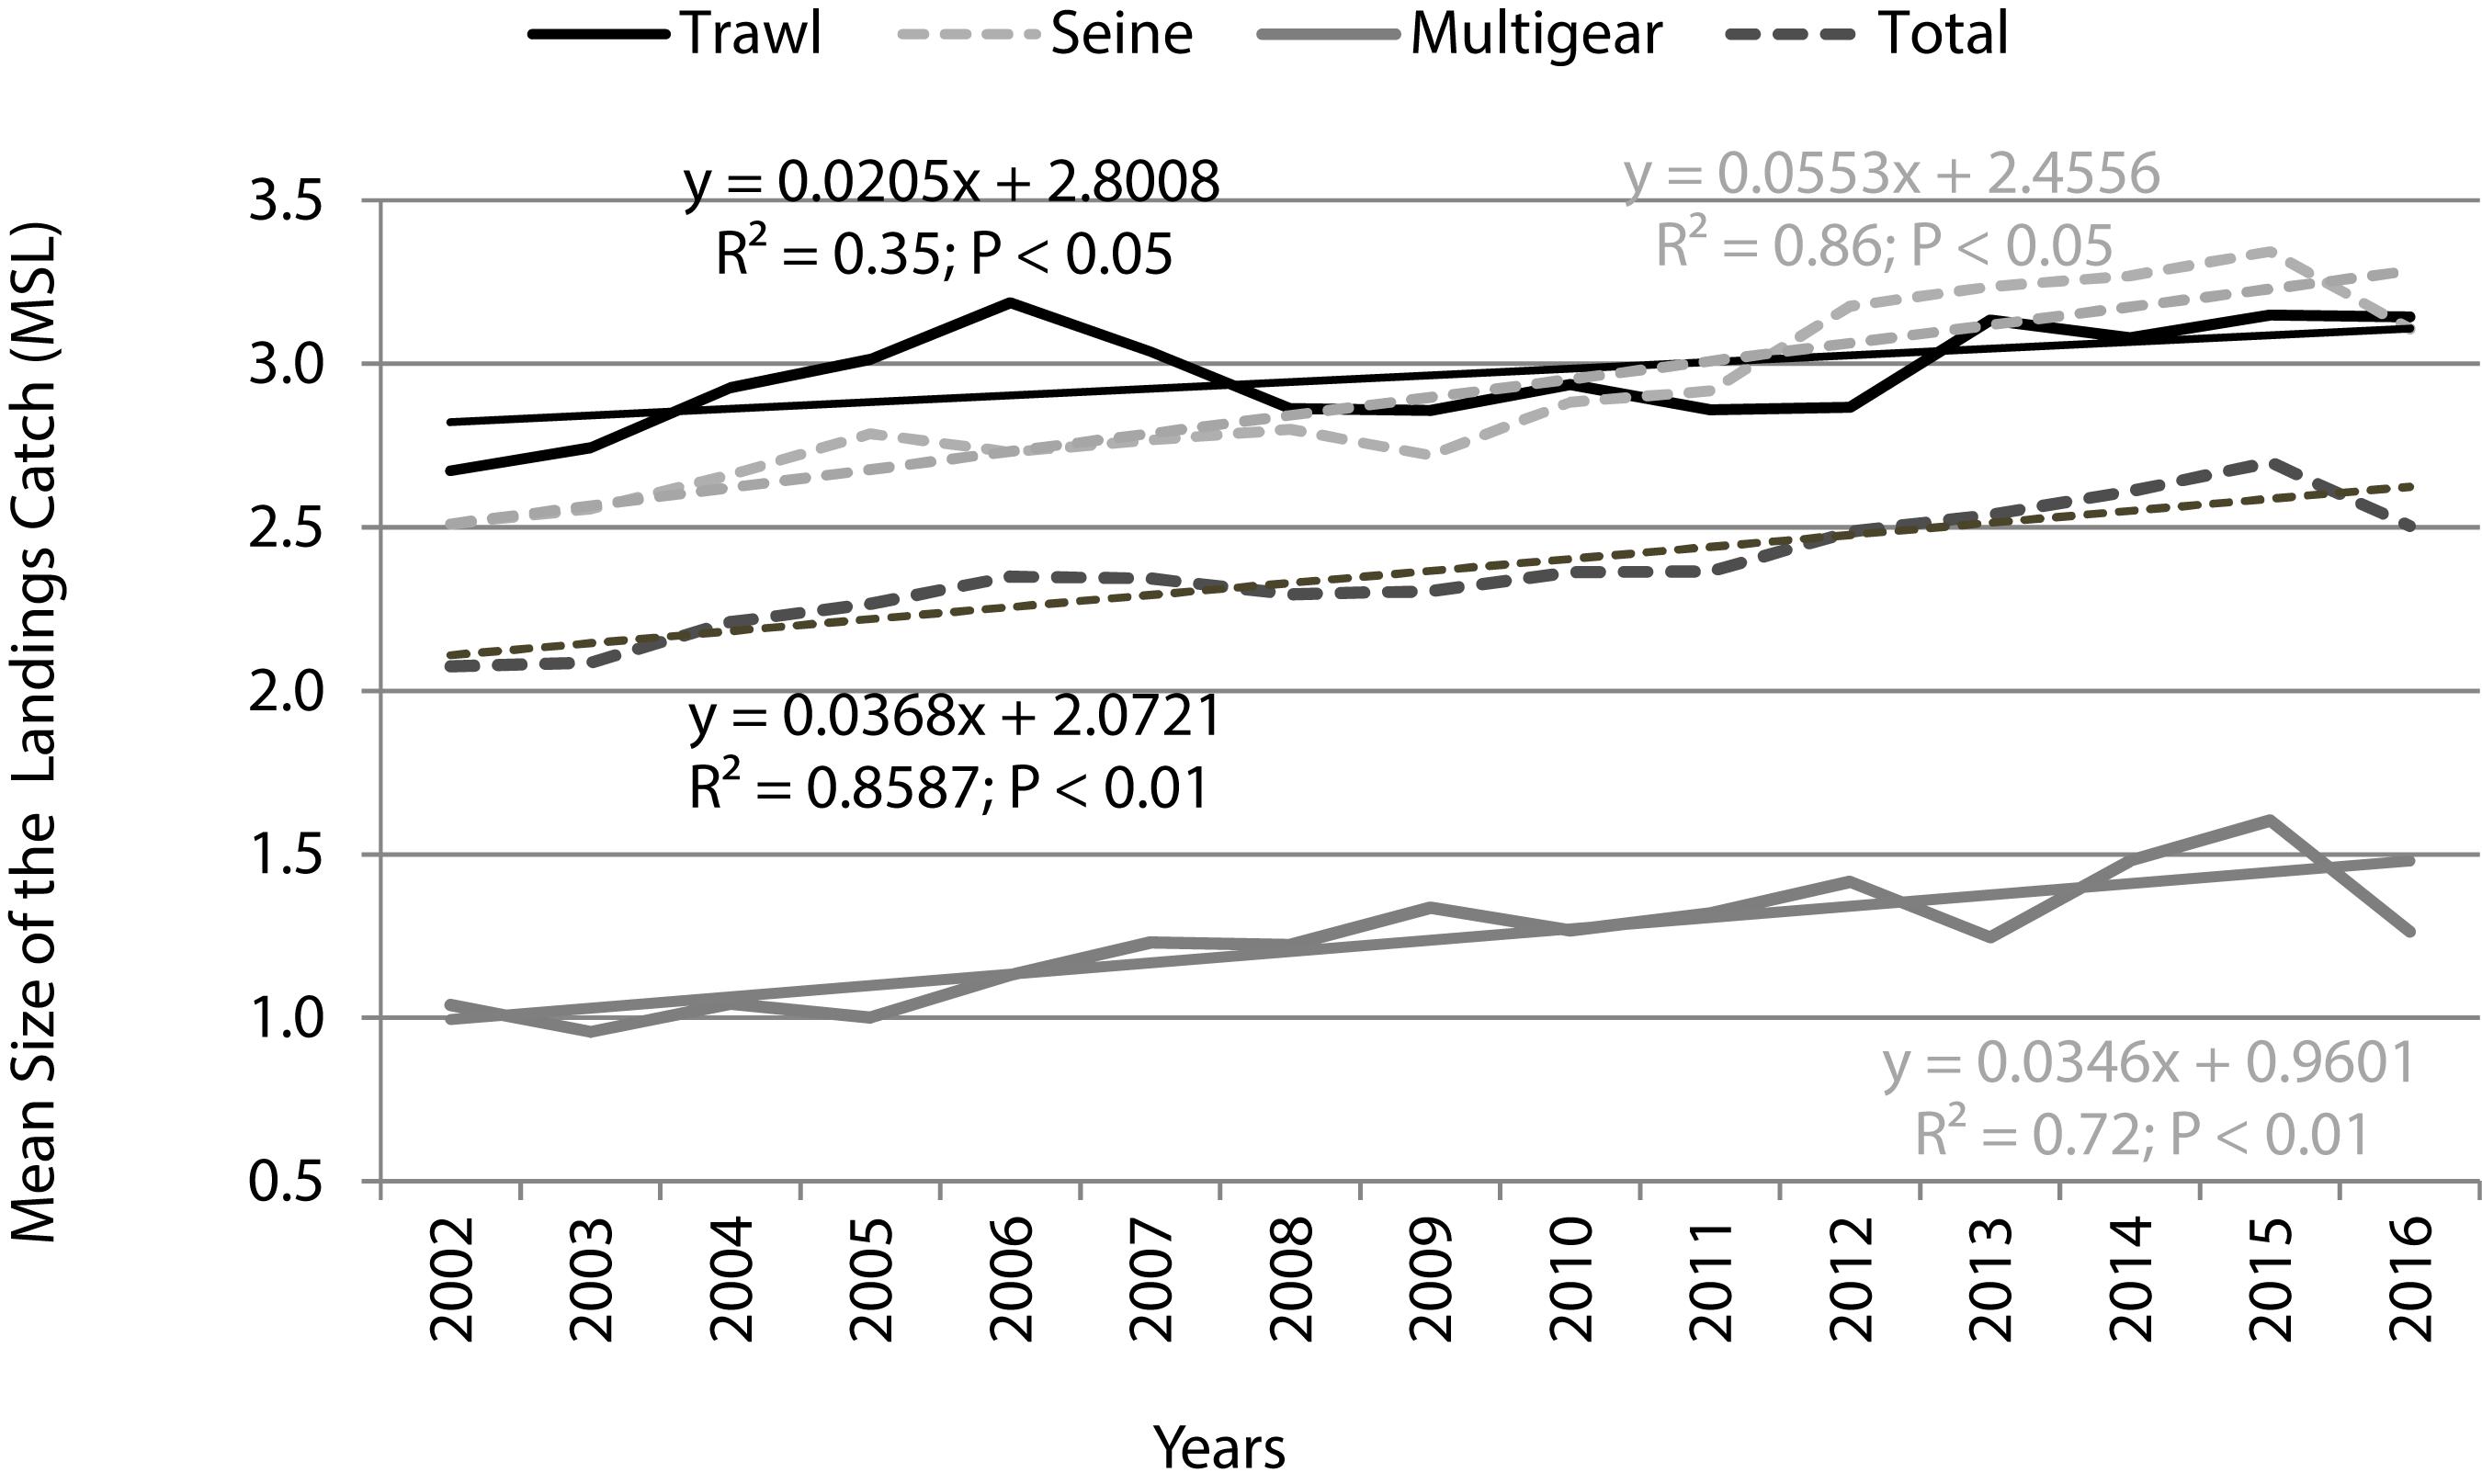
Figure 4. Mean Size of the Landed Catch (MSL) index for total catch and for each fishing sector (Trawl, Seine, and Multigear) with significant adjusted linear regression statistical models. R, Coefficient of correlation; P, P-value.
Discussion
The proportion of large fish was selected as a descriptor indicator for the Ecological Quality Status (EcoQs) in the North Sea (OSPAR, 2008; see also Rogers et al., 2010) and for the implementation of the MFPD in EU (Decision COM4031 2010/477/EU). The justification for the inclusion of SBIs for assessment in the OSPAR (OSPAR, 2008) was: “In exploited fish assemblages, larger fish generally suffer higher fishing mortality than smaller individuals and the size distribution becomes skewed towards the smaller end of the size spectrum. The susceptibility of late-maturing and larger fish species to fishing implies that small and early-maturing species increase in relative abundance. … The average weight or maximum length can be expected to be proportional to fishing effort, though natural factors will impact the size distribution as well. From a conservation perspective, appropriate EcoQs would move these metrics towards a larger proportion of large fish and would improve fisheries yields”.
The increase of larger fish in landings is the results of the fish growth and reproduction in later years. Assuming this rationale, we can consider that the output information driven from the MSL index based on size-box categories (here considered mostly spawning biomass or adults) can be used as a time series indicator of the exploitation regimes. The MSL index was lower in multigear sector and higher and similar in the trawling and seine sectors. These results imply that multigear landings are composed of a significant percentage of large fish (size-box#2). That is an expected result as the fish size is commonly associated with the fleet type (Leitão et al., 2014). Seine and multigear sectors comprise most of the landings of the Portuguese fishing fleet (Leitão et al., 2014) and both fishing sectors indicate an increase of MSL, revealing a decline in the amount of larger landed fish. The MLS trends for seine seem to be in line with the seine downward trends for traditional commercial species captured by seine nearshore fisheries (medium and small pelagics) that have decreased after the middle 1980s (Leitão, 2015). Indeed, the seine fleet targets mainly sardine, which collapsed in 2017 (ICES, 2017), mackerel and horse mackerel which also decreased in later years (Leitão et al., 2014; Leitão, 2015). The contribution of size-box #1 (large fish sizes) to the total seine catches is ephemeral in the last 14 years (2002–2016). A significant decline in size-box #2 (large fish) was also observed in seine whereas medium to small fish size-box contribution (#3, #4, and #5) increased significantly. The declining catch trend in the later years of small and medium-size pelagic fish mostly caught by the seine sector have changed fleet activity which now target on deep-sea resources and higher trophic levels (cephalopods, large benthopelagics, flatfishes, demersal invertebrates, rays, bathydemersal, shrimps, small benthopelagics, and large sharks) while traditional commercial species captured by nearshore fisheries (medium and small pelagics) have decreased (Leitão, 2015). Trawl and multigear sectors also reveal an increase of MSL thus a decline of large fish in catches. Therefore, a decline of young and large-sized fish in landings over the latter years in the multigear sector is probably due to the overexploitation of many coastal resources. Deep-water fish resources are generally considered to have high longevity, slow growth, late maturity, and low fecundity (Morato et al., 2006).
As 50% of the data (size-box #0) was not available, some caution is required regarding the interpretation of multigear fleet results. However, to our concern, the major scope here is not to debate the Portuguese fisheries situation/report system but rather the usefulness of the indexes as a size-based indicator of the trends of exploited marine communities. The size-box distribution of landed fish, regardless of the gear, reveals the demographic profile with size #3–#4 dominating in weight and sizes #1 and #6 with a minor contribution. Thus, using fish size-box categories, it was possible to determine a proxy (a proxy because discards are not taken into account) of fishing community length-frequency distribution. Overall, based on the size-box information it was possible to see an increase in the MSL (landings decrease of large fish). That means that the amount of large size fish is declining. This information is of great concern as the proportion of large fish (in weight) reflects the state of an assemblage. Communities subject to intensive fishing will have a smaller proportion of large fish rather than those not subject to fishing or just to small-scale fishing. It can, therefore, be used as a measure of the relative abundance status of top predators whose value below certain limits may indicate the disappearance of the higher trophic levels within the trophic web (Shin et al., 2005, 2010). According to Goodyear (2015), the mean and maximum observed sizes tend to decline with increasing fishing mortality, a trait easily recognized by fishermen and scientists. Consequently, such data is an informative indicator of population health and receive particular scrutiny during the fisheries management process.
Attempts to monitor the overall size of catches reveal that a decline in average maximum size of organisms landed by various countries did occur (see footnote 1, Froese and Pauly, 2019). However, as stated by later authors, these results are probably underestimated, given the fact that those do not consider the reduction of mean length within species. Moreover, OSPAR (2008) concluded that […“ further studies on the metrics “mean weight” and “mean maximum length of fish” are still needed. The latter metrics are closely related to the area fished and the gear used. Reference points that could be developed would therefore also be specific to the surveys and areas”…]. The integrated analyses of all fish assemblages using weighted size-category frequency inferred from auction data consists of a new approach that allows for MSL estimation and can joint to other attempts to access landings size-based information trends in marine communities. The estimation of the MSL index was based on auction data, but it demonstrate that simplistic approaches (relatively easy to understand by non-scientists and those who will decide on their use – stakeholders) can be used to access trends in marine assemblages (even based on landings and comprising mostly adult stock size). Moreover, it can be used as an additional tool within the conservation and management fisheries programs in the EU and elsewhere. For example, for the EU member countries, all are committed to the common fisheries policy, as the legislation is equally enforced in each member state. It can be argued that the procedure to assign landings by size-box category along EU member’s state can change across different auctions in the EU. However, size-box assignment routines are surveyed by an expert veterinarian and chef auction inspectors that are obligated to enforce EU regulation. Moreover, commercial fishers are most interested in keeping the fisheries assignment at higher standards, aiming for maximum revenue, and dealers who want to get the best fish price for each quality category (size is an attribute of fish quality). These arguments will allow for consideration of implementation of size-box data analysis over time and space (different EU member states for instance) under a standardized evaluation.
The MSL decrease across years, independently of gear type. Consideration about size changes in community dynamics of harvested stocks should be tracked because biological attributes that affect stock productivity such as fecundity and survival are closely related to organism sizes (De Roos et al., 2006; Conover et al., 2009). The selective removal of organisms with different growth and maturity rates impact fisheries in different ways. Harvested stocks with density-dependent mechanisms can accelerate growth at low stock sizes (De Roos et al., 2006). Premature maturation mechanism can enhance population/communities biomass gain, and recovery from fishery impacts, but this biomass is ultimately reduced by fishing gears size-selective catch. In the future, catch size information provided from auction data can be an additional fisheries management tool to be used as indicators of community size status and not just for trend analyses proposes. The MSL index can be used with other data (e.g., survey data) where multiple species demographic information can be compiled. Such a simple size-based index can induce researchers to look to demographic population aspects when selecting fishing indicators (population size indicators status), within the new MFPE policy to be enforced in the EU. Additionally, MSL can optimize the inclusion of fisheries information in monitoring programmers so that they provide maximum information for EBFM management purposes.
Author Contributions
The author confirms being the sole contributor of this work and has approved it for publication.
Funding
This work received national funds through FCT – Foundation for Science and Technology through project UID/Multi/04326/2013. This research was partly supported by CLIMFISH project – A framework for assess vulnerability of coastal fisheries to climate change in Portuguese coast funded by Portugal 2020, n2/SAICT/2017 – SAICT (Projetos de IC&DT).
Conflict of Interest Statement
The author declares that the research was conducted in the absence of any commercial or financial relationships that could be construed as a potential conflict of interest.
Acknowledgments
The author would like to thank Filomena Saraiva from Docapesca who provided the data source: Docapesca, “Dados Estatísticos, 2002 a 2016, Docapesca – Portos e Lotas, S.A. – Departamento de Estatística”. The author would also like to thank two reviewers who contributed to improve the scientific content of this work.
Supplementary Material
The Supplementary Material for this article can be found online at: https://www.frontiersin.org/articles/10.3389/fmars.2019.00302/full#supplementary-material
Footnotes
References
Antonakakis, K., Giannoulaki, M., Machias, A., Somarakis, S., Sanchez, S., Ibaibarriaga, L., et al. (2011). Assessment of sardine (Sardina pilchardus Walbaum, 1972) fishery in the eastern Mediterranean basin (North Aegean Sea). Mediterr. Mar. Sci. 12, 333–357.
Cardinale, M., Rätz, H.-J., and Cheilari, A. (2010). Scientific, Technical and Economic Committee for Fisheries (STECF). Assessment of Mediterranean Sea Stocks – Part 1 (STECF-10-05). Report of the SGMED-10-02, Working Group on the Mediterranean Part II. Scientific and Technical Research Series. EUR 24637 EN (Geneva: European Commission Joint Research Centre), 1077. doi: 10.2788/59974
Cheung, W. W. L., Watson, R., and Pauly, D. (2013). Signature of ocean warming in global fisheries catch. Nature 497, 365–368. doi: 10.1038/nature12156
Colloca, F., Cardinale, M., Maynou, F., Giannoulaki, M., Scarcella, G., Jenko, K., et al. (2013). Rebuilding mediterranean fisheries: a new paradigm for ecological sustainability. Fish Fish. 14, 89–109. doi: 10.1111/j.1467-2979.2011.00453.x
Conover, O. D., Munch, S. B., and Arnott, S. A. (2009). Reversal of evolutionary downsizing caused by selective harvest of large fish. Proc. Biol. Sci. 276, 2015–2020. doi: 10.1098/rspb.2009.0003
De Roos, A. M., Boukal, D. S., and Persson, L. (2006). Evolutionary regime shifts in age and size at maturation of exploited fish stocks. Proc. Biol. Sci. 273, 1873–1880. doi: 10.1098/rspb.2006.3518
Frank, K. T., Petrie, B., Choi, J. S., and Leggett, W. C. (2005). Trophic cascades in a formerly cod-dominated ecosystem. Science 308, 1621–1623. doi: 10.1126/science.1113075
Froese, R., and Pauly, D. (2019). FishBase. World Wide Web Electronic Publication. Avilable at: www.fishbase.org (accessed January 22, 2019).
Froese, R., Stern-Pirlot, A., Winker, H., and Gascuel, D. (2008). Size matters: how single-species management can contribute to ecosystem-based fisheries management. Fish. Res. 92, 231–241. doi: 10.1016/j.fishres.2008.01.005
Garcia, S. M., Zerbi, A., Aliaume, C., Do Chi, T., and Lasserre, G. (2003). The Ecosystem Approach to Fisheries. Issues, Terminology, Principles, Institutional Foundations, Implementation and Outlook. FAO Fisheries Technical Paper. No. 443. Rome: FAO, 71.
Goodyear, C. P. (2015). Understanding maximum size in the catch: atlantic blue marlin as an example. Trans. Am. Fish. Soc. 144, 274–282. doi: 10.1080/00028487.2014.986339
Hidalgo, M., Massutí, E., Guijarro, B., Moranta, J., Ciannelli, L., Lloret, J., et al. (2009). Population effects and changes in life history traits in relation to phase transitions induced by long-term fishery harvesting: European hake (Merluccius merluccius) off the Balearic Islands. Can. J. Fish. Aquat. Sci. 66, 1355–1370. doi: 10.1139/F09-081
Hsieh, C.-H., Reiss, C. S., Hunter, J. R., Beddington, J. R., May, R. M., and Sugihara, G. (2006). Fishing elevates variability in the abundance of exploited species. Nature 443, 859–862. doi: 10.1038/nature05232
ICES (2017). Report of the Working Group on Southern Horse Mackerel, Anchovy and Sardine (WGHANSA). Bilbao: ICES CM 2017/ACOM:17, 640.
Karydis, M., and Tsirtsis, G. (1996). Ecological indices: a biometric approach for assessing eutrophication levels in the marine environment. Sci. Total Environ. 186, 209–219. doi: 10.1016/0048-9697(96)05114-5
Leitão, F. (2015). Landing profiles of Portuguese fisheries: assessing the state of stocks. Fish. Manag. Ecol. 22, 152–163. doi: 10.1111/fme.12112
Leitão, F., Baptista, V., Erzini, K., and Zeller, D. (2014). Reconstructed catches and trends for mainland Portugal fisheries between 1938 and 2009: implications for sustainability, domestic fish supply and imports. Fish. Res. 155, 35–50. doi: 10.1016/j.fishres.2014.02.012
Maynou, F. (2015). Application of a multi-annual generalized depletion model to the assessment of a data-limited coastal fishery in the western mediterranean. Sci. Mar. 79, 157–168. doi: 10.3989/scimar.04173.28A
Morato, T., Watson, R., Pitcher, T. J., and Pauly, D. (2006). Fishing down the deep. Fish Fish. 7, 24–34. doi: 10.1111/j.1467-2979.2006.00205.x
OSPAR (2008). OSPAR Background Document on the EcoQO on Changes in the Proportion of Large fish and Evaluation of the Size Based Indicators. OSPAR 356/2008. Paris: OSPAR.
Pauly, D., Alder, J., Bennett, E., Christensen, V., Tyedmers, P., and Watson, R. (2003). The future for fisheries. Science 303, 1359–1361. doi: 10.1126/science.1088667
Pauly, D., Christensen, V., Dalsgaard, J., Froese, R., and Torres, F. Jr. (1998). Fishing down marine food webs. Science 279, 860–863. doi: 10.1126/science.279.5352.860
Ricker, W. E. (2011). Changes in the average size and average age of pacific salmon. Can. J. Fish. Aquat. Sci. 38, 1636–1656. doi: 10.1139/f81-213
Rogers, S., Casini, M., Cury, P., Heath, M., Irigoien, X., Kuosa, H., et al. (2010). Marine Strategy Framework Directive- Task Group 4 Food Webs. Luxemburg: Office for Official Publications of the European Communities, 55.
Shin, Y.-J., Rochet, M.-J., Jennings, S., Field, J. G., and Gislason, H. (2005). Using size-based indicators to evaluate the ecosystem effects of fishing. ICES J. Mar. Sci. 62, 384–396. doi: 10.1016/j.icesjms.2005.01.004
Shin, Y.-J., Shannon, L. J., Bundy, A., Coll, M., Aydin, K., Bez, N., et al. (2010). Using indicators for evaluating, comparing, and communicating the ecological status of exploited marine ecosystems. 2. Setting the scene. ICES J. Mar. Sci. 67, 692–716. doi: 10.1093/icesjms/fsp273
Keywords: fishing indicator status, fisheries size-based trends, marine monitoring index, ecological fisheries management, size–based index
Citation: Leitão F (2019) Mean Size of the Landed Catch: A Fishery Community Index for Trend Assessment in Exploited Marine Ecosystems. Front. Mar. Sci. 6:302. doi: 10.3389/fmars.2019.00302
Received: 17 January 2019; Accepted: 22 May 2019;
Published: 11 June 2019.
Edited by:
Ertug Duzgunes, Karadeniz Technical University, TurkeyReviewed by:
Dimitrios K. Moutopoulos, Technological Educational Institute of Western Greece, GreeceJeffrey Mangel, Prodelphinus, Peru
Copyright © 2019 Leitão. This is an open-access article distributed under the terms of the Creative Commons Attribution License (CC BY). The use, distribution or reproduction in other forums is permitted, provided the original author(s) and the copyright owner(s) are credited and that the original publication in this journal is cited, in accordance with accepted academic practice. No use, distribution or reproduction is permitted which does not comply with these terms.
*Correspondence: Francisco Leitão, ZmxlaXRhb0B1YWxnLnB0LmNvbQ==