 Paris V. Stefanoudis1,2*
 Erika Gress1
 Joanna M. Pitt3
 Struan Robertson Smith4
 Todd Kincaid5Molly Rivers1
 Dominic A. Andradi-Brown2,6Gwilym Rowlands2
 Lucy C. Woodall1,2†
 Alex D. Rogers1,2†
- 1Nekton Foundation, Oxford, United Kingdom
- 2Department of Zoology, University of Oxford, Oxford, United Kingdom
- 3Marine Resources Section, Department of Environment and Natural Resources, St. George’s, Bermuda
- 4Natural History Museum, Bermuda Aquarium, Museum and Zoo, Hamilton, Bermuda
- 5Global Underwater Explorers – Project Baseline, Reno, NV, United States
- 6Ocean Conservation, World Wildlife Fund – US, Washington, DC, United States
Shallow coral reef ecosystems worldwide are affected by local and global anthropogenic stressors. Exploring fish assemblages on deeper reefs is therefore important to examine their connectivity, and to help understand the biodiversity, ecology, distinctiveness, evolutionary history and threats in this sparsely studied environment. Conducting visual surveys on the Bermuda slope and a nearby seamount at depths from 15 to 300 m, we document decreasing fish biomass and diversity with increasing depth. Fish assemblages were primarily depth-stratified, with distinct suites of species inhabiting shallow (<30 m depth) and upper (60 m) and lower (90 m) mesophotic coral ecosystems, and confirming the presence of a distinct rariphotic (∼150–300 m) assemblage. We also report evidence of anthropogenic pressures throughout our surveyed depths. Our results highlight the novelty of deeper reef fish faunas, therefore suggesting limited applicability of the deep reef refuge hypothesis, and showcase the vulnerability of deep reefs to targeted fishing pressure and invasive species.
Introduction
Around 6,300 fish species are known to occur in coral reef ecosystems worldwide (Parravicini et al., 2013), many of which are commercially exploited. However, because of the limitations of conventional SCUBA gear, most of our current knowledge of reef fish assemblages focuses on depths <30 m, despite coral reefs and their associated communities extending much deeper (∼150 m) (Baker and Harris, 2016). Nevertheless, the global decline of shallow coral reefs (Hughes et al., 2018) has made deeper but light-dependent coral habitats, known as mesophotic coral ecosystems (MCEs, typically situated between 30 and 150 m) (Hinderstein et al., 2010), the focus of numerous surveys during the last decade (Baker and Harris, 2016). Many of these surveys have sought to establish if MCEs could buffer biodiversity loss by providing refuge to depth generalist taxa that form part of shallow assemblages of corals and fish (e.g., Bongaerts et al., 2010; Lindfield et al., 2016).
Aided by advances in technical diving technology, recent biodiversity assessments of MCEs demonstrated that the upper MCEs (∼30–60 m) harbor biologically unique fish faunas with varying degrees of taxonomic overlap with shallower reef assemblages (Bejarano et al., 2014; Kane and Tissot, 2017; Semmler et al., 2017; Rocha et al., 2018). The magnitude of taxonomic overlap and the cut-off depth at which faunal breaks occur vary by location and are likely determined by a combination of local and regional, contemporary and historic environmental drivers and anthropogenic activities (Laverick et al., 2017). Similarly, several studies have found that lower MCEs (∼60–150 m) also support fish assemblages distinct from upper MCEs and shallower habitats (Kahng et al., 2017; Semmler et al., 2017; Sih et al., 2017), suggesting even greater partitioning than previously thought. These assemblages are typified by the increased occurrence of endemic or undescribed species with increasing depth (Kane et al., 2014; Fukunaga et al., 2017; Kosaki et al., 2017) and thus warrant sustainable management and conservation in themselves. With a few exceptions (Colin, 1976; Thresher and Colin, 1986; Love et al., 2009; Starr et al., 2012; Sih et al., 2017), less is known about assemblages in deeper habitats (>150 m) from tropical and sub-tropical locations. Recent research from this deeper reef zone, defined as “rariphotic” (∼150–300 m, sensu Baldwin et al., 2018), provided evidence of distinct fish assemblages that have little overlap with those of MCEs but which are nevertheless dominated by deep-living representatives of taxonomic groups (i.e., families) usually found in shallow water as opposed to the deep sea (Sih et al., 2017; Baldwin et al., 2018).
There is an increasing trend of fisheries targeting deeper reefs (Sadovy de Mitcheson et al., 2013; Newman et al., 2016). This exploitation has been accelerated by the availability of improved technology (Pitcher and Lam, 2015), but in some cases it has been also driven by the overexploitation of shallow-water reef populations (e.g., pot-fishing in Bermuda, Luckhurst and Ward, 1996). Several studies have identified the opportunity to use spatial conservation measures to protect areas of deeper reef subject to fishing, especially spawning grounds and migration corridors for species of conservation concern such as deep-water snappers (Lutjanidae), groupers (Epinephelidae) and emperors (Lethrinidae) (Sadovy de Mitcheson et al., 2013; Newman et al., 2016). However, management of these fisheries is, at present, complicated by a lack of data on fish assemblages and species biology at deeper depths. In the face of rising exploitation and environmental change, there is a clear and urgent need to evaluate these deeper reef ecosystems and their associated fish assemblages.
With the above in mind, we investigated reef fish assemblages in Bermuda, an isolated group of islands in the Sargasso Sea (western central Atlantic) (Figure 1). Bermuda is an interesting area to study patterns of marine biodiversity because of its unique biogeographic characteristics (e.g., remote, small, isolated, high latitude area with warm waters and tropical species). While the shallow-water reef fish fauna of Bermuda is well-known (Smith et al., 2013), to date, only one study has systematically documented reef fish assemblages from upper and lower MCEs (Pinheiro et al., 2016), and none from deeper reefs. At present, the only available information on the diversity of these deeper assemblages comes from historical museum specimens collected by fishers and scientists using traps at depth, along with earlier casual observations with submersibles (Smith-Vaniz et al., 1999). Utilizing the latest underwater technology (technical divers with closed-circuit rebreathers, and submersibles), we investigated reef habitats across a bathymetric gradient from 15 to 305 m at three locations on the Bermuda slope and one location on the flank of a neighboring seamount (Plantagenet Bank). This allowed us to investigate changes in reef fish assemblage structure (abundance, biomass, diversity, trophic composition) with depth, and assess assemblage overlap between different reef faunal zones. We also estimated benthic characteristics (community composition and substrate type) and measured environmental parameters (conductivity, temperature, salinity, nutrients) in order to identify potential drivers of reef fish assemblage structure.
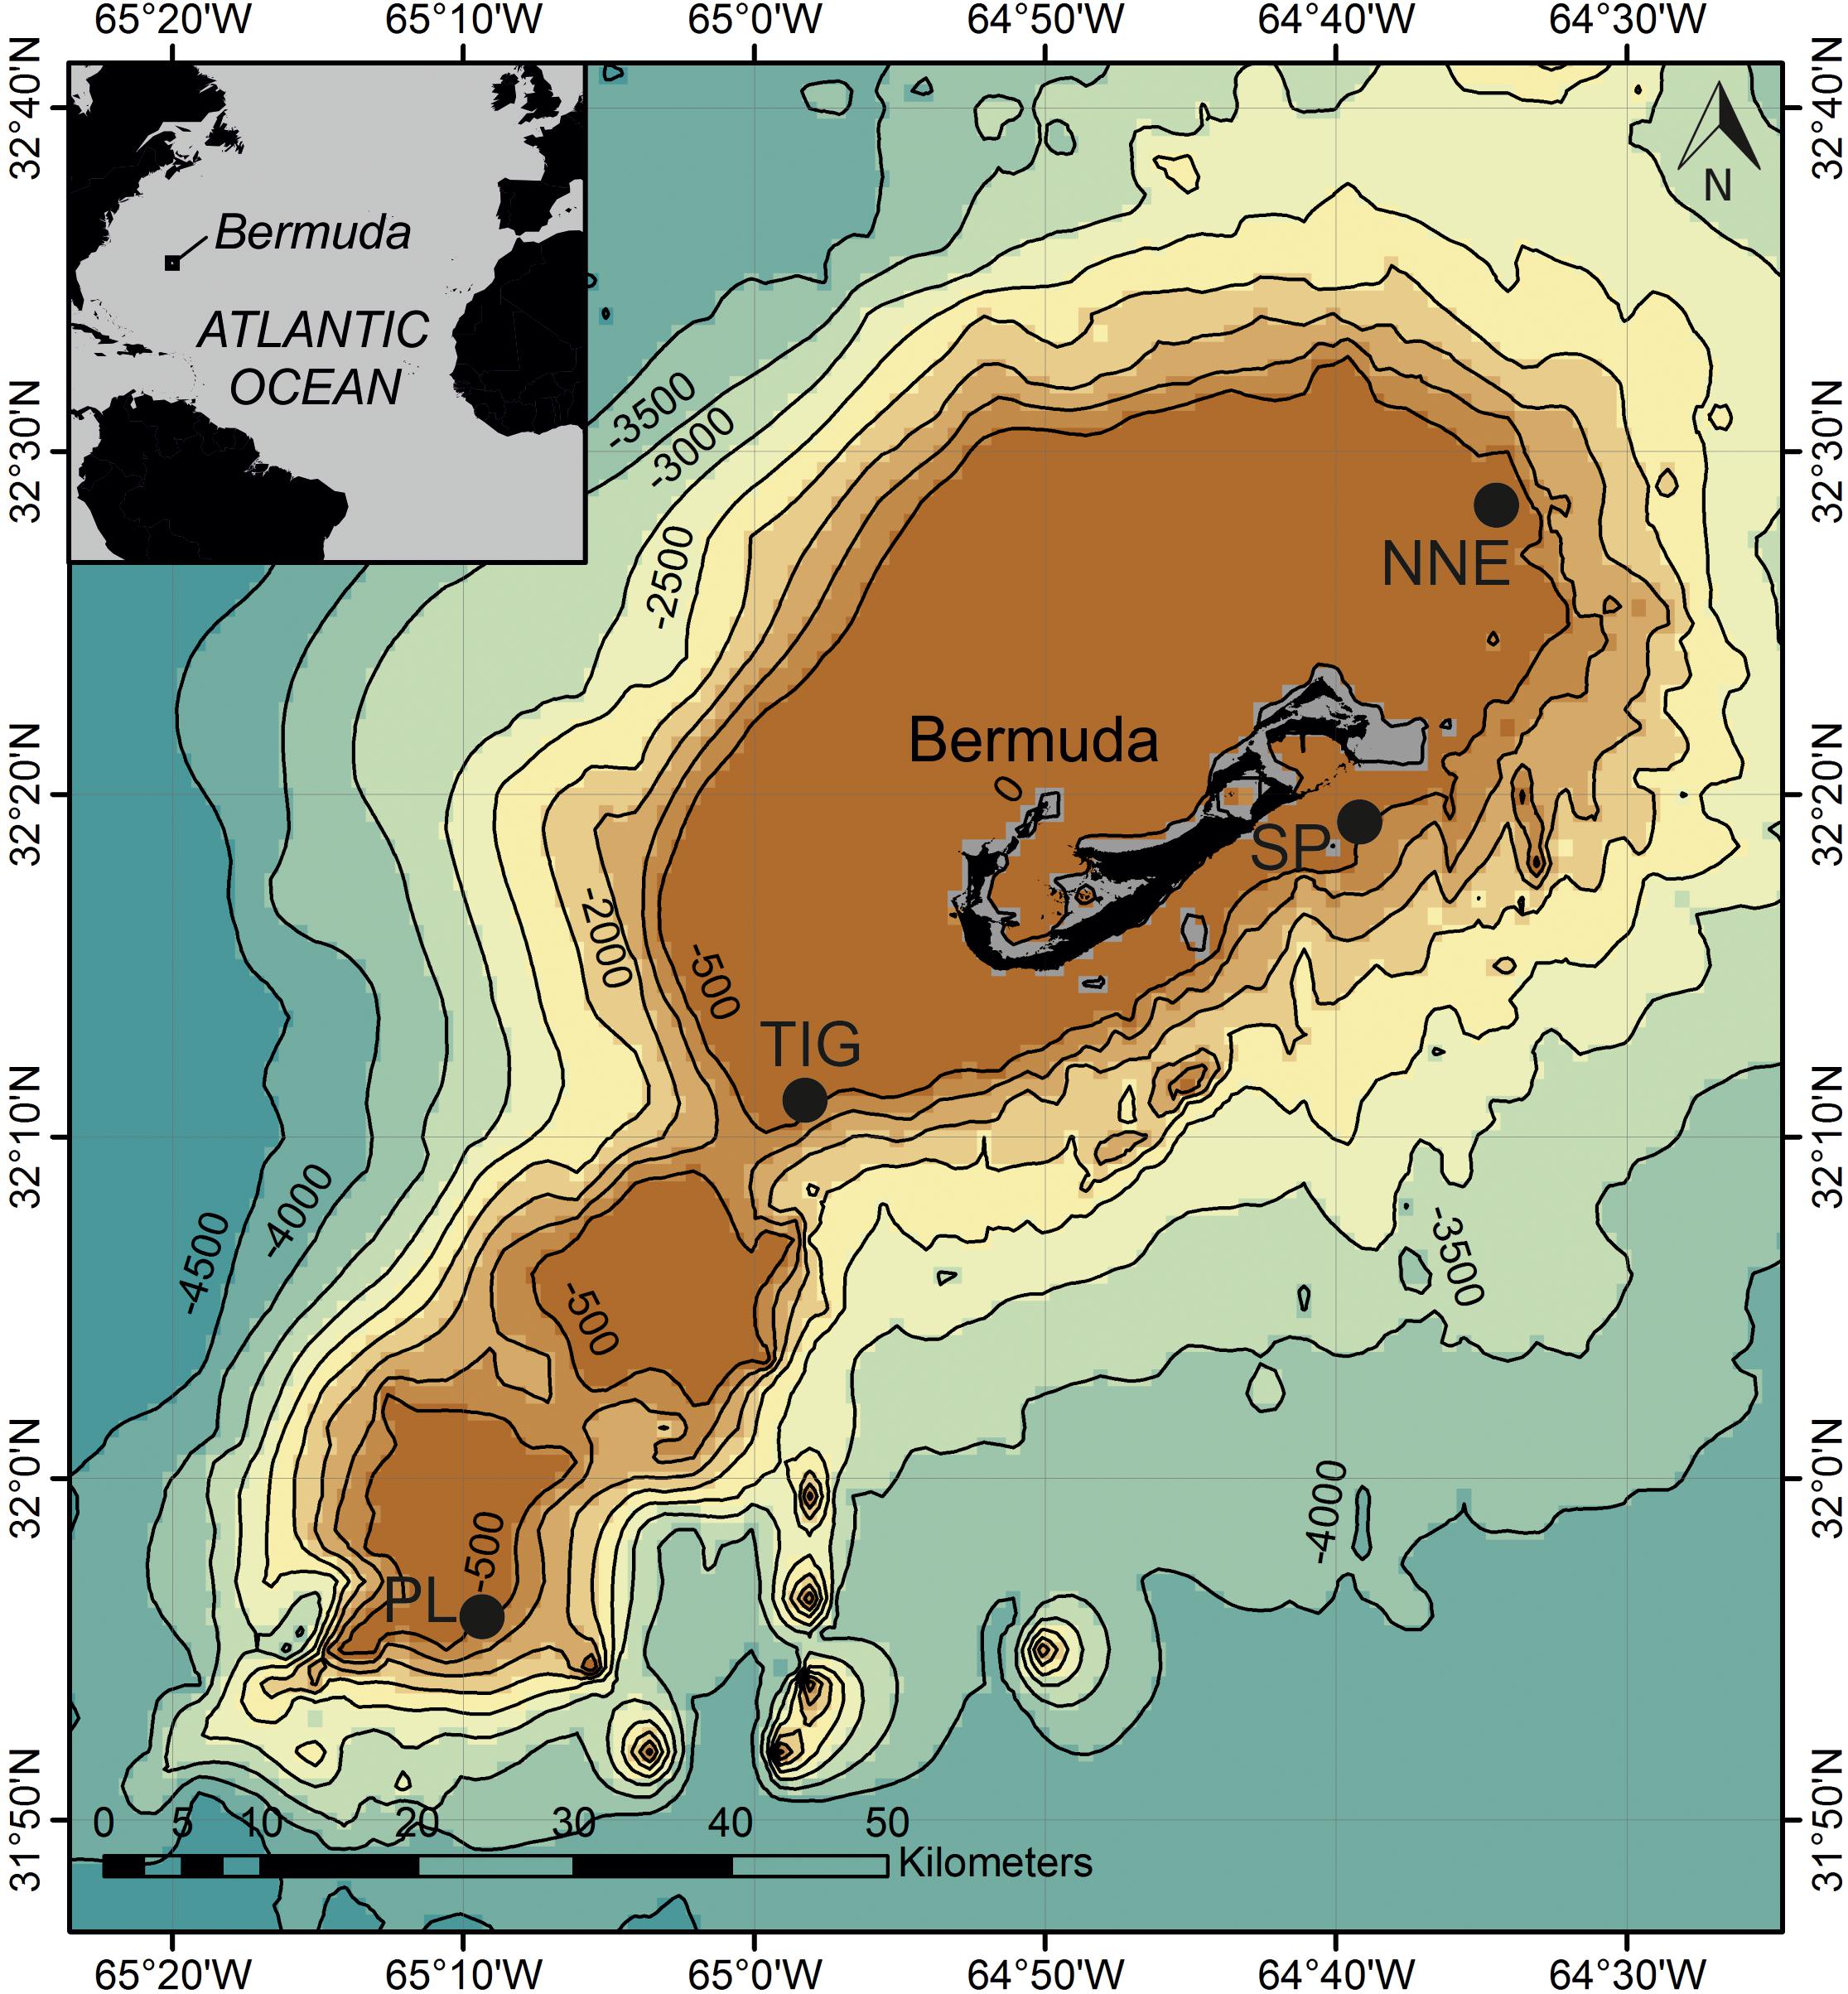
Figure 1. Map of study sites around Bermuda. Data overlay GEBCO_2014 Grid which provides 30 arc-second global grid of elevations. Depth contours in meters. NNE, North Northeast; PL, Plantagenet Bank; SP, Spittal; TIG, Tiger.
Materials and Methods
Experimental Design
We examined fish assemblages between 15 and 305 m depth at three sites: North Northeast, Spittal, and Tiger, along the north east, south east and southern slopes of the Bermuda platform, respectively, and on one adjacent seamount (Plantagenet Bank) (Figure 1 and Supplementary Table S1). All transect surveys were conducted during 17 July and 14 August 2016 aboard the R/V Baseline Explorer. Research permits for Bermuda were issued by the Department of Environment and Natural Resources, Bermuda (Ship Approval No. 87/2016).
Data from shallowest depths (15–94 m) were gathered by a team of nine technical divers (Global Underwater Explorers; GUE) equipped with closed-circuit rebreathers [JJ-CCR CE Edition (JJ-CCR ApS, Copenhagen DE)] modified to GUE Configuration (GUE, High Springs, FL – see1) and diver propulsion vehicles. Transects were filmed using a diver-operated stereo-video system (DOV; SeaGIS, Melbourne, Australia) consisting of two cameras (GoPro Hero 4 Camera in custom-built SeaGIS DOV housing), pointed at an angle of 3° and spaced 80 cm apart. The transects followed a 50 m survey tape laid along the depth contour, with the cameras facing forward, about 0.5 m off the seafloor. The same survey tapes were also used to guide video transects that recorded the substratum type / composition and the diversity and density of life on the seafloor (benthos), using the camera and light system oriented perpendicular to the seabed. In total, 37 transects were conducted by technical divers at ∼15 m (6 transects), 30 m (9), 60 m (12) and 90 m (10).
Videos of the deeper transects (136–305 m) were collected using the Nemo and Nomad Triton 1000-2 class submersibles (Triton submersibles, Vero Beach, FL, United States). The Nemo submersible primarily carried out video surveys, whilst Nomad was employed for water and biological sampling, and for high-resolution filming of operations and marine life. Nemo was equipped with four forward facing Deep-Sea Matrix-1 LED Lights to illuminate the water column and the seafloor, a submersible-operated stereo-video system (SOV) comprising two cameras (GoPro Hero 4 Camera in Scout Pro Go Benthic 2 1000 m depth-rated housing; Group Binc, Jensen Beach, FL, United States) mounted on the lower starboard nacelle along an aluminum bar, pointed at an angle of 8° and spaced 80 cm apart, and a downward-pointing camera with Teledyne-Bowtech Ocean Lasers (Green) spaced at 25 cm. Submersible position and depth was measured via a TrackLink 1500 USBL acoustic tracking system (LinkQuest Inc., San Diego, CA, United States), which was calibrated with PneumoCal Pneumo Gauges. The submersible pilot aimed to maintain a consistent distance from the substrate during surveys, but this was not always possible as terrain was of varying steepness and topography. Transects consisted of 20 min of filming and covered an estimated distance of 100 m at a speed of 0.2 knots. A 5-min gap, during which the submersible traversed the seabed, was used to separate replicate transects at a given depth. In total, 42 transects were conducted by submersibles at ∼150 m (7 transects), 200 m (11), 250 m (12), and 300 m (12). Detailed characteristics of each transect survey can be found in Supplementary Table S1.
Conductivity, temperature and salinity (CTD) were measured down to depths of 94 m by the technical divers using a YSI EXO1 Multiparameter Sonde (YSI Incorporated, Yellow Springs, OH, United States). The submersible Nomad was fitted with a SBE 49 FastCAT CTD Sensor (SeaBird Electronics Inc., Bellevue, WA, United States) to measure the same parameters between 136 and 305 m. At depths down to 93 m, divers collected water samples using Niskin bottles in order to estimate macronutrient levels (nitrate-nitrite and phosphate). Each water sample was subsampled immediately after return on the vessel and kept frozen into a plastic centrifuge container until later laboratory analysis using a SEAL Analytical QuAAtro AutoAnalyzer.
Fish Data
Retrieved stereo-video system footage was calibrated using a 3D calibration cube and CAL software v3.01 (SeaGIS Pty Ltd., Australia). The calibrated and synchronized transect footage was analyzed using the software EventMeasure v3.51 (SeaGIS Pty Ltd., Australia), providing the total length of each fish. Center points of each individual fish encountered were resolved into distances on a three-dimensional coordinate system, allowing us to exclude fish further than 2.5 m on either side of the camera center (transect width = 5 m), and 5 m from the front of the camera system. Side distance restriction maintained a consistent belt along the transect, while front distance restriction prevented variation in visibility (e.g., turbidity, light intensity) from influencing data. It is worth noting, however, that visual surveys tend to be biased toward large, conspicuous fish, thus underestimating the densities of small, benthic, cryptically colored fish (Galland et al., 2017). In the present survey, the minimum fish length that could reliably be detected from the obtained stereo-video footage was ∼2 cm, hence, fish smaller than that have been overlooked.
Where possible, all annotated specimens were identified to species-level using Smith-Vaniz et al. (1999), Smith-Vaniz and Collette (2013), Robertson and van Tassel (2015), and following the taxonomic nomenclature of the World Register of Marine Species2. The lionfishes Pterois miles and P. volitans, were recorded as P. miles/volitans since positive identification requires DNA sequencing (Freshwater et al., 2009). Similarly, the acanthurids Acanthurus chirurgus and A. bahianus were recorded as A. chirurgus/bahianus as it was not always possible to separate them reliably because of low light levels, and the chubs Kyphosus incisor and K. sectatrix as K. incisor/sectatrix since positive identification requires physical examination of specimens. Furthermore, fish characteristics (biogeographic affinity, known depth range, conservation status and feeding guild) were assigned to each fish species following FishBase (Smith-Vaniz et al., 1999; Humann et al., 2002; Smith-Vaniz and Collette, 2013; Robertson and van Tassel, 2015; Froese and Pauly, 2017). The six trophic groups were: herbivores, invertivores, omnivores, piscivores, (zoo) planktivores, and finally carnivores, for fish species that feed both on other fish and invertebrates.
Benthic Data
To determine the composition of benthic assemblages and the underlying substrate, still images (JPEGS) were extracted at a rate of one frame per 10 s (DOV data) or per 30 s (SOV data) using Adobe Photoshop CC 2015, and subsequently processed in ImageJ. For each image we measured the surface area of reef building zooxanthellate Scleractinia, hereafter referred to as hard corals, and macroalgae (both fleshy and turf algae), as both parameters influence reef fish assemblages (Garcia-Sais, 2010). Hard coral and macroalgal cover were then expressed as the mean percentage cover per transect. Macroalgal cover measurements excluded heavily branched taxa such as Sporochnus bolleanus, which often obscured large parts of the stills despite actually covering only a small proportion of the seafloor, thus rendering accurate cover measurements for this species impossible. In each annotated image, the substratum was classified into the following types: (i) sediment (including mud, sand and rock fragments <25 cm); (ii) boulders (defined as rocks ≥25 cm); (iii) rhodolith beds (defined as unattached accretions of non-geniculate coralline algae); and (iv) bedrock (including sediment veneer, which applies to bedrock beneath a thin sediment layer as indicated by the presence of sessile biota). Area coverage of each substratum type was visually estimated and given a ranking of 1–5 [modified from Polunin and Roberts (1993)], representing 1–10%, 11–40%, 41–60%, 61–90%, or 91–100% of the seafloor, respectively. Visual estimates of habitat complexity or percentage cover of benthos and substratum, although semi-quantitative, have been shown to produce results that are comparable to quantitative techniques (Wilson et al., 2007). Substratum cover per type was expressed as a mean per transect. Finally, in order to provide a measure of anthropogenic activity on the studied habitats, we counted the occurrence of benthic debris (i.e., plastic trash, fishing gear, etc.) at each transect.
Statistical Analysis
Fish length measurements were converted into biomass using equation (1):
where L represents the fish length in centimeters, W the weight in grams, and a and b are species-specific conversion constants from FishBase (Froese and Pauly, 2017). Fish abundance, biomass and species richness were standardized per 500 m2.
Changes in fish abundance, biomass and species richness with depth and site were compared using a Kruskal-Wallis test on raw data since they all followed a non-normal distribution (Shapiro-Wilk, p > 0.05) even after transformations, followed by Mann-Whitney’s pairwise comparisons applied with a Bonferroni correction. Site comparisons only were performed on the following three depth subsets (i) 15–30 m, (ii) 60–90 m, and (iii) 150–300 m transects. We chose to do so as the number of conducted transects per depth at a given site was occasionally <3 (e.g., two transects were conducted in NNE at 15 m depth – see Supplementary Table S1), which did not allow statistical comparisons to take place.
Changes in fish assemblage composition were visualized using principal coordinates (PCO) analyses on Bray-Curtis similarity matrices among transects, calculated from log(x+1)-transformed abundance and biomass data to reduce the effect of common taxa (square-root and fourth-root transformations produced identical results). This transformation was followed by permutational analysis of variance (PERMANOVA) (two factors: depth and site) to identify significant differences between species assemblages. All PERMANOVAs in this study were run for 9999 permutations selecting Type III (partial) sums of squares and unrestricted permutation of the similarity matrix. Vector overlays of selected correlated species with one of the two PCO axes (Pearson’s correlation coefficient, ρ ≥ —0.5—) were used to help determine the main species driving fish assemblage pattern differences. Again, comparisons between sites were performed separately for 15–30 and 60–90 and 150–300 m. In order to further visualize changes in community composition between the seamount Plantagenet Bank and the three sites on the Bermuda slope (North Northeast, Spittal and Tiger), we plotted species abundance rankings, determined from the average abundance of a species across all transects at 60 m and deeper. We omitted the shallow transects (15–30 m) from this analysis, because the summit of Plantagenet Bank lies at ∼45 m.
For each trophic group, we tested whether the relative proportion of biomass (i.e., proportion of the overall fish assemblage biomass at each transect) varied with depth using a Kruskal-Wallis test, followed by Mann-Whitney’s pairwise comparisons applied with a Bonferroni correction.
Trends in benthic community composition and substrate type with depth were tested using a Kruskal-Wallis test. In order to investigate whether benthic community and substratum structure influence fish assemblages, we used a distance-based linear model (DISTLM) on a reduced dataset of 70 transects [Bray-Curtis similarity matrix on log(x+1)-transformed data] for which substratum data were available. We report the results of the best models only (i.e., those with the highest explanatory power identified using the BEST routine and Akaike’s criterion). Seawater chemistry data (CTD and macronutrients) were not included in the model since they were not consistently available across all depths. Finally, trends of environmental parameters with depth were explored with Pearson’s correlation coefficient; because of the limited number of available nutrient data for our studied transects, we took into account all available measurements taken throughout the expedition, which included measurements from all depths.
Kruskal-Wallis and Mann-Whitney post hoc tests were performed in SPSS v24 (IBM Corp., Armonk, NY), while multivariate statistical analyses (PCO, PERMANOVA, DISTLM) were carried out in PRIMER 7 (Clarke, 2015) and the add-on package PERMANOVA+ (Anderson et al., 2008).
Results
Fish Assemblage Characteristics
We recorded 1348 fishes, comprising 51 species and 19 families, from 79 transects at the four sites around Bermuda (Figure 1; see Supplementary Table S1 for detailed study site characteristics). Raw species abundance and biomass data per surveyed transect and depth can be found in Supplementary Data S1. Biogeographic affinities and threat status of each recorded species can be found in Supplementary Table S2. Our observations increased the known depth ranges of 10 species (Supplementary Table S2).
The majority of species recorded (n = 46) are known to occur in Bermudian waters, including species of conservation concern such as Mustelus canis (subs. insularis) classified as near-threatened by the IUCN, and the endemic Chromis bermudae, while one invasive taxon was recorded (Pterois miles/volitans, lionfish). A further four taxa represented putative new records for Bermuda: Gephyroberyx darwinii, Ostichthys trachypoma, Prognathodes cf. guyanensis and Squalus cubensis. Finally, we also report several casual observations (i.e., outside of the surveyed transects) of moray eels (Gymnothorax spp.) between 150 and 300 m, including G. maderensis and G. polygonius.
In general, depth-specialists (observed at one or two depths, n = 33) were more prevalent than depth-generalists (observed at three or more depths, n = 18), but Pterois miles/volitans (lionfish) was found at seven out of eight depths (Figure 2).
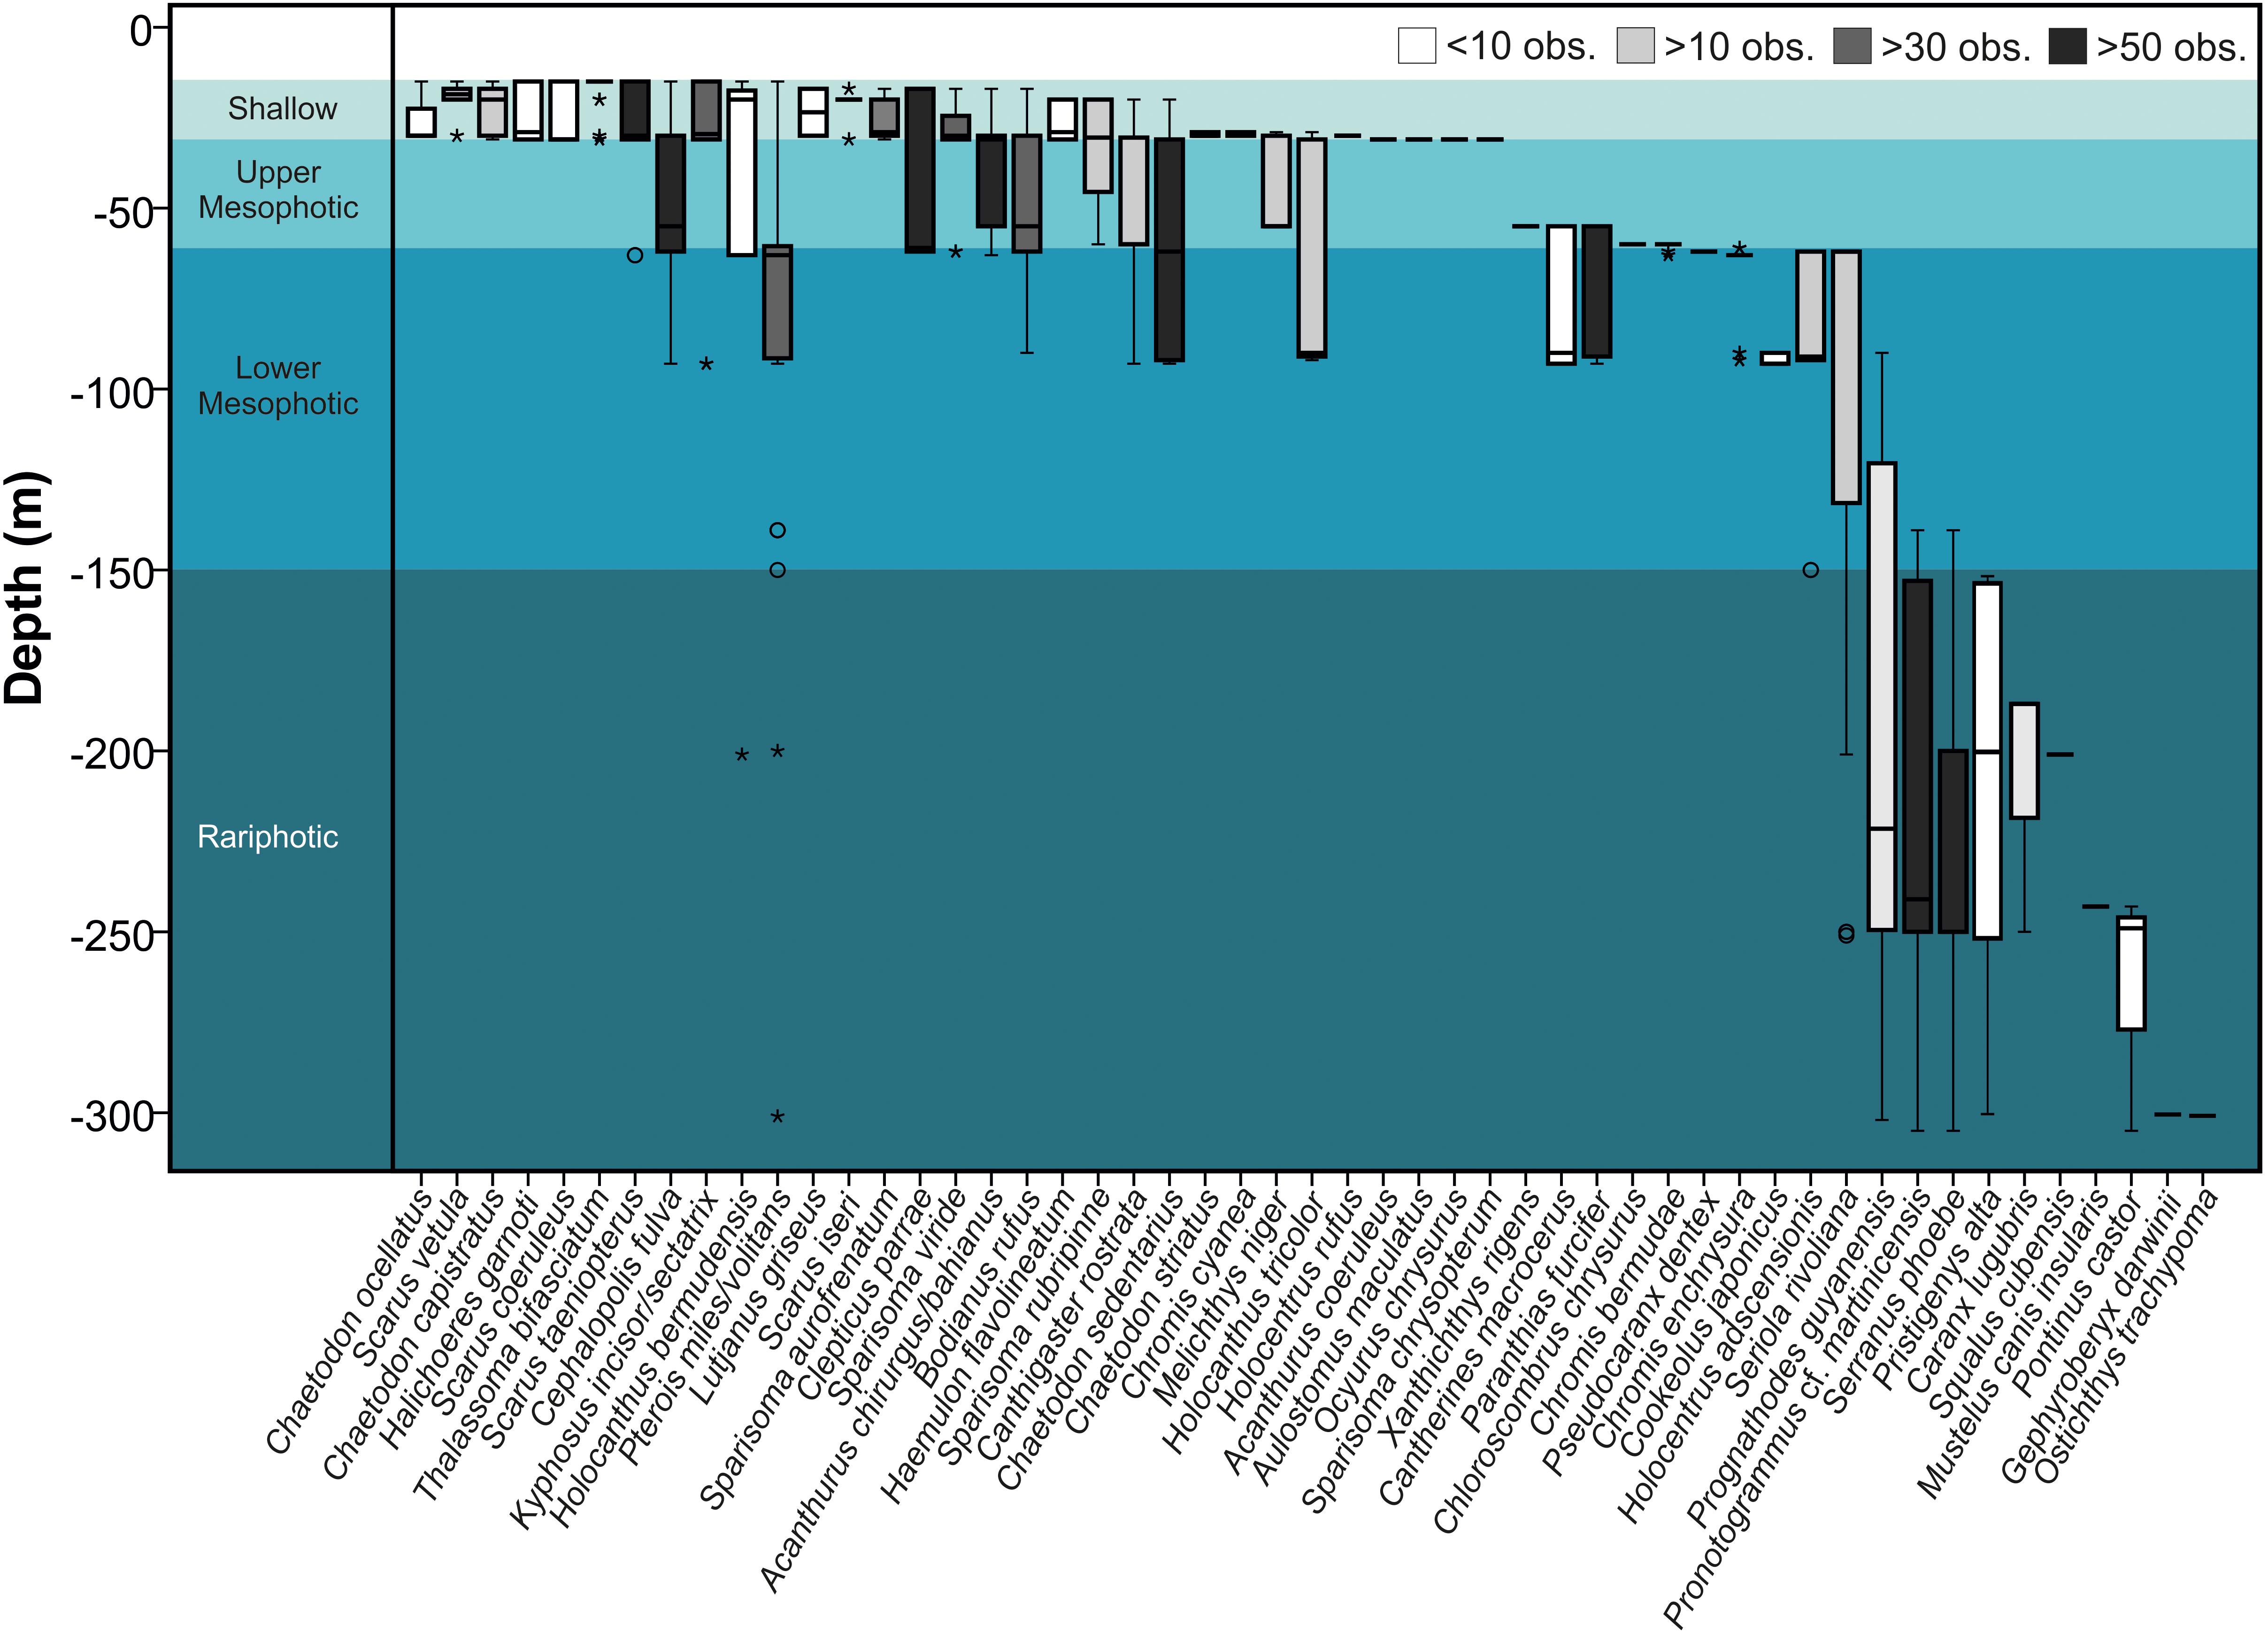
Figure 2. Depth distributions of the 51 fish species recorded between 15 and 305 m off Bermuda. Boxes indicate the 25th and 75th quantiles, whiskers are 1.5 the interquartile, circles are outliers, and asterisks extreme outliers.
Fish abundance changed with depth (Kruskal-Wallis, p = 0.045, Figure 3A), although none of the post hoc pairwise comparisons showed a significant difference (p > 0.05). Further, overall fish abundance was not affected by site (Kruskal-Wallis, p > 0.05). Fish biomass was significantly affected by depth (Kruskal-Wallis, p < 0.001, Figure 3B) but not site (Kruskal-Wallis, p > 0.05). Pairwise comparisons revealed significantly higher biomass at 15–90 m compared to the deepest transects at 300 m (Mann Whitney, p < 0.001 to 0.012). Finally, species richness changed with depth (Kruskal-Wallis, p < 0.001), peaking at 30 m, after which it decreased steadily down to 300 m (Figure 3C). Pairwise tests showed significantly higher species richness at 30 m compared to all other depths ≥150 m (Mann Whitney, p < 0.001 to 0.04), and at 15 m compared to 300 m (Mann Whitney, p = 0.001). Similar to biomass and abundance, richness did not vary with site (Kruskal Wallis, p > 0.05).
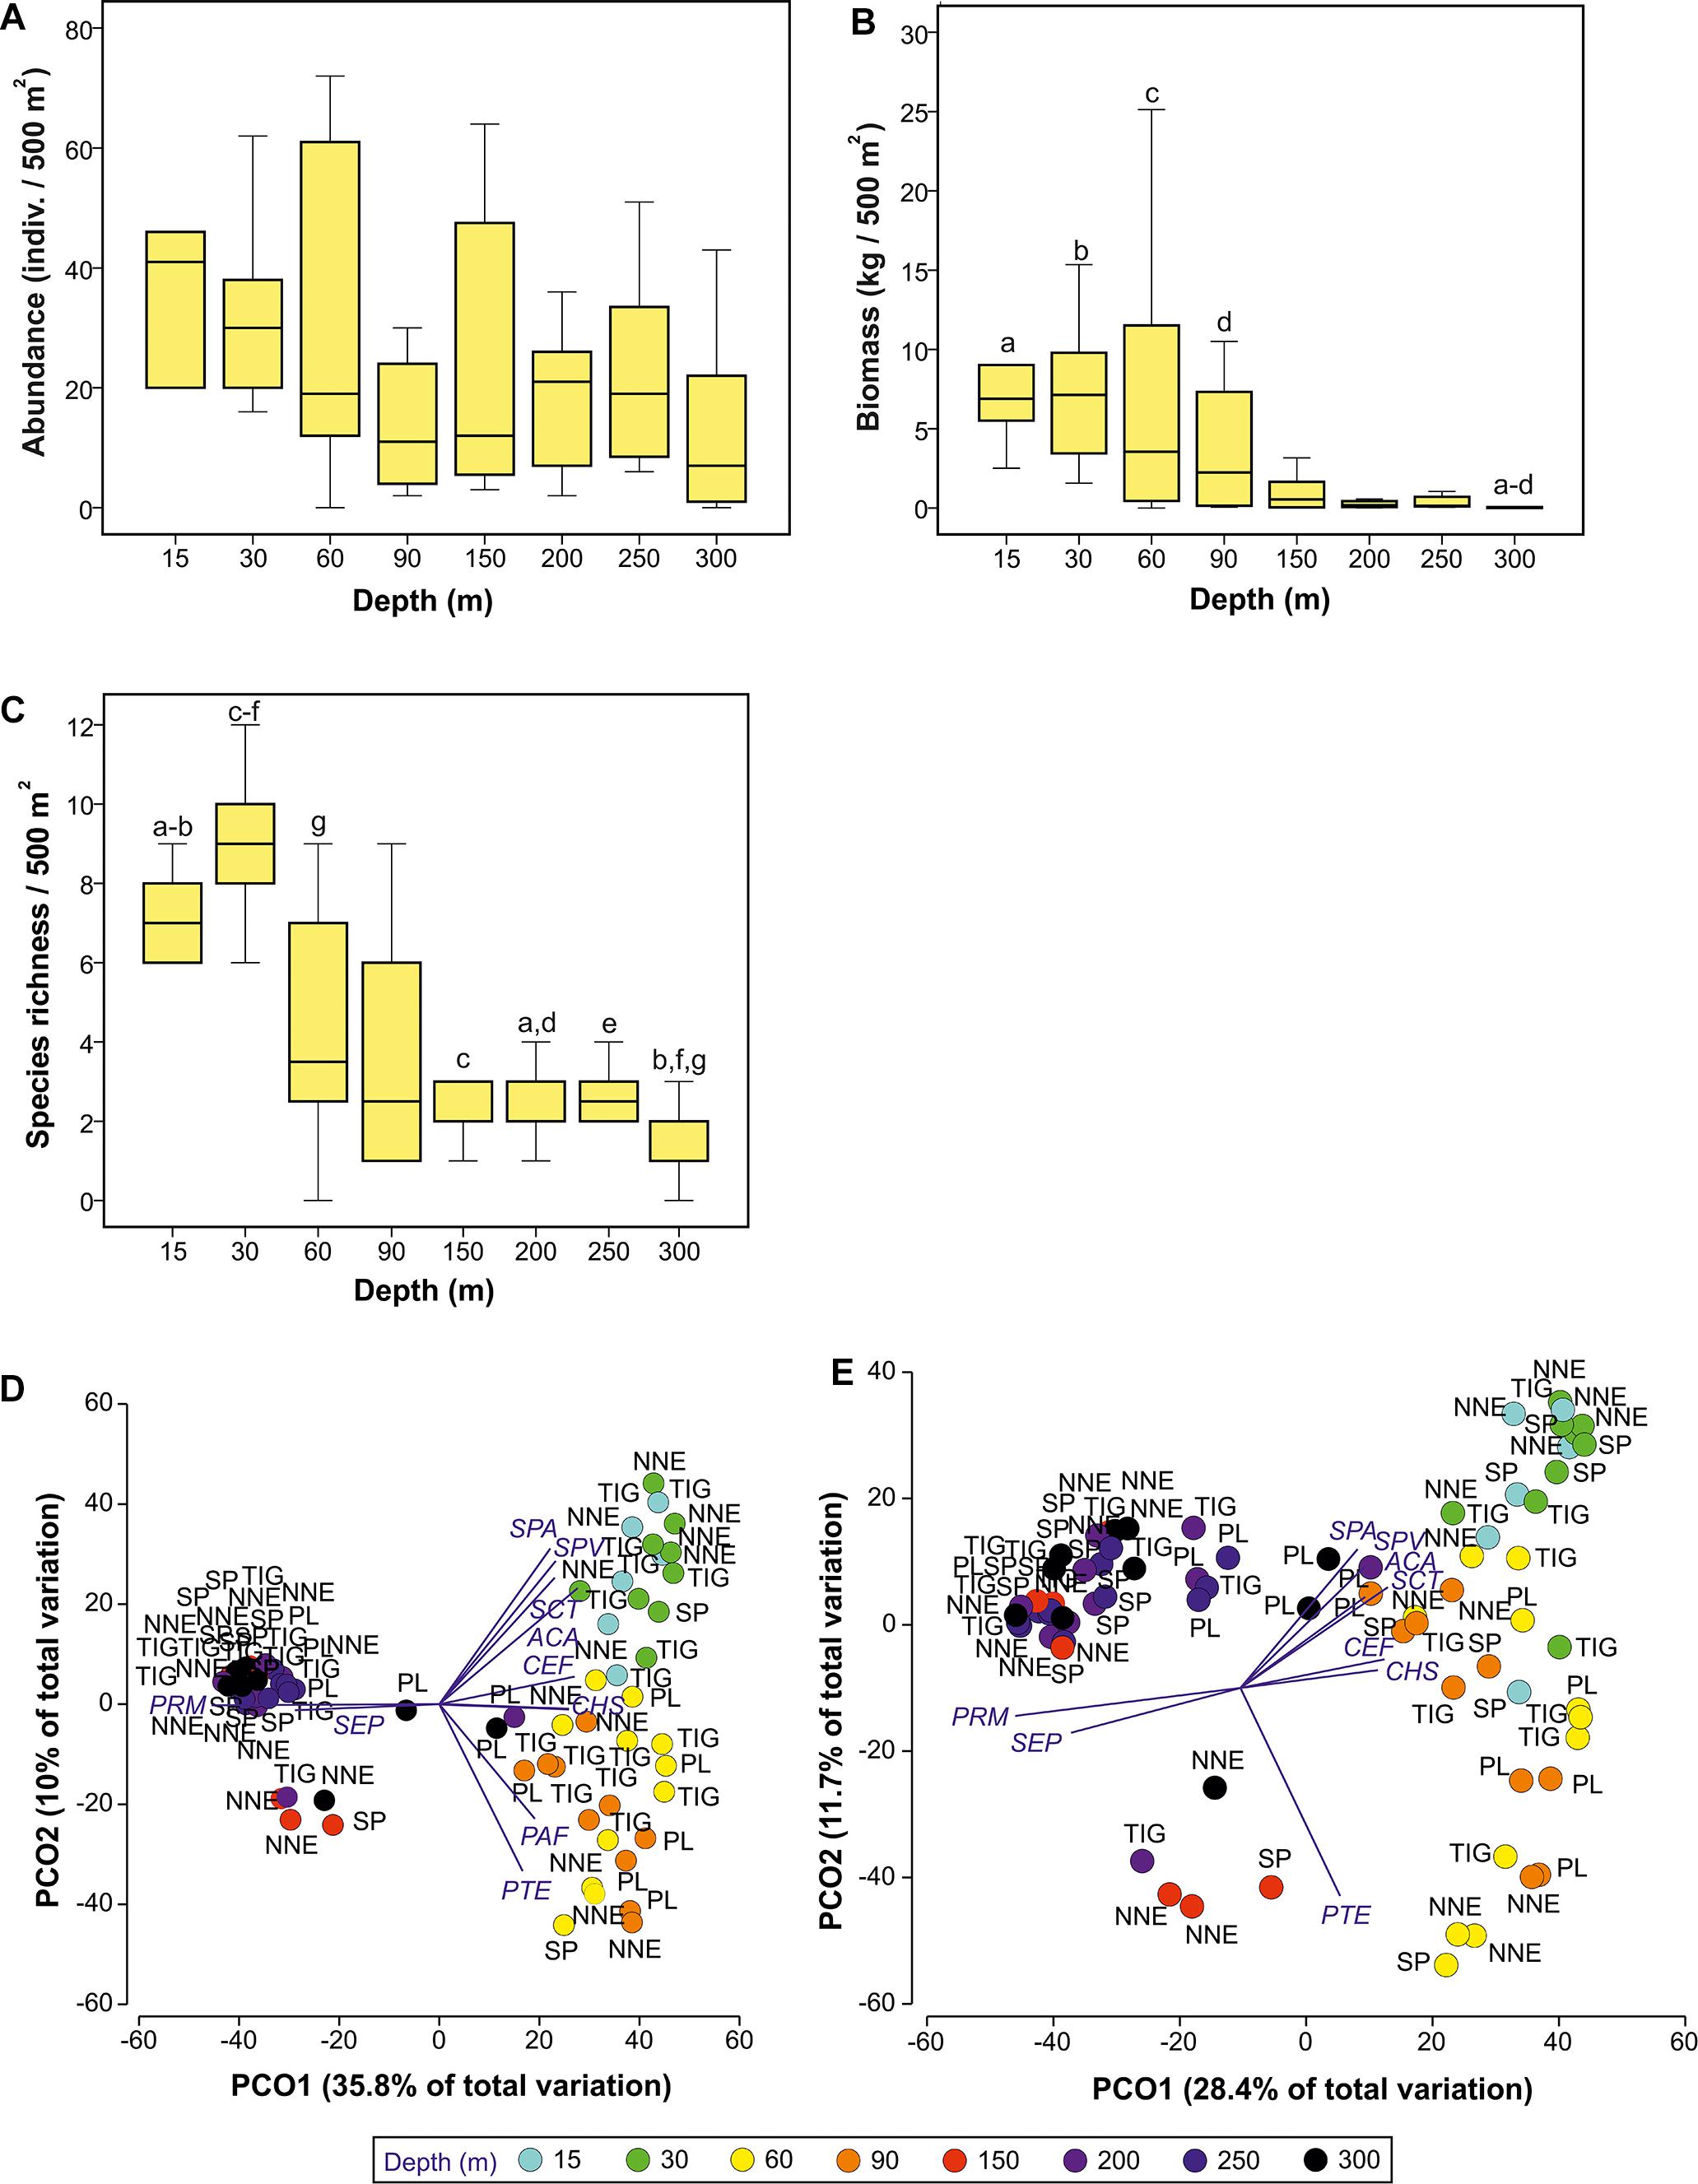
Figure 3. Selected changes in fish assemblages with depth and location, as identified by Kruskal-Wallis (A–C) and Principal Component Analysis (D,E). (A) Abundance against depth, (B) biomass against depth, (C) species richness against depth. Plots (A–C) indicate median and standards errors. Columns sharing the same letter indicate statistically significant differences (p < 0.05) based on Mann-Whitney pairwise tests. Boxes indicate the 25th and 75th quantiles, whiskers are 1.5 the interquartile. (D,E) Principal coordinates analysis ordination on log(x+1)-transformed fish abundance (D) and biomass (E) data at different depths using Bray-Curtis similarity resemblance matrix. Axes describe percentage variation in terms of total fish assemblage structure. Superimposed are vectors of species highly correlated with the two PCO axes (Pearson’s correlation coefficient, p ≥ |0.5|). The length and direction of the vectors represent the strength and direction of the relationship. NNE, North Northeast; PL, Plantagenet Bank; SP, Spittal; TIG, Tiger; ACA, Acanthurus chirurgus/bahianus; CEF, Cephalopolis fulva; CHS, Chaetodon sedentarius; PAF, Paranthias furcifer; PRM, Protonogrammus cf. martinicensis; PTE, Pterois miles/volitans; SCT, Scarus taeniopterus; SEP, Serranus phoebe; SPA, Sparisoma aurofrenatum; SPV, Sparisoma viride.
Two PCOs were used to display patterns of fish assemblage structure using abundance and biomass data, respectively (Figures 3D,E). Using abundance data (Figure 3D) three visually distinct fish assemblages are seen at 15–30 m, 60–90 m, and 150–300 m. This structuring was not as clear with biomass data, but the shallow vs. deep division was still observed (Figure 3E).
In total, ten species were highly correlated with the PCO axes (Pearson’s correlation coefficient, ρ ≥ |0.5|), Figures 3D,E). Of these, the presence and high densities of A. chirurgus/ bahianus, Scarus taeniopterus, Sparisoma aurofrenatum and Sparisoma viride typified shallow assemblages (15–30 m), Cephalopholis fulva and Chaetodon sedentarius characterized depth to 90 m, Paranthias furcifer and P. miles/volitans were mostly associated with the 60–90 m depth range, and Protonogrammus cf. martinicensis and Serranus phoebe were correlated with 150–300 m. The positioning of some deep (>150 m) Plantagenet transects at the center of both PCO plots resulted from the presence of unique species (e.g., S. cubensis), the presence of some typically shallower-occurring species (e.g., Holocanthus bermudensis), and the lower abundance of the common deeper species (e.g., P. martinicensis). The other cluster of deep samples on the bottom right of the plot can be explained by the presence of lionfish that typify assemblages at 60–90 m.
PERMANOVA indicated that depth and site were significant in shaping fish assemblage structure, irrespective of the type of dataset used (abundance or biomass data, Table 1). Further pairwise depth comparisons revealed four distinct assemblages at (i) 15–30 m, (ii) 60 m, (iii) 90 m, and (iv) 150–300 m, while tests across site found different assemblages at 60–90 m between Plantagenet Bank and North Northeast and between North Northeast and Spittal, and distinct assemblages at Plantagenet Bank compared to the rest of the sites at 150–300 m depths. In fact, five species were only encountered on Plantagenet Bank: the invertivores Xanthichthys ringens, and Cookeolus japonicus, the omnivorous Cantherhines macrocerus, the carnivorous S. cubensis, and the piscivorous C. lugubris. In addition, species abundance rankings were also different on Plantagenet Bank compared to similar depths at the sites on the Bermuda slope (Figure 4).
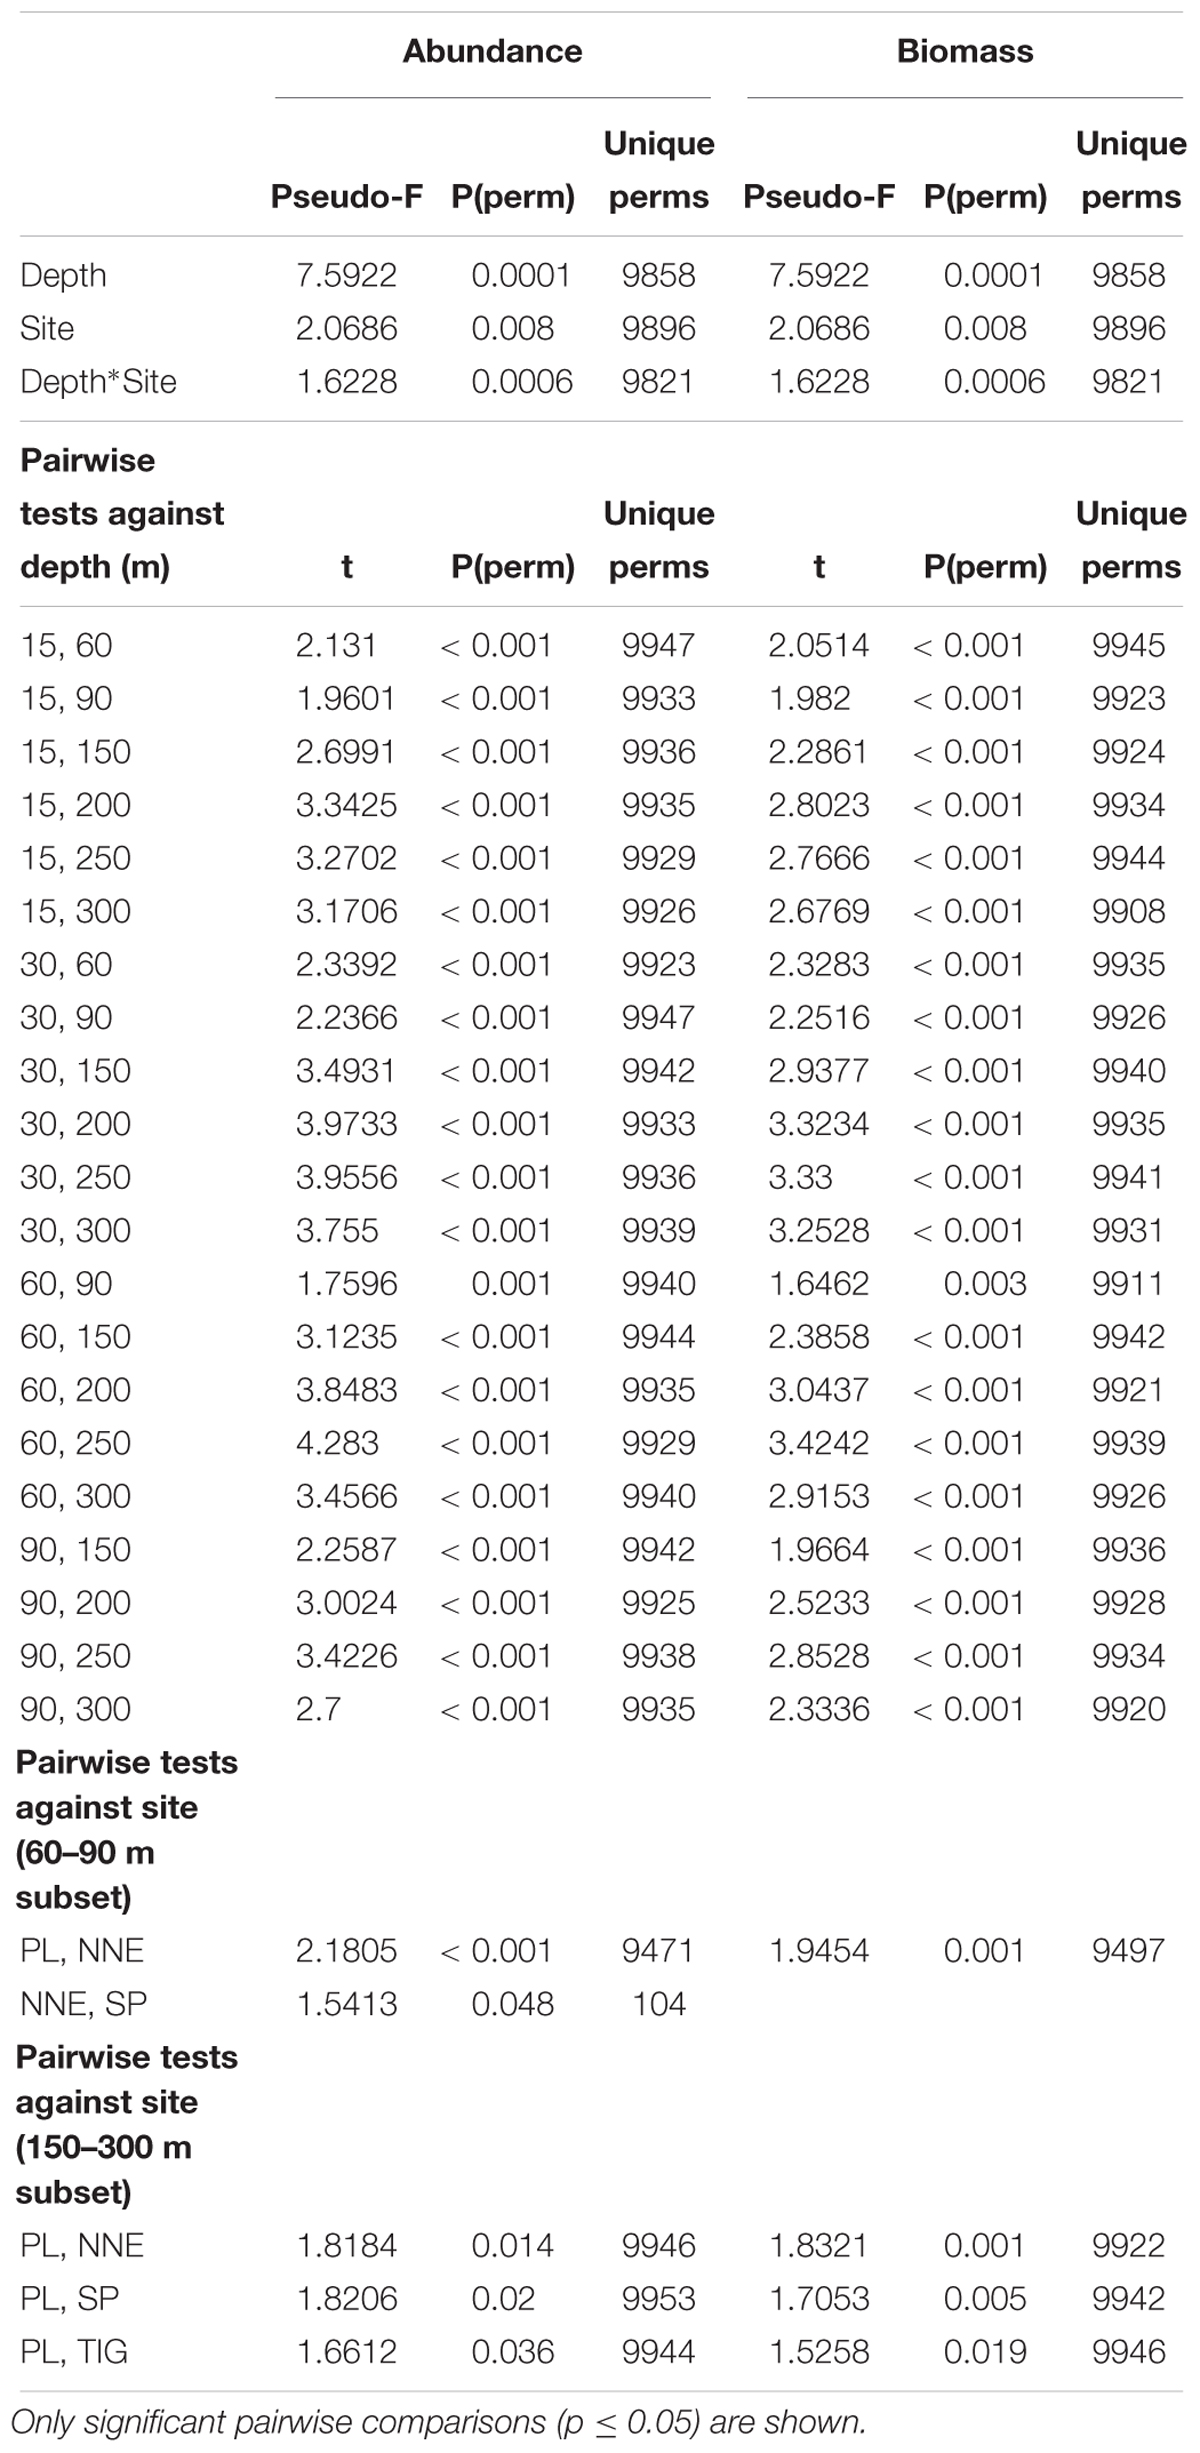
Table 1. Changes of fish community structure in relation to depth and site using PERMANOVA on Bray-Curtis similarity matrices of log(x+1)-transformed abundance and biomass-weighed data.
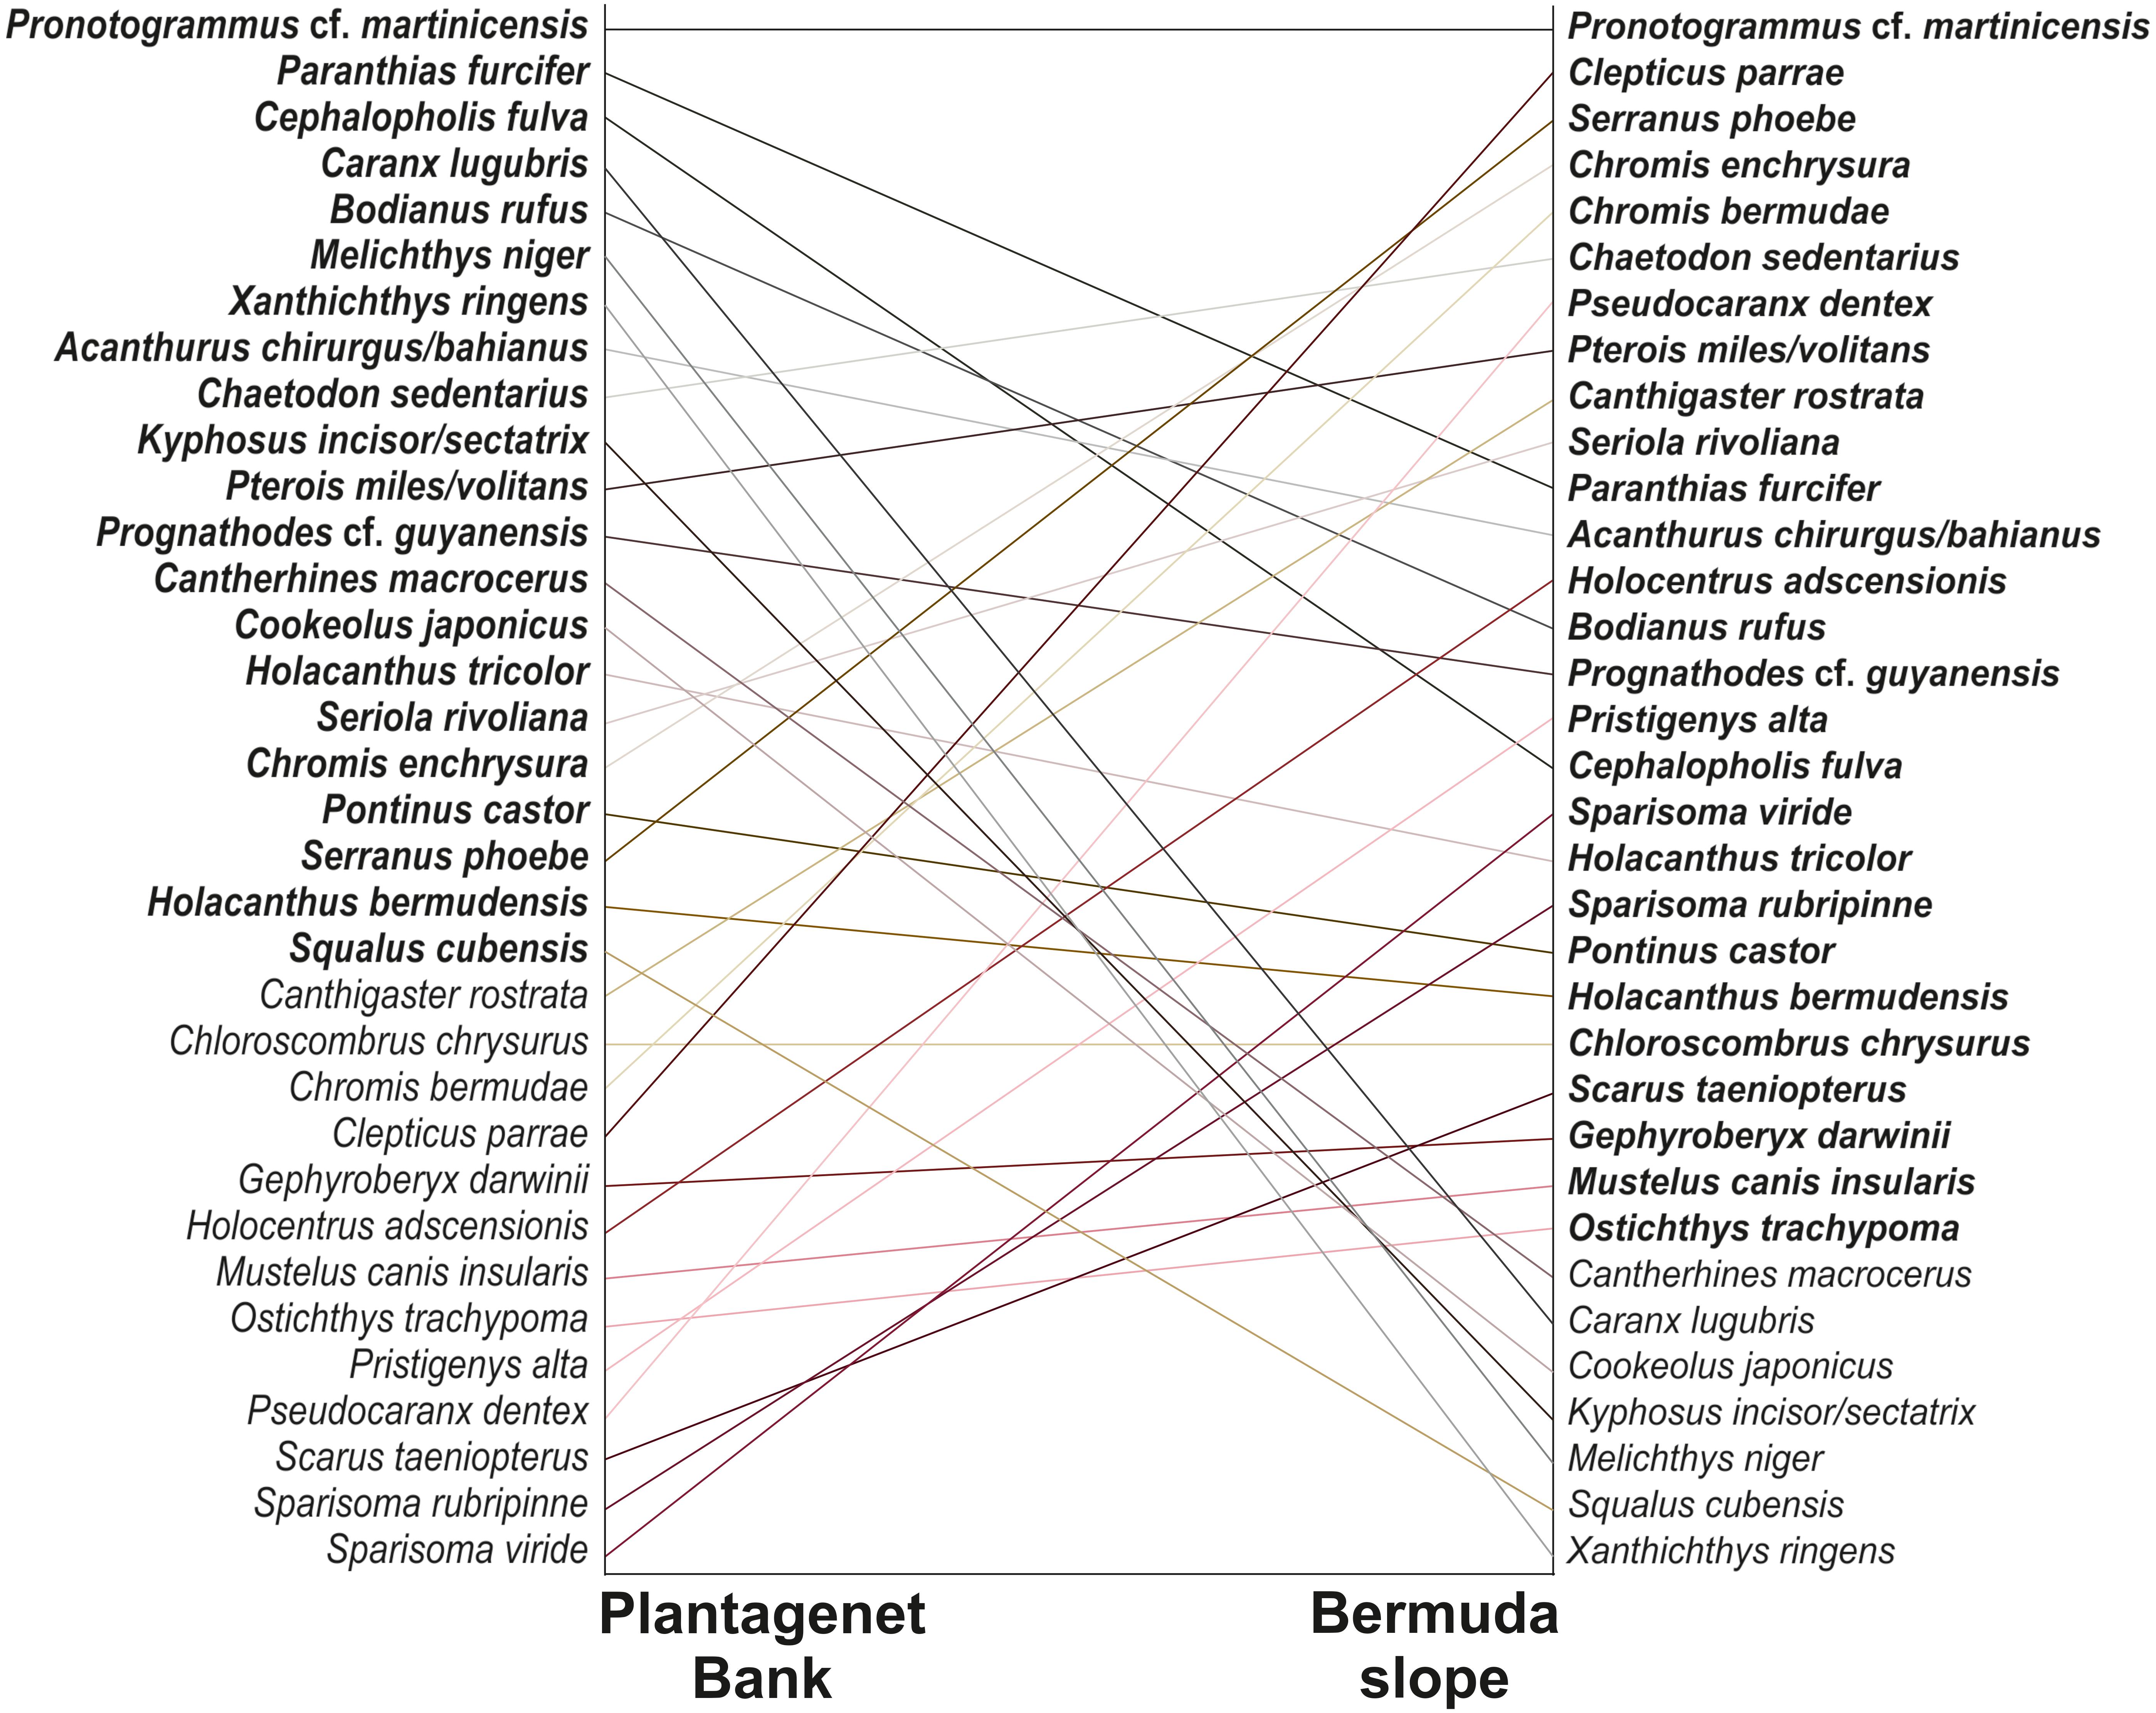
Figure 4. Rank orders based on average species abundances on Plantagenet Bank and the sites from the Bermuda slope (North Northeast, Spittal, and Tiger). Lines connect the rank orders of a given species at the two localities. Species listed in regular rather than bold type were absent from the respective locality. Only transects between 60 and 300 m were considered since the summit of Plantagenet Bank lies at ∼45 m.
Fish Trophic Group Structuring
The abundance and biomass data generated differing pictures of trophic composition, although the relative contribution of herbivores was comparable across both types of data. Numerically, planktivorous fish were the dominant feeding group at depths ≥150 m, largely attributable to Protonogrammus cf. martinicensis, which accounted for 85% of all fish found between 150 and 300 m. However, planktivores contributed only 30% of biomass since most individuals were small (Figure 5). Conversely, omnivores and piscivores were only a minor part of the assemblage based on counts but were more dominant in terms of biomass, because of the large size of individuals belonging to these trophic groups.
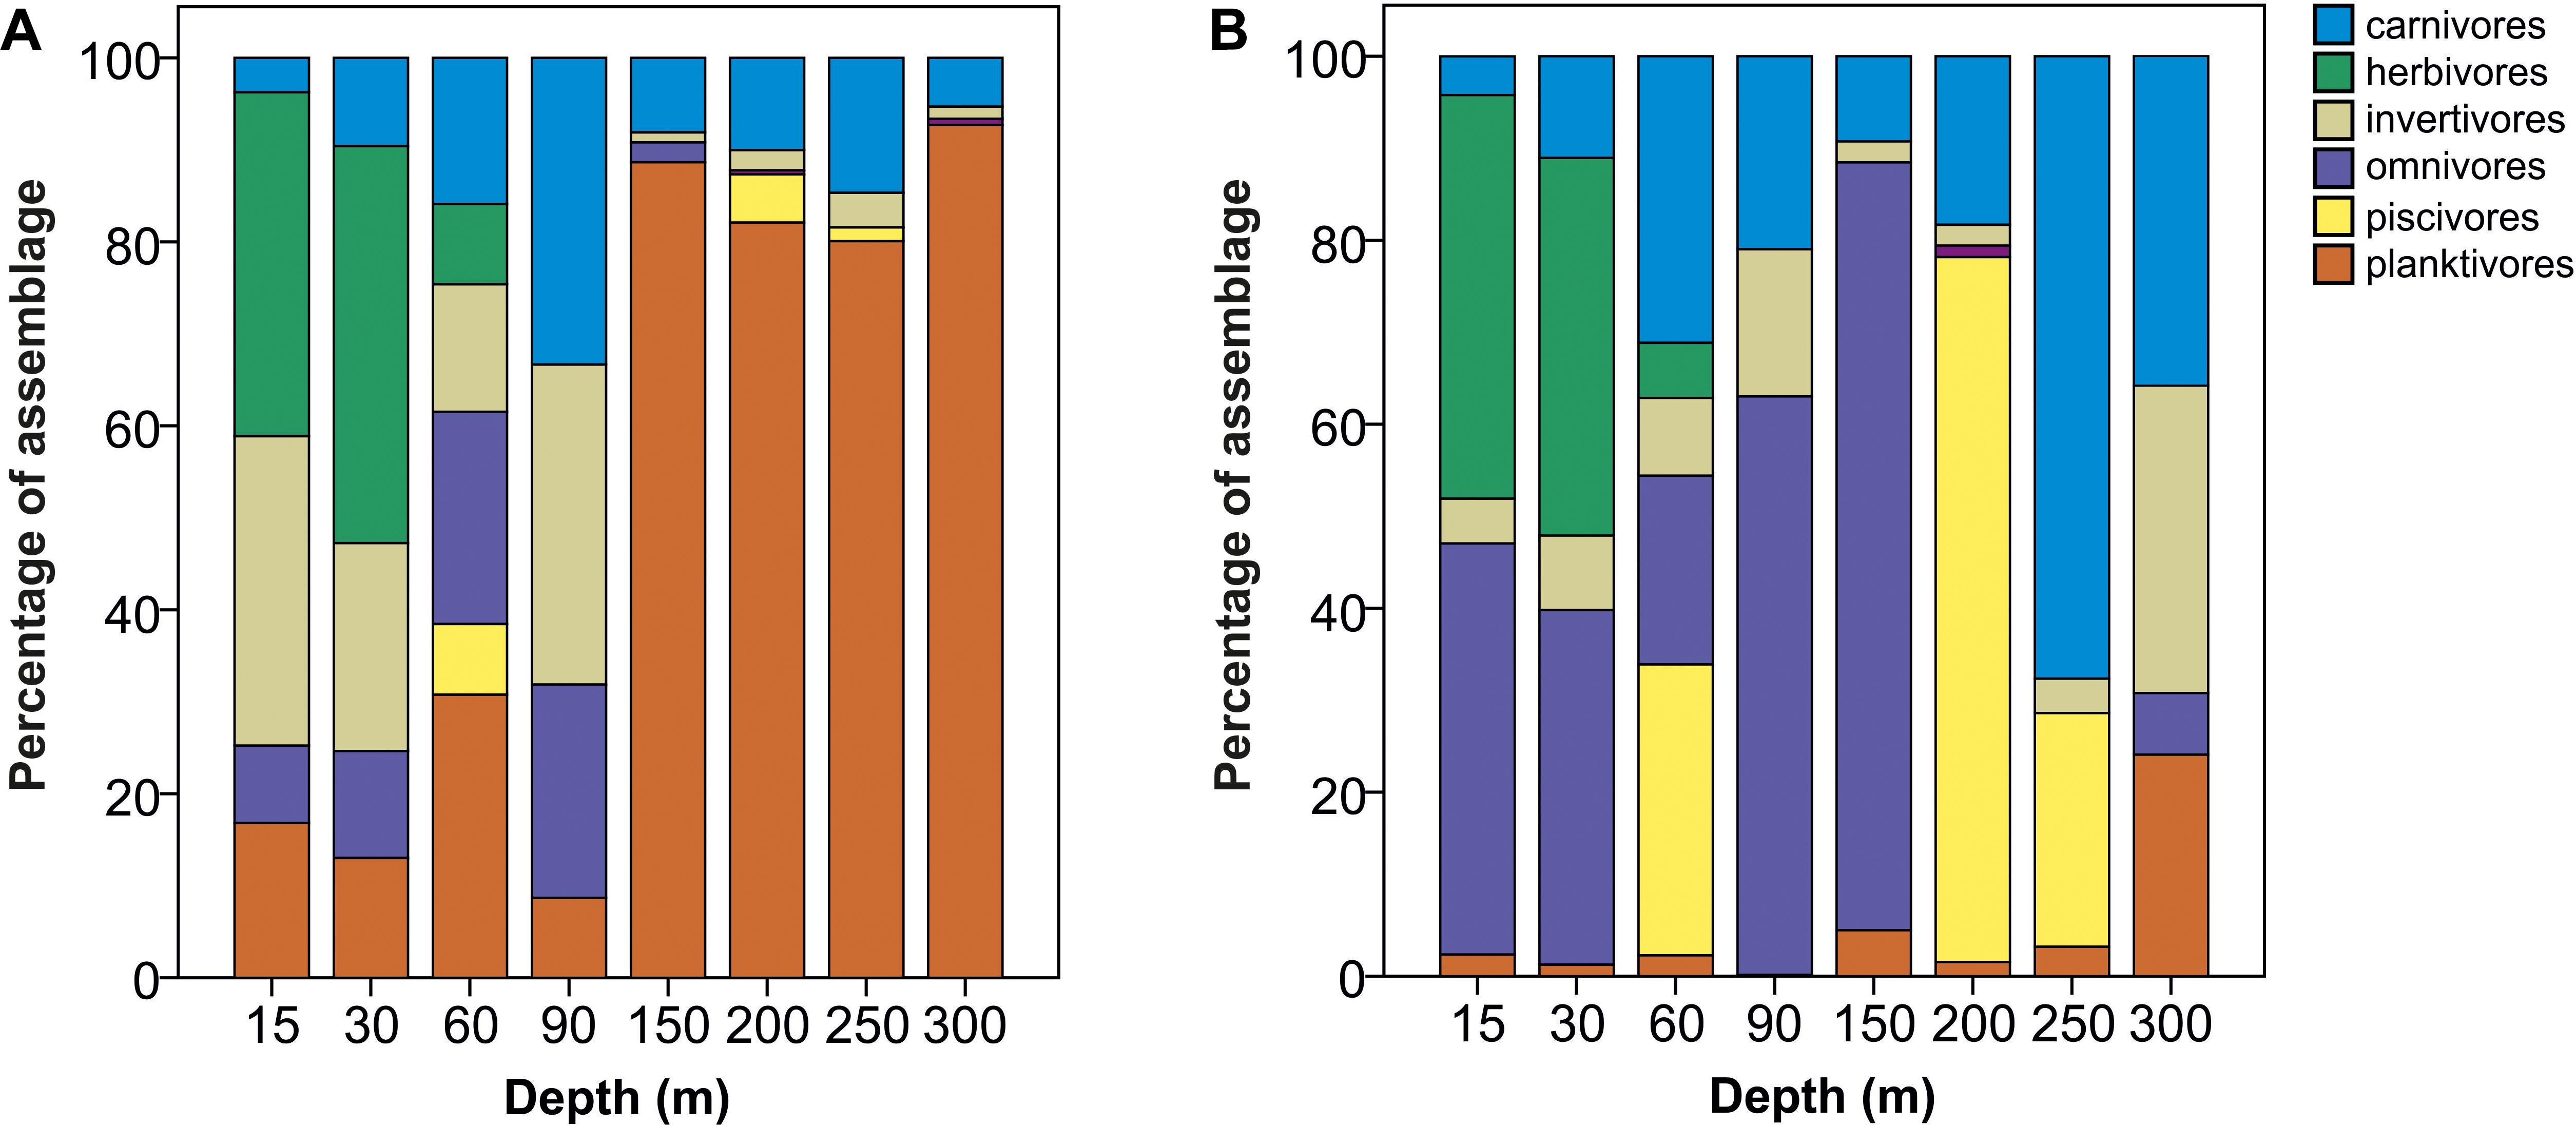
Figure 5. Comparison of changes in relative contribution (percentage of total fish assemblage) of trophic groups with depth using (A) abundance and (B) biomass data, respectively. Percentage abundance and biomass for each trophic group was calculated by summing all fish on all transects at all sites in a depth band.
Considering trophic group biomass as a percentage of the total biomass recorded per transect at each depth, we found that the biomass of some groups changed with depth, but that of carnivores, invertivores and piscivores did not. The relative contribution of herbivore biomass declined with depth, with herbivores disappearing below 60 m. Conversely, omnivore biomass peaked between 60 and 90 m, while planktivore biomass was greatest at 150–300 m (Table 2). Pearson’s correlations of trophic group with benthic community and substratum composition indicated that only herbivorous fish and hard coral cover were positively correlated to a considerable degree (p = 0.71), with all the rest being weakly correlated (maximum ρ = |0.36|).
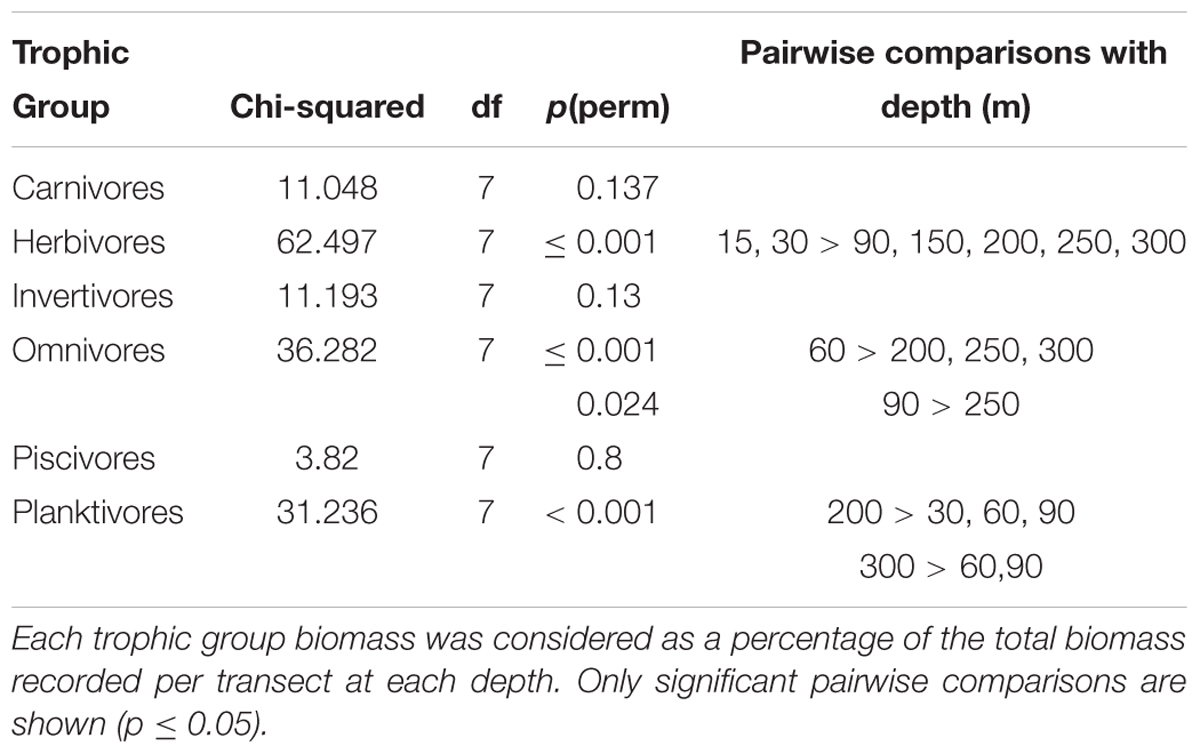
Table 2. Comparison of relative fish trophic group biomass against depth using Kruskal-Wallis followed by Mann-Whitney pairwise comparisons.
Benthic and Environmental Characteristics
Representative examples of reef environments assessed during the present survey are shown in Figures 6A–H. Analyses of benthos revealed significant differences in hard coral and macroalgal cover with depth (Kruskal-Wallis, p < 0.05 in both cases). Hard coral coverage declined with depth, becoming negligible below 30 m (Figure 6I). Conversely, macroalgae cover was found to increase with depth as far as 60 m, after which it declined, dropping to zero below 150 m (Figure 6I). The macroalgal cover estimates for 60–90 m are likely an underestimate, because of the omission of the brown algae S. bolleanus (see Benthic Data in Materials and Methods) that occasionally formed dense meadows in these depths (Figure 6D). Percentage coverage for all substrate types except for boulders differed with depth (Kruskal-Wallis, p < 0.05 in all cases). Bedrock was the main substrate type across all depths (Figure 6J). We also detected signs of anthropogenic activity across all studied depths (Figure 7), with fishing debris and other litter items (e.g., aluminum cans, glass bottles) more commonly found in 150–300 m transects (27.9% occurrence across all studied transects in that zone), followed by 60 m (16.7%), 15–30 m (12.5%), and 90 m (10%) transects, respectively.
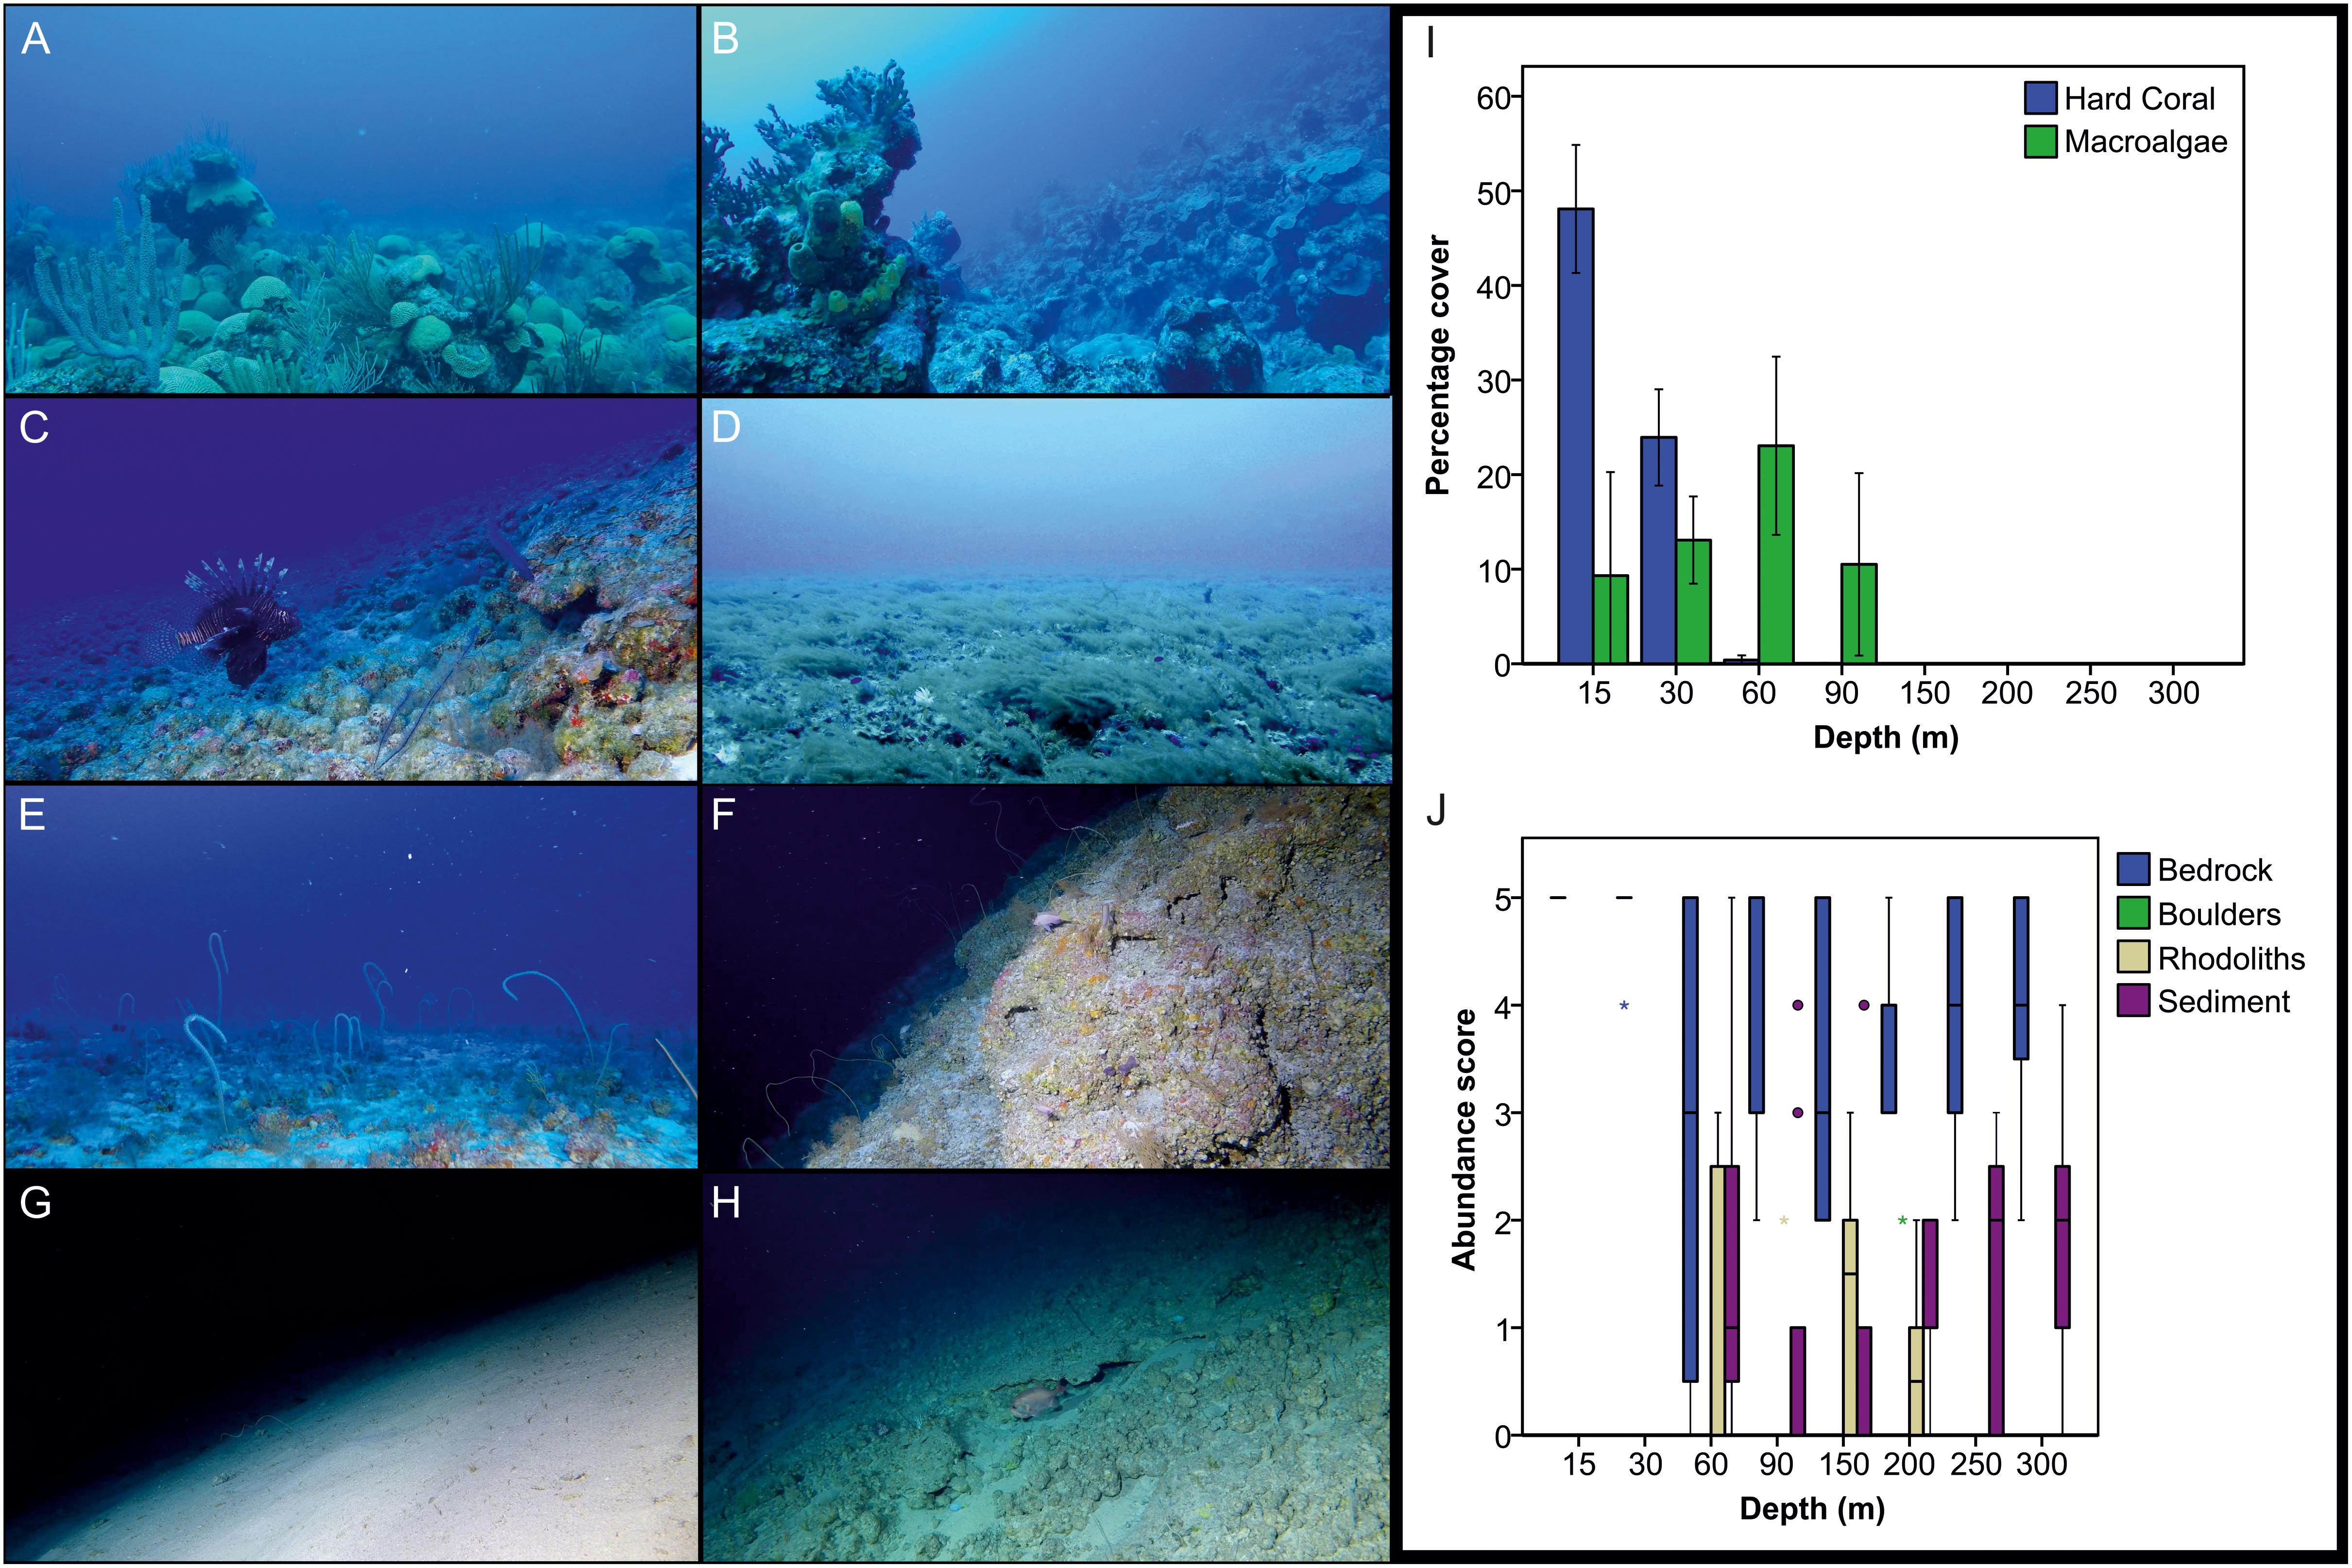
Figure 6. Representative reef environments assessed in Bermuda (A–H) and changes in benthic composition with depth (I,J). (A,B) Shallow reefs dominated by reef-building scleractinians creating complex three-dimensional habitat structures (15–30 m), (C) Rhodolith bed on reef slope (60 m), (D) Macroalgal fields (60 m), (E) Mosaic of sand and bedrock (90 m), (F) Reef wall (150 m), (G) Flat, sedimented habitat (250 m), (H) Hard bottom habitat with patches of sand and gravel (300 m). (I) Change in percentage cover of hard coral and macroalgae with depth. The bars indicate the mean and 95% confidence intervals. (J) Change in substratum type (bedrock, boulders, rhododiths, sediment) with depth. Boxes indicate the 25th and 75th quantiles, whiskers are 1.5 the interquartile, circles are outliers, and asterisks extreme outliers. Abundance scores relate to estimated percentage coverage (1: 1–10%, 2: 11–40%, 3: 41–60%, 4: 61–90%, 5: 91–100% – see section “Benthic Data in Materials and Methods”). Image credits (A–H): PV Stefanoudis, Nekton Foundation.
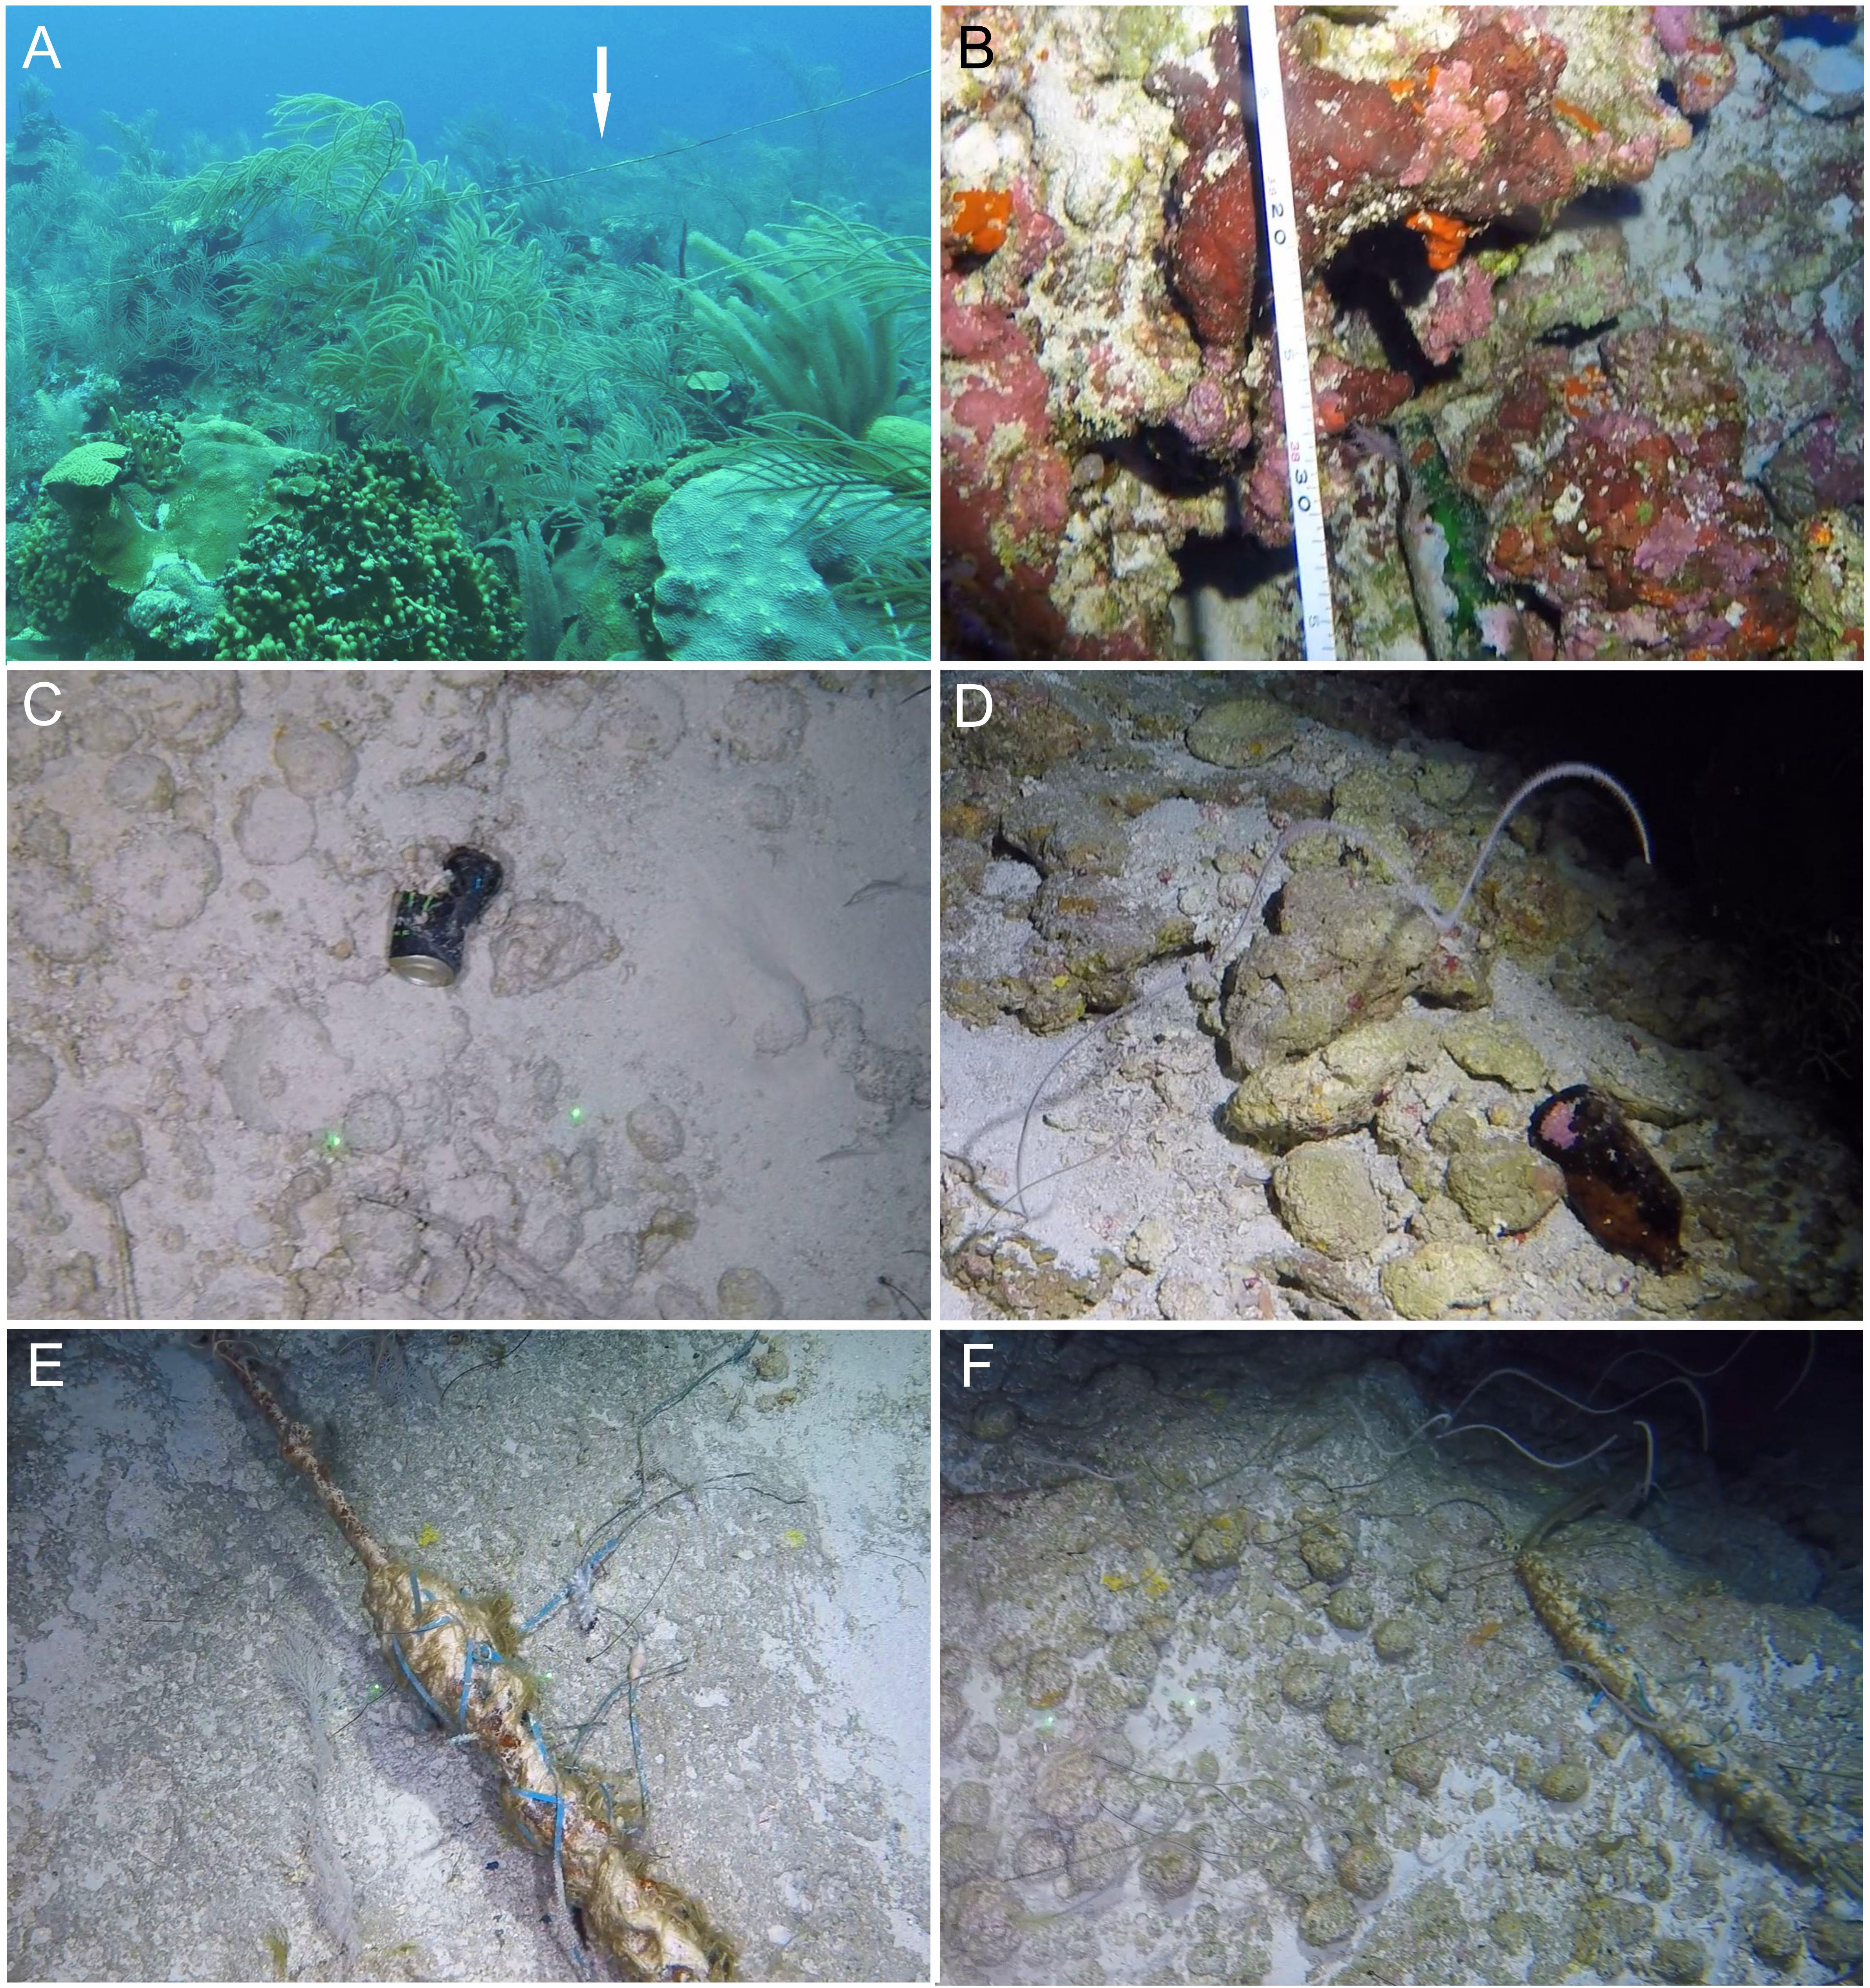
Figure 7. Examples of benthic debris observed on Bermuda’s reefs. (A) Fishing gear (Spittal, 30 m), (B) Glass bottle (Tiger, 93 m), (C) Aluminum can (Tiger, 200 m), (D) Glass bottle (Tiger, 100 m), (E) Fishing gear (Plantagenet Bank, 250 m), (F) Fishing gear (Plantagenet Bank, 187 m). Image credits (A–F): PV Stefanoudis and M Rivers, Nekton Foundation.
Conductivity, temperature and salinity exhibited a significant negative correlation with depth (Pearson correlation, ρ = -0.838, p < 0.01; ρ = -0.825, p < 0.01; ρ = -0.835, p < 0.01, respectively) while the opposite was found for the macronutrients (Pearson correlation, nitrate-nitrite: ρ = 0.538, p < 0.01; phosphate: ρ = 0.487, p < 0.01). All benthic community composition, substratum type and seawater chemistry data (CTD, macronutrients) are available at Supplementary Data S2.
Drivers of Fish Assemblage Composition
DISTLM analysis indicated significant relationships between the reef fish assemblage structure and all variables apart from boulders (Table 3), irrespective of the type of data (abundance, biomass) used. In both cases, depth accounted for the largest proportion of variance in fish assemblage structure, followed by hard coral cover, macroalgae cover, sediment, bedrock, rhodoliths and boulders. The best models included depth, hard coral cover, macroalgae cover and rhodoliths, which explained 39% and 30% of fish assemblage structure, based on abundance and biomass data, respectively.
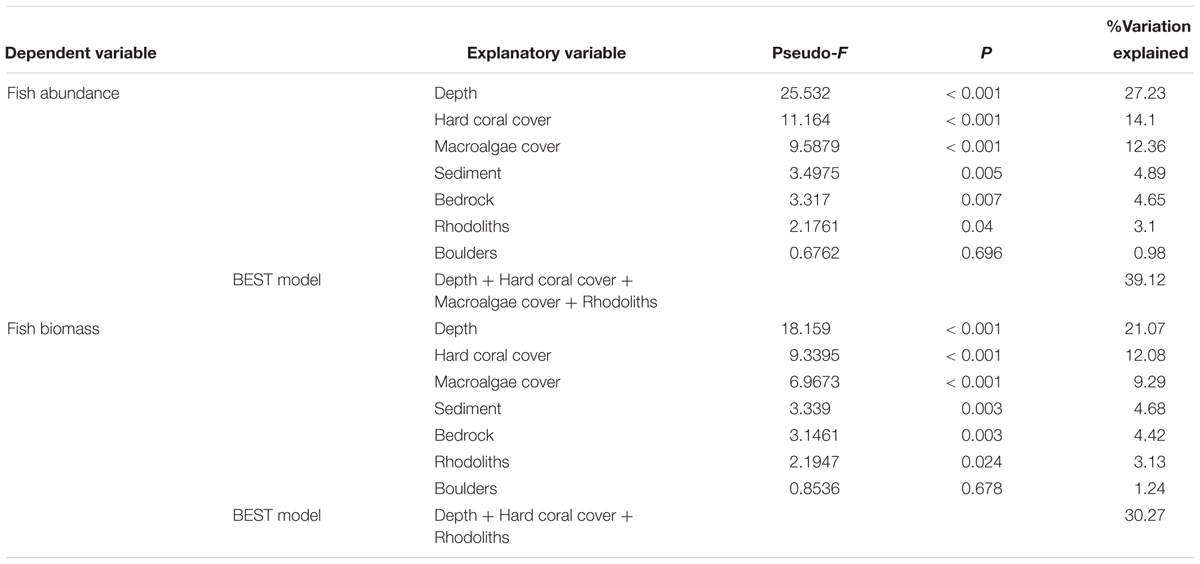
Table 3. Percentage of variation explained by benthic cover and substratum composition in a distance-based multilinear model for reef fish communities using subsets of abundance and biomass data.
Discussion
Trends in Fish Abundance, Biomass and Richness With Depth
This study combined diver and submersible surveys of the Bermuda slope and the flank of Plantagenet Bank to investigate fish assemblages covering a depth range from 15 to 305 m by incorporating both abundance and biomass data, the latter of which are rarely collected from underwater video surveys. As has been found in other studies from shallow and mesophotic reefs (e.g., Fukunaga et al., 2016; Lindfield et al., 2016; Kane and Tissot, 2017; Rocha et al., 2018), the fish assemblages of Bermuda and Plantagenet Bank showed strong depth-dependent structuring.
Fish abundance changed with depth but without a clear directional pattern, with surveys from deeper depths exhibiting a greater amount of variability. Previous findings from Caribbean (Bejarano et al., 2014; Pinheiro et al., 2016), and Pacific reefs (Thresher and Colin, 1986; Fukunaga et al., 2016; Asher et al., 2017; Sih et al., 2017), largely support a decline in fish abundance with depth, although a recent survey, also from Bermuda, recorded a depth-related increase in fish abundance within 45 m and 80 m (Pinheiro et al., 2016). Interestingly, the depths examined for that study overlap with the 60 m depth band in our study, which exhibited the greatest variability in fish abundance between surveys. In contrast, we report a gradual, depth-related decline in biomass of conspicuous fish, with shallow and mesophotic habitats supporting significantly greater biomass compared to the deepest surveyed transects (300 m). Our biomass findings agree with previous studies from the Caribbean (Andradi-Brown et al., 2016; Gress et al., 2018), likely reflecting the decrease of primary productivity with depth as indicated by the decline of zooxanthellate hard corals and macroalgae at deeper depths (Figure 6I). Again, a previous study in Bermuda (Pinheiro et al., 2016) found an increase in fish biomass with depth at depths that overlap with our 60 m depth band, where we observed the greatest variability in fish biomass between surveys.
We report significantly more speciose assemblages in shallower waters, with a peak in richness at 30 m. Results from other studies are variable, with some reporting similar richness peaks at 25–30 m (Brokovich et al., 2008; Garcia-Sais, 2010) or a bit deeper at 52–92 m (Parker and Ross, 1986), while others reported depth-related declines (Andradi-Brown et al., 2016; Gress et al., 2018) or no trends at all (Bejarano et al., 2014). Peaks in species richness may be related to larger-scale patterns in fish assemblage structure, such as the overlap of two distinct assemblages at boundary depths (e.g., shallow reefs and upper MCEs, in our case), or may reflect more direct environmental drivers such as habitat complexity or variation.
The variation reported in depth-dependent patterns of fish assemblage characteristics between this and other studies may be because of differences in survey design, location-specific characteristics and natural variability. For example, stereo video surveys such as the present one have been shown to eliminate diver bias inherent in other underwater visual census techniques (Harvey et al., 2004) that are commonly applied in reef fish surveys (e.g., Bejarano et al., 2014; Garcia-Sais, 2010). Even the type of stereo video survey (e.g., DOV vs. baited-remote underwater video) has been shown to produce different results (Watson et al., 2010). In addition, transect dimension (width, length) or sampling time (diver speed) have been repeatedly reported as sources of bias in quantitative reef fish surveys (reviewed in Usseglio, 2015). The above could explain the contrasting fish assemblage characteristics reported in another fish survey from Bermudian MCEs by Pinheiro et al. (2016) compared to ours. Sampling method (DOV here vs. diver visual censuses in Pinheiro et al., 2016), transect dimensions (width = 5 m vs. 2 m, length = 50 m vs. 30 m) and sampling time (6 min vs. not given) were all different between the two studies. It is clear that adoption of protocols for standardizing the collection of data is key for the inter-comparability of future reef studies (Woodall et al., 2018). In addition, site-specific characteristics such as structural habitat complexity (i.e., continuity of reef habitat, topography, availability of hard substratum) have been shown to affect fish community patterns (Brokovich et al., 2008; Garcia-Sais, 2010; Asher et al., 2017) (see also Table 3). Notably, we found benthic community and substratum composition to be most variable between depths of 60–200 m (Figures 6I,J), which overlaps with the studied depths (45–80 m) of the previous survey in Bermuda (Pinheiro et al., 2016). However, since measures of habitat complexity were not incorporated in Pinheiro et al. (2016) cross-study comparisons are difficult to interpret. Finally, natural variability of reef fish community characteristics, especially from 30–90 m (Figures 3A,B; see also Figures 5C,D in Pinheiro et al., 2016) could also be important in explaining differences between studies.
Fish Assemblage Structure Across a Depth Gradient
There was a gradual shift in assemblage composition with increasing depth. Distinct assemblages occupied 15–30, 60, 90, and 150–300 m, defined here as shallow, upper mesophotic, lower mesophotic and rariphotic depths, respectively (Table 1 and Figures 3D,E). Concordant changes in biotic and abiotic parameters help explain those patterns. For example, significant loss of hard coral habitat at depths >30 m (Figure 6I; see also Fricke and Meischner, 1985) that are usually associated with mesophotic reef fish, is likely in part responsible for the faunal break between shallow and mesophotic reefs. Changes in zooplankton and micronekton abundance with depth could also have affected fish community structure. Although we did not directly measure this, the enhanced abundance and relative biomass of planktivorous fishes below shallow waters (discussed in the following section), supports this conclusion. Going deeper, discrete environmental conditions at rariphotic depths including lower temperatures and dissolved oxygen levels (see measurements made in the neighboring Bermuda Atlantic Time-series Station – BATS – during the same period as our survey was undertaken; Supplementary Figure S1), both known to influence reef fish structure with depth (Quattrini et al., 2017a), are likely responsible for the distinct fish assemblages present in that zone.
Distinct vertical zonation in reef fish assemblages has previously been reported from St. Peter and St. Paul’s Archipelago (mid-Atlantic Ridge, Brazil) (Rosa et al., 2016), Bermuda and Curaçao (Pinheiro et al., 2016), Puerto Rico (Bejarano et al., 2014), and Southern California Bight (Love et al., 2009). The present survey highlights that mesophotic reef fish faunas are biologically distinct from those of shallow reefs, limiting the applicability of the deep reef refuge hypothesis to fishes in Bermuda. Our results are in agreement with those from a recent study looking at connectivity between fish communities on shallow and mesophotic reefs in the western Atlantic and the Pacific (Rocha et al., 2018). Previous studies suggesting greater overlap between fish communities across the two zones typically used species depth ranges to draw comparisons, with some records dating back years to decades, and without taking into account species abundance and biomass, or changing environmental conditions over time (for a recent review see Laverick et al., 2018).
The presence of a faunal break between 90 and 150 m depth, also corresponds to a change in our survey design (from DOV to SOV). However, it is comparable to the ∼120–130 m break reported from Hawaii, Marshall Islands, Gulf of Mexico and Curaçao (Thresher and Colin, 1986; Pyle et al., 2016; Semmler et al., 2017; Baldwin et al., 2018), and the 105–168 m reported from Southern California Bight (Love et al., 2009). In addition, the fact that some of the common species reported here were also found in the study from Curaçao (e.g., Chromis spp., P. martinicensis, S. phoebe) (Baldwin et al., 2018), where rariphotic assemblages were first described, gives us further confidence of a distinct rariphotic fish assemblage in Bermuda. We did not, however, find the additional ∼190–200 m faunal break identified in the studies from the Gulf of Mexico and the Caribbean (Semmler et al., 2017; Baldwin et al., 2018). Consequently, our data do not support the further sub-division of the rariphotic into upper and lower. It is likely that factors other than depth, such as habitat heterogeneity or substratum composition, could be responsible for the observed discrepancies between ours and the other studies, because these tend to be highly variable and location-specific, and are known to influence fish assemblage structure (Lindfield et al., 2016) (see also Table 3). Similar reef fish surveys from the Caribbean and elsewhere are needed to determine the depth of the faunal breaks between the mesophotic and the rariphotic zones. Finally, whether or not a distinct rariphotic zone is recognizable in the zonation of benthic assemblages is currently unknown. However, our present benthic analysis indicated change in substratum composition below 200 m (decline in rhodoliths, increase in sediment; Figure 6J), which hints toward the presence of a distinct rariphotic benthic fauna, albeit located a bit deeper compared to what we found for fish. More detailed studies of the biological components of the benthos at the same depths would be required to confirm if that is the case.
Fish Trophic Structure Across a Depth Gradient
In terms of trophic group structuring, we found a stark decrease in the abundance and biomass of herbivores below 30 m, in contrast to a prior study in Bermuda (Pinheiro et al., 2016). The decline of herbivores outside of the shallow waters is a well-established trend documented in MCEs throughout the Caribbean (Garcia-Sais, 2010; Bejarano et al., 2014; Andradi-Brown et al., 2016) and elsewhere (Thresher and Colin, 1986; Fukunaga et al., 2016; Pyle et al., 2016; Asher et al., 2017). Given prior results (Pinheiro et al., 2016), the exact reasons for herbivore decline with depth in this study are not clear, and could be related to different sampling methods, site-specific characteristics and natural variability (see discussion in previous section). Because food was readily available for herbivorous fishes (peak of macroalgae cover in the mesophotic zone, presence of rhodoliths >30 m, Figures 6I,J), the most likely contributing factor to their decline would appear to be the almost complete absence of light-dependent scleractinians below 30 m (Figure 6I). In fact, of all trophic groups, herbivores were the only ones found to be positively correlated with hard coral cover, similar to what has been reported from western Australia reefs (Vergés et al., 2011). Reef-building genera such as Diploria, Montastraea, Orbicella and Pseudodiploria that dominate shallow reefs in Bermuda (Logan, 1998), increase structural complexity, thus providing shelter from predators and/or greater resource availability for fish, including herbivores (Rogers et al., 2018).
The invasive lionfish, which is a voracious mesopredator (Eddy et al., 2016), peaked in abundance and biomass at mesophotic depths, being a characteristic species of this zone (Figures 3D,E; also Pinheiro et al., 2016). This peak in lionfish abundance could also partly explain the decline of herbivores on MCEs and the concurrent enhanced macroalgae cover discussed earlier, although its effect is likely to have been limited as herbivorous fishes were not found to be prominent in Bermuda lionfish diets (Eddy et al., 2016). Lionfish have been widely reported from MCEs in the western Atlantic, including Bermuda (Andradi-Brown et al., 2017b). Although shallow reef culling has been shown to structure lionfish populations across depth (Andradi-Brown et al., 2017a), it seems that, for our study area at least, water temperature might have been a more important driver (Goodbody-Gringley et al., 2019). In Bermuda, shallow inshore reefs experience lower winter temperatures (14–15 °C) compared to the deeper offshore reefs (Coates et al., 2013), and crucially, these lower inshore winter temperatures fall below the thermal threshold (16.1 °C) under which lionfish have been experimentally shown to cease feeding (Kimball et al., 2004). Consequently, temperature seasonality is likely to be at least partially responsible for the larger lionfish populations on Bermuda’s MCEs compared to shallow reefs.
Abundance and relative biomass of planktivores gradually increased with depth (Figure 5). Our finding is concordant with that of other studies which reported enhanced planktivore abundance with depth (Thresher and Colin, 1986; Pinheiro et al., 2016). The increased nutrient availability at mesophotic depths reported here, which could be sustained by internal waves or upwelling (Lesser, 2006), likely promoted enhanced plankton production providing food to deep reef planktivorous fish (see also peak of primary production at ∼100 m in BATS; Supplementary Figure S1). The dominant species on deep reefs (150–300 m) was P. martinicensis, which occurred in shoals of mixed sizes particularly associated with cryptic habitat. This species was almost always accompanied by S. phoebe which was observed hunting and feeding on the former in the lights of the submersible. Similar widespread occurrences of P. martinicensis and Serranus spp. in these depths have been reported from the wider Caribbean region (Quattrini et al., 2017b; Baldwin et al., 2018). It is likely that P. martinicensis provides a main prey item of other large piscivores and carnivores on deep reefs. This may indicate that this species is important in bentho-pelagic coupling at this depth horizon. A similar ecological role is played by species such as Anthias anthias, Capros aper, Centracanthus cirrus and Macroramphosus spp. on Seine Seamount in the sub-tropical NE Atlantic (Hirch and Christiansen, 2010).
Plantagenet Bank vs. Bermuda Slope
Distinct fish assemblages were encountered on the seamount Plantagenet Bank compared to the three sites on the Bermuda slope. Specifically, assemblage structure on Plantagenet Bank was consistently different to all the rest of the Bermuda slope sites at the deepest depths (150–300 m), and to North Northeast and Spittal at 60–90 m (Table 1). This was partly a result of a reversal in the rank order of species present in both habitats (Figure 4), indicating that some species were common on the seamount and rare at similar depths on the slope (e.g., Bodianus rufus, C. fulva) and vice versa (e.g., Chromis enchrysura, S. phoebe). Similar findings have also been previously reported for benthic megafaunal communities of a NE Pacific seamount and the nearby slope (McClain et al., 2009). In addition, we noted that species such as Kyphosus incisor/sectatrix that preferentially inhabited shallow depths on the island slope, occupied mesophotic coral habitats in Plantagenet Bank (Supplementary Data S1) where shallow reef habitat was not available (summit of seamount at ∼45 m). Another contributing factor is the greater presence of large predatory fish such as C. lugubris, S. cubensis and S. rivoliana on Plantagenet Bank, which corroborates the wider seamount literature whereby seamounts provide foraging grounds for large visual predators (Pitcher et al., 2007; Kvile et al., 2014). Such animals may take advantage of the trapping of zooplankton and micronekton, which are part of the deep-scattering layer and migrate into the shallow waters of the ocean at night. They may be advected over the summit and flanks of the seamount and at dawn are trapped near the surface in an increasing light field and predated on by resident seamount fishes (Genin and Dower, 2007). For example, juveniles and adults of several pelagic species (e.g., Carangidae, Scombridae) commonly aggregate on the banks of Bermuda in the summer months (Faiella, 2003). Other mechanisms that concentrate food may also operate in the vicinity of seamounts, associated with interactions between current and topography, coupled with the behavior of pelagic organisms (Genin and Dower, 2007). Large zooplanktivores, notably manta rays (Manta birostris) were also only observed in the vicinity of Plantagenet Bank during the survey (Rogers AD pers. obs.).
Current Status of Mesophotic and Deeper Reef Fish Diversity in Bermuda
The fish fauna of Bermuda has been well described from the efforts of scientists, naturalists and interested fishers to collect and preserve diverse specimens from shallow reefs, MCEs and greater depths on the slopes of Bermuda and the offshore Challenger and Plantagenet banks. These records, including submersible observations in 1983 and 1997 by B. Luckhurst, were meticulously compiled by Smith-Vaniz et al. (1999), and Smith-Vaniz and Collette (2013). We extracted these records and located more recent museum records and report all known species observed between 30 and 300 m to provide a context for our results (Supplementary Data S3). The records were aggregated by general locations around Bermuda and the two banks. To date, a total of 133 species have been collected or observed in 30–300 m depth, and the two offshore banks (Plantagenet and Challenger) appear to support more diverse fish faunas. It is significant that despite this long history of collection and observation in Bermuda we can report four putative new fish records.
Conclusion
We report that fish biomass and species richness decline with depth, although richness first peaked at 30 m, the boundary depth at which shallow and upper mesophotic coral reef fish faunas meet. Below that depth we noted a steep decline of herbivorous fish, which appeared to be linked to the lack of complex habitat structure (i.e., absence of reef-building scleractinian corals). Most importantly, we provided evidence that depth is a strong predictor of fish assemblage structure with different suites of species occupying shallow, upper and lower mesophotic, and rariphotic coral reef habitats, respectively. These strong vertical zonation patterns highlight the biologically unique nature of mesophotic and rariphotic coral reef habitats and suggest that the deep reef refuge effect is likely to be minor for fish faunas in Bermuda. This distinctiveness of the deeper reef fish faunas combined with observed signs of stressors such as the occurrence of invasive species (e.g., lionfish) and/or the presence of benthic debris (e.g., fishing gear) in those depths, highlight the inherent vulnerability of the deeper fish assemblages to anthropogenic pressures. This is perhaps best illustrated by the collapse of the deep water snapper fishery (Etelis oculatus; Lutjanus vivanus, Pristipomoides macrophthalmus) in Bermuda, only 2 years after it started in 1990, at depths between 220 and 350 m that roughly correspond to the rariphotic zone (Luckhurst and Ward, 1996; Luckhurst et al., 2003). Thus, we advocate that deeper mesophotic and rariphotic coral reefs should be more explicitly managed in terms of targeted fisheries and for conservation purposes. Furthermore, this study also provides evidence of the distinct nature of seamounts compared to adjacent slope habitats. Finally, this additional documented occurrence of distinct communities in the rariphotic zone suggests this is a widespread community in the Caribbean and potentially elsewhere.
Data Availability
All data needed to evaluate the conclusions in the paper are present in the paper and/or the Supplementary Material. Additional data related to this paper may be requested from the authors.
Author Contributions
AR and LW conceptualized the study. AR and TK collected the data. DA-B, PS, EG, LW, and MR calibrated the data. EG analyzed the video data. JP, EG, AR, SS, PS, and LW identified the fish. PS and MR analyzed the benthic data. PS conducted all statistical analysis. PS and GR prepared the figures and tables. SS compiled the Bermuda mesophotic and rariphotic fish records. PS, AR, and LW wrote the manuscript. All authors reviewed and provided helpful comments to the manuscript.
Funding
This research was undertaken as part of the XL Catlin Deep Ocean Survey Nekton’s Mission to the North West Atlantic and Bermuda. Nekton received support from the XL Catlin and the Garfield Weston Foundation. This project has received funding from the European Union’s Horizon 2020 Research and Innovation Programme under grant agreement No. 678760 (ATLAS). This output reflects only the authors’ views and the European Union cannot be held responsible for any use that may be made of the information contained therein. The funders had no role in study design, data collection and analysis, decision to publish, or preparation of the manuscript.
Conflict of Interest Statement
The authors declare that the research was conducted in the absence of any commercial or financial relationships that could be construed as a potential conflict of interest.
Acknowledgments
We wish to thank T. Warren from the Bermuda Government, and G. Goodbody-Gringley and C. Flook from the Bermuda Institute of Ocean Sciences, for their assistance, advice and participation in the XL Catlin Deep Ocean Survey Bermuda Mission; S. Brooks for the assisting with the stereo-video system footage calibration; H. Hirsch (Stanford University) for providing the CTD data; M. C. Stinchcombe (National Oceanography Centre, Southampton) for the nutrient data, and M. Taylor (University of Essex) for early discussions. Finally, we would also like to thank the crew and technicians of the Baseline Explorer, Brownies Global Logistics and Triton Submersibles, and the technical divers of Global Underwater Explorers (M. McClellan, M. Tanguay, S. Bird, K. Dow, G. Blackmore, J. P. Bressor, S. E. Kim, and K. Kim). This is Nekton Contribution No 9. Any use of trade, product or firm names is for descriptive purposes only and does not imply endorsement by the United States Government.
Supplementary Material
The Supplementary Material for this article can be found online at: https://www.frontiersin.org/articles/10.3389/fmars.2019.00307/full#supplementary-material
Footnotes
- ^ https://www.divegue.tv/programs/gue-rebreather-diver-jj-ccr-overview?autoplay=true
- ^ http://www.marinespecies.org
References
Anderson, M., Gourley, R. N., and Clarke, K. R. (2008). PERMANOVA+ for PRIMER: Guide to Software and Statistical Methods. Plymouth: PRIMER-E,Ltd.
Andradi-Brown, D. A., Gress, E., Wright, G., Exton, D. A., and Rogers, A. D. (2016). Reef fish community biomass and trophic structure changes across shallow to Upper-Mesophotic reefs in the Mesoamerican Barrier Reef, Caribbean. PLoS One 11:e0156641. doi: 10.1371/journal.pone.0156641
Andradi-Brown, D. A., Grey, R., Hendrix, A., Hitchner, D., Hunt, C. L., Gress, E., et al. (2017a). Depth-dependent effects of culling—do mesophotic lionfish populations undermine current management? R. Soc. Open Sci. 4:170027.
Andradi-Brown, D. A., Vermeij, M. J., Slattery, M., Lesser, M., Bejarano, I., Appeldoorn, R., et al. (2017b). Large-scale invasion of western Atlantic mesophotic reefs by lionfish potentially undermines culling-based management. Biol. Invasions 19, 939–954.
Asher, J. M., Williams, I., and Harvey, E. (2017). Mesophotic depth gradients impact reef fish assemblage composition and functional group partitioning in the main Hawaiian Islands. Front. Mar. Sci. 4:98. doi: 10.3389/fmars.2017.00098
Baker, E. K., and Harris, P. T. (2016). Mesophotic Coral Ecosystems: A Lifeboat for Coral Reefs?. Nairobi: United Nations Environment Programme.
Baldwin, C., Tornabene, L., and Robertson, D. (2018). Below the Mesophotic. Sci. Rep. 8:4920. doi: 10.1038/s41598-018-23067-1
Bejarano, I., Appeldoorn, R., and Nemeth, M. (2014). Fishes associated with mesophotic coral ecosystems in La Parguera, Puerto Rico. Coral Reefs 33, 313–328.
Bongaerts, P., Ridgway, T., Sampayo, E., and Hoegh-Guldberg, O. (2010). Assessing the ‘deep reef refugia’hypothesis: focus on Caribbean reefs. Coral Reefs 29, 309–327.
Brokovich, E., Einbinder, S., Shashar, N., Kiflawi, M., and Kark, S. (2008). Descending to the twilight-zone: changes in coral reef fish assemblages along a depth gradient down to 65 m. Mar. Ecol. Prog. Ser. 371, 253–262.
Coates, K. A., Fourqurean, J. W., Kenworthy, W. J., Logan, A., Manuel, S. A., and Smith, S. R. (2013). “Introduction to Bermuda: geology, oceanography and climate,” in Coral Reefs of the United Kingdom Overseas Territories, ed. C. Sheppard (Dordrecht: Springer), 115–133.
Colin, P. L. (1976). Observations of deep-reef fishes in the Tongue-of-the-Ocean, Bahamas. Bull. Mar. Sci. 26, 603–605.
Eddy, C., Pitt, J., Morris, J. A. Jr., Smith, S., Goodbody-Gringley, G., and Bernal, D. (2016). Diet of invasive lionfish (Pterois volitans and P. miles) in Bermuda. Mar. Ecol. Prog. Ser. 558, 193–206.
Freshwater, D. W., Hamner, R. M., Parham, S., and Wilbur, A. E. (2009). Molecular evidence that the lionfishes Pterois miles and Pterois volitans are distinct species. J. N. C. Acad. Sci. 125, 9–46.
Fricke, H., and Meischner, D. (1985). Depth limits of Bermudan scleractinian corals: a submersible survey. Mar. Biol. 88, 175–187.
Froese, R., and Pauly, D. (2017). FishBase Version (06/2017). Available at: www.fishbase.org. (Accessed April 2018)
Fukunaga, A., Kosaki, R. K., and Wagner, D. (2017). Changes in mesophotic reef fish assemblages along depth and geographical gradients in the Northwestern Hawaiian Islands. Coral Reefs 36, 785–790.
Fukunaga, A., Kosaki, R. K., Wagner, D., and Kane, C. (2016). Structure of mesophotic reef fish assemblages in the Northwestern Hawaiian Islands. PLoS One 11:e0157861. doi: 10.1371/journal.pone.0157861
Galland, G. R., Erisman, B., Aburto-Oropeza, O., and Hastings, P. A. (2017). Contribution of cryptobenthic fishes to estimating community dynamics of sub-tropical reefs. Mar. Ecol. Progress Series 584, 175–184.
Garcia-Sais, J. R. (2010). Reef habitats and associated sessile-benthic and fish assemblages across a euphotic–mesophotic depth gradient in Isla Desecheo, Puerto Rico. Coral Reefs 29, 277–288.
Genin, A., and Dower, J. F. (2007). “Seamount plankton dynamics,” in Seamounts: Ecology, Fisheries & Conservation, eds T. J. Pitcher, T. Morato, P. J. B. Hart, T. J. Pitcher, T. Morato, P. J. B. Hart, et al. (Oxford: Blackwell Publishing), 87–100.
Goodbody-Gringley, G., Eddy, C., Pitt, J. M., Chequer, A. D., and Smith, S. R. (2019). Ecological drivers of invasive lionfish (Pterois volitans and Pterois miles) distribution across mesophotic reefs in Bermuda. Front. Mar. Sci. 6:258. doi: 10.3389/fmars.2019.00258
Gress, E., Arroyo-Gerez, M. J., Wright, G., and Andradi-Brown, D. A. (2018). Assessing mesophotic coral ecosystems inside and outside a Caribbean marine protected area. R. Soc. Open Sci. 5:180835. doi: 10.1098/rsos.180835
Harvey, E., Fletcher, D., Shortis, M. R., and Kendrick, G. A. (2004). A comparison of underwater visual distance estimates made by scuba divers and a stereo-video system: implications for underwater visual census of reef fish abundance. Mar. Freshw. Res. 55, 573–580.
Hinderstein, L., Marr, J. C., Martinez, F., Dowgiallo, M., Puglise, K., Pyle, R., et al. (2010). Theme section on “Mesophotic coral ecosystems: characterization, ecology, and management”. Coral Reefs 29, 247–251.
Hirch, S., and Christiansen, B. (2010). The trophic blockage hypothesis is not supported by the diets of fishes on Seine Seamount. Mar. Ecol. 31, 107–120.
Hughes, T. P., Kerry, J. T., Baird, A. H., Connolly, S. R., Dietzel, A., Eakin, C. M., et al. (2018). Global warming transforms coral reef assemblages. Nature 556, 492–496. doi: 10.1038/s41586-018-0041-2
Humann, P., Deloach, N., and Wilk, L. (2002). Reef Creature Identification: Florida, Caribbean, Bahamas. 2nd Edn. Jacksonville, FL: New World Publications Inc.
Kahng, S., Copus, J. M., and Wagner, D. (2017). “Mesophotic coral ecosystems,” in Marine Animal Forests: The Ecology of Benthic Biodiversity Hotspots, eds S. Rossi, L. Bramanti, A. Gori, and C. Orejas (New York, NY: Springer International Publishing), 185–206.
Kane, C., Kosaki, R. K., and Wagner, D. (2014). High levels of mesophotic reef fish endemism in the Northwestern Hawaiian Islands. Bull. Mar. Sci. 90, 693–703. doi: 10.1371/journal.pone.0157861
Kane, C. N., and Tissot, B. N. (2017). Trophic designation and live coral cover predict changes in reef-fish community structure along a shallow to mesophotic gradient in Hawaii. Coral Reefs 36, 891–901.
Kimball, M. E., Miller, J. M., Whitfield, P. E., and Hare, J. A. (2004). Thermal tolerance and potential distribution of invasive lionfish (Pterois volitans/miles complex) on the east coast of the United States. Mar. Ecol. Prog. Ser. 283, 269–278.
Kosaki, R. K., Pyle, R. L., Leonard, J. C., Hauk, B. B., Whitton, R. K., and Wagner, D. (2017). 100% endemism in mesophotic reef fish assemblages at Kure Atoll, Hawaiian Islands. Mar. Biodiv. 47, 783–784.
Kvile, K. O., Taranto, G. H., Pitcher, T. J., and Morato, T. (2014). A global assessment of seamount ecosystems knowledge using an ecosystem evaluation framework. Biol. Conserv. 173, 108–120.
Laverick, J. H., Andradi-Brown, D. A., and Rogers, A. D. (2017). Using light-dependent scleractinia to define the upper boundary of mesophotic coral ecosystems on the reefs of Utila, Honduras. PLoS One 12:e0183075. doi: 10.1371/journal.pone.0183075
Laverick, J. H., Piango, S., Andradi-Brown, D. A., Exton, D. A., Bongaerts, P., Bridge, T. C. L., et al. (2018). To what extent do mesophotic coral ecosystems and shallow reefs share species of conservation interest? A systematic review. Environ. Evid. 7:15.
Lesser, M. P. (2006). Benthic–pelagic coupling on coral reefs: feeding and growth of Caribbean sponges. J. Exp. Mar. Biol. Ecol. 328, 277–288. doi: 10.1371/journal.pone.0079799
Lindfield, S. J., Harvey, E. S., Halford, A. R., and Mcilwain, J. L. (2016). Mesophotic depths as refuge areas for fishery-targeted species on coral reefs. Coral Reefs 35, 125–137.
Logan, A. (1998). “The high-latitude coral reefs of Bermuda: characteristics and comparisons,” in Proceedings of the 2nd Symposium of Fauna and Flora of the Atlantic Islands. eds M. Viera Rodriguez and R. Haroun (Las Palmas de Gran Canaria: Boletim do Museu Municipal do Funchal), 187–187.
Love, M. S., Yoklavich, M., and Schroeder, D. M. (2009). Demersal fish assemblages in the Southern California Bight based on visual surveys in deep water. Environ. Biol. Fishes 84, 55–68.
Luckhurst, B., Booth, S., and Zeller, D. (2003). Brief history of Bermudian fisheries, and catch comparison between national sources and FAO records. Fish. Centre Res. Rep. 11:163.
Luckhurst, B. E., and Ward, J. A. (1996). Analysis of trends in Bermuda’s fishery statistical database from 1975 to 1990, with reference to fishery management measures implemented during this period. Proc. Gulf Caribb. Fish. Inst. 44, 306–324.
McClain, C. R., Lundsten, L., Ream, M., Barry, J., and Devogelaere, A. (2009). Endemicity, biogeography, composition, and community structure on a Northeast Pacific seamount. PLoS One 4:e4141. doi: 10.1371/journal.pone.0004141
Newman, S. J., Williams, A. J., Wakefield, C. B., Nicol, S. J., Taylor, B. M., and O’malley, J. M. (2016). Review of the life history characteristics, ecology and fisheries for deep-water tropical demersal fish in the Indo-Pacific region. Rev. Fish Biol. Fish. 26, 537–562.
Parker, R. O., and Ross, S. W. (1986). Observing reef fishes from submersibles off North Carolina. Northeast Gulf Sci. 8, 31–49.
Parravicini, V., Kulbicki, M., Bellwood, D., Friedlander, A., Arias-Gonzalez, J., Chabanet, P., et al. (2013). Global patterns and predictors of tropical reef fish species richness. Ecography 36, 1254–1262. doi: 10.1371/journal.pone.0056245
Pinheiro, H., Goodbody-Gringley, G., Jessup, M., Shepherd, B., Chequer, A., and Rocha, L. (2016). Upper and lower mesophotic coral reef fish communities evaluated by underwater visual censuses in two Caribbean locations. Coral Reefs 35, 139–151.
Pitcher, T. J., and Lam, M. E. (2015). Fish commoditization and the historical origins of catching fish for profit. Marit. Stud. 14:2.
Pitcher, T. J., Morato, T., Hart, P. J. B., Clark, M. R., Haggan, N., and Santos, R. S. (2007). Seamounts: Ecology, Fisheries, and Conservation. Oxford: Blackwell Publishing.
Polunin, N., and Roberts, C. (1993). Greater biomass and value of target coral-reef fishes in two small Caribbean marine reserves. Mar. Ecol. Prog. Ser. 100, 167–176.
Pyle, R. L., Boland, R., Bolick, H., Bowen, B. W., Bradley, C. J., Kane, C., et al. (2016). A comprehensive investigation of mesophotic coral ecosystems in the Hawaiian Archipelago. PeerJ. 4:e2475.
Quattrini, A. M., Demopoulos, A. W., Singer, R., Roa-Varon, A., and Chaytor, J. D. (2017a). Demersal fish assemblages on seamounts and other rugged features in the northeastern Caribbean. Deep Sea Res. Part I Oceanogr. Res. Pap. 123, 90–104.
Quattrini, A. M., Gómez, C. E., and Cordes, E. E. (2017b). Environmental filtering and neutral processes shape octocoral community assembly in the deep sea. Oecologia 183, 221–236. doi: 10.1007/s00442-016-3765-4
Robertson, D. R., and van Tassel, J. (2015). Shorefishes of the Greater Caribbean: Online Information System. Version 1.0. Balboa: Smithsonian Tropical Research Institute.
Rocha, L. A., Pinheiro, H. T., Shepherd, B., Papastamatiou, Y. P., Luiz, O. J., Pyle, R. L., et al. (2018). Mesophotic coral ecosystems are threatened and ecologically distinct from shallow water reefs. Science 361, 281–284. doi: 10.1126/science.aaq1614
Rogers, A., Blanchard, J. L., Newman, S. P., Dryden, C. S., and Mumby, P. J. (2018). High refuge availability on coral reefs increases the vulnerability of reef-associated predators to overexploitation. Ecology 99, 450–463. doi: 10.1002/ecy.2103
Rosa, M. R., Alves, A. C., Medeiros, D. V., Coni, E. O. C., Ferreira, C. M., Ferreira, B. P., et al. (2016). Mesophotic reef fish assemblages of the remote St. Peter and St. Paul’s Archipelago, Mid-Atlantic Ridge, Brazil. Coral Reefs 35, 113–123.
Sadovy de Mitcheson, Y., Craig, M. T., Bertoncini, A. A., Carpenter, K. E., Cheung, W. W., Choat, J. H., et al. (2013). Fishing groupers towards extinction: a global assessment of threats and extinction risks in a billion dollar fishery. Fish Fish. 14, 119–136.
Semmler, R. F., Hoot, W. C., and Reaka, M. L. (2017). Are mesophotic coral ecosystems distinct communities and can they serve as refugia for shallow reefs? Coral Reefs 36, 433–444. doi: 10.1371/journal.pone.0188598
Sih, T. L., Cappo, M., and Kingsford, M. (2017). Deep-reef fish assemblages of the Great Barrier Reef shelf-break (Australia). Sci. Rep. 7:10886. doi: 10.1038/s41598-017-11452-1
Smith, S. R., De Putron, S., Murdoch, T. J., Pitt, J. M., and Nagelkerken, I. (2013). “Biology and ecology of corals and fishes on the Bermuda Platform,” in Coral Reefs of the United Kingdom Overseas Territories. ed. C. R. C. Sheppard (Dordrecht: Springer), 135–151.
Smith-Vaniz, W. F., Collette, B. B., and Luckhurst, B. E. (1999). Fishes of Bermuda: History, Zoogeography, Annotated Checklist, and Identification Keys. Lawrence, KS: Allen Press.
Starr, R. M., Green, K., and Sala, E. (2012). Deepwater fish assemblages at Isla del Coco National Park and Las Gemelas Seamount, Costa Rica. Rev. Biol. Trop. 60, 347–362.
Thresher, R. E., and Colin, P. L. (1986). Trophic structure, diversity and abundance of fishes of the deep reef (30–300m) at Enewetak, Marshall Islands. Bull. Mar. Sci. 38, 253–272.
Usseglio, P. (2015). “Quantifying reef fishes: bias in observational approaches,” in Ecology of Fishes on Coral Reefs. ed. C. Mora (Cambridge: Cambridge University Press), 270–273.
Vergés, A., Vanderklift, M. A., Doropoulos, C., and Hyndes, G. A. (2011). Spatial patterns in herbivory on a coral reef are influenced by structural complexity but not by algal traits. PLoS One 6:e17115. doi: 10.1371/journal.pone.0017115
Watson, D. L., Harvey, E. S., Fitzpatrick, B. M., Langlois, T. J., and Shedrawi, G. (2010). Assessing reef fish assemblage structure: how do different stereo-video techniques compare? Mar. Biol. 157, 1237–1250.
Wilson, S., Graham, N., and Polunin, N. (2007). Appraisal of visual assessments of habitat complexity and benthic composition on coral reefs. Mar. Biol. 151, 1069–1076.
Keywords: mesophotic coral ecosystem, fish assemblage structure, reef connectivity, deep reef refuge hypothesis, Bermuda
Citation: Stefanoudis PV, Gress E, Pitt JM, Smith SR, Kincaid T, Rivers M, Andradi-Brown DA, Rowlands G, Woodall LC and Rogers AD (2019) Depth-Dependent Structuring of Reef Fish Assemblages From the Shallows to the Rariphotic Zone. Front. Mar. Sci. 6:307. doi: 10.3389/fmars.2019.00307
Received: 20 March 2019; Accepted: 24 May 2019;
Published: 07 June 2019.
Edited by:
Xavier Pochon, Cawthron Institute, New ZealandReviewed by:
Richard L. Pyle, Bernice P. Bishop Museum, United StatesRandall K. Kosaki, National Oceanic and Atmospheric Administration (NOAA), United States
Copyright © 2019 Stefanoudis, Gress, Pitt, Smith, Kincaid, Rivers, Andradi-Brown, Rowlands, Woodall and Rogers. This is an open-access article distributed under the terms of the Creative Commons Attribution License (CC BY). The use, distribution or reproduction in other forums is permitted, provided the original author(s) and the copyright owner(s) are credited and that the original publication in this journal is cited, in accordance with accepted academic practice. No use, distribution or reproduction is permitted which does not comply with these terms.
*Correspondence: Paris V. Stefanoudis, cGFyaXNAbmVrdG9ubWlzc2lvbi5vcmc=
†Supervising authors