 S. K. Adamczak
 Ann Pabst
 W. A. McLellan2
- 1School of Marine and Atmospheric Sciences, Stony Brook University, Stony Brook, NY, United States
- 2Department of Biology and Marine Biology, University of North Carolina at Wilmington, Wilmington, NC, United States
Studies of animal morphology inform our understanding of many combined aspects of biology, including thermal ecology, biomechanics and energetics. Studies that accurately describe the size and shape of marine mammals, for example, can be particularly useful in understanding the challenges an endotherm faces when moving and thermoregulating in an aquatic environment. The relationship between surface area (SA) and volume (V) plays a key role in the energetics of thermoregulation and locomotion, but detailed morphometric measurements of marine mammals are often limited. Thus, SA and V are typically estimated using a series of conical frustrums and cylinders (the truncated cones method), which provides a repeatable but abstracted depiction of morphology. In contrast, digital 3D modeling systems can offer more detailed representations of animal size and shape. We compared the results of the truncated cones method and a 3D modeling system (produced using the open access software Blender) in quantifying the SA and V of both long-finned pilot whales and short-finned pilot whales (Globicephala spp.). We developed a 3D model of pilot whales using measurements and images collected by stranding networks. The 3D model provided a more realistic depiction of pilot whale morphology than the truncated cones method, particularly in the tail stock region where the truncated cones method greatly overestimated both SA and V. The difference between SA and V estimates of the two methods was greater for larger individuals within species, suggesting that as animals become larger, the truncated cones method increasingly overestimated SA and V. Further, the 3D model was more robust to changes in the number of morphometric girth measurements used when estimating SA and V compared to the truncated cones method. Results of this study demonstrate that 3D models can provide realistic depictions of cetacean morphology and can be used to provide more accurate estimates of morphological metrics than geometric models of morphology. The 3D modeling techniques employed in this study could be used in a variety of other applications which require accurate estimates of morphological metrics.
Introduction
The study of animal morphology informs our understanding of evolution, ecology, and biology (Lauder, 1990; Burke et al., 1995; Witmer et al., 2008; Rabosky et al., 2013). For marine mammals, morphological studies can provide insight into their evolution and the unique adaptations that allow these animals to survive as endotherms in an aquatic environment (Williams, 1999; Uhen, 2007). Studies of external marine mammal morphology and body size are particularly useful in understanding thermoregulation, locomotion, and biomechanics (e.g., Woodward et al., 2006; Goldbogen et al., 2010) adding insights into specializations for life in a dense, viscous environment with a high thermal conductivity (Schmidt-Nielsen, 1997; Woodward et al., 2006; McKenna et al., 2012; Pyenson et al., 2013). Further, morphological studies have been useful in documenting the genetic divergence of marine mammal species and the emergence of subspecies over time (Kasuya et al., 1988; Foote et al., 2009). Thus, accurately modeling the external morphology of marine mammals is critical to enhancing our understanding of their biology (Fish, 1996; Williams, 1999; Woodward et al., 2006).
Traditional methods for examining marine mammal external morphology, which refers to their size and shape, use mathematical computations based on a small number of morphometric measurements (Bell et al., 1997; Woodward et al., 2006; Goldbogen et al., 2010; Segre et al., 2016). However, digital 3D modeling is increasingly being used for studies of animal anatomy and biology (Chiari et al., 2008; Thote et al., 2013; van de Kamp et al., 2014) and may provide a more accurate means of modeling external morphology, particularly for species such as marine mammals for which morphometric measurements are often limited. While 3D modeling has been used to examine the morphology of specific anatomical structures in marine mammals (e.g., Marino et al., 2001; Parks et al., 2007; Fahlke and Hampe, 2015; Peredo et al., 2017), few studies have developed 3D models to investigate the external morphology of marine mammals.
Surface area (SA) and volume (V) are important metrics representing marine mammal morphologies, and are used to assess body condition and heat retention capabilities of marine mammals, as well as the drag forces that act on their bodies (Gales and Burton, 1987; Ryg et al., 1988; Stelle et al., 2000; Beentjes, 2006; Woodward et al., 2006). When calculating SA and V, researchers often use the truncated cones method, which models the external morphology of marine mammals as a series of cylinders and conical frustrums (Ryg et al., 1988; Bell et al., 1997; Luque and Aurioles-Gamboa, 2001). However, marine mammal bodies are not strictly cylindrical in cross-sectional shape. For example, the caudal tailstocks of cetaceans are highly streamlined and elliptical in cross-section (e.g., Koopman et al., 2002; Hamilton et al., 2004). Thus, the truncated cones method may not accurately represent all marine mammal body shapes. In addition, the truncated cones method is usually unable to account for the morphology of appendages without the use of external software or technologies such as a planimeter (Feldkamp, 1987; Beentjes, 2006). 3D modeling may provide a more accurate representation of overall marine mammal external morphology as it is not constrained to cylindrical shapes and can also be used to model appendages. Further, most detailed morphometric data for marine mammals come from stranding networks, organizations that respond to stranded or injured marine mammals, and the number and location of measurements taken varies between these networks (Norris, 1961; Hohn et al., 2006). The variation in measurements likely influences the accuracy of morphological representations developed using truncated cones. 3D models may provide an advantage in this regard, by providing a representation of marine mammal body shapes that can be scaled using available measurements. Further, 3D models provide a low-cost, easily accessible means of addressing a wide-range of questions.
Here, we examine the utility of 3D modeling to represent marine mammal external morphology, using two species of pilot whales as a case study. Short- and long-finned pilot whales (Globicephala macrorhynchus and G. melas, respectively) are deep-diving odontocete species that are similar morphologically but occupy different latitudinal ranges (Leatherwood et al., 1976). The distributions of the two species appear to be influenced by water temperature, and the United States National Marine Fisheries Service uses sea surface temperature to separate sightings of short-finned pilot whales and long-finned pilot whales in stock assessments (Fullard et al., 2000; Hayes et al., 2017). Understanding differences in the heat retention capabilities of these species using metrics such as SA and V could provide useful insights into their thermal ecology. However, pilot whales, like other cetaceans, have a laterally compressed, elliptically shaped tail stock (Arkowitz and Rommel, 1985), which cannot be accurately captured by the conical and cylindrical shapes used to represent morphology in the truncated cones method. 3D modeling may therefore provide a more accurate representation of the shape of these cetacean species.
We modeled the external morphology of short- and long-finned pilot whales using both the truncated cones method and a morphable 3D model mesh constructed in Blender (Blender Online Community, 2016), an open-source 3D rendering system, and evaluated differences between the two models. Specifically, we examined: (1) overall differences in estimates of SA and V produced by the two methods; (2) how well each method represented external morphology within different body regions of the pilot whale; and (3) whether the number of girth measurements influenced calculations of SA and V for the two methods.
Materials and Methods
Data Sources
Morphometric data for pilot whales throughout the Northwest Atlantic were compiled from marine mammal stranding responders who collected detailed external measurements in addition to the basic morphometrics collected for Level A data, which provides information on the time and place of the stranding as well as sex, length and life history stage as part of the United States National Oceanographic and Atmospheric Administration (NOAA)’s National Marine Mammal Stranding Database. The following stranding responders contributed data to this analysis: the International Fund for Animal Welfare (IFAW); the Smithsonian Institution; data made available from Pabst, McLellan, and Read from the “Offshore Atlantic Pelagic Cetacean Necropsy Cruise R/V/ Abel-J, 30 June-12 July, 1996” (hereafter called 1996 morphometric data); and data made available from Pabst, McLellan, and Read from specimens examined during the 2005 multi-species mass stranding event in North Carolina (described in Hohn et al., 2006, hereafter called 2005 morphometric data). Data included girth measurements at the level of the nuchal crest, axillary pectoral flipper insertion, mid-thoracic, cranial dorsal fin insertion, caudal dorsal fin insertion, anus, and mid-caudal keel (Figure 1), as well as total length and appendage measurements (Norris, 1961). Protocols for the number of measurements taken varied by stranding responder; for example IFAW typically measured girths at the level of the axillary pectoral flipper insertion, mid-thoracic, and anus while the 1996 and 2005 morphometric data records typically included all six girths listed above. Overall there were either three, five, or six girth measurements taken, depending on the stranding responder, though in some cases measurements were missing, resulting in a total of 4 available girth measurements for 13 individuals (Table 1).
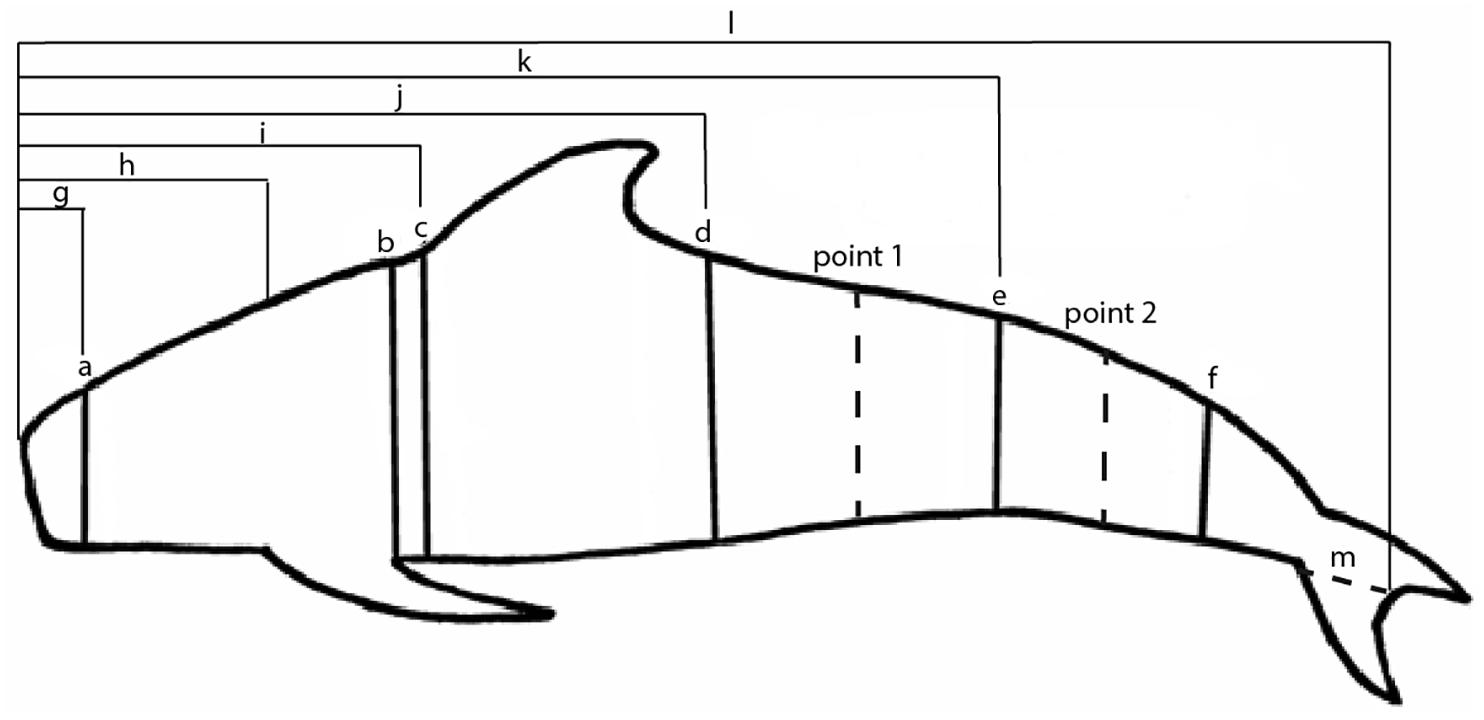
Figure 1. Girth and length measurements typically taken on stranded pilot whales (measurements vary based on stranding network). Girth measurements are taken at the (a) nuchal crest, (b) axillary pectoral flipper insertion, (c) cranial dorsal fin insertion, (d) caudal dorsal fin insertion, (e) anus, and (f) mid-caudal keel. The letters (g) through (l) represent length measurements taken from the snout. Measurement (m) represents the fluke notch to fluke insertion measurement used to calculate the snout to fluke insertion length measurement. For the 3D model method, dotted lines at points 1 and 2 indicate the area that was scaled according to the girth measurements at (e).
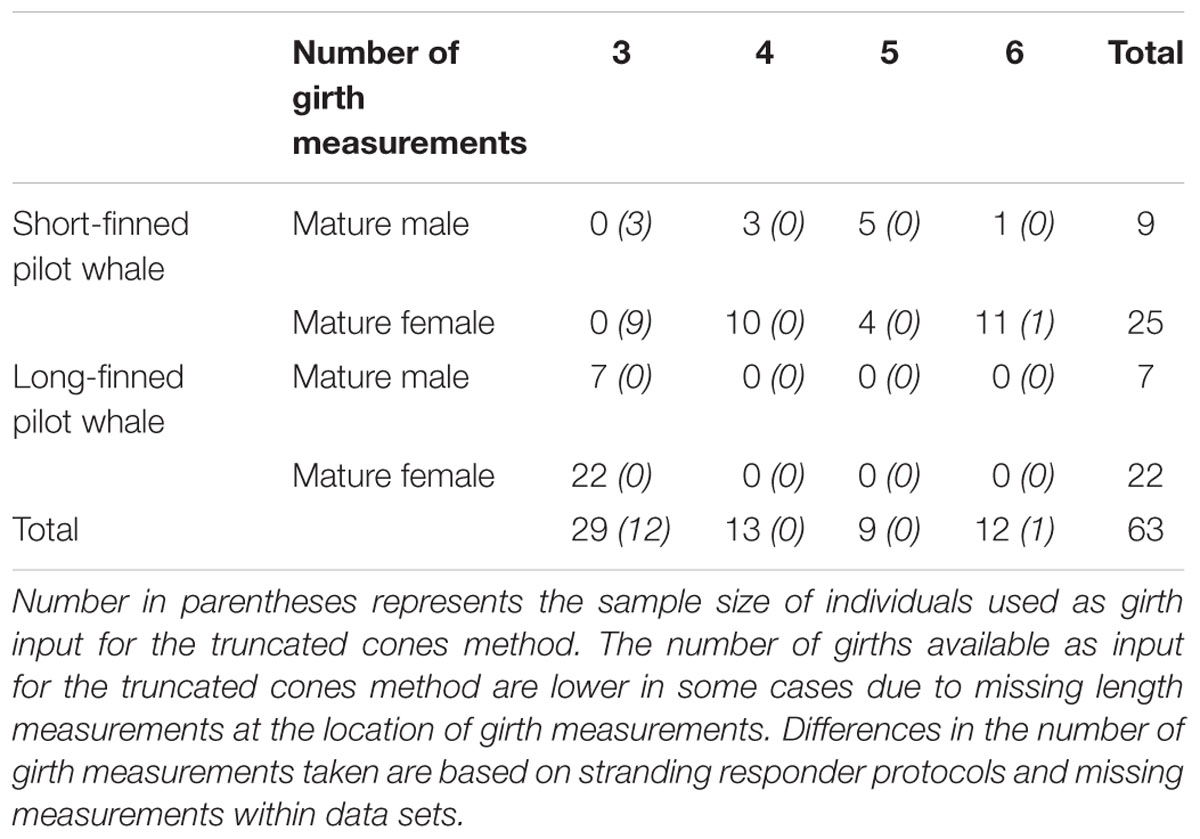
Table 1. Sample size for mature female and male short-finned pilot whales and long-finned pilot whales (Globicephala macrorhynchus and G. melas, respectively) relative to the number of girth measurements available as input for the 3D model.
Only those individuals that were in good to moderate carcass condition [for strandings – Smithsonian Institution (SI) condition codes 1 and 2; for 2005 data set – codes 1–3; 1996 samples were all fresh-dead animals retrieved from fishery] were included in analyses, to minimize any effect of post-mortem processes (decomposition) on morphometric measurements. Only animals in robust or normal body condition were included in the sample, as determined visually by stranding responders at the time of response. Only mature individuals were used in these analyses to avoid variation in body size and shape associated with growth. Mature individuals were classified as animals greater than 422 and 320 cm for male and female short-finned pilot whales, respectively (Kasuya and Marsh, 1984), and animals greater than 450 and 365 cm for male and female long-finned pilot whales, respectively (Bloch and Lockyer, 1993). Pregnant and/or lactating females were removed from the dataset due to the small sample size of these classes. We examined animals for which three or more girth measurements were collected, in addition to corresponding morphometric lengths (e.g., snout to eye, snout to dorsal fin insertion) to enable the construction of at least four “cones” when using the truncated cones method (described below). Six individuals had anomalously large differences between consecutive girth measurements (more than twice the average difference; difference refers to one girth measurement subtracted from another girth measurement) and were removed as these measurements were assumed to be due to a recording error. The final sample size included 63 individuals; 34 short-finned pilot whales, and 29 long-finned pilot whales (Table 1). The number of girth measurements used in the truncated cones method and 3D model method differed for 13 short-finned pilot whales because the truncated cones method required additional measurements not needed for 3D model manipulations (described below).
Truncated Cones
We estimated SA and V for the whole body (from snout to fluke insertion) for both the truncated cones and 3D model methods. The truncated cones method was used to partition the whale into sections between girth measurements in which the head and tail stock are modeled as cylinders and the remaining sections are modeled as conical frustrums (Figure 2). Length measurements were used to determine the height of each cone, while girth measurements represented the circumference of the cone. When length measurements denoting the height of each cone were not available, the corresponding girth measurement was not used in truncated cones method calculations (these individuals are noted in column 8 of Supplementary Table 1). Thus, the number of girth measurements used in the truncated cones method and 3D model method differed for 13 short-finned pilot whales because length measurements to recorded girth measurements were missing, and these length measurements are required for truncated cones method calculations. For the individuals that had one or more missing length measurements, the corresponding girth measurements were not included in truncated cones method calculations but were included in 3D model manipulations (Table 1).
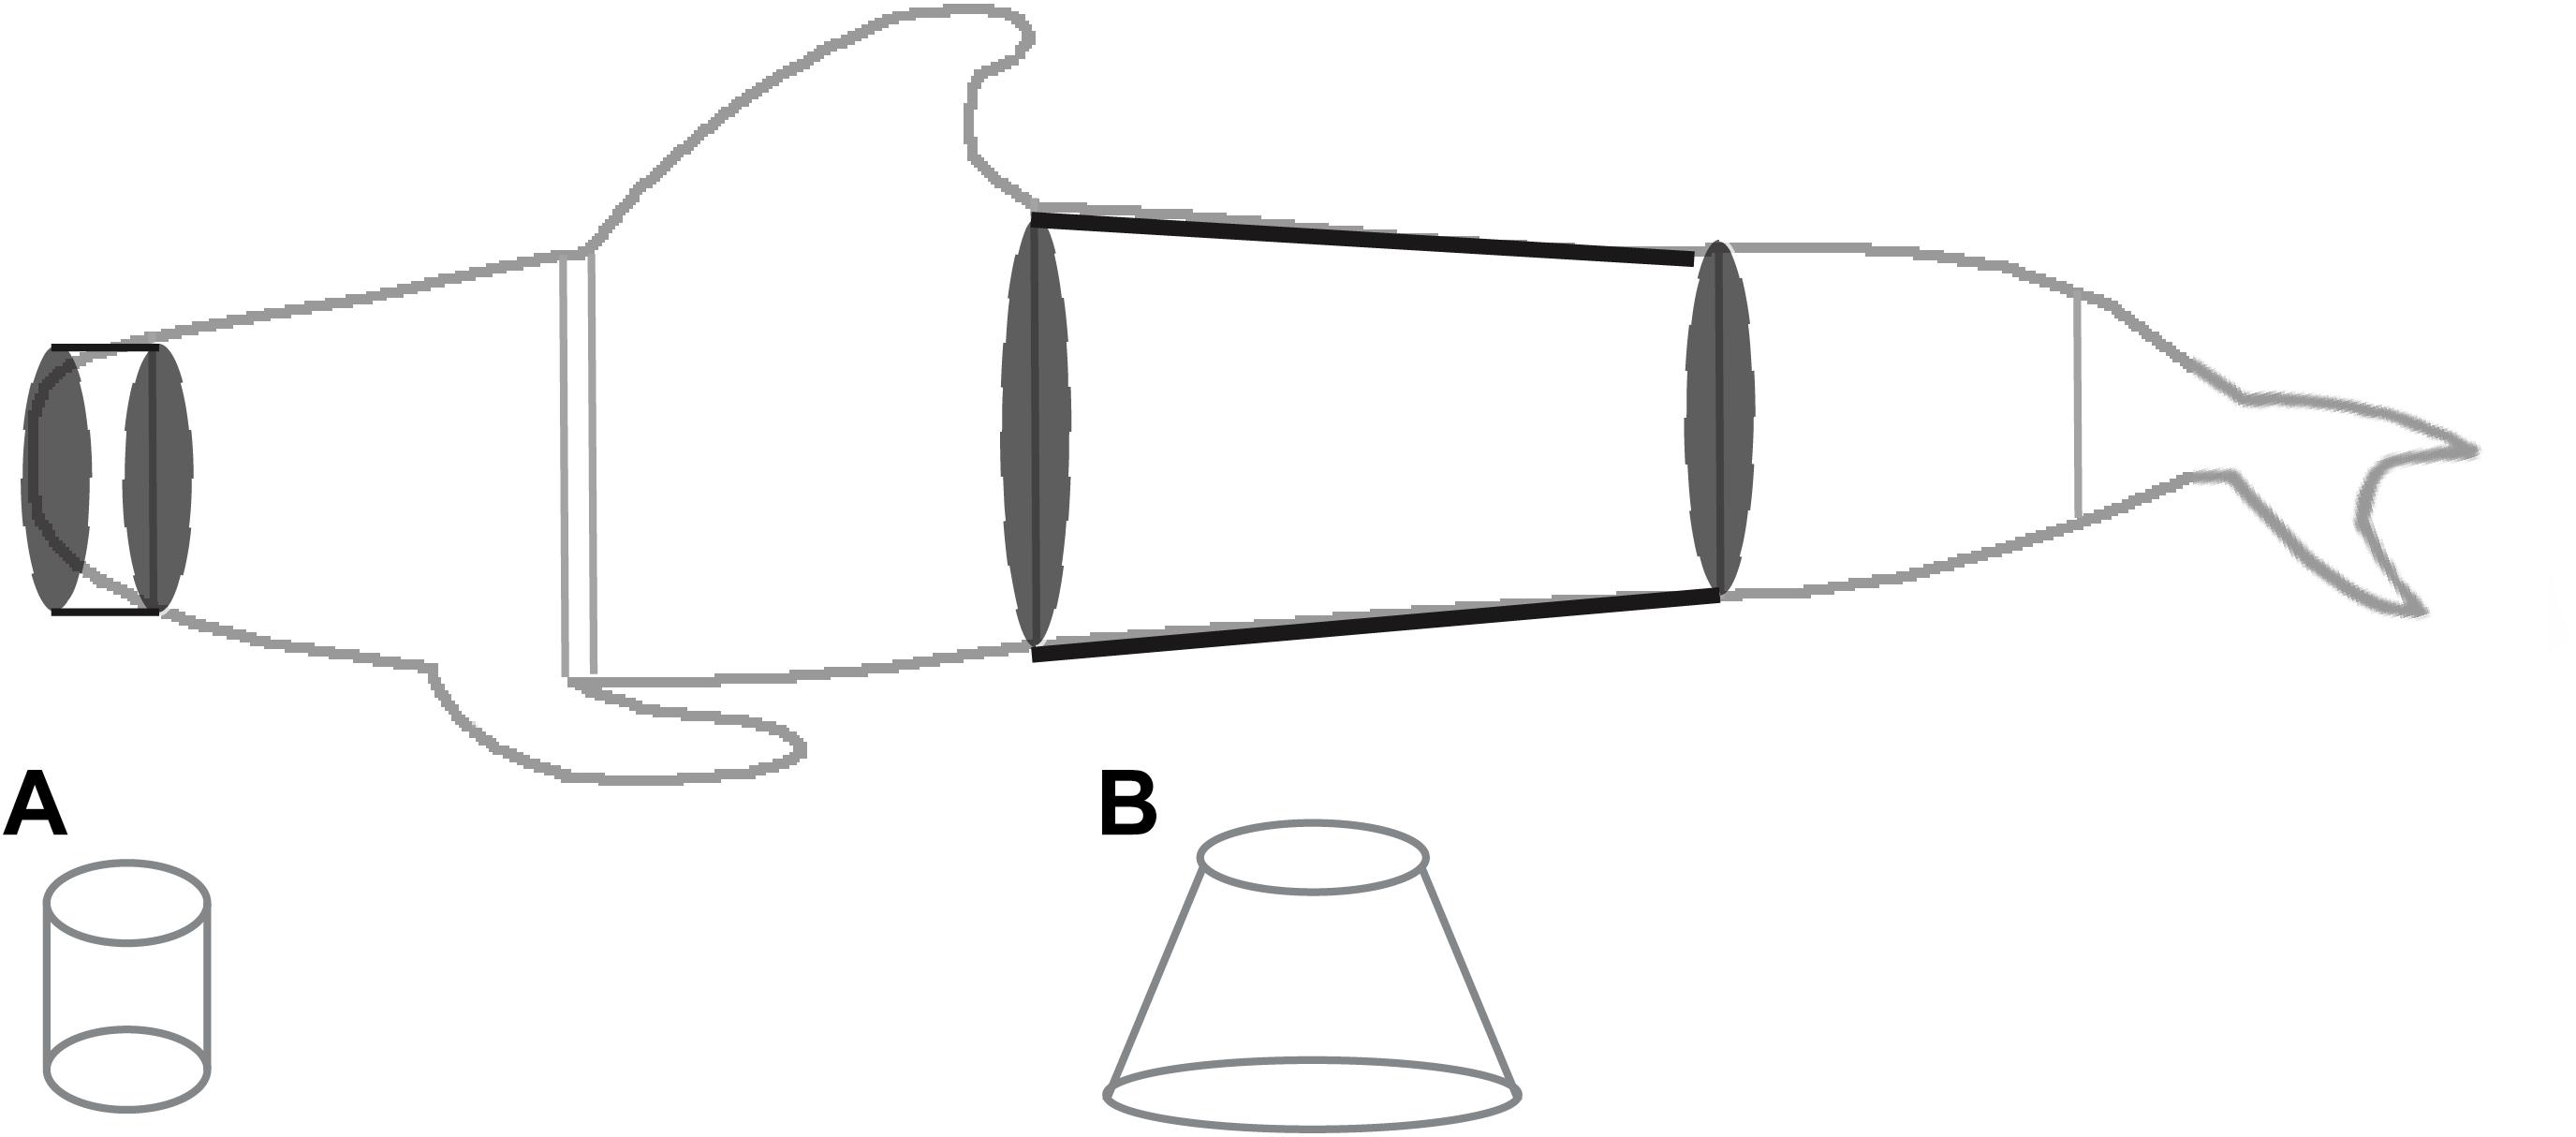
Figure 2. Representation of the shapes used to estimate surface area and volume of pilot whales using the truncated cones method. Cone (A), representing a portion of the head, is modeled as a cylinder and cone (B), representing the mid-section, is modeled as a conical frustrum. All mid-body cones were modeled as conical frustrums and the head and caudal-most peduncle sections were modeled as cylinders.
Although the caudal-most region of the tail stock does taper to the insertion of the flukes, particularly posterior to the mid-caudal keel (and therefore more resembles a conical frustrum than a cylinder in this region; Figure 1), available girth measurements were typically at the level of the anus or mid-caudal keel and not at the insertion of the flukes (Norris, 1961; Cornick et al., 2016). We therefore lacked the required measurement to model a frustrum and modeled the tail stock as a cylinder, using the circumference of the last available girth measurement (either the mid-caudal keel or anus). Total length was measured from the snout to the fluke notch, and thus the length from the snout to fluke insertion was calculated as the total length minus the measurement taken from the fluke notch to the fluke insertion (Figure 1, measurement m). For 31 individuals a measurement for fluke notch to fluke insertion was missing. For these individuals, we calculated the fluke notch to fluke insertion length using the ratio of (fluke notch to fluke insertion):(anus to fluke notch) for individuals with both measurements and multiplied the mean ratio (0.217 ± 5.07×10⁻³) by the anus to fluke notch measurement for individuals missing this measurement. This value was then subtracted from the total length to obtain the length from snout to fluke insertion. SA and V were calculated for each cone and cylinder and then values for cones and cylinders were summed to provide estimates of overall SA and V. As in previous studies, appendages (i.e., the pectoral flippers, dorsal fin and fluke) were not included in calculations since the truncated cones method cannot model appendages accurately (e.g., Feldkamp, 1987; Beentjes, 2006). Because of differences between stranding responders in the collection of measurements, estimates of SA and V using the truncated cones method were calculated using differing numbers of cones and cylinders (4 to 7).
3D Model Construction
We used Blender to develop a 3D model of pilot whales, which was then scaled based on morphometric measurements (described below). Digital photographs of the appendages and dorsal, lateral and frontal views of mature short-finned pilot whales were made available from the University of North Carolina Wilmington and SeaWorld Parks and Entertainment, and photos of the appendages of a mature long-finned pilot whale were made available from the Atlantic Marine Conservation Society. We imported the following selected images into Blender using the background images tool to create the model: (1) a high-resolution aerial photograph of the dorsal view of a mature short-finned pilot whale at sea, (2) a left lateral view of a stranded, male, short-finned pilot whale suspended vertically in the air by a front-end loader, for which morphometric data were available, and (3) a frontal view image of a mature, male short-finned pilot whale under human care. In Blender, we constructed a 3D mesh around the whale body in each of these images to create a baseline model of the core body. Mesh construction followed the protocol for “character modeling” in Blender, a technique typically employed when building a 3D character for video games for which there are numerous online tutorials. The mesh was modeled as a series of consecutive vertices forming a circle around the body of the whale (called vertex groups) and vertices forming a curved mask for the lateral head. Vertex groups were evenly spaced at 20 cm to accurately capture the external morphology of the whale, with two exceptions (Figure 3). The vertex groups in the body region between the axilla and cranial insertion of the dorsal fin were spaced approximately 7 cm apart to ensure that a vertex group was present at each of these recorded girth measurements. The lateral head was constructed using vertices at 10 cm intervals to account for the curvature of the head (Figure 3). The mesh was constructed along one axis and a mirror-modifier (made available in the Blender tools) was applied during mesh construction. This modifier duplicated the vertices built to construct the mesh for the contralateral side of the whale thereby conserving bilateral symmetry. Although images of a male, short-finned pilot whale were used in model construction, the 3D model manipulation (as described below) accounts for potential differences in morphology between species and sexes and as a result only one model was needed. An additional manuscript reviews morphological differences found between species and sexes of short- and long-finned pilot whales using this method.
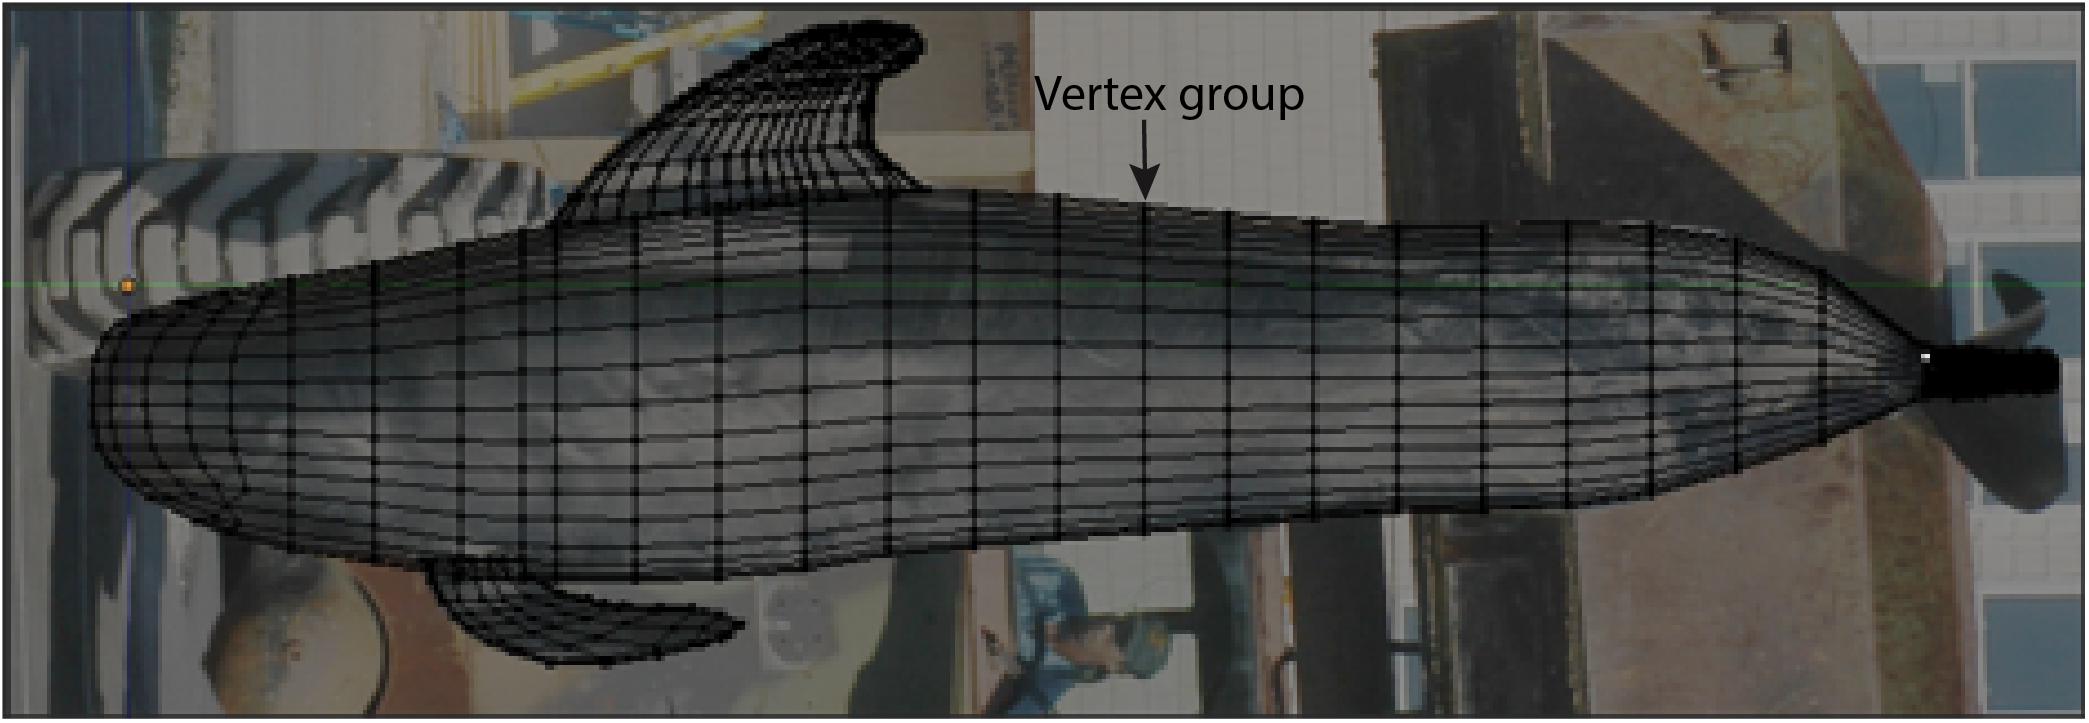
Figure 3. Depiction of the methods used to render the 3D model of the body core in Blender. A mesh was constructed over background images of pilot whales from multiple angles. Each vertical vertex group was spaced at 20 cm intervals, with the exception of the (1) lateral head which was constructed at 10 m intervals, and (2) body region between the axilla and cranial insertion of the dorsal fin, which was constructed at a 7 cm interval to ensure that a vertex group was present at the site between these two recorded girth measurements. Although appendages are shown here, comparisons between the 3D model and truncated cones method estimates were made using the body core alone. Shown here is the left lateral view of the 3D model and underlying background image used to construct the 3D model.
3D Model Manipulation
The base model for the core body of pilot whales were scaled using individual morphometric measurements provided by stranding networks. The core body model was scaled using the length from the snout to fluke insertion (as described above for the truncated cones method calculations), and girth measurements provided for each individual, which permitted the model to be fit to, and thus represent the specific external morphology of, each whale in the sample (i.e., to account for morphological differences between individuals). To conserve the overall morphology of pilot whales represented by the 3D model, the model included more vertex groups than girth measurements recorded by stranding responders and the scaling factor of the nearest available girth measurement was used to scale vertex groups to either side (e.g., Figure 1; the girth measurement at position e was used to scale the region between points 1 and 2). As with the truncated cones method, the number of available girth measurements differed due to differences in protocols between stranding networks; thus, three to six girth measurements were used to scale each 3D model for individual pilot whales. All available girth measurements were used to scale the 3D model. SA and V were estimated using the 3D print toolbox in Blender for the core body.
Analyses
We used paired Wilcoxon signed rank tests to examine the difference between the SA and V estimates from the truncated cones method and 3D model. Analyses were separated by species and sex to account for potential species-specific morphological differences and sexual dimorphism (Woolson, 1998; Olson, 2009), resulting in a total of eight comparisons (3D model versus truncated cones for males and females of each species, respectively, for both SA and V). To compare differences in estimates of SA and V for different sections of the body, we partitioned the core body into four sections at the head (Section 1) (ending at the axillary pectoral flipper girth), cranial mid-body (Section 2) (caudal dorsal fin girth), caudal mid-body (Section 3) (anus), and tail stock (Section 4) (fluke insertion). We used a paired Wilcoxon signed rank test to compare estimates produced using the 3D model and truncated cones models in each region (Figure 4). In addition, we examined differences in results produced by the 3D model and truncated cones methods when different numbers of girth measurements were used as inputs by calculating SA and V for each method using three, five, and six girth measurements. For simplicity, we restricted analyses comparing body sections and effects of the number of girth measurements to female short-finned pilot whales in which all six girth measurements were recorded and all necessary length measurements were included since this group had the largest sample size (n = 10). For calculations using three measurements, we used girths at the axillary pectoral flipper insertion, cranial dorsal fin insertion, and anus to estimate SA and V; for calculations using five measurements, we used girths at the eye, axillary pectoral flipper insertion, cranial dorsal fin insertion, anus, and mid-caudal keel. These girths were selected because they represented the number of measurements taken by different stranding responders (described above). Kruskal–Wallis tests (McKnight and Najab, 2010) were performed to compare SA and V estimates generated using three, five and six girths, respectively, for both truncated cones estimates and 3D model estimates. Paired Wilcoxon signed rank tests were used to examine the difference between the SA and V estimates for the truncated cones and 3D model estimates for each model simulation (i.e., 3D model calculated with three girths vs. truncated cones calculated with three girths). A p-Value of 0.05 was used to determine significance for all tests.
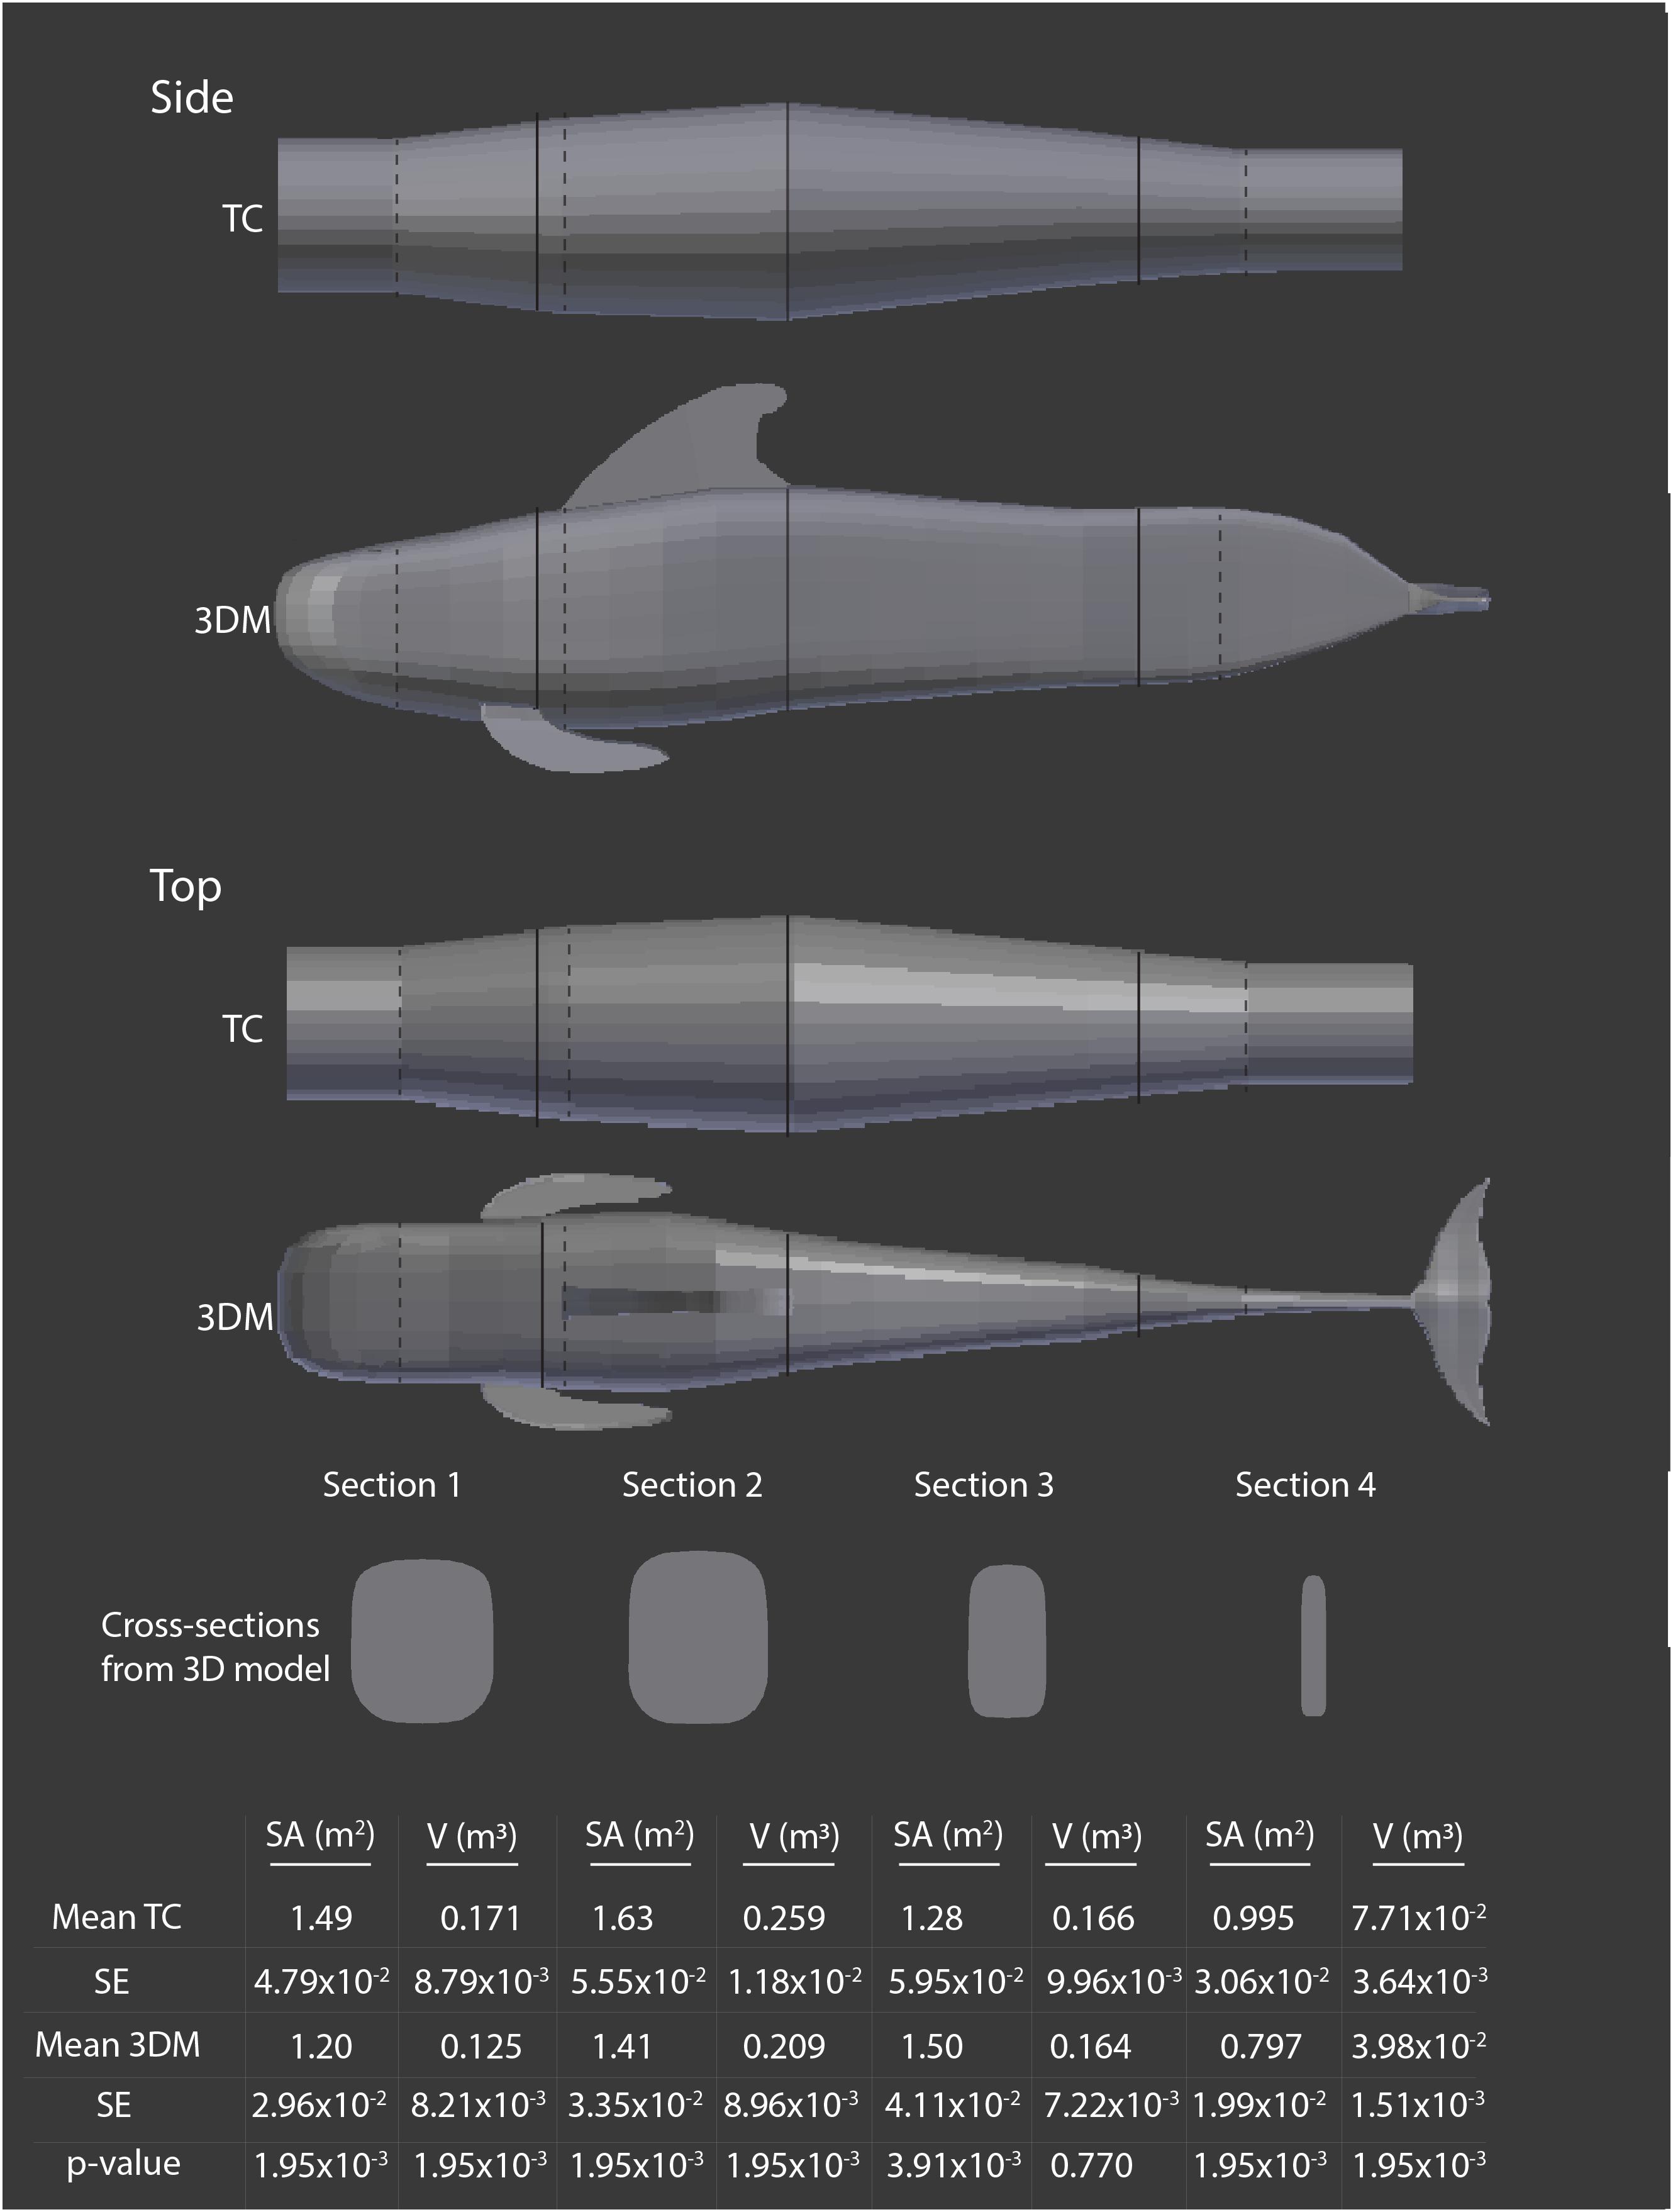
Figure 4. Comparison of mean surface area (SA) and volume (V) estimates, with standard error (SE) made using the 3D model (3DM) and truncated cones (TC) method for each section of the core body for mature female short-finned pilot whales (Globicephala macrorhynchus), n = 10. Girth measurements were taken at both dotted and solid lines, and solid lines delineate each section being compared. Cross-sections from the 3DM are shown at the midway point for each section. Although appendages from the 3DM are shown here for illustration purposes to help indicate the orientation of the whale, they were not included in SA and V estimates to compare the two models. P-values are shown for paired Wilcoxon tests comparing estimates of SA or V for each body section calculated from the truncated cones method and the 3D model.
Results
The 3D model better represented the external morphology of pilot whales, particularly in the tail stock region, because it was based upon high-quality digital images of individuals that reflected pilot whale body shape. When examining differences in SA and V estimates across the four sections of the core body, we found significant differences between the truncated cones and 3D model methods in all sections other than for V in section 3 (Figure 4). The truncated cones method overestimated SA in sections 1, 2, and 4 and V in all sections when compared to the 3D model method (Figure 4). In section 3 the truncated cones method yielded a significantly lower SA than did the 3D model, but there was no difference in V between the methods (Figure 4).
When the entire body core was evaluated as a whole (i.e., all sections summed), the truncated cones method resulted in significantly higher SA and V estimates than those produced from the 3D model for both male and female long-finned pilot whales and both male and female short-finned pilot whales (Figure 5). Within species, there was a greater difference between estimates from the 3D model method and truncated cones method for males, the larger of the two sexes, and, the difference between estimates produced by these two methods was greater in both sexes of long-finned pilot whales than in short-finned pilot whales (Supplementary Figure 1).
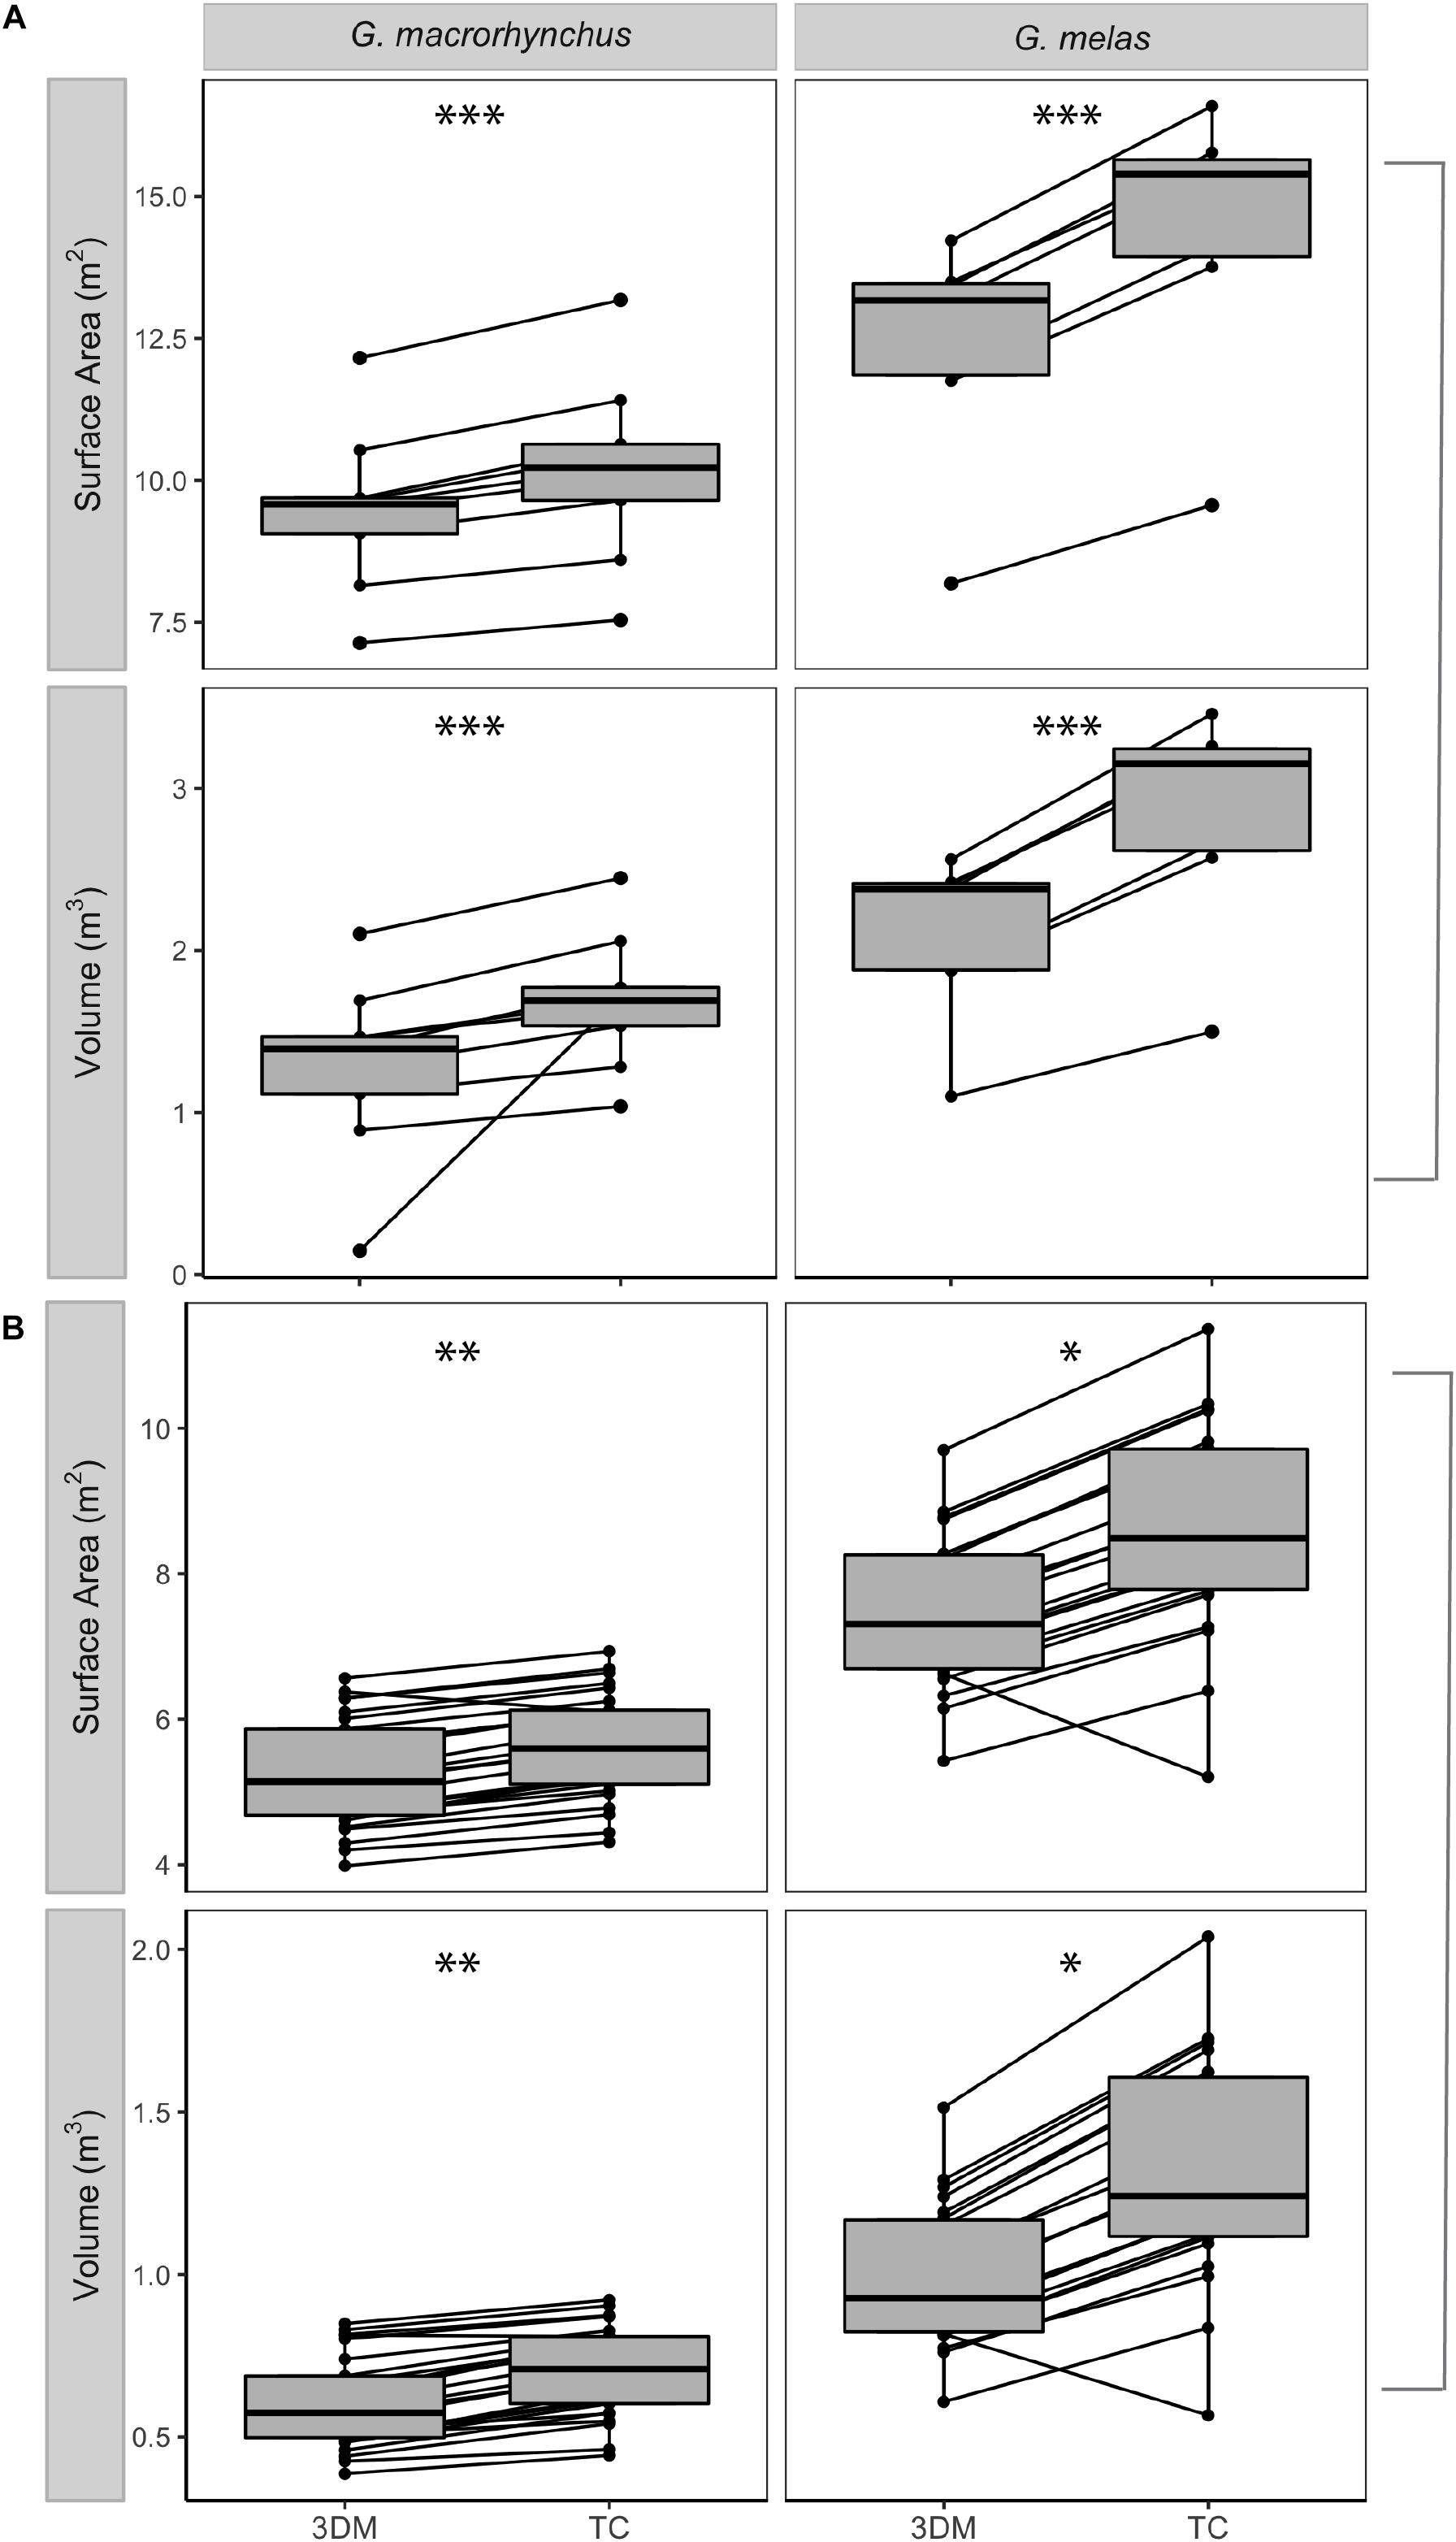
Figure 5. Paired estimates of surface area and volume produced using the 3D model (3DM) and truncated cones (TC) methods. (A) mature male and panel (B) mature female short- and long-finned pilot whales (Globicephala macrorhynchus and G. melas, respectively). Dot plots show estimates from individual whales produced using these two methods, while box plots show the median value (represented by the horizontal line) and 50% of the values around the median (represented by the shaded box). The whiskers on the boxplots represent the upper and lower 25% of values. One asterisk indicates significance at the 0.05 level, two asterisks indicate significance at the 0.01 level, and three asterisks indicate significance at the 0.001 level using paired Wilcoxon tests to compare estimates produced using the 3D model and truncated cones method.
Surface area estimates produced using the truncated cones method differed depending on whether three, five, or six girth measurements were used, with borderline significance (Figure 6). Estimates of SA from the truncated cones method produced using only three girth measurements were higher than those produced using five or six girth measurements. Similar trends were observed for V estimates produced using the truncated cones method. Estimates of SA and V produced by the 3D model remained fairly consistent regardless of the number of girth measurement inputs, with no significant difference between estimates produced using three, five, or six girths (Figure 6). We found significant differences between estimates of SA and V produced by the 3D model and truncated cones methods when three, five, and six girth measurements were evaluated. Differences between estimates of SA produced by the 3D model and truncated cones methods were also significant when three, five, and six girths were used (Figure 6). In all cases, estimates of both SA and V were higher for the truncated cones method than for the 3D model.
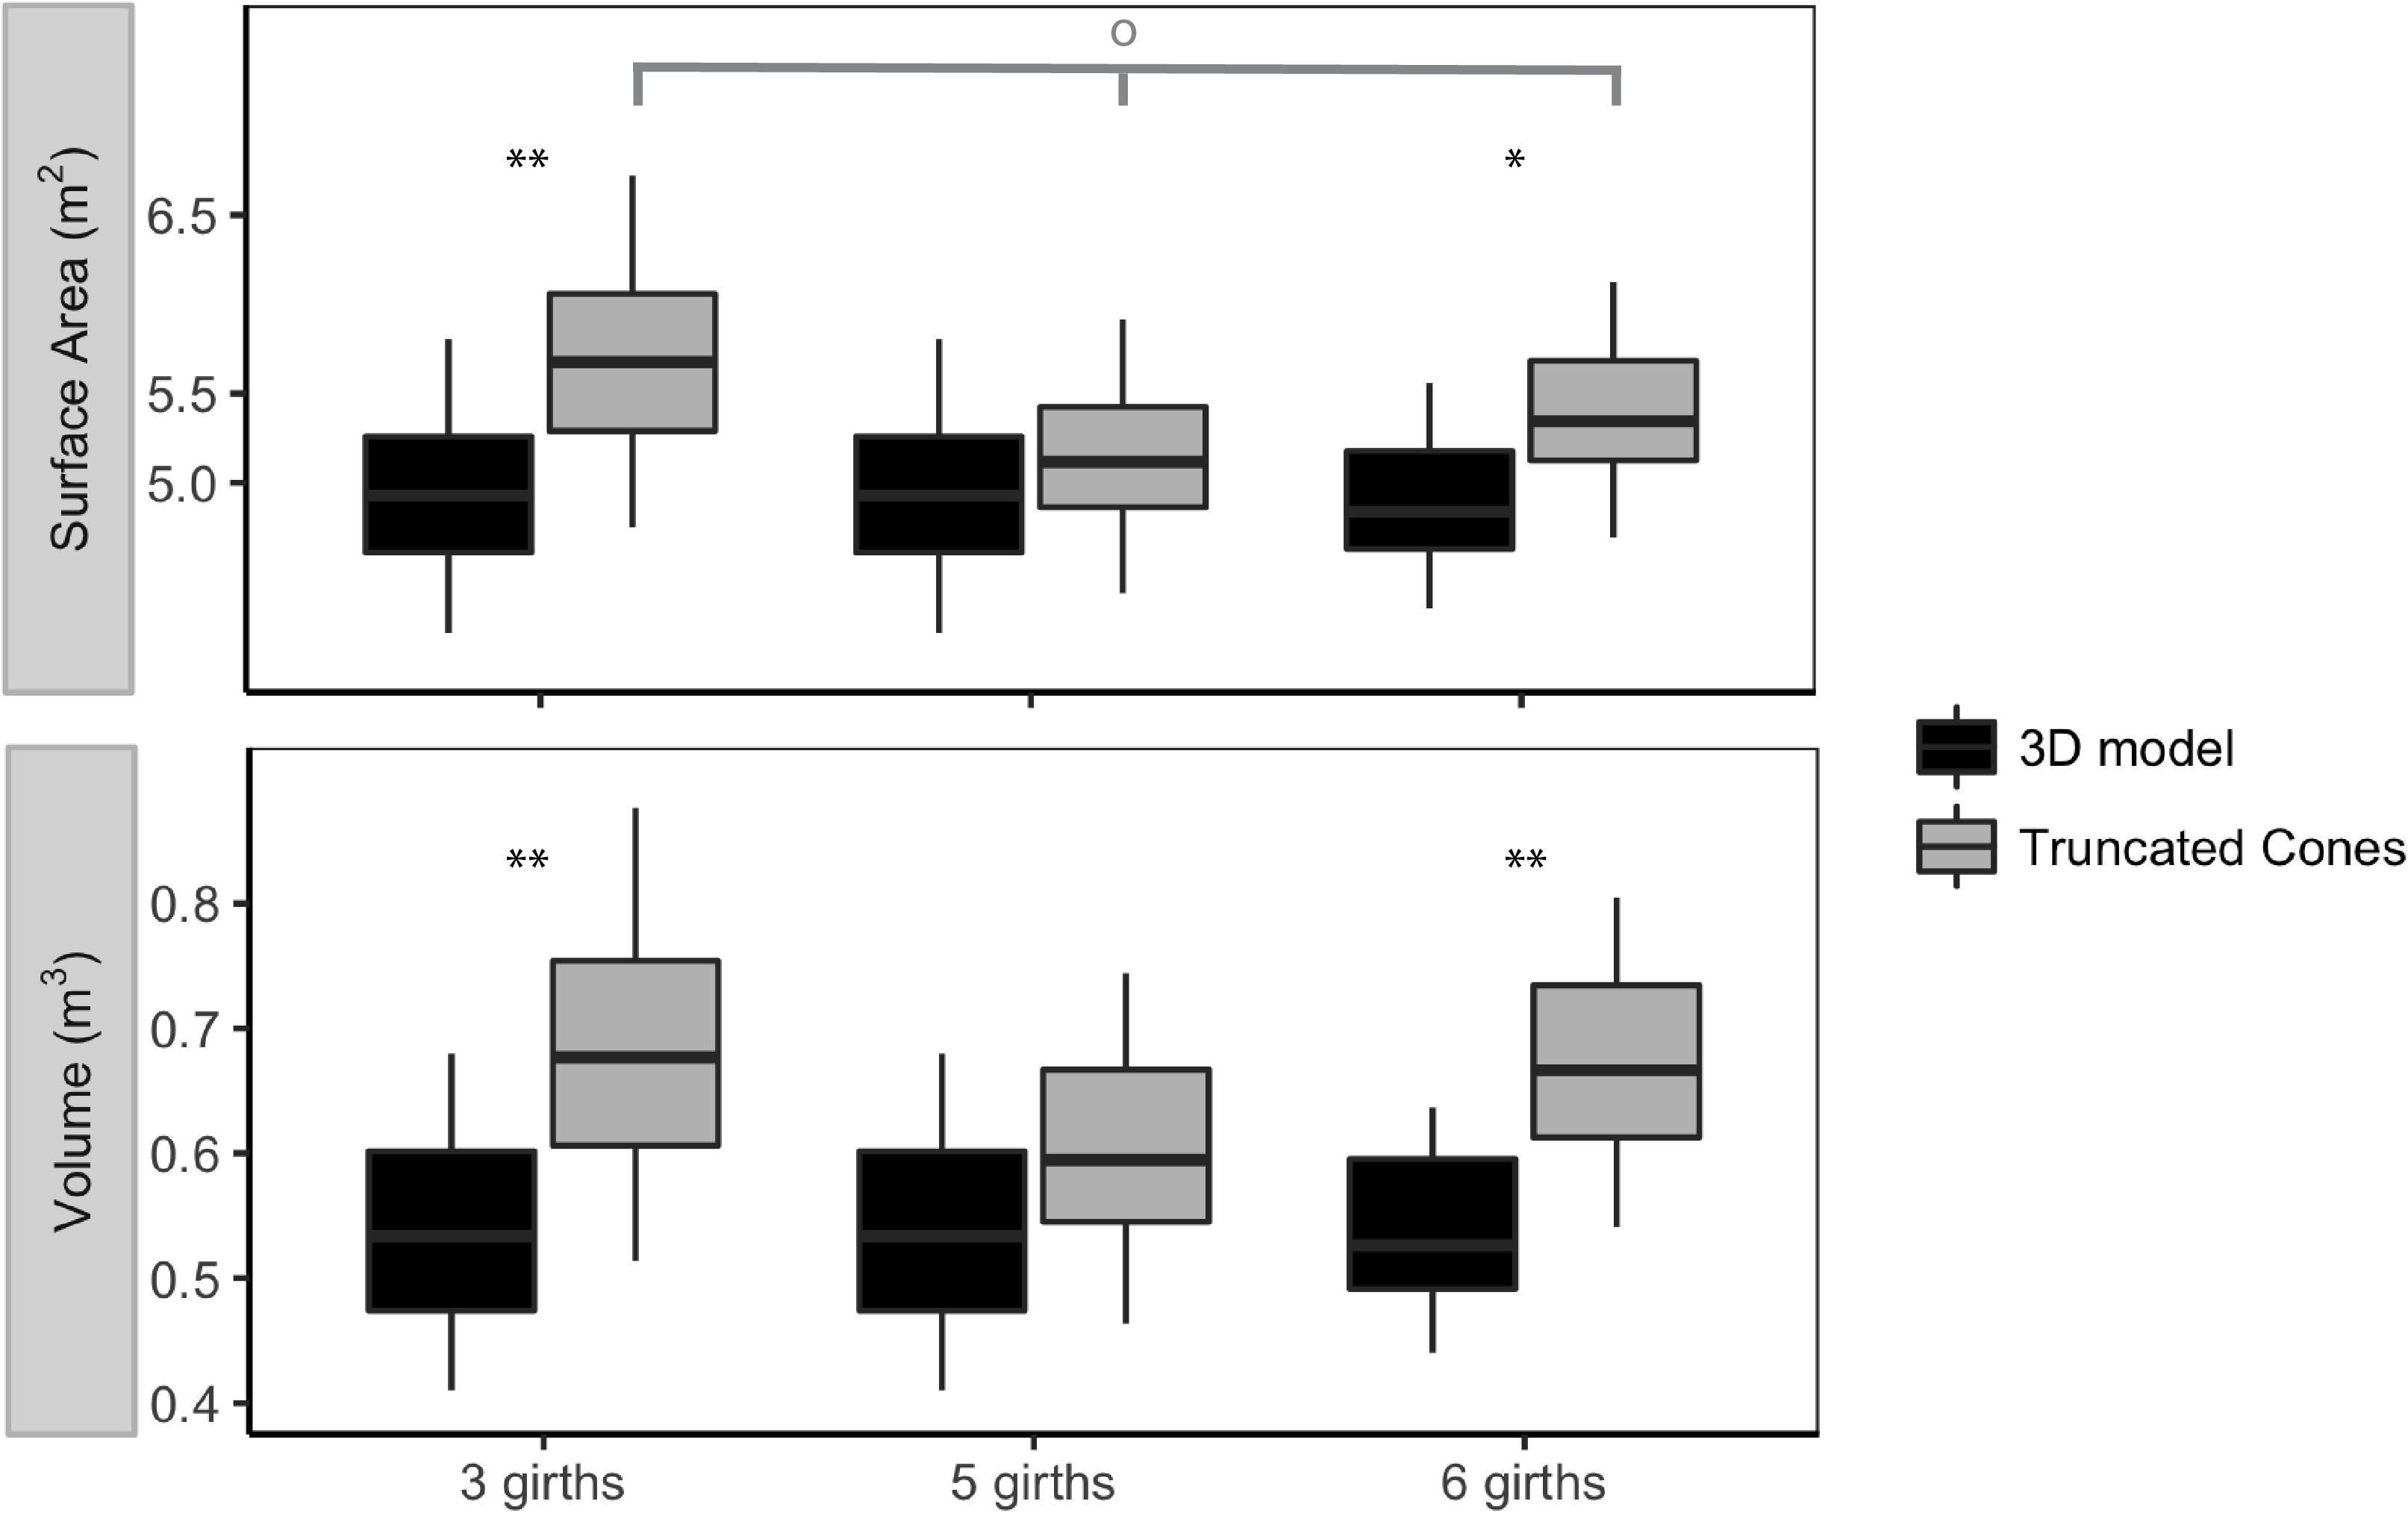
Figure 6. Comparison of 3D model and truncated cones method estimates of surface area and volume for mature female short-finned pilot whales (Globicephala macrorhynchus) using three, five and six girth measurements as inputs into each model. The median value is represented by the horizontal line, while 50% of the values around the median are represented by the shaded box. The whiskers represent the upper and lower 25% of values. One asterisk indicates significance at the 0.05 level, and two asterisks indicates significant at the 0.01 level using paired Wilcoxon tests to compare estimates produced using the 3D model and truncated cones method. The gray bar and hollow circle indicate Kruskal–Wallis test results for estimates of surface area made using three, five, and six girth measurements for the truncated cones method (p = 6.49 × 10⁻²).
Discussion
3D modeling techniques offer the possibility to reconstruct biologically accurate representations of animals that can be used in a variety of applications. For example, 3D models have been used to improve our understanding of biology, particularly in the fields of animal development, functional morphology, and medical modeling of diseases such as cancer (Witmer et al., 2008; Nyga et al., 2011; Thote et al., 2013). Technological advances have greatly increased our ability to analyze and visualize 3D models, and the development of user-friendly, open source software affords the opportunity to use these tools to address a wide range of biological questions. This study demonstrated the utility of a 3D model in providing realistic representations of cetacean external morphology that can be scaled and modified based on measurements of individual animals. This approach could be applied to studies of animal physiology, biomechanics, and thermal ecology, and is particularly useful for studies of species such as marine mammals for which morphological measurements are difficult to obtain.
We used 3D models to examine variability in SA and V of individual pilot whales and compared results from the 3D model to those produced using a previous approach known as the truncated cones method. Our results suggested that the 3D model provided a more realistic representation of pilot whale external morphology when compared to the truncated cones method, particularly in the tail stock region where the truncated cones method failed to account for its sharp elliptical cross-sectional shape, yielding anomalously high SA and V values. Further, since regions overestimated by the truncated cones method are larger in animals with greater total length within species, the overestimation of SA and V in the truncated cones increases with animal size. This is likely because larger pilot whales have a larger tail stock region, therefore, a larger region of the body is poorly represented by the truncated cones method (mean peduncle length for male long-finned pilot whales and male short-finned pilot whales was 225 and 169 cm, respectively, and mean peduncle length for female long-finned pilot whales and female short-finned pilot was 158 and 117 cm, respectively). The difference in estimates was greater for long-finned pilot whales of both sexes than short-finned pilot whales (despite female long-finned pilot whales being smaller in total length than male long-finned pilot whales; Supplementary Figure 1), which was likely because long-finned pilot whales had fewer girth measurements available. The 3D model method was more robust than the truncated cones method when using fewer girth measurements, therefore, the truncated cones method greatly overestimated values for long-finned pilot whales. Our findings suggest that previous studies using the truncated cones method may have overestimated values such as SA and V, or may have inaccurately compared SA and V of large versus small species, due to the increasing discrepancy in truncated cones and 3D model estimates with size.
Accurately estimating SA and V has implications for better understanding the functional morphology and biology of cetaceans. For example, SA is important when estimating heat loss across the integument of marine mammals and is used to calculate the lower critical temperatures of marine mammals to examine viable thermal habitat (e.g., Worthy and Edwards, 1990; Watts et al., 1993; Kvadsheim et al., 1997; Dunkin et al., 2005). Further, SA is used to assess the hydrodynamic drag forces that act on cetaceans and influence swimming, movement, and foraging in the ocean (e.g., Feldkamp, 1987; Fish, 1998; Williams, 1999; Goldbogen et al., 2010). The results of this study suggest that using estimates of SA based upon the truncated cones method might overestimate heat loss and drag forces experienced by cetaceans. Accurately estimating SA could improve our knowledge of how marine mammal bodies have evolved to minimize drag forces during locomotion. Most cetaceans have highly streamlined body shapes that are not likely to be well represented by a series of cones and cylinders. It is perhaps not surprising that the largest differences in SA and V estimated between the two methods are the regions of the body that are least like a cone or cylinder in shape- the head and the highly streamlined tail stock.
Our results indicate that estimates of V for pilot whales were also significantly higher using the truncated cones method than the 3D model. It is likely that because the 3D method yields a more faithful representation of the external morphology, that it also provides a more accurate estimate of V. V relative to an animal’s total body length (V/TBL), referred to as the volumetric coefficient, has been used as a metric of animal “stockiness” and is a metric of the hydrodynamic design and swimming efficiency of animals (Bose et al., 1990; Woodward et al., 2006). V is also used to generate estimates of cetacean mass, an important biological factor (Castellini and Calkins, 1993; Field et al., 2002) that is historically difficult to measure directly in cetaceans due to their extremely large size. Mass is a critical factor in understanding the diving physiology of marine mammals, as metabolic rate, and onboard oxygen stores, scale with mass (Kooyman et al., 1981; Noren and Williams, 2000; Croll et al., 2001; Velten et al., 2013). In a rehabilitation and rescue setting for marine mammals, accurate calculations of mass are critical, and methods to rapidly estimate this metric could reduce handling time (Shero et al., 2014). Drug administration, for purposes such as anesthetics and euthanasia, depends on accurate estimates of mass for proper dosing. By providing more realistic depictions of cetacean external morphology, 3D models can be used to provide more accurate estimates of V, and thus mass, with relatively few morphometric measurements and increased accuracy for larger animals.
The 3D modeling approach that we present here produced consistent estimates of SA and V when the number of measurements used as inputs was varied. Cetaceans are large, highly mobile animals that spend the majority of their life underwater and are therefore inherently difficult to study (Mann, 1999; Hunt et al., 2013), resulting in limited data for studies of morphology. The morphometric data provided by stranding networks is crucial to studies examining the morphology of marine mammals, but it is not always feasible to take a large number of detailed measurements during stranding events. Our results suggest that by developing a generic model of external morphology that can be modified based on individual data, the 3D modeling approach can accurately represent pilot whale morphology (SA and V) with a limited number of girth measurements that could be standardized across stranding response organizations. Conversely, the precision of the truncated cones method decreased when fewer girth measurements were used since more sections of the whale are modeled as large cylinders, leading to unusually large SA and V estimates. Our findings suggest that a larger number of measurements would be necessary for the truncated cones method to accurately estimate SA and V, particularly for large animals.
Visual assessment of the 3D model demonstrated that it better accounted for the external morphology of pilot whales when compared to the truncated cones method (Figure 4). However, we were unable to validate 3D model output relative to actual measurements of SA and V. Independent estimates of SA are traditionally conducted by removing the skin and measuring its area using a planimeter (Worthy and Edwards, 1990). These data are not routinely collected by any stranding program, and also do not account for the shrinkage of skin when removed from the body (Worthy and Edwards, 1990) and were not available for the animals in this analysis. Alternatively, V could be computed using the animal’s known mass and density. This was not possible with our dataset as there were few measurements of mass available for stranded animals (n = 4) and there were no density estimates available. Additional validation of the 3D model produced in this study would be useful when there are sufficient data to allow for such comparisons with measurements of SA and V. Further, validation of this 3D modeling technique for immature and juvenile individuals should be carried out, since the external morphology changes across ontogeny. Although the 3D model used here appeared to better represent the external morphology of smaller mature individuals, it is unclear if this remains true for young individuals that are experiencing rapid growth.
The 3D modeling techniques used in this study could be used in a variety of other applications that require accurate estimates of morphological metrics. For example, unmanned aerial vehicles (UAVs) are increasingly being used to obtain high-quality aerial photographs of cetaceans, and images from UAVs will facilitate the construction of 3D models of large whales, which can be used for a range of applications. Width and total length measurements from UAVs have been used to estimate body condition of whales using metrics such as width per body length, dorsal surface area, and body area index (calculated using dorsal surface area and a parabolic model of the edge of the whale body) (Durban et al., 2015; Christiansen et al., 2016, Burnett et al., 2018). Incorporating width and total length measurements from UAVs into 3D models could be used to generate more comprehensive estimates of body condition such as total body volume, surface area, and mass (given that approximate body density is known). This approach would provide a valuable tool for examining population health as a relatively small number of measurements from UAVs would be needed to model the external morphology metrics of body condition for a large number of animals.
The 3D modeling method introduced here could also be used in 3D morphological representations for studies in hydrodynamics and swimming performance of cetaceans. Previous research exploring the hydrodynamic performance of cetaceans has employed advanced medical imaging, such as computer tomography (CT) scans, to reconstruct morphological features (Fish et al., 2007; Cooper et al., 2008). However, obtaining CT scans of cetaceans is timely and expensive, and can realistically only be done for few individuals. The 3D model method described in this study is cost effective and allows for the visual representation of external morphology for numerous individuals, potentially increasing the sample size of these studies. The Blender 3D modeling method presented here also allows for cross-sectional examination of morphological features, which is a crucial tool when understanding the hydrodynamic performance of cetaceans in water (Fish et al., 2007).
Results of this study demonstrate that 3D models can provide realistic depictions of animal body shape and can be used to provide more accurate estimates of morphological metrics than traditional means of modeling external morphology. We conclude that by providing accurate representations of animal morphology, 3D models can provide valuable research tools for investigating factors such as thermal ecology, biomechanics and individual growth, body condition and body mass.
Author Contributions
SA and LT conceived and designed the study. SA constructed the 3D model, carried out the data analyses, and drafted the manuscript. LT assisted in statistical analyses, provided feedback on the model construction, and drafted the manuscript. AP and WM contributed to the specimen collection and morphological data, provided feedback on the model construction, and drafted the manuscript. All authors read and approved the final version of the manuscript.
Conflict of Interest Statement
The authors declare that the research was conducted in the absence of any commercial or financial relationships that could be construed as a potential conflict of interest.
Acknowledgments
We would like to extend our gratitude to the staff and volunteers at the marine mammal stranding networks for their assistance in the collection of detailed morphometric data for stranded pilot whales. We would also like to recognize the individuals who compiled and provided us with the morphometric data used in these analyses: James Mead at the Smithsonian Institution, Misty Niemeyer at the International Fund for Animal Welfare, and Ryan McAlarney and Erin C. Cummings at the University of North Carolina at Wilmington. We would also like to thank individuals involved in collecting morphometric data, including Dee Allen, Sue Barco, Craig Harms, Aleta Hohn, Heather Koopman, Gretchen Lovewell, Andrew Read, David Rotstein, Brandon Southall, Vicky Thayer, and Andrew Westgate. We are grateful to Ryan McAlarney and Erin Cummings as well as Kim Durham at the Atlantic Marine Conservation Society, and Judy St. Leger and Mike Aguilera at the SeaWorld Parks and Entertainment Research and Science Department for providing pilot whale pictures used to build the 3D model. We would also like to thank Dionysius Angelidis of the Department of Civil Engineering at the Stony Brook University for the helpful insight when creating the 3D model and Bob Cerrato at the Stony Brook University School of Marine and Atmospheric Sciences for providing initial comments and feedback on this manuscript.
Supplementary Material
The Supplementary Material for this article can be found online at: https://www.frontiersin.org/articles/10.3389/fmars.2019.00334/full#supplementary-material
References
Arkowitz, R., and Rommel, S. A. (1985). Force and bending moment of the caudal muscles in the shortfin pilot whale. Mar. Mamm. Sci. 1, 203–209. doi: 10.1111/j.1748-7692.1985.tb00009.x
Beentjes, M. P. (2006). Behavioral thermoregulation of the New Zealand sea lion (Phocarctos hookeri). Mar. Mammal Sci. 22, 311–325. doi: 10.1111/j.1748-7692.2006.00022.x
Bell, C. M., Hindell, M. A., and Burton, H. R. (1997). Estimation of body mass in the southern elephant seal, Mirounga leonina, by photogrammetry and morphometrics. Mar. Mammal Sci. 13, 669–682. doi: 10.1111/j.1748-7692.1997.tb00090.x
Blender Online Community (2016). Blender- a 3D Modelling and Rendering Package. Amsterdam: Blender Foundation.
Bloch, D., and Lockyer, C. (1993). Age and growth parameters of the long-finned pilot whale off of the Faroe Islands. Rep. Int. Whal. Commn. 14, 163–207.
Bose, N., Lien, J., and Ahia, J. (1990). Measurements of the bodies and flukes of several cetacean species. Proc. R. Soc. Lond. B. 242, 163–173. doi: 10.1098/rspb.1990.0120
Burke, A. C., Nelson, C. E., Morgan, B. A., and Tabin, C. (1995). Hox genes and the evolution of vertebrate axial morphology. Development 121, 333–346.
Burnett, J. D., Lemos, L., Barlow, D., Wing, M. G., Chandler, T., and Torres, L. G. (2018). Estimating morphometric attributes of baleen whales with photogrammetry from small UASs: a case study with blue and gray whales. Mar. Mammal Sci. 35, 108–139. doi: 10.1111/mms.12527
Castellini, M. A., and Calkins, D. G. (1993). Mass estimates using body morphology in steller sea lions. Mar. Mammal Sci. 9, 48–54. doi: 10.1111/j.1748-7692.1993.tb00425.x
Chiari, Y., Wang, B., Rushmeier, H., and Caccone, A. (2008). Using digital images to reconstruct three-dimensional biological forms: a new tool for morphological studies. Biol. J. Linnean Soc. 95, 425–436. doi: 10.1111/j.1095-8312.2008.01055.x
Christiansen, F., Dujon, A. M., Sprogis, K. R., Arnould, J. P. Y., and Bejder, L. (2016). Noninvasive unmanned aerial vehicle provides estimates of energetic cost of reproduction in humpback whales. Ecosphere 7:e01468. doi: 10.1002/ecs2.1468
Cooper, L. N., Sedano, N., Johansson, S., May, B., Brown, J. D., Holliday, C. M., et al. (2008). Hydrodynamic performance of the minke whale (Balaenoptera acutorostrata) flipper. J. Exp. Biol. 211, 1859–1867. doi: 10.1242/jeb.014134
Cornick, L. A., Quakenbush, L. T., Norman, S. A., Pasi, C., Maslyk, P., Burke, K. A., et al. (2016). Seasonal and developmental differences in blubber stores of beluga whales in Bristol Bay, Alaska using high-resolution ultrasound. J. Mammal. 97, 1238–1248. doi: 10.1093/jmammal/gyw074
Croll, D. A., Acevedo-Gutiérrez, A., Tershy, B. R., and Urbán-Ramírez, J. (2001). The diving behavior of blue and fin whales: is dive duration shorter than expected based on oxygen stores? Comp. Biochem. Physiol. A. Mol. Integr. Physiol. 129, 797–809. doi: 10.1016/s1095-6433(01)00348-8
Dunkin, R. C., McLellan, W. A., Blum, J. E. and Pabst, D. A. (2005). The ontogenetic changes in the thermal properties of blubber from Atlantic bottlenose dolphin Tursiops truncatus. J. Exp. Biol. 208, 1469–1480. doi: 10.1242/jeb.01559
Durban, J. W., Fearnbach, H., Barrett-Lennard, L. G., Perryman, W. L., and Leroi, D. J. (2015). Photogrammetry of killer whales using a small hexacopter launched at sea. J. Unmanned Veh. Syst. 3, 131–135. doi: 10.1139/juvs-2015-0020
Fahlke, J. M., and Hampe, O. (2015). Cranial symmetry in baleen whales (Cetacea, Mysticeti) and the occurrence of cranial asymmetry throughout cetacean evolution. Sci. Nat. 102:16. doi: 10.1007/s00114-015-1309-0
Feldkamp, S. D. (1987). Swimming in the California sea lion: morphometrics, drag and energetics. J. Exp. Biol. 131, 117–135.
Field, I. C., McMahon, C. R., Burton, H. R., Bradshaw, C. J. A., and Harrington, J. (2002). Effects of age, size and condition of elephant seals (Mirounga leonina) on their intravenous anaesthesia with tiletamine and zolazepam. Vet. Rec. 151, 235–240. doi: 10.1136/vr.151.8.235
Fish, F. E. (1996). Transitions from drag-based to lift-based propulsion in mammalian swimming. Integr. Comp. Biol. 36, 628–641. doi: 10.1093/icb/36.6.628
Fish, F. E. (1998). Comparative kinematics and hydrodynamics of odontocete cetaceans: morphological and ecological correlates with swimming performance. J. Exp. Biol. 201, 2867–2877.
Fish, F. E., Beneski, J. T., and Ketten, D. R. (2007). Examination of the three-dimensional geometry of cetacean flukes using computed tomography scans: hydrodynamic implications. Anat. Rec. 290, 614–623. doi: 10.1002/ar.20546
Foote, A. D., Newton, J., Piertney, S. B., Willerslev, E., and Gilbert, M. T. P. (2009). Ecological, morphological and genetic divergence of sympatric North Atlantic killer whale populations. Mol. Ecol. 18, 5207–5217. doi: 10.1111/j.1365-294x.2009.04407.x
Fullard, K. J., Early, G., Heide-Jørgensen, M. P., Bloch, D., Rosing-Asvid, A., and Amos, W. (2000). Population structure of long-finned pilot whales in the North Atlantic: a correlation with sea surface temperature? Mol. Ecol. 9, 949–958. doi: 10.1046/j.1365-294x.2000.00957.x
Gales, N. J., and Burton, H. R. (1987). Ultrasonic measurements of blubber thickness in the southern elephant seal, Mirounga leonina. Aust. J. Zool. 35, 2017–2217.
Goldbogen, J. A., Potvin, J., and Shadwick, R. E. (2010). Buccal cavity allometry increase mass-specific engulfment capacity in fin whales. Proc. R. Soc. Lond. B 277:1683. doi: 10.1098/rspb.2009.1680
Hamilton, J. H., Dillaman, R. D., McLellan, W. A., and Pabst, D. A. (2004). Structural fiber reinforcement of keel blubber in harbor porpoise (Phocoena phocoena). J. Morphol. 261, 105–117. doi: 10.1002/jmor.10232
Hayes, S. A., Josephson, E., Maze-Foley, K., and Rosel, P. E. (2017). US Atlantic and gulf of mexico marine mammal stock assessments-2016. NOAA 241:274.
Hohn, A. A., Rotstein, D. S., Harms, C. A., and Southall, B. L. (2006). Report on marine mammal unusual mortality event IMESE0501Sp: multispecies mass stranding of pilot whales (Globicephala macrorhynchus), minke whale (Balaenoptera acutorostrata), and dwarf sperm whales (Kogia sima) in North Carolina on 15-16 January 2005. NOAA 537:230.
Hunt, K. E., Moore, M. J., Rolland, R. M., Kellar, N. M., Hall, A. J., Kershaw, J., et al. (2013). Overcoming the challenges of studying conservation physiology in large whales: a review of available methods. Conserv. Physiol. 1:cot006. doi: 10.1093/conphys/cot006
Kasuya, T., and Marsh, H. (1984). Life history and reproductive biology of the short-finned pilot whale, Globicephala macrorhynchus, off the Pacific Coast of Japan. Rep. Int. Whal. Commn. 6, 259–310.
Kasuya, T., Miyashita, T., and Kasamtasu, F. (1988). Segregation of two forms of short-finned pilot whales off the Pacific coast of Japan. Sci. Rep. Whales Res. Inst. 39, 77–90.
Koopman, H. N., Pabst, D. A., McLellan, W. A., Dillaman, R. M., and Read, A. J. (2002). Changes in blubber distribution and morphology associated with starvation in the harbor porpoise (Phocoena phocoena): evidence for regional differences in blubber structure and function. Physiol. Biochem. Zool. 75, 498–512. doi: 10.1086/342799
Kooyman, G. L., Castellini, M. A., and Davis, R. W. (1981). Physiology of diving in marine mammals. Ann. Rev. Phsyiol. 43, 343–346.
Kvadsheim, P. H., Gotaas, A. R. L., Folklow, L. P., and Blix, A. S. (1997). An experimental validation of heat loss models for marine mammals. J. Theor. Biol. 184, 15–23. doi: 10.1006/jtbi.1996.0256
Lauder, G. V. (1990). Functional morphology and systematics: Studying functional patterns in an historical context. Anny. Rev. Syst. 21, 317–340. doi: 10.1146/annurev.ecolsys.21.1.317
Leatherwood, S., Caldwell, D. K., and Winn, H. E. (1976). Whales, Dolphins and Porpoises of the Western North Atlantic A guide to their identification. Seattle, WA: U.S. Deartment of Commerce,
Luque, S. P., and Aurioles-Gamboa, D. (2001). Sex differences in body size and body condition of California sea lion (Zalophus californianus) pups from the Gulf of California. Mar. Mammal Sci. 17, 147–160. doi: 10.1111/j.1748-7692.2001.tb00985.x
Mann, J. (1999). Behavioral sampling methods for cetaceans: a review and critique. Mar. Mammal Sci. 15, 102–122. doi: 10.1111/j.1748-7692.1999.tb00784.x
Marino, L., Murphy, T. L., Deweerd, A. L., Morris, J. A., Fobbs, A. J., Humblot, N., et al. (2001). Anatomy and three-dimensional reconstructions of the brain of the white whale (Delphinapterus leucas) from magnetic resonance images. Anat. Rec. 262, 429–439. doi: 10.1002/ar.1051
McKenna, M. F., Cranford, T. W., Berta, A., and Pyenson, N. D. (2012). Morphology of the odontocete melon and its implications for acoustic function. Mar. Mamm. Sci. 28, 690–713. doi: 10.1111/j.1748-7692.2011.00526.x
McKnight, P. E., and Najab, J. (2010). “Kruskal-Wallis test,” in The Corsini Encyclopedia of Psychology, eds I. B. Weiner and W. E. Craighead (Hoboken, NJ: John Wiley & Sons).
Noren, S. R., and Williams, T. M. (2000). Body size and skeletal muscle myoglobin of cetaceans: adaptations for maximizing dive duration. Comp. Biochem. Physiol. A. Mol. Integr. Physiol. 126, 181–191. doi: 10.1016/s1095-6433(00)00182-3
Norris, K. S. (1961). Standardized methods for measuring and recording data on smaller cetaceans. J. Mammal. 42, 471–476.
Nyga, A., Cheema, U., and Loizidou, M. (2011). 3D tumor models: novel in vitro approaches to cancer studies. Cell Commun. Signal. 5, 239–248. doi: 10.1007/s12079-011-0132-4
Olson, P. A. (2009). “Pilot whales in Globicephala melas and G. macrorhynchus,” in Encyclopedia of Marine Mammals, 2nd Edn, eds W. Perrin, B. Würsig, and J. G. M. Thewissen (Cambridge: Academic Press).
Parks, S. E., Ketten, D. R., O’Malley, J. T., and Arruda, J. (2007). Anatomical predictions of hearing in the North Atlantic right whale. Anat. Rec. 290, 734–744. doi: 10.1002/ar.20527
Peredo, C. M., Pyenson, N. D., Uhen, M. D., and Marshall, C. D. (2017). Alveoli, teeth, and tooth loss: Understanding the homology of internal mandibular structures in mysticete cetaceans. PLoS One 12:E0178243. doi: 10.1371/journal.pone.0178243
Pyenson, N. D., Goldbogen, J. A., and Shadwick, R. E. (2013). Mandible allometry in extant and fossil Balaenopteridae (Cetacea: Mammalia): the largest vertebrate skeletal element and its role in rorqual lunge feeding. Biol. J. Linn. Soc. 108, 586–599. doi: 10.1111/j.1095-8312.2012.02032.x
Rabosky, D. L., Santini, F., Eastman, J., Smith, S. A., Sidlauskas, B., Chang, J., et al. (2013). Rates of speciation and morphological evolution are correlated across the largest vertebrate radiation. Nat. Commun. 4:1958. doi: 10.1038/ncomms2958
Ryg, M., Smith, T. G., and Øritsland, N. A. (1988). Thermal significance of the topographical distribution of blubber in ringed seals (Phoca hipsida). Can. J. Fish. Aquat. Sci. 45, 985–992. doi: 10.1139/f88-121
Schmidt-Nielsen, K. (1997). Animal Physiology, Adaptation and Environment. Cambridge: Cambridge University Press.
Segre, P. S., Cade, D. E., Fish, F. E., Potvin, J., Allen, A. N., Calambokidis, J., et al. (2016). Hydrodynamic properties of fin whale flippers predict maximum rolling performance. J. Exp. Biol. 219, 3315–3320. doi: 10.1242/jeb.137091
Shero, M. R., Pearson, L. E., Costa, D. P., and Burns, J. M. (2014). Improving the precision of our ecosystem calipers: a modified morphometric technique for estimating marine mammal mass and body composition. PLoS One 9:e91233. doi: 10.1371/journal.pone
Stelle, L. L., Blanke, R. W., and Trites, A. W. (2000). Hydrodynamic drag in steller sea Lions (Eumetopias jubatus). J. Exp. Biol. 205, 1915–1923.
Thote, T., Lin, A. S. P., Raji, Y., Moran, S., Stevens, H. Y., Hart, M., et al. (2013). Localized 3D analysis of cartilage composition and morphology in small animal models of joint degeneration. Osteoarthr. Cartil. 21, 1132–1141. doi: 10.1016/j.joca.2013.05.018
Uhen, M. D. (2007). Evolution of marine mammals: back to the sea after 300 million years. Anat. Rec. 290, 514–522. doi: 10.1002/ar.20545
van de Kamp, T., dos Santos Rolo, T., Vagovič, P., Baumbach, T., and Riedel, A. (2014). Three-dimensional reconstructions come to life- 3d pdf animations in functional morphology. PLoS One 9:e102355. doi: 10.1371/journal.pone.0102355
Velten, B. P., Dillaman, R. M., Kinsey, S. T., McLellan, W. A., and Pabst, D. A. (2013). Novel locomotor muscle design in extreme deep-diving whales. J. Exp. Biol. 216, 1862–1871. doi: 10.1242/jeb.081323
Watts, P., Hansen, S., and Lavigne, D. M. (1993). Models of heat loss by marine mammals: thermoregulation below the zone of irrelevance. J. Theor. Biol. 163, 505–525. doi: 10.1006/jtbi.1993.1135
Williams, T. M. (1999). The evolution of cost efficient swimming in marine mammals: limits to energetic optimization. Phil. Trans. R. Soc. Lond. B. 354, 193–201. doi: 10.1098/rstb.1999.0371
Witmer, L. M., Ridgely, R. C., Dufeau, D. L., and Semones, M. C. (2008). “Using CT to peer into the past: 3D visualization of the brain and ear regions of birds, crocodiles, and nonavian dinosaurs,” in Anatomical Imaging, eds H. Endo and R. Frey (Tokyo: Springer).
Woodward, B. L., Winn, J. P., and Fish, F. E. (2006). Morphological specializations of baleen whales associated with hydrodynamic performance and ecological niche. J. Morphol. 267, 1284–1294. doi: 10.1002/jmor.10474
Woolson, R. F. (1998). “Wilcoxon signed rank test,” in Encyclopedia of Biostatistics, eds P. Armitage and T. Colton (Hoboken, NJ: John Wiley & Sons), 4739–4740.
Keywords: animal morphology, 3D modeling, Blender, marine mammal, SA:V, pilot whale
Citation: Adamczak SK, Pabst A, McLellan WA and Thorne LH (2019) Using 3D Models to Improve Estimates of Marine Mammal Size and External Morphology. Front. Mar. Sci. 6:334. doi: 10.3389/fmars.2019.00334
Received: 29 November 2018; Accepted: 31 May 2019;
Published: 19 June 2019.
Edited by:
Lars Bejder, University of Hawaiʻi at Mānoa, United StatesReviewed by:
David W. Johnston, Duke University, United StatesManuel Gonzalez-Rivero, Australian Institute of Marine Science (AIMS), Australia
Copyright © 2019 Adamczak, Pabst, McLellan and Thorne. This is an open-access article distributed under the terms of the Creative Commons Attribution License (CC BY). The use, distribution or reproduction in other forums is permitted, provided the original author(s) and the copyright owner(s) are credited and that the original publication in this journal is cited, in accordance with accepted academic practice. No use, distribution or reproduction is permitted which does not comply with these terms.
*Correspondence: S. K. Adamczak, c3RlcGguYWRhbWN6YWtAZ21haWwuY29t; c2FkYW1jemFAdWNzYy5lZHU=