 Gretta T. Pecl1,2*
 Jemina Stuart-Smith1Peter Walsh1
 Dianne J. Bray3Martha Kusetic4Michael Burgess5
 Stewart D. Frusher1,2Daniel C. Gledhill6Oliver George7Gary Jackson8John Keane1
 Victoria Y. Martin9
 Melissa Nursey-Bray10Andrew Pender1
 Lucy M. Robinson11,12,13Keith Rowling14
 Marcus Sheaves4Natalie Moltschaniwskyj15,16
- 1Institute for Marine and Antarctic Studies, University of Tasmania, Hobart, TAS, Australia
- 2Centre for Marine Socioecology, Hobart, TAS, Australia
- 3Museum Victoria, Melbourne, VIC, Australia
- 4James Cook University, Townsville, QLD, Australia
- 5Fishcare Victoria Inc., Bairnsdale, VIC, Australia
- 6Division of Water and Marine Resources, Department of Primary Industries, Parks, Water and Environment, Hobart, TAS, Australia
- 7Condense Pty Ltd., Hobart, TAS, Australia
- 8Department of Primary Industries and Regional Development, Government of Western Australia, North Beach, WA, Australia
- 9Cornell Lab of Ornithology, Cornell University, Ithaca, NY, United States
- 10Geography, Environment and Population, The University of Adelaide, Adelaide, SA, Australia
- 11Oceans Institute, The University of Western Australia, Perth, WA, Australia
- 12Oceans Graduate School, The University of Western Australia, Perth, WA, Australia
- 13SIRO Oceans and Atmosphere, Crawley, WA, Australia
- 14PIRSA Fisheries and Aquaculture, Adelaide, SA, Australia
- 15Department of Primary Industries, Government of New South Wales, Sydney, NSW, Australia
- 16School of Environmental and Life Sciences, The University of Newcastle, Callaghan, NSW, Australia
Citizen science includes a suite of research approaches that involves participation by citizens, who are not usually trained scientists, in scientific projects. Citizen science projects have the capacity to record observations of species with high precision and accuracy, offering the potential for collection of biological data to support a diversity of research investigations. Moreover, via the involvement of project participants, these projects have the potential to engage the public on scientific issues and to possibly contribute to changes in community knowledge, attitudes and behaviors. However, there are considerable challenges in ensuring that large-scale collection and verification of species data by the untrained public is a robust and useful long-term endeavor, and that project participants are indeed engaged and acquiring knowledge. Here, we describe approaches taken to overcome challenges in creation and maintenance of a website-based national citizen science initiative where fishers, divers, and other coastal users submit opportunistic photographic observations of ‘out-of-range’ species. The Range Extension Database and Mapping Project (Redmap Australia) has two objectives, (1) ecological monitoring for the early detection of species that may be extending their geographic distribution due to environmental change, and (2) engaging the public on the ecological impacts of climate change, using the public’s own data. Semi-automated ‘managed crowd-sourcing’ of an Australia-wide network of scientists with taxonomic expertise is used to verify every photographic observation. This unique system is supported by efficient workflows that ensures the rigor of data submitted. Moreover, ease of involvement for participants and prompt personal feedback has contributed to generating and maintaining ongoing interest. The design of Redmap Australia allows co-creation of knowledge with the community – without participants requiring formal training – providing an opportunity to engage sectors of the community that may not necessarily be willing to undergo training or otherwise be formally involved or engaged in citizen science. Given that capturing changes in our natural environment requires many observations spread over time and space, identifying factors and processes that support large-scale citizen science monitoring projects is increasingly critical.
Introduction
Interest in natural history citizen science projects has proliferated in recent years, with the majority of projects aiming to explore a wide variety of biological and ecological issues (Silvertown, 2009). Citizen science data have been particularly useful for documenting poleward changes in distribution (‘range shifts’) for numerous taxa across the world, providing some of the strongest evidence that species are responding to recent climate change (Parmesan and Yohe, 2003). Although citizen science is not a new concept, research involving public participation has also flourished in recent years (Silvertown, 2009; Theobald et al., 2015), including in marine systems (Thiel et al., 2014). Citizen science projects aimed at ecological monitoring can be classified along a spectrum (Shirk et al., 2012) from programs that have a small number of highly trained contributors (e.g., Reef Life Survey1), where the data obtained can be as accurate as that from professional scientifically trained observers (Edgar and Stuart-Smith, 2009), through to those with a comparatively larger number of contributors, but with (generally) little or no training (e.g., Project Noah2). Projects operating at a larger scale and without extensive formal training of contributors are often criticized about the scientific credibility of observations submitted. Use of these datasets by scientists and resource managers may be hindered by a perception they are of lesser quality compared to those collected by scientists (Bird et al., 2014). The challenge is to create and maintain a successful citizen science project that facilitates long-term, large-scale, and robust data collection (Bonney et al., 2009), ensures motivated and satisfied project participants (Wald et al., 2016), and creatively engages the broader public with dialogue on potentially confronting issues (Martin, 2017), like climate change.
In common with many regions around the world, monitoring for changes in the distribution of marine species along Australia’s 60,000 km of coastline is an ongoing challenge, particularly given significant funding constraints (Tulloch et al., 2013), and the often limited baseline data available (Gledhill et al., 2015). The urgency of collecting data on climate-driven shifts in species distributions may be diminished given variable public acceptance of climate change (Leviston et al., 2013), and poor acknowledgment of climate impacts within some marine industries (Nursey-Bray et al., 2012). This is despite Australian marine waters warming at a rate of at least two times the global average along the northern half of the country, three times the global average in the south–west and nearly four times in the south–east (Hobday and Pecl, 2014). This has been associated with extensive biological changes documented throughout marine ecosystems that are consistent with those expected under climate change (e.g., Poloczanska et al., 2007; Pecl et al., 2017, 2019). However, Australia has several million marine resource users, for example indigenous and commercial fishers, and recreational users such as divers, fishers, and beachcombers (Gledhill et al., 2015), that regularly participate in coastal activities and could provide observations of their environment.
Redmap Australia (the Range Extension Database and Mapping Project3) is a citizen science Project inviting members of the Australian public to submit photographs and associated data about unusual observations of marine species made while undertaking activities like fishing, diving, boating, and beachcombing. The project started in the Island state of Tasmania in 2009, before expanding nationally across Australia at the end of 2012. Redmap has two linked and equally important aims, (1) ecological monitoring to provide an early indication of potential range shifts, and (2) actively engaging the broader community on issues regarding marine climate change, largely using their own data. At a global scale, quantitative assessments of ‘out-of-range’ marine species observations show that these are strongly associated with longer-term climatic features (García Molinos et al., 2015), i.e., they are not merely random observations of ‘vagrant’ individuals (Fogarty et al., 2017). Repeated or consistent out-of-range observations of individuals, in regions not previously observed, therefore likely represent the ‘arrival’ stage of range-shifting species into a new or extended area of their range (Bates et al., 2014). Thus, out-of-range observations of species may provide an early indication of impending range shifts (aim 1 above and see Figure 1).
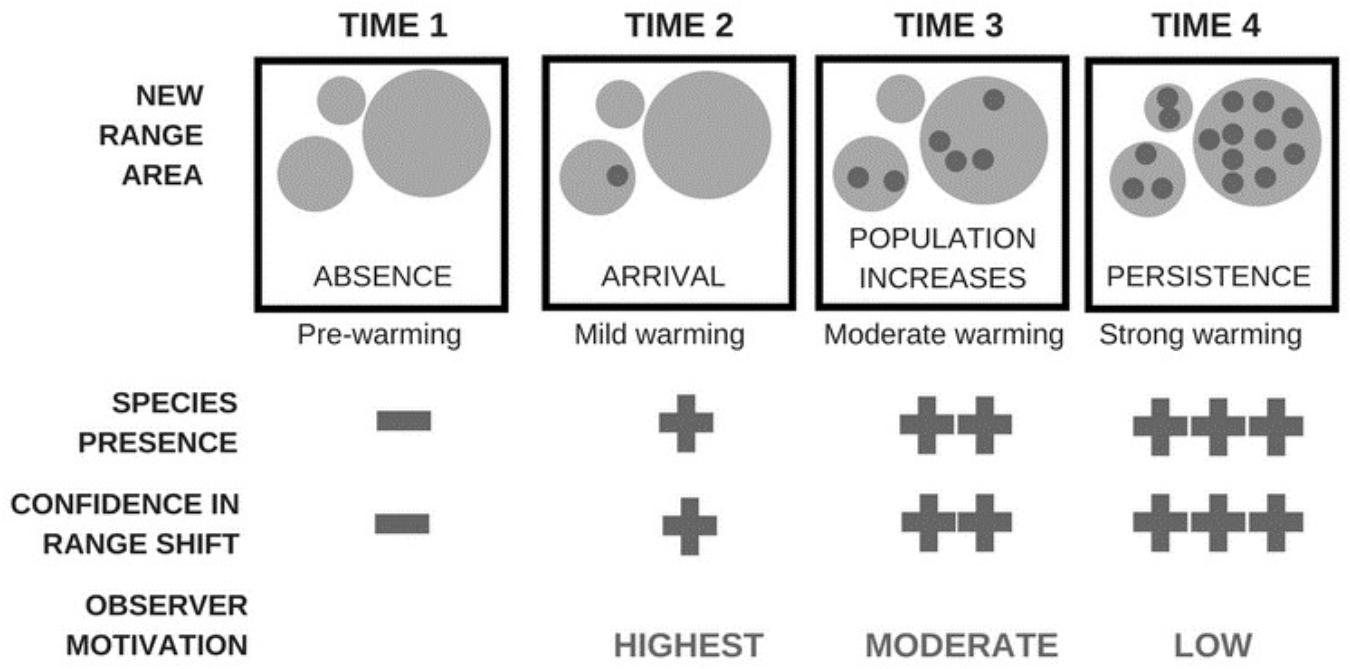
Figure 1. The stages of a species geographic range extension, with gray circles representing possible suitable habitats and black circles individuals of a given species (adapted from Bates et al., 2014). Out-of-range observations are associated with longer-term climatic features (Fogarty et al., 2017), i.e., they likely represent the ‘arrival’ stage of a range extension and it is these individuals that the Redmap project is designed to detect. When species presence is low at a given location, citizen scientists are motivated to report species occurrences, however, this motivation declines after it becomes more widely known and accepted that a species now occurs in a particular area. Confidence that a range shift has occurred increases over time, as individuals of a species persist and continue to be recorded within a given region.
Here, we share some of the key challenges faced, and corresponding solutions implemented, in establishing, operating, and maintaining a national scale citizen science project with the objective of documenting observations of potential range-shifting marine species along the Australian coastline (Figure 2). Our aim is to share with other practitioners of citizen science our experiences and lessons learned. We articulate how we developed a project that was (1) feasible over large-scales involving multiple institutes, and could potentially operate at relatively small cost and time investment, yet still (2) achieved robust observational data that could be used with confidence by scientists and resource managers. The system also needed to be (3) flexible so the project can adapt over time. Lastly, we needed (4) creative methods for engaging with a large and geographically dispersed community of potential citizen scientists. This description of our approach to achieving the collection of credible species data, based on relatively rare observations and from a (potentially) untrained public, and in successfully engaging the public on a confronting issue like climate change, may be useful in other citizen science or research contexts.
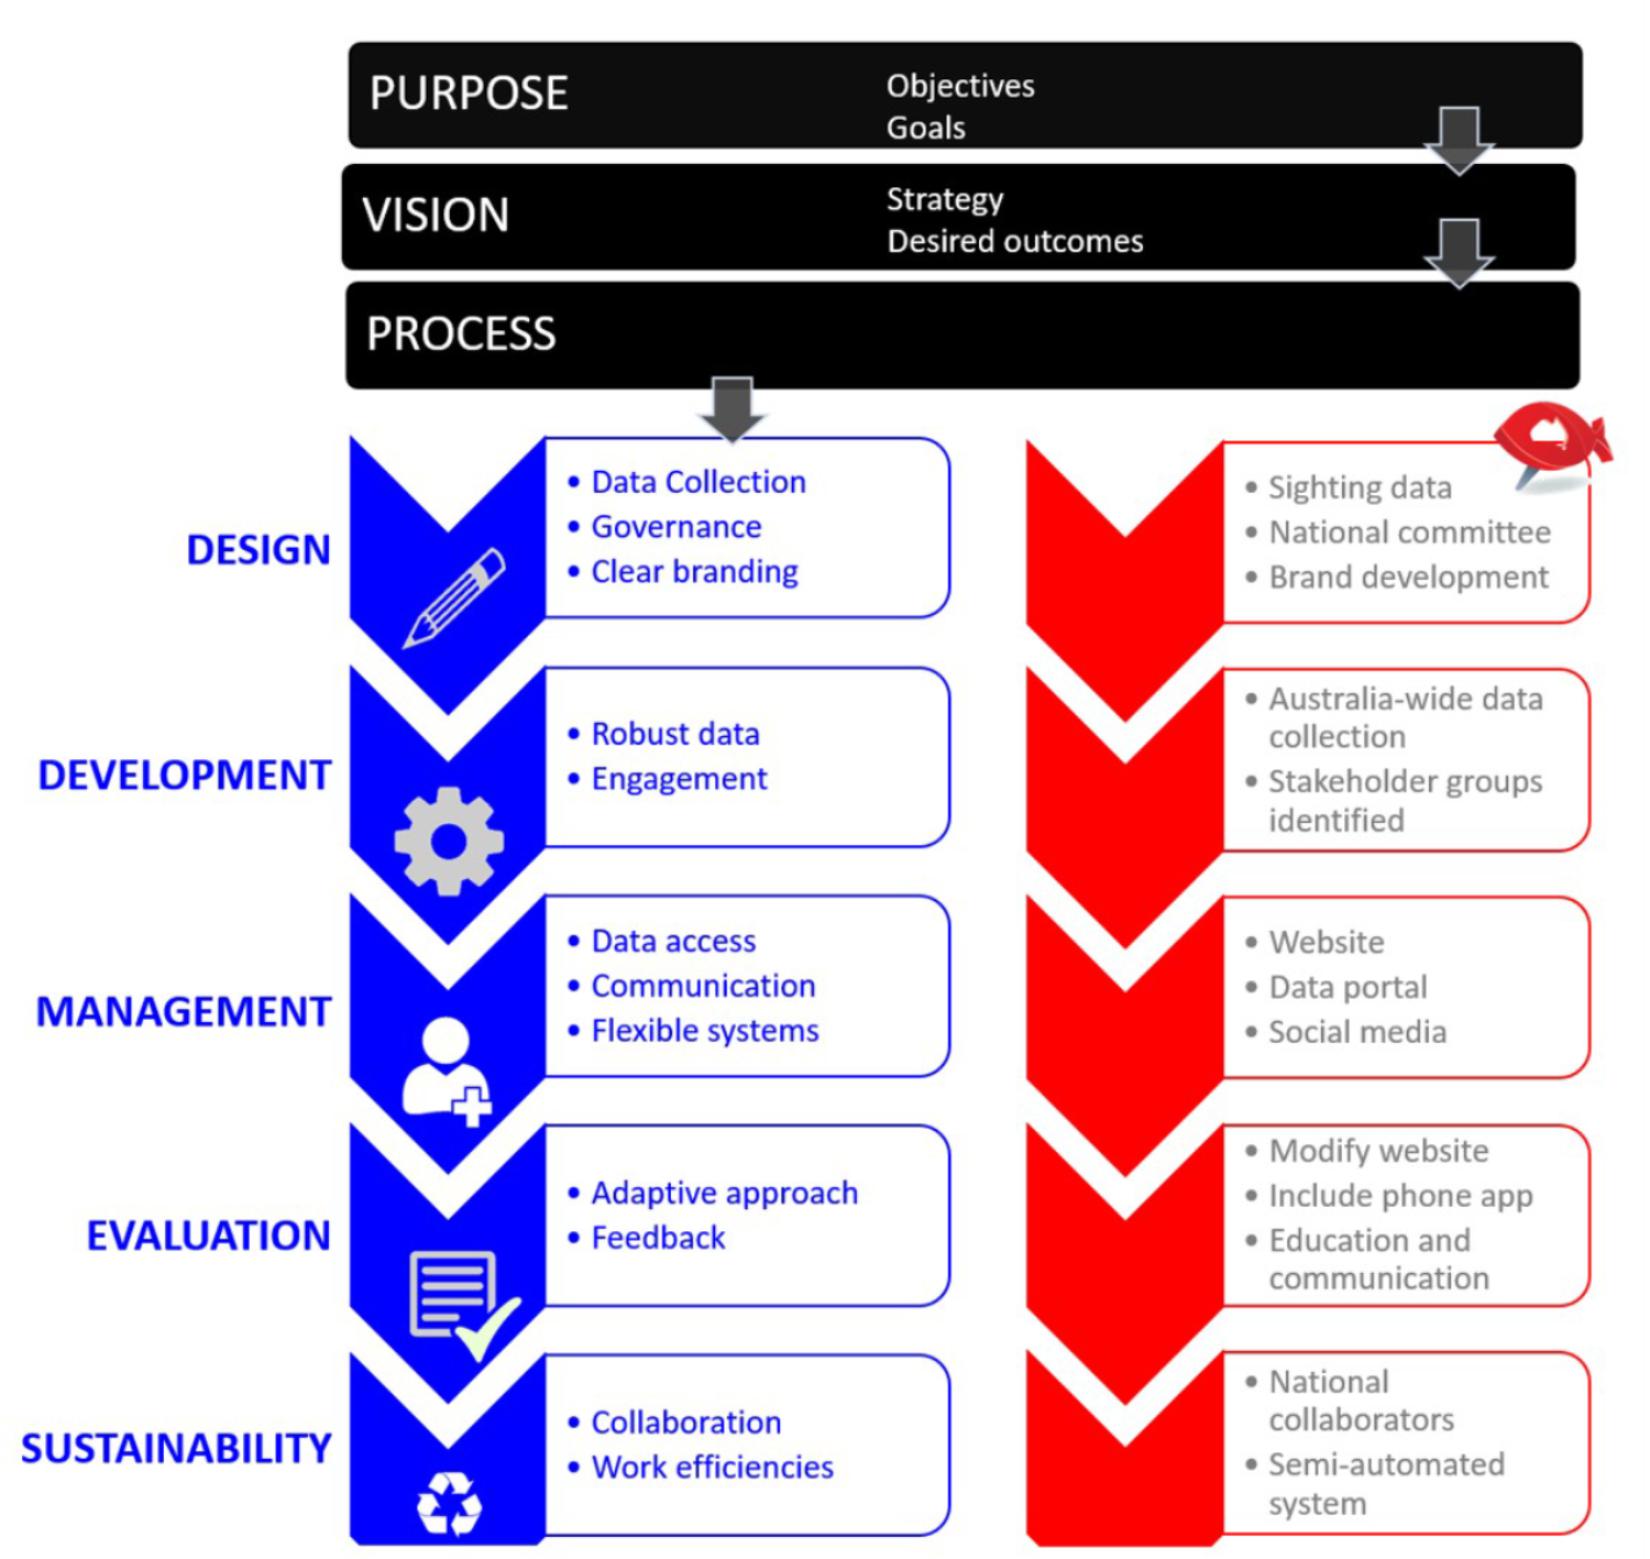
Figure 2. The objectives and goals of Redmap have determined the project strategy and the desired outcomes, which in turn have defined the approaches taken (right in red) to address the key challenges associated with development and maintenance of Redmap as a successful large-scale long-term citizen science project (left in blue).
Materials and Methods
Redmap’s citizen scientists can use region-specific lists of ‘target’ or ‘listed’ species (i.e., species that may be extending their distribution into ‘new’ areas) available on the website, or smartphone application (available at Google Play and iTunes), to help identify which species may be unusual to their particular area before logging an observation. However, contributors can also submit photographs of any species they consider unusual for their area (referred to as ‘other’ species). Photographs of observations are sent to members of a panel of 80 expert scientists from 26 institutions across the country to verify species identification. After verification, observations are displayed on the website4 and the contributor is sent individual feedback via a system-generated, but personalisable and editable, email (sent by the verifying scientist through the verification system) (see section “Ensuring Robust ‘Out-of-Range’ Observational Data” and Supplementary Table S1).
The Redmap model was designed to provide a framework for efficiently collecting, collating, verifying, sharing and using geo-referenced species observational data. It was critical that ‘opportunistic’ participation in the project was easy by (potentially) untrained members of the public, whilst rigorous, standardized, and transparent post hoc verification of submitted observations was still achieved. Australian marine users have expressed a strong preference to participate in data collection more than any other role in marine research (Martin et al., 2016a), designing projects, establishing project goals or interpreting results for example, making a ‘contributory’ citizen science project (Roy et al., 2012) a good match to the public’s interest in marine data collection.
Implementing a Large-Scale Low-Cost Collaborative Project
The collection and processing of species observational data at the national scale presented several challenges including:
(a) Governance of the project in a multi-jurisdictional environment.
(b) Timely management of observations submitted by the public.
(c) Maximizing efficiency and minimizing operational costs under financially constrained circumstances.
(d) Identifying target species and managing information for species from across a large geographic area.
Operation of the project at a national scale required the cooperation of regional organizations who could work locally to lead and promote the project and provide local resources for species selection (see section “Ensuring Robust ‘Out-of-Range’ Observational Data”) and identification. Governance is based on a distributed ownership but centrally managed model. A lead organization in each state is responsible for promoting the project and is assigned ownership of all regional data. A governance model was agreed upon among all participating organizations that included:
(a) Establishing a National Steering Committee to oversee and direct the project.
(b) Developing a memorandum of understanding among the multiple organizations, in particular to deal with governance of data.
(c) Establishing committees to support the two main objectives of Redmap – the Science and Data Advisory Panel and the Community Engagement Advisory Panel.
(d) Appointing the role of National Co-ordinator, supported by Regional Administrators in each jurisdiction.
Ensuring Robust ‘Out-of-Range’ Observational Data
Region administrators worked with marine biogeography experts and community members to develop a list of target species (i.e., species that may be extending their distribution into ‘new’ areas), highlighted on the website and smartphone application. The initial species lists were collated by a range of marine users in each region including scientists, resource managers, fishers, and divers, who all agreed on proposed species as ones they had not seen previously in each respective area. We then used this information in combination with peer-reviewed literature, species observation databases and museum-based checks on species distributions to have some level of certainty of what the known (historical) distribution was. Redmap species ranges were then formally defined using multiple reference sources for each species (at least three for each species) using published literature and online resources (see Stuart-Smith, 2017). In addition to having a well-defined distribution, species selection was also contingent on a number of factors including the ability to easily identify the species from an image only (i.e., with no easily confused similar species) and being easily observable (i.e., not cryptic or camouflaged).
A distributed automatic system was designed to workflow the sightings to the appropriate administrator and allow ‘managed crowdsourcing’ of scientists for data verification and processing (see Figure 3). The system can define any number of regions (defined by state or territory) and an administrator is assigned to manage each region. For data verification, scientists are assigned to each species in the database, according to taxonomic or ecological expertise. A single species can have multiple scientists assigned, allowing for situations when a scientist may not be available or does not respond in a timely manner. Additionally, the location of the observation provided by the user is automatically compared to the known and pre-defined distribution for a species and scientists may nominate to only receive observations that are determined to be ‘out of range.’ If scientists nominate to only receive out-of-range observations, in most regions, in-range observations are checked by an administrator, and then displayed on the web site. The system also allows for submission of observations of non-listed species deemed by a member of the public to be potentially “unusual”; these are not automatically assigned to scientists for verification and are instead assigned to the Regional Administrator before being reassigned to scientists with appropriate taxonomic expertise.
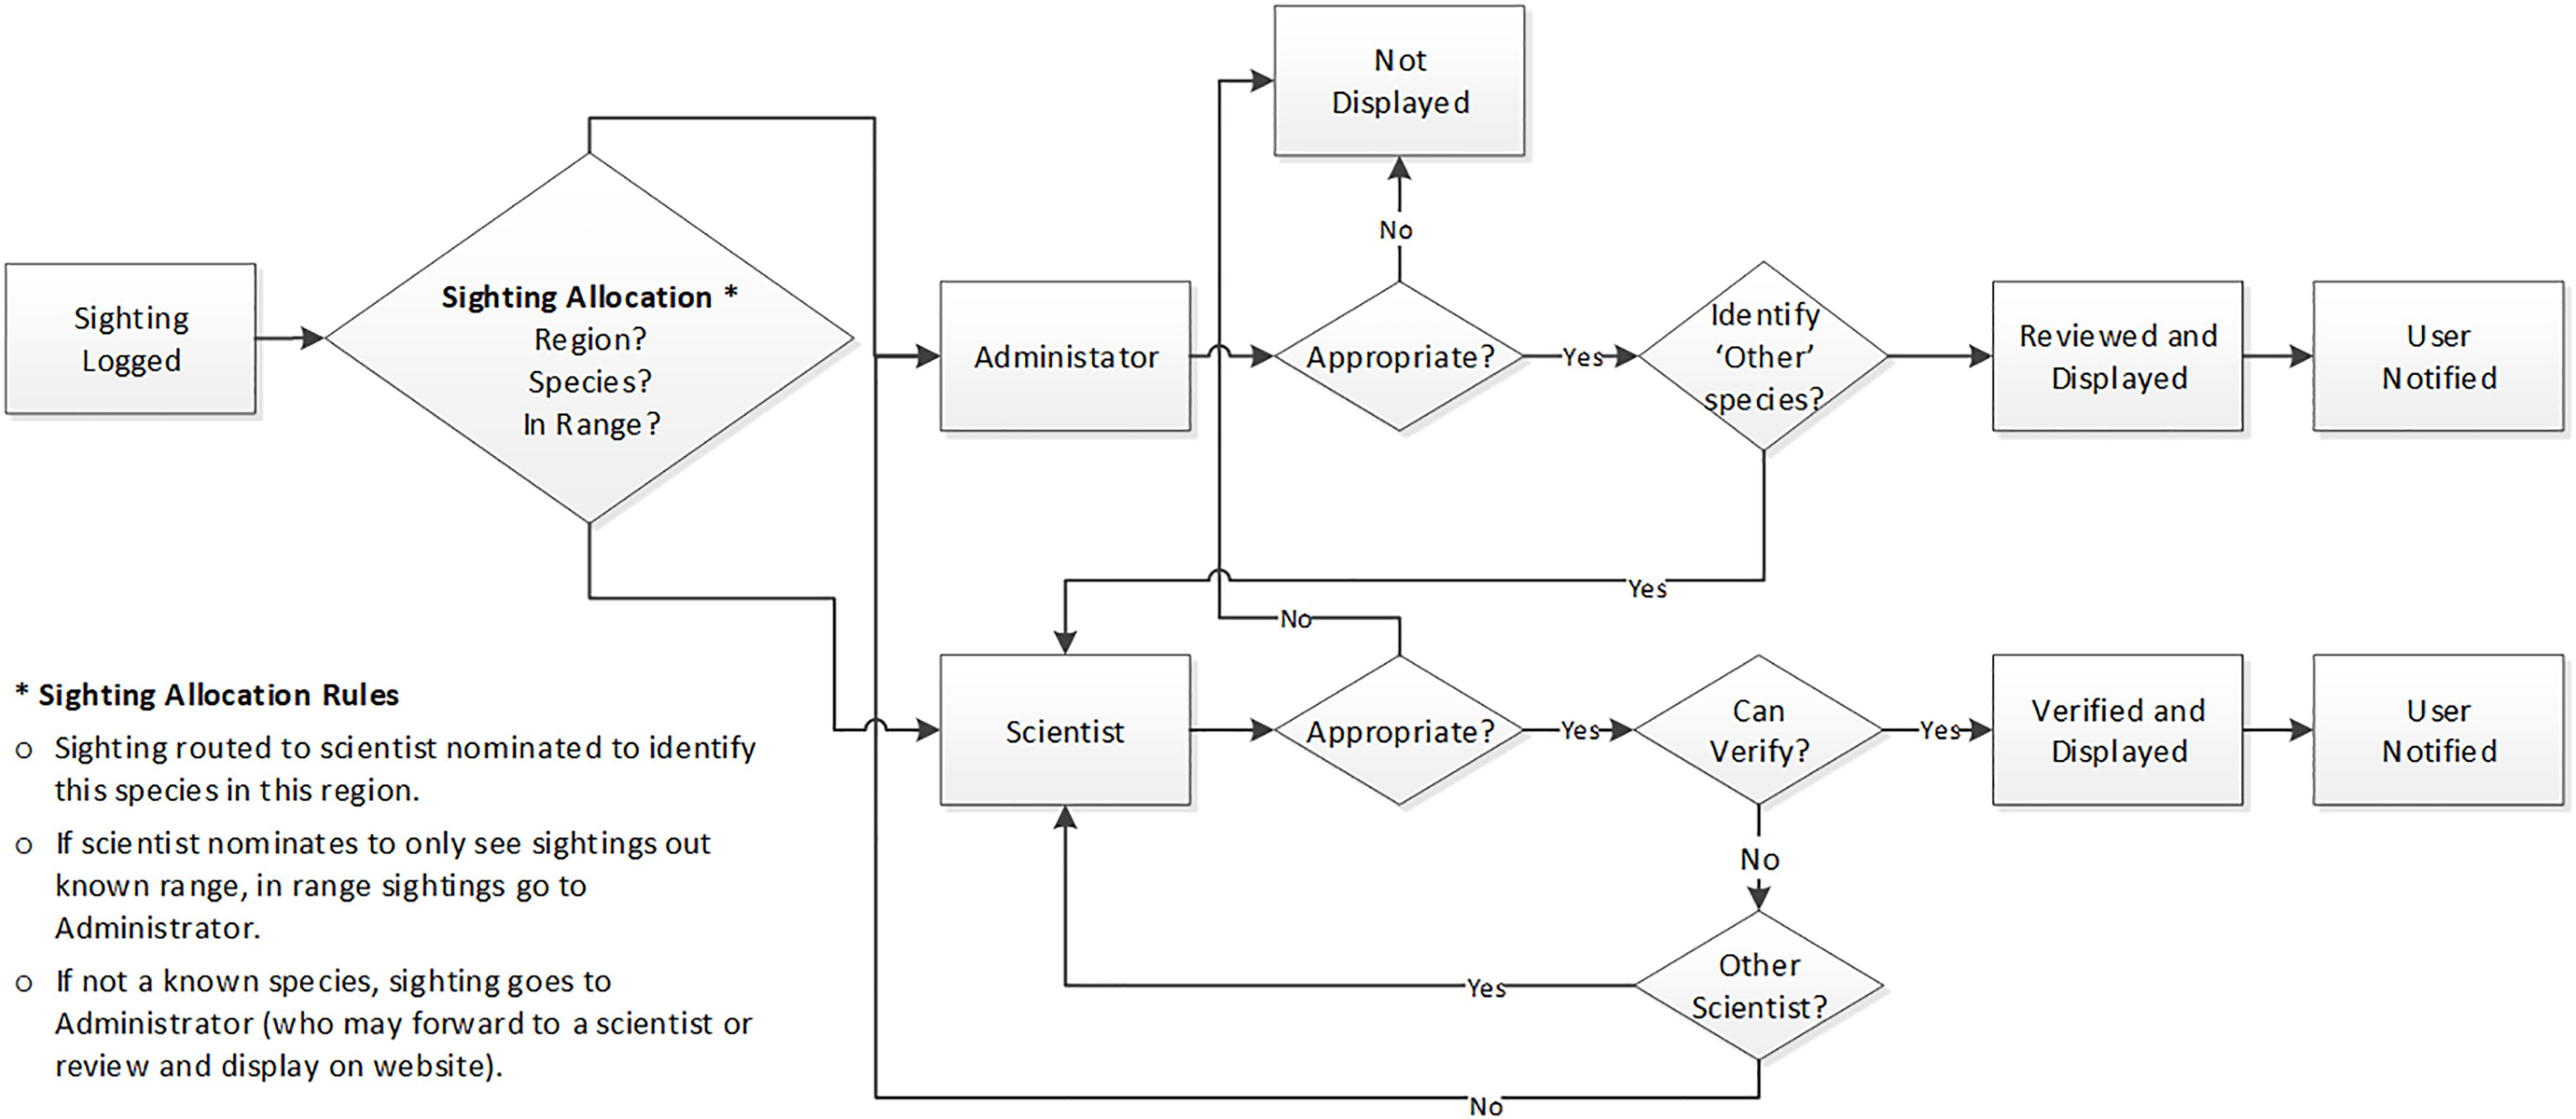
Figure 3. Overview of the management workflow for observations submitted for the Redmap website and database verification system, including feedback provided to the contributor, and the flexible ‘sighting allocation’ process that is key to the semi-automated observation verification system.
Contributors submit photographs through web forms or smartphone applications and an automated workflow sends an email to the assigned scientist. The email contains a link to the Redmap website where the scientist can verify the observation based on a predetermined set of conditions (Supplementary Table S1), ensuring a uniform method is used to verify observations. This system increases efficiency by minimizing data handling time for individual observations and distributing the workload across multiple scientists. The observation data flows through a series of mostly automated steps (Figure 3) whereby condition matrices or manual input by scientists or regional administrators dictate the outcome of an observation.
Flexible Systems for an Adaptive Approach
While smaller and shorter term (<3 years) citizen science projects are often successful due to the full–time efforts of a small group of individuals, projects that have longer (>5 years) and larger scale ambitions need to be adaptive in relation to operational and structural aspects. The Redmap online platform was designed for flexibility and easy upscaling or downscaling where required, enabling more species or verification scientists as needed to be added to the system (see Figure 3). Presently 220 species are listed and approximately 80 verifying scientists, however, there is no limit to the number of species or scientists that could be accommodated by the platform. The system can also accept additional regions, countries, or habitats (e.g., freshwater or terrestrial). A centralized species database allows multiple regions to have the same species identified on their regional site for logging without replicating content.
Engaging Effectively With a Large and Geographically Dispersed Community
Since its inception as a pilot project in the state of Tasmania in late 2009 (and expanding nationally in late 2012), Redmap has placed equal weight on the dual goals of ecological monitoring for early detection of potentially range shifting species and engagement and communication with the community about marine climate change. Communication strategies were designed to incorporate elements of dialogue and participation to ensure effective and best practice science engagement (Groffman et al., 2010). Dialogue occurs through interaction of the citizen scientist with the verifying scientist via email, regular interactions with the Redmap project via the website and social media (Facebook page, Twitter and Instagram), and through participation in regional events and presentations to public and community groups. The tone of the Redmap message plays an important role in public image, and strives for a balance between providing scientific facts, asking for assistance, and acknowledging the value added by contributors. Additionally, Redmap team members regularly participate in fishing competitions and dive club trips, and give presentations at club meetings or public events. These activities not only allow targeted promotion of the project but also facilitate close ties between the scientists and the broader community enabling one-on-one discussion.
Respecting Citizen Scientists as Data Owners
An essential element of securing ongoing community engagement in an online program such as Redmap, is being clear on whether and how data will be made publicly available, and to what extent it will comply with the principle of ‘freely available’ (Zapico, 2013). Although many ocean users are forthcoming and prepared to share information, some may resist providing location details of their favorite fishing or dive spots (Bannon, 2016). Such concerns impact the willingness of people to participate and contribute data; Redmap respects contributors’ need for confidentiality and gives participants control and discretion to select a range of spatial scales to record their observation. Additionally, although data are displayed on the website immediately after verification, Redmap data are embargoed from direct bulk download providing exact reported latitude and longitude for 3 years. Similarly, the quality and accessibility of underwater photography equipment has aided the proliferation of amateur and semi-professional underwater photographers, and some photographers may be concerned about loss of ownership of their photograph. When submitting an observation, the contributors’ permission is sought to use the photograph on the web site and only for promotional not-for-profit purposes.
Feedback to Contributors and the Wider Community
Redmap provides instantaneous feedback to everyone who logs an observation, in the form of a thank-you email which informs them about the next step in the verification process (Figure 3). Group-level feedback to contributors and the broader community is provided through messages celebrating the latest observations, or the group’s achievements (e.g., total observations, or other records), via social and online media, as well through a digital newsletter and at public presentations. Redmap’s website was designed specifically to provide information in a dynamic way with minimal input by the project administrators. The home page is a continuously updated platform which automatically displays the most recent observations. Verified observations are loaded onto an interactive map of Australia, so site visitors can see who has logged the most recent observations and where.
Results
Robust Observational Data to Provide an Indication of Potential Range Shifts
In a relatively short time for an ecological monitoring project, Redmap has delivered on the project’s scientific and engagement objectives. To date, 2,078 observations have been submitted by 784 citizen scientists and verified by 59 scientists (Figure 4). Given the project is very specifically and only interested in ‘out-of-range’ or unusual observations, and relies on participants identifying that a given species occurrence is unusual, this is a significant and unique data contribution. Redmap is after ‘outliers,’ not all or any species observed, such as in a survey. It is only the ‘arrival’ stage of potential range-shifters that the project is interested in (Figure 1), as an early indication of which species are potentially shifting distribution (Fogarty et al., 2017), or responding to anomalous events like marine heatwaves.
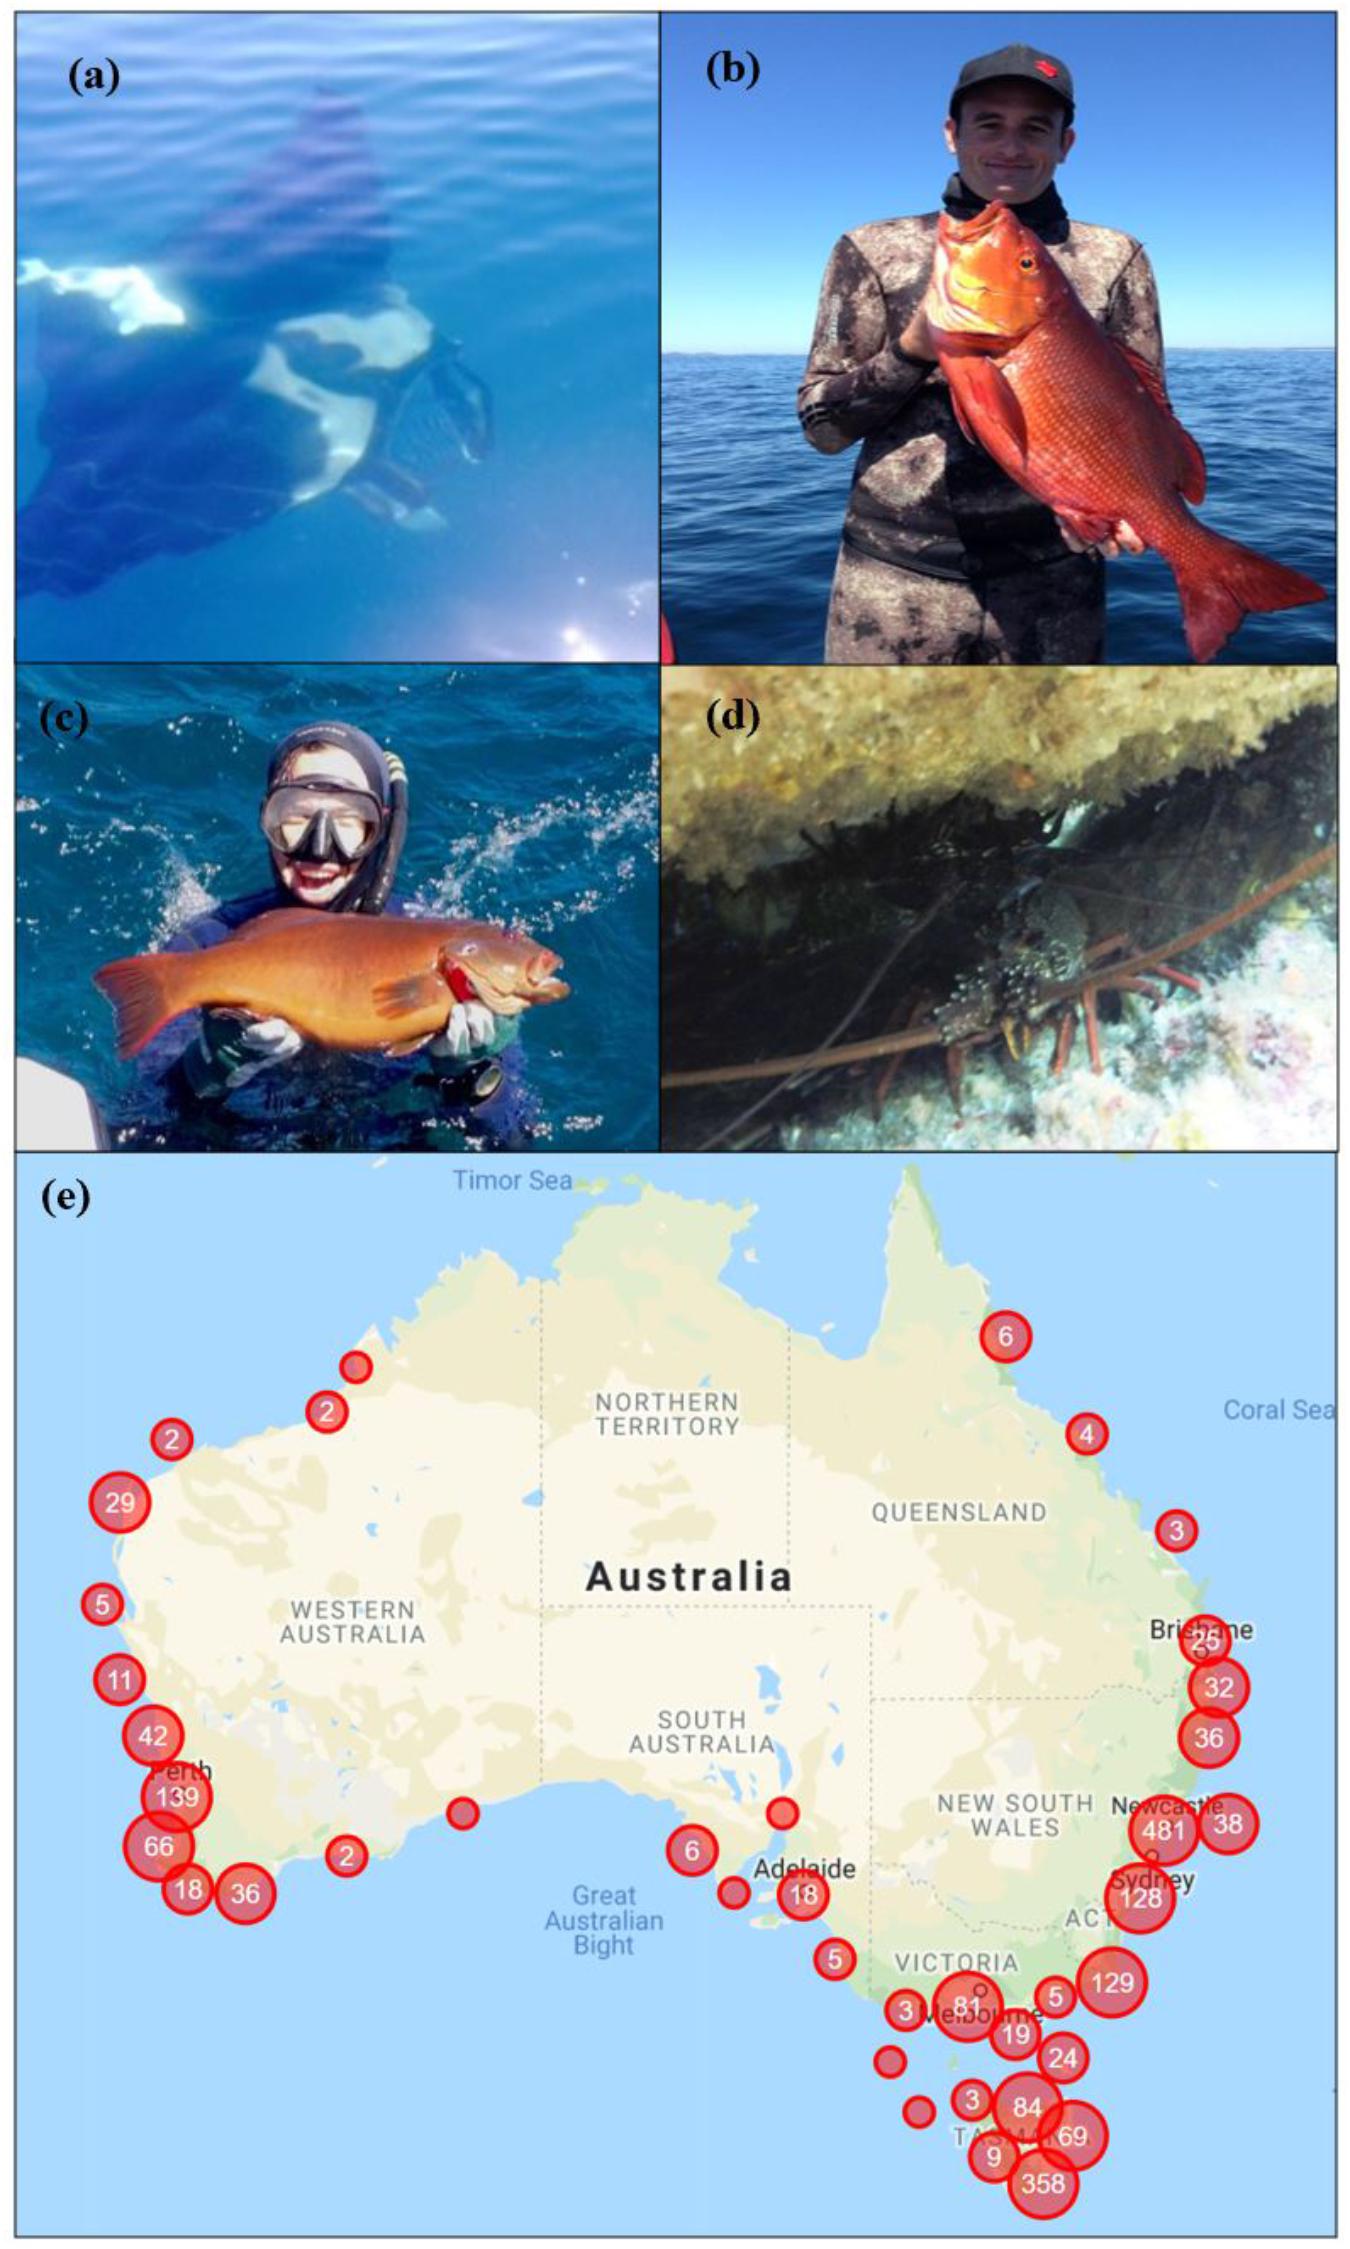
Figure 4. Observations of species reported outside of their known range by Redmap contributors: (a) Manta ray, Manta birostris, reported in north–east Tasmania (www.redmap.org.au/sightings/1191/) by Leo Miller. This is thought to be Australia’s southernmost observation of the species, with the next most southerly observation just south of Sydney (Couturier et al., 2015, Photograph: Leo Miller). (b) Red bass, Lutjanus bohar, caught off Newcastle NSW (www.redmap.org.au/ sightings/1628/). In Australia this species in known to occur in Western Australia, and on the east coast from the Great Barrier Reef to southern Queensland (Photograph: Kylie Johnston). (c) Coral trout, Plectropomus leopardus, caught off Sydney (www.redmap.org.au/sightings/1624/). In Australia its distribution occurs from north-western Western Australia, around the north of Australia to the southern end of the Great Barrier Reef, in Queensland on the east coast (Photograph: Derrick Oscar Cruz). (d) A den of eastern rock lobster, Sagmariasus verreauxi, photographed at St Helens off eastern Tasmania (www.redmap.org.au/region/tas/ sightings/1238/). This species is more common to New South Wales but is observed or captured occasionally along the north coast of Tasmania in small numbers. Larvae are thought to be delivered into Tasmanian waters via the East Australian Current (Photograph: John Keane). (e) Locations of observations submitted to Redmap by citizen scientists over the duration of the program. Numbers within the red circles indicate the number of discrete observations submitted for that area. People depicted within the images gave their written informed consent for the photographs to be included.
Among the scientific deliverables, the Redmap team developed a qualitative rapid assessment tool to classify levels of confidence (i.e., high, medium and low) in records of potential range extension for Redmap-listed species in Tasmania (Robinson et al., 2015). The assessment built on methods used in the early detection of invasive species using two systematic and transparent qualitative decision trees to determine both the confidence with which we could define the historical range boundary for each species and the strength of evidence for a species being consistently detected out-of-range, considering mobility, detectability and temporal and seasonal consistency of observations. Combining the outputs of both decision trees allowed designation of the ‘confidence’ in a potential range extension of each species, providing evidence of poleward range extensions beyond previously reported range boundaries for multiple species of fish and invertebrates (Robinson et al., 2015). In consultation with many of the fishers and divers that submitted observations to Redmap, this assessment was drafted and published as a ‘report card’ for public community dissemination of the project results5 and as a journal article for the scientific community (Robinson et al., 2015). Similar assessments are now being conducted for other parts of the eastern and western Australian coastline.
Redmap has made small, but influential, data contributions to a number of studies (Johnson et al., 2011; Last et al., 2011; Madin et al., 2012; Grove and Finn, 2014; Ramos et al., 2014, 2015; Couturier et al., 2015; Stuart-Smith et al., 2016). These works, together with the Robinson et al. (2015) study, have been instrumental in developing a strong understanding of species and ecosystem changes occurring in south–east Australia, one of the regions which is warming in the top 10% for rate of warming globally (Hobday and Pecl, 2014). Frequently reported ‘out-of-range’ species in Tasmania include zebrafish (Girella zebra), yellowtail kingfish (Seriola lalandi), white-ear (Parma microlepis), herring cale (Olisthops cyanomelas), luderick (Girella tricuspidata), old wife (Enoplosus armatus), and snapper (Pagrus auratus), many of which have been recorded over multiple years, in cooler winter months, and at a variety of life stages. Juveniles of potential range-extending species recorded in colder months are particularly important as they indicate the prospect of species being able to survive throughout the year, increasing their likelihood of reaching adulthood, reproducing, and establishing a population (Figure 1; Bates et al., 2014). The eastern rock lobster Sagmariasus verreauxi (Figure 4) is to date the most logged species on Redmap with “high” confidence of potentially being a range extending species (Robinson et al., 2015). Although this species has been recorded intermittently in Tasmanian waters over several decades, Redmap has now documented large groups (35+ individuals) of adults and sub-adults farther polewards of their accepted range.
Redmap observations have also triggered focused studies on particular species, providing an indication of where limited resources for research could be constructively directed. For example, after out-of-range observations of Octopus tetricus were reported to Redmap, the project team made enquiries revealing that this species was now 13% of a local octopus fishery in a suspected ‘new’ part of its distribution. Subsequent research clearly demonstrated that this species was now present consistently throughout the year (Ramos et al., 2014), was reproductively viable at the new range edge (Ramos et al., 2015) and also provided strong genetic evidence to support a rapid and recent range extension (Ramos Castillejos, 2015). Lastly, many of the sightings submitted to Redmap that are not designated as technically ‘out-of-range’ have been valuable for improving our knowledge of the distribution of poorly known or rare species, and Redmap has contributed species distribution data to the Australian Faunal Directory6.
Engaging the Broader Marine Community Using Their Own Data
In addition to effective engagement being one of the projects key goals, it was also essential for reaching and retaining the geographically dispersed and large audience that may potentially recognize and observe the rare occurrence of an out-of-range species. Our target audiences use a variety of information sources regarding the marine environment, like Facebook, other internet sources, government agencies and face-to-face communication (Martin et al., 2016a), and so it is critical that we use a range of avenues for communication. Direct feedback from a scientist is considered the most important element in the Redmap/contributor relationship (Martin et al., 2016a). Our citizen scientists receive immediate email acknowledgment after submitting an observation, followed by the second stage of observer feedback usually within a week of the observation being logged (i.e., species confirmation by verifying scientist, Figure 5). Our formal project evaluation suggested that this one-on-one dialogue between scientists and observers helped observers build trust in the project, and makes the participants feel valued and that their contribution is important (Nursey-Bray et al., 2017).
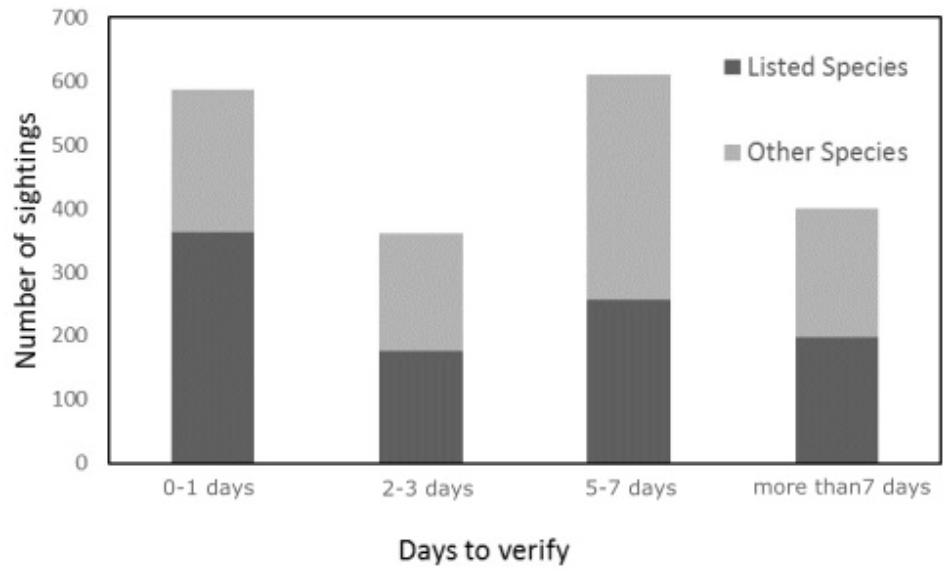
Figure 5. Number of days taken to verify species identification after an observation is submitted to Redmap Australia via the website or smartphone app. Note, ‘other species’ are species not ‘listed’ as Redmap species, and therefore do not have existing database links directly to expert scientists, instead being directed to experts manually via the regional administrator.
In terms of broader communication, distributed ownership in the project helps ensure wide reach within the community, and this, combined with centralized oversight, achieves a uniform approach in branding and economies of scale where possible. Redmap reaches a large audience – the Redmap Facebook page has >9,400 followers reaching upwards of 50,000 people each month. The website has had >1,000,000 web page downloads with visits from >180 countries, and there has been at least 260 media or outreach articles, and over 165 events or presentations related to the project. The electronic newsletter is sent 2–4 times a year, depending on funding, and reaches 3,000 direct subscribers. The science and communication efforts of the project team have been recognized with a suite of regional, national and international awards and nominations (Supplementary Table S2).
Two studies have specifically evaluated the effectiveness of the communication and engagement efforts of the Redmap project (Bannon, 2016; Nursey-Bray et al., 2017). People interacting with Redmap reported that they had learnt about potential range extensions, fish species and distributions, and insights into the relevance of having accurate species information incorporated into policy decisions. Almost half of survey respondents felt they had learnt new information, and 97% of people indicated they trusted the data and information emerging from Redmap (Nursey-Bray et al., 2017). Detailed face-to-face interviews with marine resource users, where Redmap was not mentioned a priori to interviewees, strongly suggest that Redmap has been very effective in building awareness and understanding of marine climate change in the community (Bannon, 2016).
Discussion
Citizen science programs have diverse objectives, however, delivering authentic and robust scientific outcomes is a common objective (Tulloch et al., 2013). Moreover, the long-term activity of many citizen science projects requires meeting both scientific and engagement objectives to ensure on-going support from funding bodies and host institutions, as well as continuing participation from the contributing scientists and citizen scientists.
Many biodiversity-based citizen science programs involve recording non-target species over broad geographic regions to address a variety of a posteriori research questions (Dickinson et al., 2010). In contrast, Redmap data are collected with a priori specific mechanism-driven predictions in mind. In this case the hypothesis-driven objective is the early detection of poleward shifts of species, and the project has been successful in that regard, contributing extensively to our understanding of the changes in the distributions of many species, including fishes, crustaceans, and molluscs, occurring along parts of the Australian coastline. Redmap is analogous to monitoring programs implemented to detect invasive species that have clearly demonstrated the value of engaging citizens for assessing and responding to large-scale and time-sensitive conservation problems (Scyphers et al., 2014). However, although citizen science programs with greater spatial coverage are useful for biodiversity research (Tulloch et al., 2013; Theobald et al., 2015), there are significant challenges in developing and maintaining such programs over both large temporal and spatial scales.
One of the most influential factors allowing implementation of the project has been increased access and use of wireless technologies in the community (Silvertown, 2009). Within the Redmap project, integration of the website, smartphone application, and social media (Facebook, Instagram, and Twitter) have been instrumental in maximizing reach, streamlining workloads and processes, and allowing collaborators to work together. The website supports collaborative relationships by allowing separate webpages for each region (with news stories, relevant articles, and region-specific observations) all controlled by the lead organization in each region. This capability (and flexibility) allows for different interests among regions to be accommodated within the project as a whole as well as addressing the need to identify key demographic groups and tailor the user experience accordingly. One of the challenges and costs of using websites and apps is the continual changes in the platforms, as developers update software this cascades in updates to websites and apps that require money and time to manage. For projects to maintain a presence over many years requires allocation of funds and planning to maintain a presence.
Despite the significant rewards associated with large-scale collaborations, the potential challenges and costs need to be taken into consideration when forming these projects and the associated networks. Elements that need to be considered are sourcing appropriate people and ensuring that time and funds are made available to establish and maintain the collaboration. This time and effort allows collaborators to discuss and mitigate risks associated with brand dilution, consistency in agreed project objectives, data ownership, legal obligations, and dealing with unforeseen sensitive issues. Major challenges for large-scale citizen science programs like Redmap include needing to secure ongoing funding so that the ecological value of data increases over time, ideally over several decades (Theobald et al., 2015). However, the expectations of funders or host organizations is for clear scientific or community outcomes after 1–3 years of investment, which requires both short and long-term goals to be identified in the project, increasing the engagement of funding bodies and supporters. Use of data in scientific publications or policy action maintains interest and retention of contributors, as volunteers perceive their efforts are leading to something of value (Thiel et al., 2014; Martin et al., 2016b).
Semi-automated workflows for scientific verification of observations are critical mechanisms that allow Redmap to continue functioning when funding reductions preclude project staffing, but the project is also able to implement several other mechanisms to help with this. This includes the ability to archive observations of non-listed ‘other’ species that require manual processing by a regional administrator (for later processing) and the current development of a “Redmap Champions” package to train volunteer citizen scientists in promotional roles across the country, such as staffing educational booths at public events, drafting articles for online newsletters or presenting talks on the project to various fishing or diving clubs. This package outlines the goals and key messages, project sensitivities, and observation instruction guidelines. Engaging volunteers to act as ‘champions’ satisfies the interests of many marine users who are keen to communicate citizen science findings (Martin et al., 2016a) and will allow continuation of project promotion and on-ground activities (such as presentations), in the light of potential periods of restricted funding.
The educational resources developed and provided by the Redmap project on the website are a valuable part of engaging the whole community about the environment and the impacts of climate change. These resources generate a sense of community ownership of the project with Redmap community members producing articles, delivering presentations on the project and its outputs, and assisting greatly with dissemination of Redmap project materials. Whilst Redmap is primarily a ‘contributory’ citizen science project (Roy et al., 2012), it includes elements of a ‘collaborative’ model where members of the public not only contribute data, but also inform the way in which the questions are addressed and disseminate findings (Roy et al., 2012). For example, members of the fishing and diving communities were actively involved in the selection of species being monitored, and in the design, testing and production of various aspects of the website, smartphone application and major communication outputs like the ‘Redmap Tasmania Report Card’7.
For Redmap, community knowledge is embedded in the contributors through their observations of “something different” or more specifically the observation of something uncommon or new. For scientists, this knowledge fits into a system associated with a changing climate and the possible polewards range extension of species. The knowledge exchange provides the basis for observation and explanation, answering people’s questions about particular species whilst highlighting to the users that their observation is useful and they are making a valued contribution to science. In this way, Redmap presents participants with a valuable opportunity to interact with scientists directly – an important design consideration for improving the relationship between science and society (National Academies of Sciences, Engineering, and Medicine., 2017).
Only half of marine citizen science projects include quality control to ensure the collection of a robust dataset that can be defended (Thiel et al., 2014), despite this being critically important to the credibility of the data (Ratnieks et al., 2016). Consequently, a challenge to citizen science projects in general is the acceptance of volunteer-collected data by the scientific and resource management communities (Dickinson et al., 2010) Building on early and significant successes from bird-based citizen science endeavors (Silvertown, 2009), the recent surge in high quality research papers using citizen-science data (e.g., Stuart-Smith et al., 2013) and development of statistical options available for handling common biases (e.g., Bird et al., 2014) have paved the way to making volunteer data more accepted by the scientific community.
Key to Redmap’s success has been the rapid verification and archiving of every photographic observation submitted to Redmap only made tractable by the ‘managed crowd-sourcing’ of taxonomic experts across the country. This semi-automated process significantly reduces contributor error in species identification, and importantly allows submission of data from (potentially) untrained participants. Moreover, the easy and opportunistic involvement of participants, irrespective of training or knowledge, in combination with our data verification processes, highly efficient workflows, and quality detailed personal feedback to contributors, has laid the foundation for a large scale monitoring project that has already produced tangible outputs and established a legacy that will maximize the longevity of a project that will be increasingly critical as changes in the marine environment due to climate change escalate.
Author Contributions
GP conceived the idea for Redmap Australia and designed the methodology primarily with JS-S, PW, OG, GJ, and NM with contributions from a broader group. GP led writing of the manuscript which included contributions from all authors. All authors contributed critically to the drafts and gave final approval for publication.
Funding
Funding for Redmap Tasmania was initially through the Tasmanian Community Fund; subsequent funding has included Inspiring Australia, Australian National Data Service, Fishwise, Department of Agriculture Fisheries and Forestry, Climate Connect, ARC, Western Australia Department of Fisheries, and IMAS at the University of Tasmania. GP was supported by an ARC Future Fellowship.
Conflict of Interest Statement
OG was employed by Ionata at the time of study but has since moved to Condense Pty Ltd.
The remaining authors declare that the research was conducted in the absence of any commercial or financial relationships that could be construed as a potential conflict of interest.
Acknowledgments
We thank the Australian fishers, divers, beachcombers, and boaters who have contributed valuable data and knowledge to Redmap, the scientific team for contributing timely “in-kind” support to verify observations, and many different supportive community and industry groups.
Supplementary Material
The Supplementary Material for this article can be found online at: https://www.frontiersin.org/articles/10.3389/fmars.2019.00349/full#supplementary-material
Footnotes
- ^ www.reeflifesurvey.com
- ^ www.projectnoah.org
- ^ www.redmap.org.au
- ^ http://www.redmap.org.au/sightings/
- ^ www.redmap.org.au/article/the-redmap-tasmania-report-card/
- ^ http://www.environment.gov.au/science/abrs/online-resources/fauna
- ^ www.redmap.org.au/article/the-redmap-tasmania-report-card/
References
Bannon, S. (2016). Citizen Science in a Marine Climate Change Hotspot: A case study on Redmap in Eastern Tasmania. Honours thesis, Hobart, TAS: University of Tasmania.
Bates, A. E., Pecl, G. T., Frusher, S., Hobday, A. J., Wernberg, T., Smale, D. A., et al. (2014). Evaluating pathways of geographic range extensions and contractions. Global Environ. Chang. 26, 27–38.
Bird, T., Bates, A. E., Lefcheck, J. S., Hill, N. A., Thomson, R. J., Edgar, G. J., et al. (2014). Statistical solutions for error and bias in global citizen science datasets. Biol. Conserv. 173, 144–154. doi: 10.1016/j.biocon.2013.07.037
Bonney, R., Cooper, C. B., Dickinson, J., Kelling, S., Phillips, T., Rosenberg, K. V., et al. (2009). Citizen science: a developing tool for expanding science knowledge and scientific literacy. BioScience 59, 977–984. doi: 10.1525/bio.2009.59.11.9
Couturier, L. I. E., Jaine, F. R. A., and Kashiwagi, T. (2015). First photographic records of the giant manta ray Manta birostris off eastern Australia. PeerJ. 3:e742. doi: 10.7717/peerj.742
Dickinson, J. L., Zuckerberg, B., and Bonter, D. N. (2010). Citizen science as an ecological research tool: challenges and benefits. Annu. Rev. Ecol. Evol. Syst. 41, 149–172. doi: 10.1146/annurev-ecolsys-102209-144636
Edgar, G. J., and Stuart-Smith, R. D. (2009). Ecological effects of marine protected areas on rocky reef communities; a continental-scale analysis. Mar. Ecol. Prog. Ser. 388, 51–62. doi: 10.3354/meps08149
Fogarty, H., Burrows, M., Pecl, G. T., Robinson, L. M., and Poloczanska, E. S. (2017). Are fish outside their usual ranges early indicators of climate-driven range shifts? Glob. Chang. Biol. 23, 2047–2057. doi: 10.1111/gcb.13635
García Molinos, J., Halpern, B. S., Schoeman, D. S., Brown, C. J., Kiessling, W., Moore, P. J., et al. (2015). Climate velocity and the future global redistribution of marine biodiversity. Nat. Clim. Change 6, 83–88. doi: 10.1038/NCLIMATE2769
Gledhill, D. C., Hobday, A. J., Welch, D. J., Sutton, S. G., Lansdell, M. J., Koopman, M., et al. (2015). Collaborative approaches to accessing and utilising historical citizen science data: a case-study with spearfishers from eastern Australia. Mar. Freshwater Res. 66, 195–201. doi: 10.1071/MF14071
Groffman, P. M., Stylinski, C., Nisbet, M. C., Duarte, C. M., Jordan, R., Burgin, A., et al. (2010). Restarting the conversation: challenges at the interface between ecology and society. Front. Ecol. Environ. 8, 284–291. doi: 10.1890/090160
Grove, S., and Finn, J. (2014). Unusual strandings of greater argonaut Argonauta argo in southeast Tasmania, Autumn. The Malacological Society of Australasia 151, 1–4.
Hobday, A. J., and Pecl, G. T. (2014). Identification of global marine hotspots: sentinels for change and vanguards for adaptation action. Rev. Fish Biol. Fisher. 24, 415–425. doi: 10.1007/s11160-013-9326-6
Johnson, C. R., Banks, S. C., Barrett, N. S., Cazassus, F., Dunstan, P. K., Edgar, G. J., et al. (2011). Climate change cascades: shifts in oceanography, species’ ranges and subtidal marine community dynamics in eastern Tasmania. J. Exp. Mar. Bio. Ecol. 400, 17–32. doi: 10.1016/j.jembe.2011.02.032
Last, P. R., White, W. T., Gledhill, D. C., Hobday, A. J., Brown, R., Edgar, G. J., et al. (2011). Long-term shifts in abundance and distribution of a temperate fish fauna: a response to climate change and fishing practices. Glob. Ecol. Biogeogr. 20, 58–72. doi: 10.1111/j.1466-8238.2010.00575.x
Leviston, Z., Walker, I., and Morwinski, S. (2013). Your opinion on climate change might not be as common as you think. Nat. Clim. Change 3, 334–337. doi: 10.1038/NCLIMATE1743
Madin, E. M. P., Ban, N. C., Doubleday, Z. A., Holmes, T. H., Pecl, G. T., and Smith, F. (2012). Socio-economic and management implications of range-shifting species in marine systems. Global Environ. Chang. 22, 137–146. doi: 10.1016/j.gloenvcha.2011.10.008
Martin, V. Y. (2017). Citizen science as a means for increasing public engagement in science: presumption or possibility? Sci. Commun. 39:2. doi: 10.1177/1075547017696165
Martin, V. Y., Christidis, L., Lloyd, D. J., and Pecl, G. (2016a). Understanding drivers, barriers and communication channels for public participation in marine citizen science. J. Sci. Commun. 15:02. doi: 10.22323/2.15020202
Martin, V. Y., Christidis, L., and Pecl, G. T. (2016b). Public Interest in Marine Citizen Science: is there potential for growth? BioScience 66, 683–692. doi: 10.1093/biosci/biw070
National Academies of Sciences, Engineering, and Medicine. (2017). Communicating Science Effectively: A Research Agenda. Washington, DC: The National Academies Press.
Nursey-Bray, M., Palmer, R., and Pecl, G. (2017). Spot, log, map: assessing a marine virtual citizen science program against Reed’s best practice for stakeholder participation in environmental management. Ocean Coast. Manage 151, 1–9. doi: 10.1016/j.ocecoaman.2017.10.031
Nursey-Bray, M., Pecl, G., Frusher, S., Gardner, C., Haward, M., Hobday, A., et al. (2012). Communicating climate change: climate change risk perceptions and rock lobster fishers, Tasmania. Mar. Pol. 36, 753–759. doi: 10.1016/j.marpol.2011.10.015
Parmesan, C., and Yohe, G. (2003). A globally coherent fingerprint of climate change impacts across natural systems. Nature 421, 37–42. doi: 10.1038/nature01286
Pecl, G. T., Araújo, M. B., Bell, J. D., Blanchard, J., Bonebrake, T. C., Chen, I. C., et al. (2017). Biodiversity redistribution under climate change: impacts on ecosystems and human well-being. Science 355:6332. doi: 10.1126/science.aai9214
Pecl, G. T., Ogier, E., Jennings, S., van Putten, I., Crawford, C., Fogarty, H., et al. (2019). Autonomous adaptation to climate-driven change in marine biodiversity in a global marine hotspot. Ambio doi: 10.1007/s13280-019-01186-x [Epub ahead of print].
Poloczanska, E. S., Babcock, R. C., Butler, A., Hobday, A. J., Hoegh-Guldberg, O., Kunz, T. J., et al. (2007). Climate change and Australian marine life. Oceanogr. Mar. Biol. 45, 407–478. doi: 10.1201/9781420050943
Ramos, J., Pecl, G. T., Moltschaniwskyj, N. A., Strugnell, J. M., León, R. I., and Semmens, J. M. (2014). Body size, growth and life span of the range extending Octopus tetricus: implications for establishment in south-eastern Australia. PLoS One 9:e103480. doi: 10.1371/journal.pone.0103480
Ramos, J., Pecl, G. T., Semmens, J. M., Strugnell, J. M., León, R. I., and Moltschaniwskyj, N. A. (2015). Reproductive capacity of a marine species (Octopus tetricus) within a recent range extension area. Mar. Freshwater Res. 66, 999–1008. doi: 10.1071/MF14126
Ramos Castillejos, J. E. (2015). Life-history and population dynamics of the range extending Octopus tetricus (Gould, 1852) in South-Eastern Australia. PhD thesis, Hobart, TAS: University of Tasmania.
Ratnieks, F. L. W., Schrell, F., Sheppard, R. C., Brown, E., Bristow, O. E., and Garbuzov, M. (2016). Data reliability in citizen science: learning curve and the effects of training method, volunteer background and experience on identification accuracy of insects visiting ivy flowers. Methods Ecol. Evol. 7, 1226–1235. doi: 10.1111/2041-210X.12581
Robinson, L. M., Gledhill, D. C., Moltschaniwskyj, N. A., Hobday, A. J., Frusher, S. D., Barrett, N., et al. (2015). Rapid assessment of an ocean warming hotspot reveals “high” confidence in potential species’ range extensions. Global Environ. Chang. 31, 28–37. doi: 10.1016/j.gloenvcha.2014.12.003
Roy, H. E., Pocock, M. J., Preston, C. D., Roy, D. B., Savage, J., Tweddle, J. C., et al. (2012). Understanding Citizen Science & Environmental Monitoring. Final Report on behalf of UK-EOF. Wallingford: NERC Centre for Ecology & Hydrology.
Scyphers, S. B., Powers, S. P., Akins, J. L., Drymon, J. M., Martin, C. W., Schobernd, Z. B., et al. (2014). The role of citizens in detecting and responding to a rapid marine invasion. Conserv. Lett. 8, 242–250. doi: 10.1111/conl.12127
Shirk, J. L., Ballard, H. L., Wilderman, C. C., Phillips, T., Wiggins, A., Jordan, R., et al. (2012). Public Participation in Scientific Research: a framework for deliberate design. Ecol. Soc. 17:29. doi: 10.5751/ES-04705-170229
Silvertown, J. (2009). A new dawn for citizen science. Trends Ecol. Evol. 24, 467–471. doi: 10.1016/j.tree.2009.03.017
Stuart-Smith, J. (2017). Redmap List of Distribution References. Available at: http://www.redmap.org.au/assets/media/uploads/2014/01/20/LIST%20of%20REFERENCES_Redmap%20Distrib.pdf (accessed November 7, 2017).
Stuart-Smith, J., Pecl, G. T., Pender, A., Tracey, S., Villanueva, C., and Smith-Vaniz, W. F. (2016). Southernmost records of two Seriola species in an Australian ocean warming hotspot. Mar. Biodivers. 48, 1579–1582. doi: 10.1007/s12526-016-0580-4
Stuart-Smith, R. D., Bates, A. E., Lefcheck, J. S., Duffy, J. E., Baker, S. C., Thomson, R. J., et al. (2013). Integrating abundance and functional traits reveals new global hotspots of fish diversity. Nature 50, 539–542. doi: 10.1038/nature12529
Theobald, E. J., Ettinger, A. K., Burgess, H. K., DeBey, L. B., Schmidt, N. R., Froehlich, H. E., et al. (2015). Global change and local solutions: tapping the unrealized potential of citizen science for biodiversity research. Biol. Cons. 181, 236–244. doi: 10.1016/j.biocon.2014.10.021
Thiel, M., Penna-Díaz, M. A., Luna-Jorquera, G., Salas, S., Sellanes, J., and Stotz, W. (2014). “Citizen scientists and marine research: volunteer participants, their contributions, and projection for the Future,” in Oceanography and Marine Biology: An Annual Review, eds R. N. Hughes, D. J. Hughes, and I. P. Smith (Boca Raton, FL: CRC Press), 257–314. doi: 10.1201/b17143-6
Tulloch, A. I. T., Possingham, H. P., Joseph, L. N., Szabo, J., and Martin, T. G. (2013). Realising the full potential of citizen science monitoring programs. Biol. Cons. 165, 128–138. doi: 10.1016/j.biocon.2013.05.025
Wald, D. M., Longo, J., and Dobell, A. R. (2016). Design principles for engaging and retaining virtual citizen scientists. Conserv. Biol. 30, 562–570. doi: 10.1111/cobi.12627
Keywords: citizen science program, climate change ecology, community-based monitoring, data verification, range-shift, science communication, species identification, species redistribution
Citation: Pecl GT, Stuart-Smith J, Walsh P, Bray DJ, Kusetic M, Burgess M, Frusher SD, Gledhill DC, George O, Jackson G, Keane J, Martin VY, Nursey-Bray M, Pender A, Robinson LM, Rowling K, Sheaves M and Moltschaniwskyj N (2019) Redmap Australia: Challenges and Successes With a Large-Scale Citizen Science-Based Approach to Ecological Monitoring and Community Engagement on Climate Change. Front. Mar. Sci. 6:349. doi: 10.3389/fmars.2019.00349
Received: 16 January 2019; Accepted: 06 June 2019;
Published: 28 June 2019.
Edited by:
Emanuele Di Lorenzo, Georgia Institute of Technology, United StatesReviewed by:
Donald F. Boesch, University of Maryland Center for Environmental Science (UMCES), United StatesHeather Welch, University of California, Santa Cruz, United States
Copyright © 2019 Pecl, Stuart-Smith, Walsh, Bray, Kusetic, Burgess, Frusher, Gledhill, George, Jackson, Keane, Martin, Nursey-Bray, Pender, Robinson, Rowling, Sheaves and Moltschaniwskyj. This is an open-access article distributed under the terms of the Creative Commons Attribution License (CC BY). The use, distribution or reproduction in other forums is permitted, provided the original author(s) and the copyright owner(s) are credited and that the original publication in this journal is cited, in accordance with accepted academic practice. No use, distribution or reproduction is permitted which does not comply with these terms.
*Correspondence: Gretta T. Pecl, Z3JldHRhLnBlY2xAdXRhcy5lZHUuYXU=