 Edward M. Armstrong1
 Mark A. Bourassa2
 Thomas A. Cram3
 Maya DeBellis1Jocelyn Elya2
 Frank R. Greguska III1
 Thomas Huang1*
 Joseph C. Jacob1Zaihua Ji3Yongyao Jiang4
 Yun Li4
 Nga Quach1Lewis McGibbney1Shawn Smith2Vardis M. Tsontos1Brian Wilson1
 Steven J. Worley3
 Chaowei Yang4Elizabeth Yam1
- 1NASA Jet Propulsion Laboratory, California Institute of Technology, Pasadena, CA, United States
- 2Center for Ocean-Atmospheric Prediction Studies, Tallahassee, FL, United States
- 3National Center for Atmospheric Research, Boulder, CO, United States
- 4Geography and Geoinformation Science, George Mason University, Fairfax, VA, United States
An Integrated Science Data Analytics Platform is an environment that enables the confluence of resources for scientific investigation. It harmonizes data, tools and computational resources to enable the research community to focus on the investigation rather than spending time on security, data preparation, management, etc. OceanWorks is a NASA technology integration project to establish a cloud-based Integrated Ocean Science Data Analytics Platform for big ocean science at NASA’s Physical Oceanography Distributed Active Archive Center (PO.DAAC) for big ocean science. It focuses on advancement and maturity by bringing together several NASA open-source, big data projects for parallel analytics, anomaly detection, in situ to satellite data matchup, quality-screened data subsetting, search relevancy, and data discovery. Our communities are relying on data available through distributed data centers to conduct their research. In typical investigations, scientists would (1) search for data, (2) evaluate the relevance of that data, (3) download it, and (4) then apply algorithms to identify trends, anomalies, or other attributes of the data. Such a workflow cannot scale if the research involves a massive amount of data or multi-variate measurements. With the upcoming NASA Surface Water and Ocean Topography (SWOT) mission expected to produce over 20PB of observational data during its 3-year nominal mission, the volume of data will challenge all existing Earth Science data archival, distribution and analysis paradigms. This paper discusses how OceanWorks enhances the analysis of physical ocean data where the computation is done on an elastic cloud platform next to the archive to deliver fast, web-accessible services for working with oceanographic measurements.
Introduction
With increasing global temperature, warming of the ocean, and melting ice sheets and glaciers, impacts can be observed from changes in anomalous ocean temperature and circulation patterns, to increasing extreme weather events and more intense tropical cyclones, sea level rise and storm surges affecting coastlines can be observed, and may involve drastic changes and shifts in marine ecosystems. To date, investigative science requires researchers to work with many disjoint tools such as search, reprojection, visualization, subsetting, and statistical analysis. Researchers are finding themselves having to convert nomenclature between these tools, including something as mundane as dataset name and representation of geospatial coordinates. Sometime researchers are also required to transform the data into some common representation in order to correlate measurements collected from different instruments. The concept of an Integrated Data Analytics Platform (Figure 1) is to tackle these data wrangling, management, and analysis challenges, so researchers can focus on their investigation.
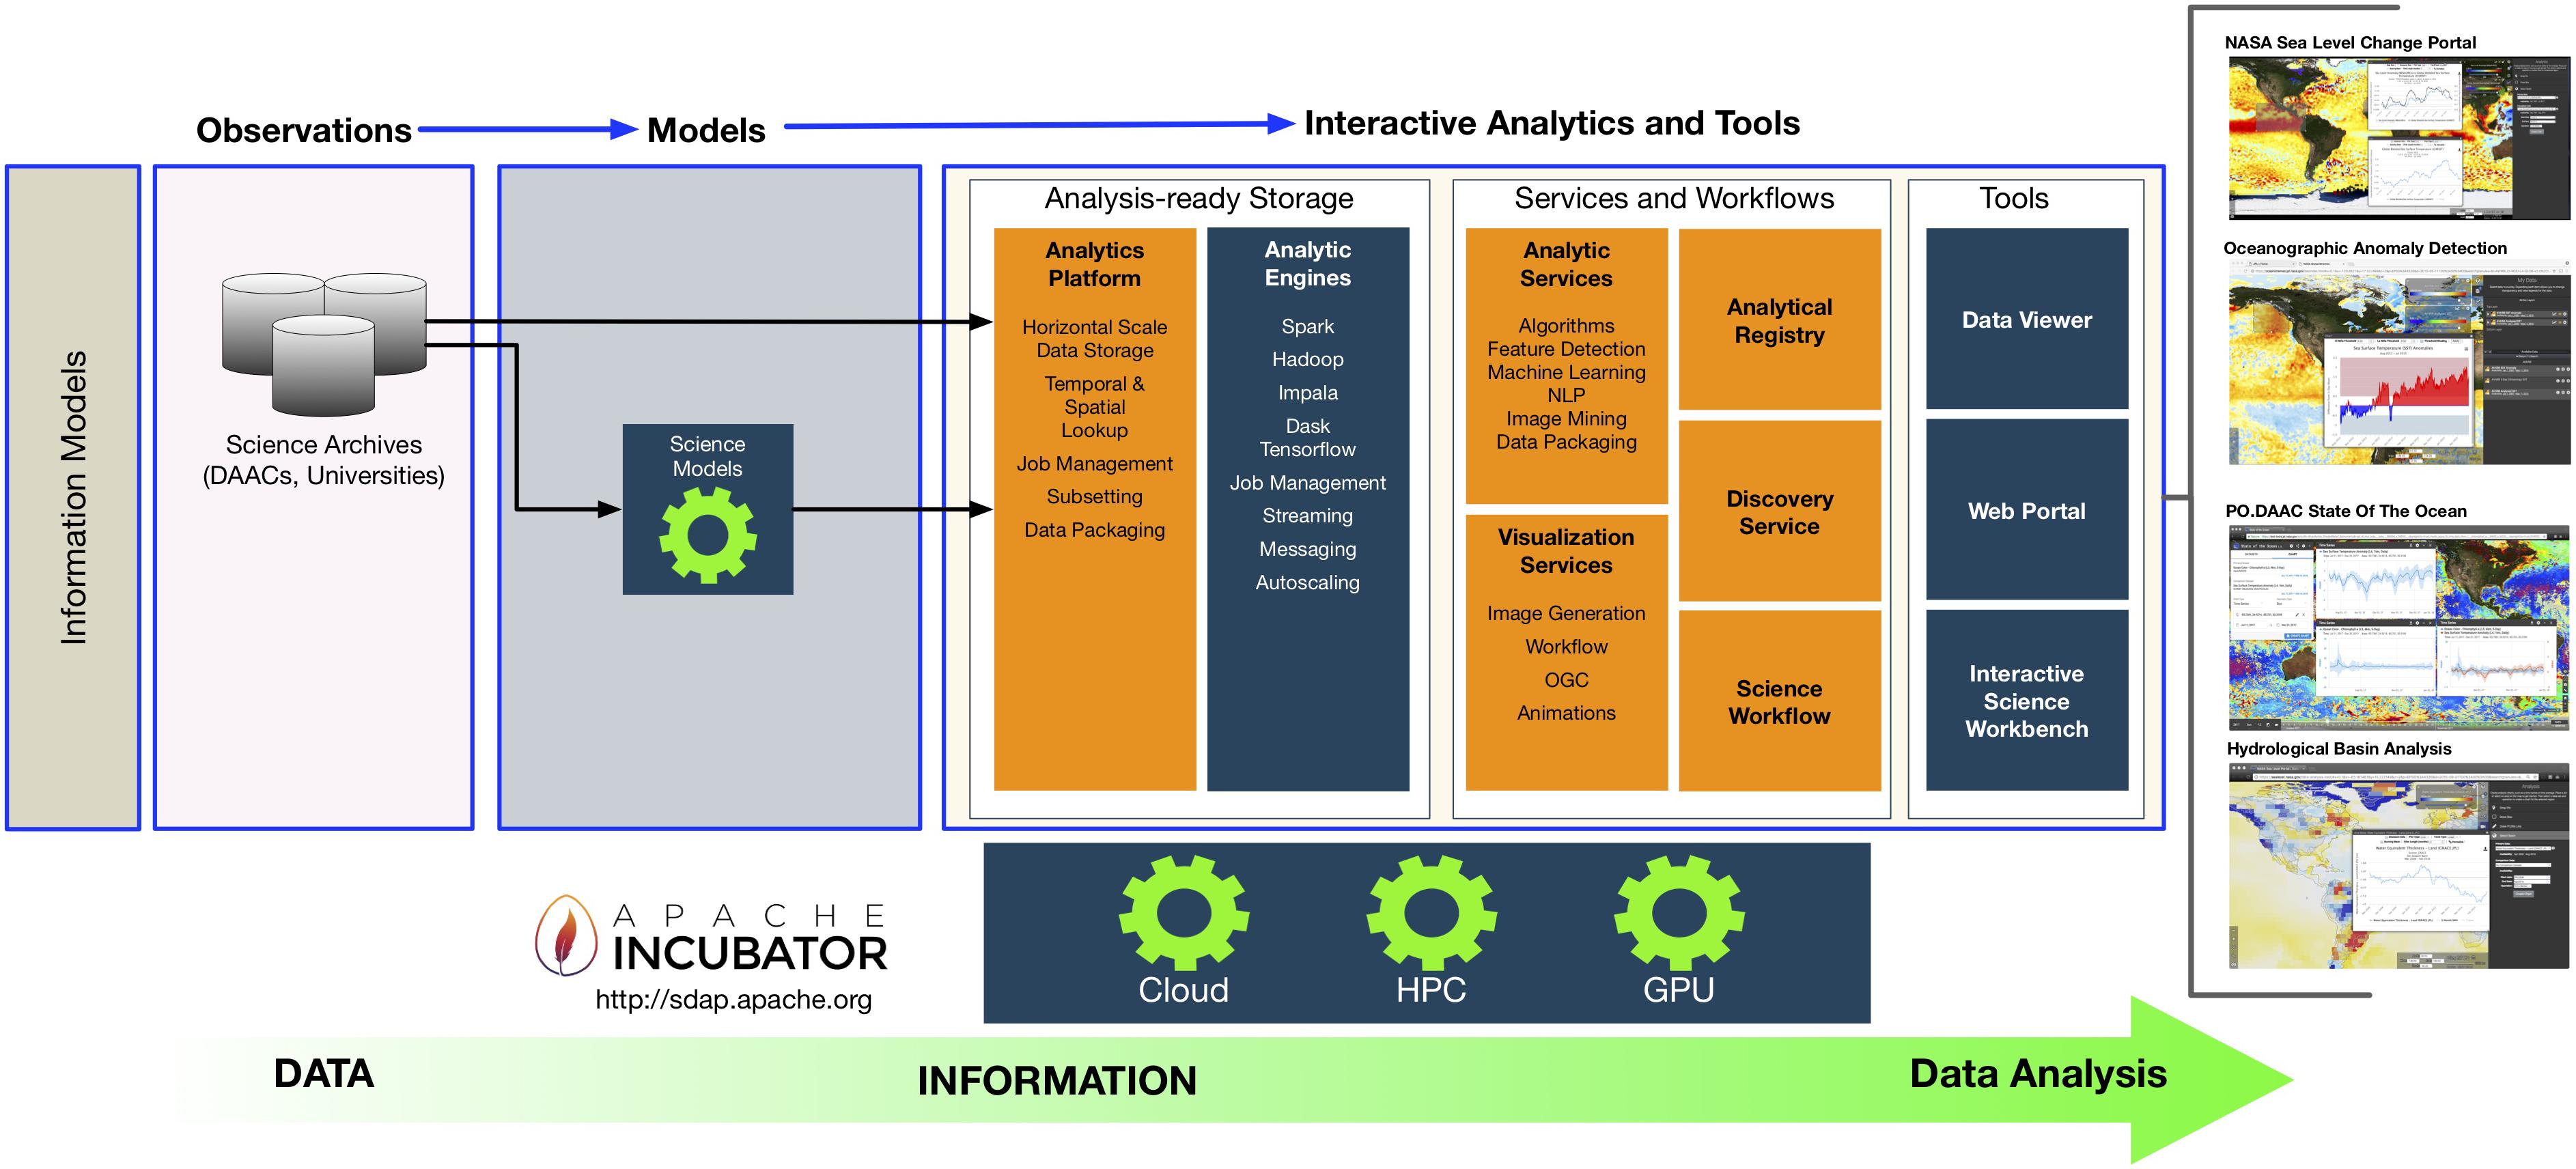
Figure 1. An integrated data analytics platform.
In recent years, NASA’s Advanced Information Systems Technology (AIST) and Advancing Collaborating Connections for Earth System Science (ACCESS) programs have invested in developing new technologies targeting big ocean data on the cloud computing platforms. Their goal is to address some of the big ocean science challenges by leveraging modern computing infrastructure and horizontal-scale software methodologies. Rather than looking into developing a single ocean data analysis application, we have developed a data service platform to enable many analytic applications and lay the foundation for community-driven big ocean science.
OceanWorks (Huang, 2018) is a NASA AIST project to mature NASA’s recent investments through integrated technologies and to provide the oceanographic community with a range of useful and advanced data manipulation and analytics capabilities. As an Integrated Data Analytics Platform, OceanWorks, harmonizes data, tools and computational resources to enable the ocean science community to focus on the investigation rather than spending time on security, data preparation, management, etc. One of the frustrations from the ocean science community has been experiencing with the growing silos of tools that lack coherence. A user might use one tool to search and has to manually translate the dataset name, time and spatial extends in order to satisfy the nomenclature of another tool (e.g., subsetting tool). OceanWorks is a 2-year development effort to implement an Integrated Data Analytic Platform for ocean science. This platform is designed to be extensible to promote community contribution with the following initial offerings:
1. Data analysis.
2. Data-Intensive anomaly detection.
3. Distributed in situ to satellite data matching.
4. Search relevancy.
5. Quality-screened data subsetting.
6. Upload and execute custom parallel analytic algorithm.
While the project is still in active development, in 2017 the OceanWorks project team donated all of the project’s source code to the Apache Software Foundation and established the official Science Data Analytics Platform (SDAP) project1 for community-driven and development of the data access and analysis platform for the cloud environment. The OceanWorks project is now developing in the open.
Oceanworks Components
OceanWorks is an orchestration of several NASA big data technologies as a coherent webservice platform. Rather than focus on one science application, this webservice platform enables various types of applications. Figure 2 show how to use OceanWorks to facilitate on-the-fly analysis of Hurricane Katrina (Liu et al., 2009) and to use a Jupyter notebook to interact with OceanWorks to analyze The Blob in the northeast Pacific (Cavole et al., 2016). This section discusses some of the key components of the OceanWorks.
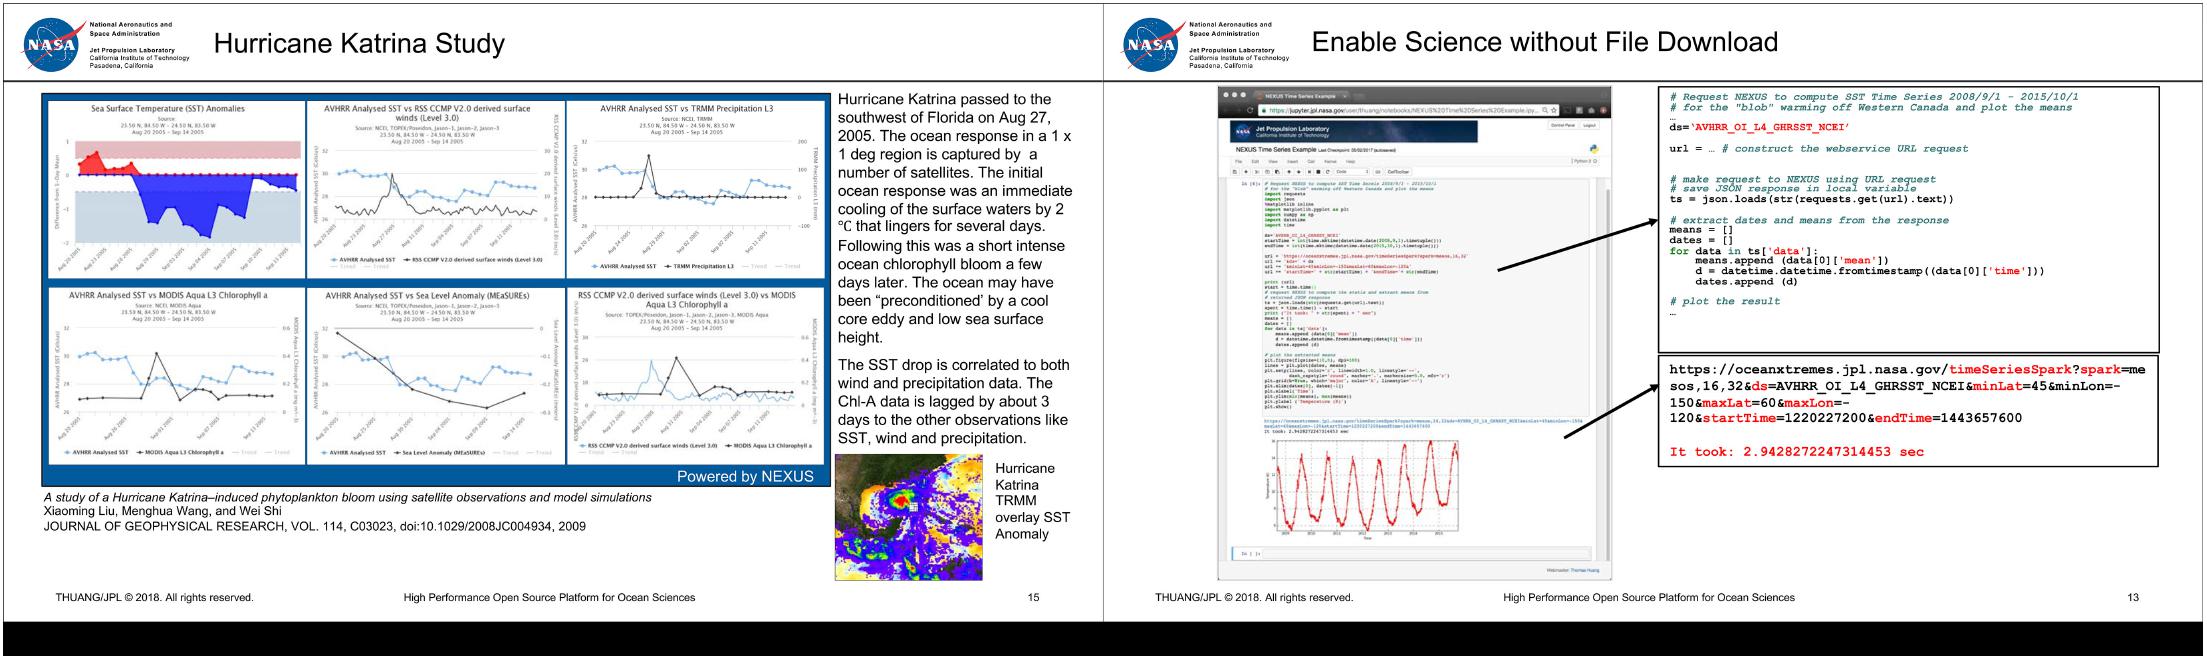
Figure 2. Example oceanworks services.
Data Analytics
We have been developing analytics solutions around common file packaging standards such as netCDF and HDF. We evangelize for the Climate and Forecast (CF) metadata convention and the Attribute Convention for Dataset Discovery (ACDD) to promote interoperability and improve our searches. Yet, there is very little progress in tackling our current big data analytic challenges, which include how to work with petabyte-scale data and being able to quickly look up the most relevant data for a given research. While the current method of subsetting and analyzing one daily global observational file at time is the most straightforward, it is an unsustainable approach for analyzing petabytes of data. The common bottleneck is in working with large collections of files. Since these are global files, researchers are finding themselves having to move (or copy) more data than they need for their regional analysis. Web service solutions such as OPeNDAP and THREDDS provide a web service API to work with these data, but their implementation still involves iterating through large collection of files.
The OceanWorks’ analytics engine is called NEXUS (Huang et al., 2016). It takes on a different approach for storing and analyzing large collections of geospatial, array-based data by breaking the netCDF/HDF file data into data tiles and storing them into a cloud-scale data management system. With each data tile having its own geospatial index, a regional subset operation only requires the retrieval of the relevant tiles into the analytic engine. Our recent benchmark shows NEXUS can compute an area-averaged time series hundreds time faster than traditional file-based approach (Jacob et al., 2017). The traditional file-based approach typically involves subsetting large collection of time-based granule files before applying analysis on the subsetted data. Much of the traditional file-based approach is spent on file manipulation.
OceanWorks enables advanced analytics that can easily scale to the available computation hardware along the full spectrum from an ordinary laptop or desktop computer, to a multi-node server class cluster computer, to a private or public cloud computer. The architectural drivers are:
1. Both REST and Python API interfaces to the analytics.
2. In-memory map-reduce style of computation.
3. Horizontal scaling so computational resources can be added or removed on demand.
4. Rapid access to data tiles that form natural spatiotemporal partition boundaries for parallelization.
5. Computation performed close to the data store to minimize network traffic.
6. Container-based deployment.
The REST and Python API enables OceanWorks to be easily plugged into a variety of web-based user interface, each tuned to particular domains. Calls to OceanWorks from a Jupyter notebook enables interactive cloud-scale, science-grade analytics.
Built-in analytics are provided for the following algorithms:
1. Area-averaged time series to compute statistics (e.g., mean, minimum, maximum, standard deviation) of a single variable or two variables being compared. Optionally apply seasonal or low-pass filter to the result.
2. Time-averaged map to produce a geospatial map that averages gridded measurements over time at each grid coordinate within a user-defined spatiotemporal bounding box.
3. Correlation map to compute the correlation coefficient at each grid coordinate within a user-specified spatiotemporal bounding box for two identically gridded datasets.
4. Climatological map to compute a monthly climatology for a user-specified month and year range.
5. Daily difference average to subtract a dataset from its climatology, then, for each timestamp, average the pixel-by-pixel differences within a user-specified spatiotemporal bounding box.
6. In situ match to discover in situ measurements that correspond to a gridded satellite measurement.
In addition, authenticated or trusted users may inject their own custom algorithm code for execution within OceanWorks. An API is provided to pass the custom code as either a single or multi-line string or a Python file or module.
In situ to Satellite Matchup
Comparison of measurements from different ocean observing systems is a frequently used method to assess the quality and accuracy of the measurements. The matching or collocating and evaluation of in situ and satellite measurements is a particularly valuable method because the physical characteristics of the observing systems are so different and therefore the errors related to instrumentation and sampling are not convoluted. The satellite community tends to use collocated in situ measurements to develop, improve, calibrate, and validate the integrity of the retrieval algorithms (e.g., Bourassa et al., 2003). The in situ observational community uses collocated satellite data to assess the quality of extreme/suspicious values and to add spatial context to the often sparse point values. In both of these research realms there are many more detailed use cases, e.g., near real-time decision support of field programs, planning exercises for future observing system deployments, and development of integrated, in situ plus satellite data, global gridded analyses products that are useful for stand-alone research and for model initialization and boundary conditions.
There are several major data challenges related to successful satellite and in situ data collation research. Disparate data volume and variety is the primary challenge. Individual satellite collections are typically large in volume, have relatively homogenous sampling, are derived from a single platform, are composed of a consistent set of parameters, and are represented as scan lines, swaths, or globally gridded fields. In situ observations typically bring the variety challenge into the problem. They are often replete with heterogeneous observing platforms (ships, drifting and stationary buoys, glides, etc.), instrumentation types and sampling methods, highly varying sampling rates, and sparse spatiotemporal coverage over the global ocean. Another major challenge for collation-based research is logistical. The archives of satellite data and in situ data are often distributed at different centers, have a variety of access methods that need to be understood and applied, have different data formats and quality control information, and over time the data can dynamically extend (adding data to the time series) or have completely new versions with critical data quality improvements. The OceanWorks match-up service (Smith et al., 2018) resolves these major challenges and many other secondary challenges.
Quality-Screened Subsetting
When working with earth science data and information, whether derived from an in situ platform, or airborne or satellite instruments, users often need to access, understand and apply data quality information such as quality flags related to instrument and algorithm performance, physical plausibility, or other environmental characteristics or conditions. The ability to screen the physical data records via services that apply standardized sets of quality flags, states or conditions is imperative to allow scientists to seamlessly use these data to meet their requirements for error and accuracy.
In the oceanographic in situ realm there are a number of models and conventions in use by the community. The OceanWorks project has chosen the IODE (International Oceanographic Data and Information Exchange) convention (UNESCO, 2013), an internationally recognized and developed approach to tag in situ observations using both a primary and secondary level of quality flags. OceanWorks will screen in situ data using five primary level flags. This approach was chosen because of its simplicity which allows a direct mapping and transformation of the native quality flags embedded in the source in situ datasets (e.g., ICOADS, Freeman et al., 2017; SAMOS) into the IODE scheme.
In the oceanographic satellite realm, a similar need for standardization is exacerbated by the increasingly dense availability of quality information in the form of data accuracy, processing algorithms states and failures, environmental conditions, and auxiliary variables that are packed as conditions into quality variables represented as scalar or bit flags. This level of complexity makes it often difficult and confusing for a science user to understand and apply the proper flags to screen for meaningful physical data. The NASA software project, the Virtual Quality Screening Service (VQSS; Armstrong et al., 2016), addressed these issues by implementing a service infrastructure to expose, apply, and extract quality screening information through implementations of strategic databases and web services, data discovery, and exposure of granule-based quality information via interactive menus. Fundamentally, VQSS leveraged on the availability of Climate and Forecast (CF) metadata conventions applied to the satellite quality variables that strictly standardizes the structure and content of quality information through its attributes: flag_values, flag_mask, and flag_meanings. Employed web services are able to seamlessly extract physical information in the form of netCDF and JSON outputs based on screening conditions using these bit flag and scaler conditions, auxiliary variable for data threshold conditions, and many other use cases. OceanWorks will employ this architecture to allow users a similar capability to apply the quality information embedded in the gridded and ungridded input satellite data sources for sea surface temperature, ocean color, sea level, wind and precipitation parameters.
Search Relevancy and Discovery
Retrieving appropriate datasets is the prerequisite for data analysis, however, as the size of our archives increases faster than ever, it poses a great challenge for researchers and developers to efficiently identify the desired dataset(s). The PO.DAAC supplies the Earth science community with a large number of over 600 unique publicly accessible datasets collected by satellites and other missions. Although the PO.DAAC portal provides a valuable free text keyword search service to facilitate the searching process, it still has significant limitations including (1) the default keyword-based search method is popular in geospatial portals, which does not take semantic meaning of the query into account, for example, the search engine cannot retrieve metadata only containing “SLP” for a query “sea level pressure;” (2) Only single attributes are used in the default ranking algorithm in most geospatial portals, such as spatial resolution, processing level, monthly popularity instead of multidimensional preferences that should be considered in the ranking process; (3) The PO.DAAC portal’s unsatisfactory implementation of data relevancy with useful datasets often buried in the search return list or non-existent. Improvements to data relevancy provides immediate improvements in the user search experience and result (Jiang et al., 2018a).
OceanWorks is equipped with a data discovery engine with a profile analyzer (Jiang et al., 2017), a knowledge base, and a smart engine. Raw web usage logs are collected from multiple servers and grouped into sessions through the profile analyzer. Reconstructed sessions are valuable sources of learning vocabulary linkages in addition to metadata (Jiang et al., 2017). A RankSVM model (Joachims, 2002) is trained on a few predefined ranking features with optimal ranking list provided by domain experts, aiming to increase the rank of data more relevant to the query (Jiang et al., 2018a). A recommender calculates the relevancy between metadata using their attributes and logs. A knowledge base is populated to store information like domain term linkages, metadata relevancy, as well as pretrained model for ranking and recommendation. When a user input a query in the search box, highly related terms are extracted from the knowledge base to expand the original search query and the search engine will retrieve data using the rewritten query instead of the input query, resulting in a higher recall score. The retrieved datasets are not be displayed to the user directly but reranked by the pretrained model to achieve a better ranking list. If the user chooses to view a metadata record, the recommender will retrieve a list of related datasets to the current dataset being viewed, helping the user efficiently find additional resources (Jiang et al., 2018b). In summary, the optimal workflow allows the data consumer to acquire dataset efficiently and accurately using advanced machine learning methods.
Applications and Infusion
OceanWorks has been deployed for use by a number of NASA projects. Some of these include the NASA Sea Level Change Portal (SLCP), the GRACE Science Portal, and work is currently underway to integrate it with the State of the Ocean (SOTO) tool as part of the NASA PO.DAAC. Each project has slightly different needs, but all of them are able to utilize OceanWorks to fulfill their requirements.
The NASA SLCP contains a wealth of information about how the Earth’s sea level is changing. It acts as a one-stop for everything from news articles to data analysis. OceanWorks has been deployed as the engine behind the Data Analysis Tool that is part of the portal. The Data Analysis Tool focuses on providing fast and easy to use data analysis on a curated list of datasets that are important to the understanding of sea level change. Because OceanWorks is able to be deployed in many configurations depending on project requirements, it was a perfect fit for providing the data analysis capabilities required by SLCP. In this particular instance, only a single instance of OceanWorks was required to power the analysis because the datasets being analyzed are limited in resolution and frequency. This allows for real-time interactive analysis through the JavaScript front-end.
Similar to the NASA SLCP, the GRACE Science portal has limited requirements with respect to the amount of data that needs to be analyzed. However, this project required deployment to a public cloud infrastructure with different network security constraints. So, while the user interface and data are similar in nature, the backend server is hosted using Amazon Web Services (AWS). This implementation is possible because OceanWorks provides the flexibility to be deployed on a laptop, a single server, a bare metal cluster, or on a public cloud.
The NASA PO.DAAC deployment has different requirements from both SLCP and GRACE. The datasets hosted by PO.DAAC are very large and cover a wide time period. In order to provide analysis capabilities for these larger datasets, more than one server is needed for analysis. OceanWorks was built for this situation and can utilize Apache Spark to scale horizontally and spread the compute requirements across a cluster of machines. With this cluster setup, OceanWorks is able to handle the analysis of larger, more dense datasets (Supplementary Material).
The multiple deployments of OceanWorks have proven that it is capable of handling a wide range of requirements and deployment scenarios. From single node to multi node, on premise to on cloud, and small data to big data, the flexibility and power of OceanWorks permits diverse implementation.
Challenges and Outlook
The Apache Science Data Analytics Platform (SDAP) is the open source implementation of OceanWorks. The project team recognizes it will take years of collaborative effort to create a big data solution that satisfies the needs from various science disciplines. OceanWorks has demonstrated how to create a community-driven technology through a well-managed open source development process. Unlike many emerging Earth Science big data solutions, SDAP is designed as a platform with simple RESTful API that supports clients developed in any programming language. This façade-based architectural approach enables SDAP to continue to evolve and leverage any new open source big data technology. OceanWorks only addressed some of the ocean science needs. It requires contributions from our community to help continue to evolve this open source technology.
This project team would like this community to develop and infuse a common, open source, ocean analytic engine next to our distributed archives of ocean artifacts. Researchers or tool developers can interact with any of these analytics services, managed by the data centers, without having to move massive amount of data over the Internet.
Author Contributions
All authors contributed to this community paper are members of the Apache open source NASA AIST OceanWorks project, called the Science Data Analytics Platform (SDAP).
Conflict of Interest Statement
The authors declare that the research was conducted in the absence of any commercial or financial relationships that could be construed as a potential conflict of interest.
Acknowledgments
This study was carried out at the Jet Propulsion Laboratory, California Institute of Technology, in collaboration with the Center for Ocean-Atmospheric Prediction Studies (COAPS) at the Florida State University, National Center for Atmospheric Research (NCAR), and the George Mason University (GMU), under a contract with the National Aeronautics and Space Administration. Reference herein to any specific commercial product, process, or service by trade name, trademark, manufacturer, or otherwise, does not constitute or imply its endorsement by the United States Government or the Jet Propulsion Laboratory, California Institute of Technology.
Supplementary Material
The Supplementary Material for this article can be found online at: https://www.frontiersin.org/articles/10.3389/fmars.2019.00354/full#supplementary-material
Footnotes
References
Armstrong, E. M., Xing, Z., Fry, C., Khalsa, S. J. S., Huang, T., Chen, G., et al. (2016). “A service for the application of data quality information to NASA earth science satellite records,” in Proceedings of the 2016 American Geophysical Union Fall Meeting, San Francisco, CA.
Bourassa, M. A., Legler, D. M., O’Brien, J. J., and Smith, S. R. (2003). SeaWinds validation with research vessels. J. Geophys. Res. 108:3019. doi: 10.1029/2001JC001028
Cavole, L. M., Demko, A. M., Diner, R. E., Giddings, A., Koester, I., Pagniello, C. M. L. S., et al. (2016). Biological impacts of the 2013–2015 warm-water anomaly in the Northeast Pacific: winners, losers, and the future. Oceanography 29, 273–285. doi: 10.5670/oceanog.2016.32
Freeman, E., Woodruff, S. D., Worley, S. J., Lubker, S. J., Kent, E. C., Angel, W. E., et al. (2017). ICOADS release 3.0: a major update to the historical marine climate record. Int. J. Climatol. 37, 2211–2232. doi: 10.1002/joc.4775
Huang, T. (2018). “High performance open source platform for ocean sciences,” in Proceedings of the 2018 Ocean Sciences Meeting, Portland, OR.
Huang, T., Armstrong, E. M., Chang, G., Chin, T., Gill, K., Greguska, F., et al. (2016). “NEXUS: platform for deep data analysis,” in Proceedings of the 2016 Federation of Earth Science Information Partners Winter Meeting, Washington, DC.
Jacob, J., Greguska, F., Huang, T., Quach, N., and Wilson, B. (2017). “Design patterns to achieve 300x speedup for oceanographic analytics in the cloud,” in Proceedings of the 2017 American Geophysical Union Fall Meeting, New Orleans, LA.
Jiang, Y., Li, Y., Yang, C., Hu, F., Armstrong, E. M., Huang, T., et al. (2018a). A smart web-based geospatial data discovery system with oceanographic data as an example. ISPRS Int. J. Geo-Inf. 7:62.
Jiang, Y., Li, Y., Yang, C., Hu, F., Armstrong, E. M., Huang, T., et al. (2018b). Towards intelligent geospatial data discovery: a machine learning framework for search ranking. Int. J. Digital Earth 11, 956–971.
Jiang, Y., Li, Y., Yang, C., Liu, K., Armstrong, E. M., Huang, T., et al. (2017). A comprehensive methodology for discovering semantic relationships among geospatial vocabularies using oceanographic data discovery as an example. Int. J. Geogr. Inform. Sci. 31, 2310–2328.
Joachims, T. (2002). “Optimizing search engines using clickthrough data,” in Proceedings of the ACM Conference of Knowledge Discovery and Data Mining, Ithaca, NY: Cornell University.
Liu, X., Wang, M., and Shi, W. (2009). A study of a hurricane katrina-induced phytoplankton bloom using satellite observations and model simulations. J. Geophys. Res. 114:C03023.
Smith, S. R., Elya, J. L., Bourassa, M. A., Huang, T., Tsontos, V. M., Holt, B., et al. (2018). “Integrating the distributed oceanographic match-up service into ocean works,” in Proceedings of the 2018 Ocean Sciences Meeting,Portland, OR.
Keywords: big data, cloud computing, ocean science, data analysis, matchup, anomaly detection, open source
Citation: Armstrong EM, Bourassa MA, Cram TA, DeBellis M, Elya J, Greguska FR III, Huang T, Jacob JC, Ji Z, Jiang Y, Li Y, Quach N, McGibbney L, Smith S, Tsontos VM, Wilson B, Worley SJ, Yang C and Yam E (2019) An Integrated Data Analytics Platform. Front. Mar. Sci. 6:354. doi: 10.3389/fmars.2019.00354
Received: 31 October 2018; Accepted: 07 June 2019;
Published: 02 July 2019.
Edited by:
Sanae Chiba, Japan Agency for Marine-Earth Science and Technology, JapanReviewed by:
Ananda Pascual, Instituto Mediterráneo de Estudios Avanzados (IMEDEA), SpainTiffany C. Vance, U.S. Integrated Ocean Observing System, United States
Copyright © 2019 Armstrong, Bourassa, Cram, DeBellis, Elya, Greguska, Huang, Jacob, Ji, Jiang, Li, Quach, McGibbney, Smith, Tsontos, Wilson, Worley, Yang and Yam. This is an open-access article distributed under the terms of the Creative Commons Attribution License (CC BY). The use, distribution or reproduction in other forums is permitted, provided the original author(s) and the copyright owner(s) are credited and that the original publication in this journal is cited, in accordance with accepted academic practice. No use, distribution or reproduction is permitted which does not comply with these terms.
*Correspondence: Thomas Huang, dGhvbWFzLmh1YW5nQGpwbC5uYXNhLmdvdg==