 Lindsay Veazey
 Olivia Williams2
 Rachael Wade
 Robert Toonen
 Heather L. Spalding
- 1Department of Oceanography, University of Hawai‘i at Mānoa, Honolulu, HI, United States
- 2Department of Mathematics, Bard College, Annandale-on-Hudson, NY, United States
- 3Department of Botany, University of Hawai‘i at Mānoa, Honolulu, HI, United States
- 4Hawai‘i Institute of Marine Biology, Kaneohe, HI, United States
Algal assemblages are critical components of marine ecosystems from the intertidal to mesophotic depths; they act as primary producers, nutrient cyclers, and substrate providers. Coral reef ecosystems can be disrupted by stressors such as storm events, effluent inundation, sudden temperature shifts, and non-native invaders. Avrainvillea amadelpha is an invasive green alga that was first recorded in the main Hawaiian Islands on the west shore of Oahu and has continued to be of concern due to its extreme competitiveness with native algae and seagrasses. It has spread rapidly across the island of Oahu, decreasing the biodiversity of the benthos from shorelines to ∼90 m depth. We employed a boosted regression tree modeling framework to identify highly vulnerable regions prone to invasion. Our model indicated that regions exposed to minimal bottom currents and at least five degree heating weeks are particularly susceptible to A. amadelpha colonization. Additionally, we extrapolated our model to the main Hawaiian Islands and forecasted how a 25% increase in statewide annual maximum degree heating weeks may change habitat suitability for A. amadelpha. Across all islands, we identified particularly vulnerable “hotspot” regions of concern for resource managers and conservationists. This manuscript demonstrates the utility of this approach for identifying priority regions for invasive species management in the face of a changing climate.
Introduction
Disturbances can dramatically alter the community composition of coral reef ecosystems. The replacement of coral cover by macroalgae is known as a “phase shift” (Littler and Littler, 1984; MacManus and Polsenberg, 2004; Bruno et al., 2009), which can occur in response to pressures such as storm events (Rogers and Miller, 2006), coral disease outbreaks (Aronson and Precht, 2001; Porter et al., 2001), nutrient input (McCook, 1999), or removal of herbivores (Hughes et al., 2007). Often, these stressors occur simultaneously or in sequence as one stress event lowers the threshold of coral resilience, thereby magnifying total coral mortality (Brandt et al., 2013; Redding et al., 2013; Casey et al., 2014; Vega-Thurber et al., 2014).
Shallow coral reef ecosystems endure common reef stresses, including overuse and physical degradation (i.e., trampling), overextraction, chemical degradation from land-based runoff, effluent, or pollutants, and invasion by harmful bacteria, viruses, or competitors (Rodgers et al., 2003; Friedlander et al., 2017; Stamoulis et al., 2017; Takesue and Storlazzi, 2017). Invasive algae are an ecological and economic concern in Hawaii (Smith et al., 2002; Schaffelke et al., 2006; Westbrook et al., 2015). Invasive species can become opportunistic when some environmental change facilitates their spread and allows them to outcompete native species. In Hawaii, eutrophication due to runoff likely influenced the spread of the non-native and invasive red alga Hypnea musciformis (Smith et al., 2002) and blooms of the native green alga Dictyosphaeria cavernosa (Stimson et al., 1996).
One example of a particularly troublesome competitor that has garnered statewide attention in the past several decades is the invasive green macroalga Avrainvillea amadelpha. This macroalga, also known as “leather mudweed” due to its thick, paddle-like blades (Figure 1a), was first discovered in Hawaii in 1981 (Brostoff, 1989) and has been observed from the intertidal to the mesophotic zone (30–90 m) (Spalding, 2012; Pyle et al., 2016; Cox et al., 2017). Its origin and phylogeny remain uncertain, but it is not present in historical records of shallow marine habitats around the main Hawaiian Islands (MHI) (Brostoff, 1989). To date, this highly successful macroalga has spread across Oahu (Figure 2) and has been observed sporadically around Kauai (Smith et al., 2002; Wade and Sherwood, 2018). In the mesophotic zone, video records show A. amadelpha beds competing with meadows of an undescribed Udotea sp. (Spalding, 2012) (Figures 1b,c).
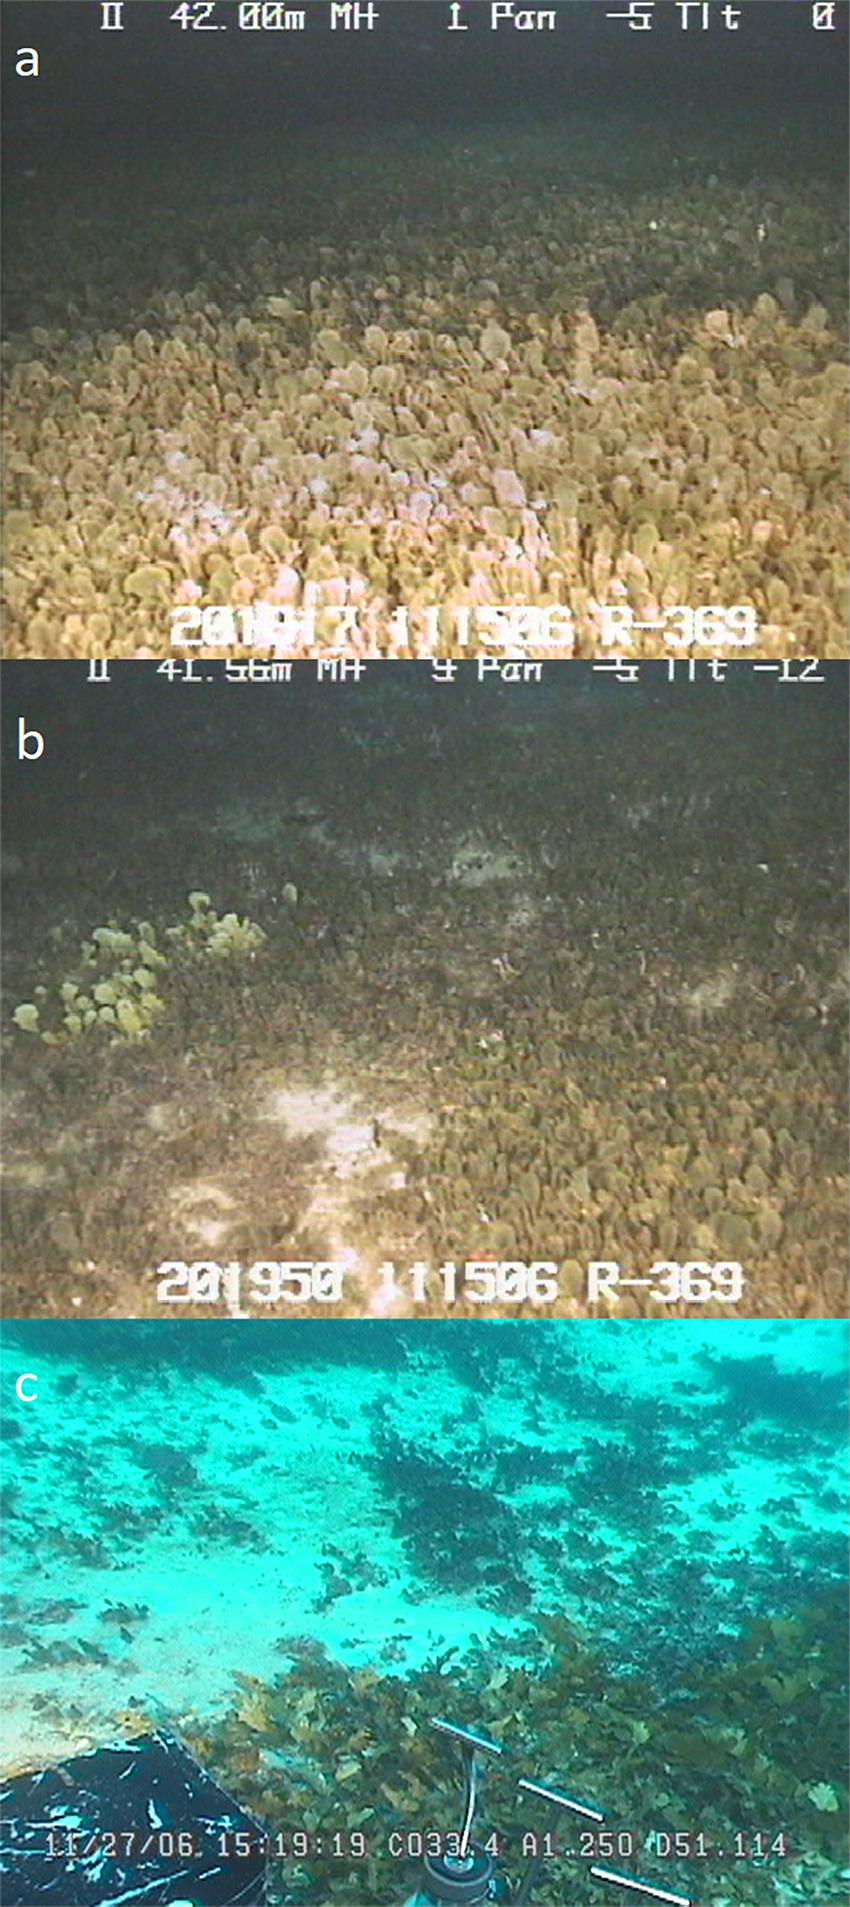
Figure 1. (a) Video still of dense A. amadelpha meadow off the coast of southwest Oahu observed during submersible dive RCV-369. Video stills of A. amadelpha overtaking the lime green blades of native Udotea alga. Dives RCV-369 (b) and P4-188 (c) were conducted off the southwestern and southern coasts, respectively, of Oahu. All stills were taken at depths of 40–50 m in the upper mesophotic zone in November 2006.
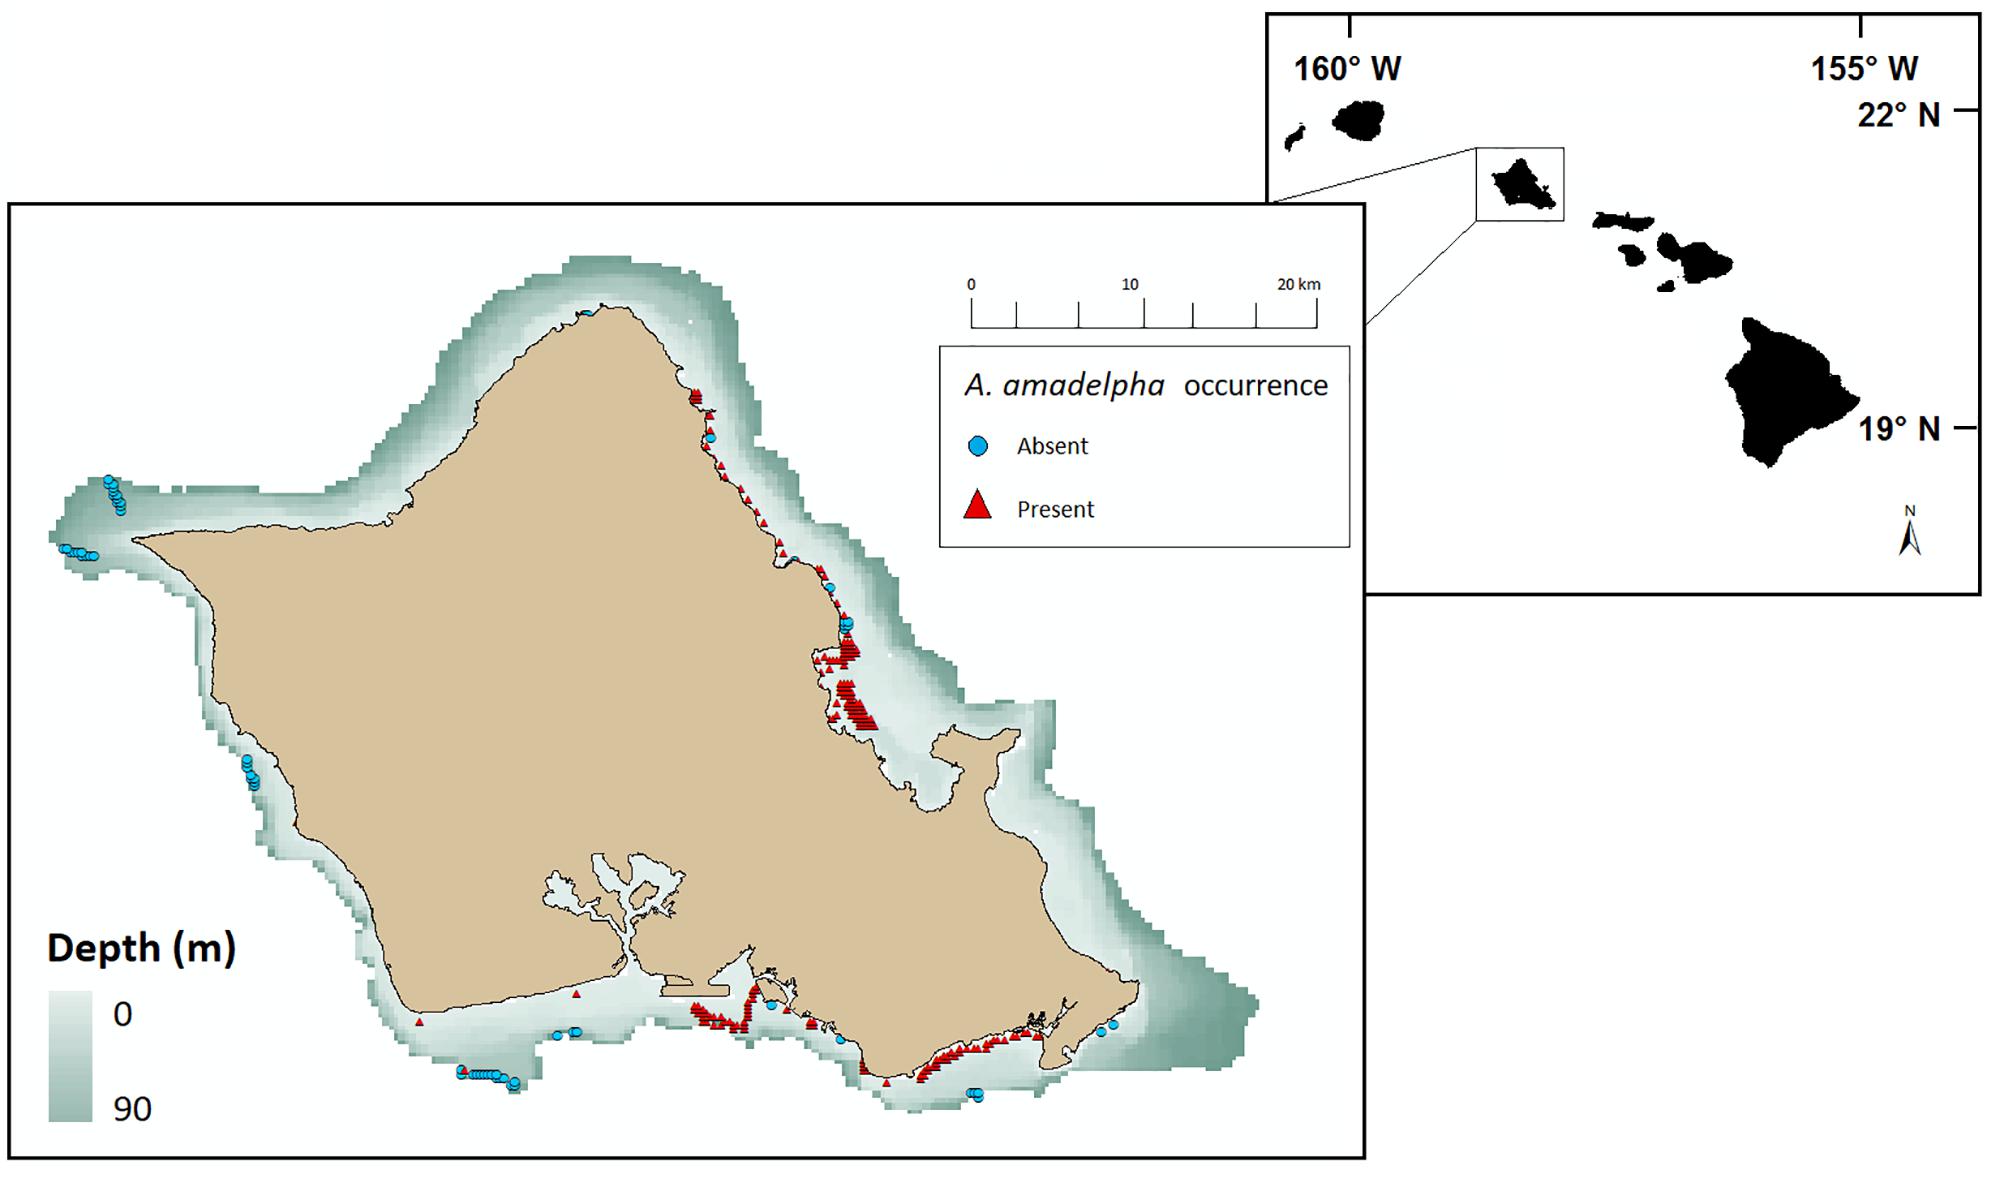
Figure 2. Geolocated survey data denoting 23,421 observations of A. amadelpha occurrence around Oahu, Hawaii, from 2015 to 2017. Presence observations are demarcated with red triangles and absence observations are demarcated with blue circles. Observations edited for overlap at 250 m raster resolution scale and constrained to depths <90 m.
Avrainvillea amadelpha is of particular concern in Hawaii because of its weedy characteristics, such as benthos alteration (Martinez et al., 2009; Sansone et al., 2017), tolerance to environmental extremes (e.g., light availability, exposure, etc.), and unpalatability to native herbivores (Van Heukelem, 2016). The alga is also presumed to have successful vegetative propagation via fragmentation and holdfast siphon viability like many other siphonous green algae (Walters and Smith, 1994). This alga may also change the community diversity and structure across invaded reefs. Langston and Spalding (2017) recorded a higher abundance of fishes above open sand versus within A. amadelpha canopy; Longenecker et al. (2011) determined that removal of A. amadelpha returned invertebrate communities to compositions observed in unaffected regions. All of these traits combine to make A. amadelpha a formidable competitive presence across reefs.
The state has spent over $2 million to remove 1.32 million kilograms of A. amadelpha across a 90,000 m2 swath of Maunalua Bay, Oahu (Kittinger et al., 2016). Much effort has been invested in observing and recording A. amadelpha invasions, as well as stymying the progress of ongoing invasions (Hawaii Department of Aquatic Resources, unpublished data). However, to date, no projections exist regarding the potential spread of this invasive macroalga across shallow reef systems. When used as a management tool, habitat suitability models may provide critical information about the current or probable future distribution of opportunistic competitors (Guisan et al., 2017). Habitat suitability models can also improve understanding of dispersal methods and provide early warning about regions that are particularly vulnerable, but not yet invaded. This work sheds light on areas of particular concern across the state and presents a transferable, quantitative framework that resource managers may utilize as one aspect of monitoring for invasive species.
Materials and Methods
Observational Data
Our observational data were sourced from video obtained during submersible and remotely operated vehicle (ROV) dives and shore-based or snorkeling surveys (Figure 2 and Table 1). The Hawaii Undersea Research Laboratory provided records of Pisces submersible and RCV-150 ROV dives conducted during November 2006. To obtain mesophotic records of A. amadelpha occurrence, we processed 34 h of footage from 7 dives across all coastlines around Oahu (Supplementary Table S1). We collected 3,796 new snapshots of the benthos by pausing each video track in 30 s intervals. From these, 2,441 photo stills were excluded from our mesophotic data set due to blurriness, stationarity of the vessel, or positioning outside the depth maximum (>90 m). We collected shallow (∼5–10 m) subtidal observations of A. amadelpha during multiple snorkeling and free-diving expeditions conducted from July 2015 to November 2017. We combined these data with two existing subtidal survey data sets, which included data from 2015 to 2017 provided by the Hawaii Department of Aquatic Resources. Intertidal shore-based survey data were acquired through transect sampling at low tides (0– to -0.15 m) by the Our Project in Hawaii’s Intertidal school-based monitoring program from March to June 20171.
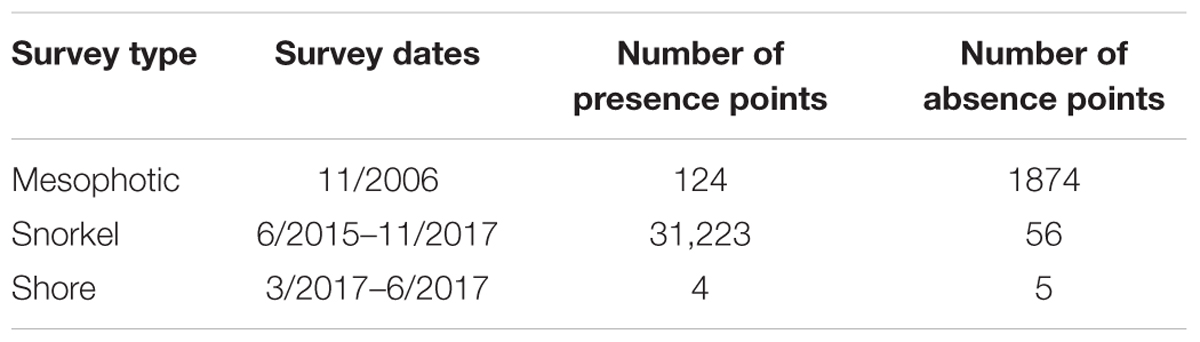
Table 1. Raw observational data survey information.
We removed 8,040 observations from the raw data set of 33,286 points due to overlap within pixels or failure to fall within our depth range (0–90 m). All shoreline survey point data were inspected for geographical precision and manually moved to the closest classified marine pixel if needed. All observational data were combined into one data set spanning depths from 0 to 90 m and covering all coastlines across Oahu. Data were resampled to fit a grid size of 250 m × 250 m and duplicate observations within the same grid cell were removed, resulting in a final data set of 276 observations of A. amadelpha presence (207) or absence (69).
We note that the mesophotic video data used to build this model were gathered approximately one decade before the intertidal and shallow observations. This gap in data collection is due to the costly nature of submersible dives, and we stress that these mesophotic data comprise the most extensive, up-to-date catalog of A. amadelpha occurrence below the shallow (>30 m) zone.
Environmental Data
We considered 15 environmental predictor variables for inclusion in our model (Supplementary Table S2). We represented these predictor variables, or covariates, as 250 m raster grid layers across the study domain, which extended approximately 1–2 km from the coast and encompassed depths from 0 to 90 m. We broadly categorized predictors into three classifications: topographic, oceanographic, and anthropogenic. All covariates were selected for consideration based on their representation in the literature as potentially influential in determining the distribution of A. amadelpha. These covariates may have a direct influence on the metabolic constraints and, therefore, the occurrence of A. amadelpha. Though A. amadelpha has, to date, only been observed around Oahu and sporadically in Kauai, we applied our model to the extended domain of the MHI (Hawaii, Maui, Lanai, Molokai, Kahoolawe, Oahu, Kauai, and Niihau). We expect our model to identify regions that are most suitable for A. amadelpha habitation, which we can pinpoint as at-risk areas that managers may prioritize during monitoring efforts.
Considered topographic variables included seafloor slope, aspect (i.e., compass direction of seafloor), rugosity (i.e., roughness), and bathymetric position index, which is a metric that combines the bathymetry and seafloor slope within a 5 km neighborhood of a given point. Considered oceanographic variables included seafloor current velocity (annual mean), seafloor temperature (annual mean), surface chlorophyll a concentration (annual mean), and surface turbidity (annual mean). Lastly, considered anthropogenic variables included indices describing fishing pressure, nearshore coastal development, anomalous sea surface warming, annual estimated ship crossings, nutrient and sediment inputs, and proximity to human population (Falinski, 2016; Lecky, 2016; Wedding et al., 2018). Fishing pressure and coastal development were scaled from 0 to 1 by dividing a given value by the maximum value in the respective categories. Anomalous sea surface warming, represented as degree heating weeks (DHW), is a metric which couples the duration and intensity of abnormally warm ocean surface temperatures (Liu et al., 2013). Supplementary Table S2 includes further details about considered environmental covariates.
We first examined the spatial coverage of all covariate layers. We excluded the layers displaying proximity to human population and sediment influx from inclusion in our analyses due to their insufficient spatial overlap with mapped observational data and patchy coverage across the considered depth range surrounding the remaining MHI. We chose not to extrapolate these two layers based on our uncertainty about introducing significant error in our predictor data. The data sets detailing nutrient flux and coastal development were more spatially extensive, allowing us to extrapolate the closest offshore values for each variable and apply these values to approximately 5% of offshore observational data points outside the coverage of the layers.
Collinearity of predictor variables may preclude suitable model fitting (i.e., preventing the model from converging or contributing to high standard errors in coefficient estimates). We created a correlation scatterplot to examine the relationships between all covariates and the response variable (i.e., A. amadelpha occurrence) (Supplementary Figure S1). Per Tabachnick and Fidell (1994) and Dancey and Reidy (2004), we removed covariates that met one or more of the following conditions: lack of obvious visual correlation with the response variable, correlation of ≥70% with other predictors that were more strongly correlated with the response variable, and/or lack of a visible or quantitative correlation with the response variable. We included seven covariates in our initial model: seafloor slope, annual mean seafloor current velocity, maximum DHW, nutrient flux, shipping traffic, coastal development, and annual fishing catch.
Model Development
Boosted regression tree (BRT) models fit an ensemble of statistical models by combining the power of boosting (a technique that blends multiple models to improve predictions) and regression trees (models that identify links between response variables and covariates via recursive binary splits; Elith et al., 2008). Three key parameters determine the type and shape of the decision trees that compose the model: bag fraction, learning rate, and tree complexity. To start, we retained stochasticity in our model by setting the subsampling rate, or the bag fraction, equal to 50%. This setting indicates that when training each new tree, the model randomly selects 50% of the data from the training data set. The remaining fraction of the training data not used in the bag fraction is used during that iteration for cross-validation and evaluation of the model. Next, we specified a slow learning rate of 0.0025, which indicates the contribution or weight of each tree in the overall model. The selection of a slow learning rate minimized the contributions of each tree to the final model, minimized the number of very small, random subsets of data selected for fitting each tree, and decreased the chance of fitting abnormal trees. Lastly, we set our tree complexity parameter to 5, which permits the model to create decision trees with 5 nodes. The number of nodes corresponds to the maximum number of predictor interactions the model may identify; we methodically varied all of these parameters to find the optimal combination that would explain the most variance within the data (Elith et al., 2008).
Loss functions are used to calculate deviance, which is a goodness-of-fit statistic indicating how well the model captures variance within the data. Minimized deviance of a model indicates high explanatory, or predictive, power. To improve the performance of our model, we used binomial deviance, which is suggested in the literature due to its robustness when used with noisy or potentially misclassified data (Hastie et al., 2001; Elith et al., 2008). While we do not anticipate the misclassification of a large portion of our data, we chose to use this loss function given that our observational data sets originated from different sources, including researchers, school groups, and state workers. The loss function allowed us to calculate changes in residual deviance, or goodness-of-fit, as we systematically varied key model parameters, which guided our final selection of parameter settings (Elith and Leathwick, 2017).
We determined the relative importance of each predictor variable using formulae within the “gbm” library (Friedman, 2001; Friedman and Meulman, 2003). These values are determined by the number of times each variable is selected in a split and weighted by the subsequent model improvement based on that split (weights are squared to give higher value to predictors that improve the model more considerably). Predictor contributions were scaled such that the sum equated to 100, with higher values indicating greater influence of that predictor on the response variable, i.e., occurrence of A. amadelpha.
We allocated 70% of our data to develop and train our model. The remaining 30% of our data was set aside for model testing. Per Elith et al. (2008), we initially set the number of trees (nt) to nt0 = 50 and ran 10 unique BRTs. We subsequently increased the value of nt by 10 (i.e., nt1 = 60, nt2 = 70, and so on) and ran new models until we found a combination that produced higher average mean predictive performance and lower average standard errors than the previous set of models. Our lr was kept very low (lr = 0.0025) to ensure precise estimation of the starting number of trees (nt = 60).
Model Evaluation
Our initial model (193 observations, 7 predictors) fit 1,680 trees. We trained the model using k-fold cross-validation (k = 10, indicating 10 iterations during which half the training data was randomly selected to develop the model). We evaluated model predictive performance based on the cross-validated area under the curve (AUC) statistic (Hosmer and Lemeshow, 2004), percent of deviance explained by the model, and the standard error of the model. Performance metrics were recorded when we applied the model to the validation data set during training and when we applied the model to the withheld testing data set after model finalization.
We constructed a dotplot to compare known training data set observations to present-day model-predicted occurrence probabilities (Figure 3). The categorical means- indicated by red dots- differ between the two groups; for those pixels where A. amadelpha was not observed, the mean probability was 0.45, while a mean of 0.95 was calculated for pixels known to contain A. amadelpha. The standard deviation of the presence category was much smaller than that of the absence category (i.e., 0.075 and 0.4, respectively), suggesting that the model is prone to false positives. Additionally, we plotted a curve of probabilities predicted by logistic regression; this curve indicated that probabilities below 50% indicate regions fairly unsuitable for A. amadelpha colonization. Risk increases exponentially beyond this probability, with the highest risk of invasion predicted for regions with habitat suitability values >0.95 (Supplementary Figure S2).
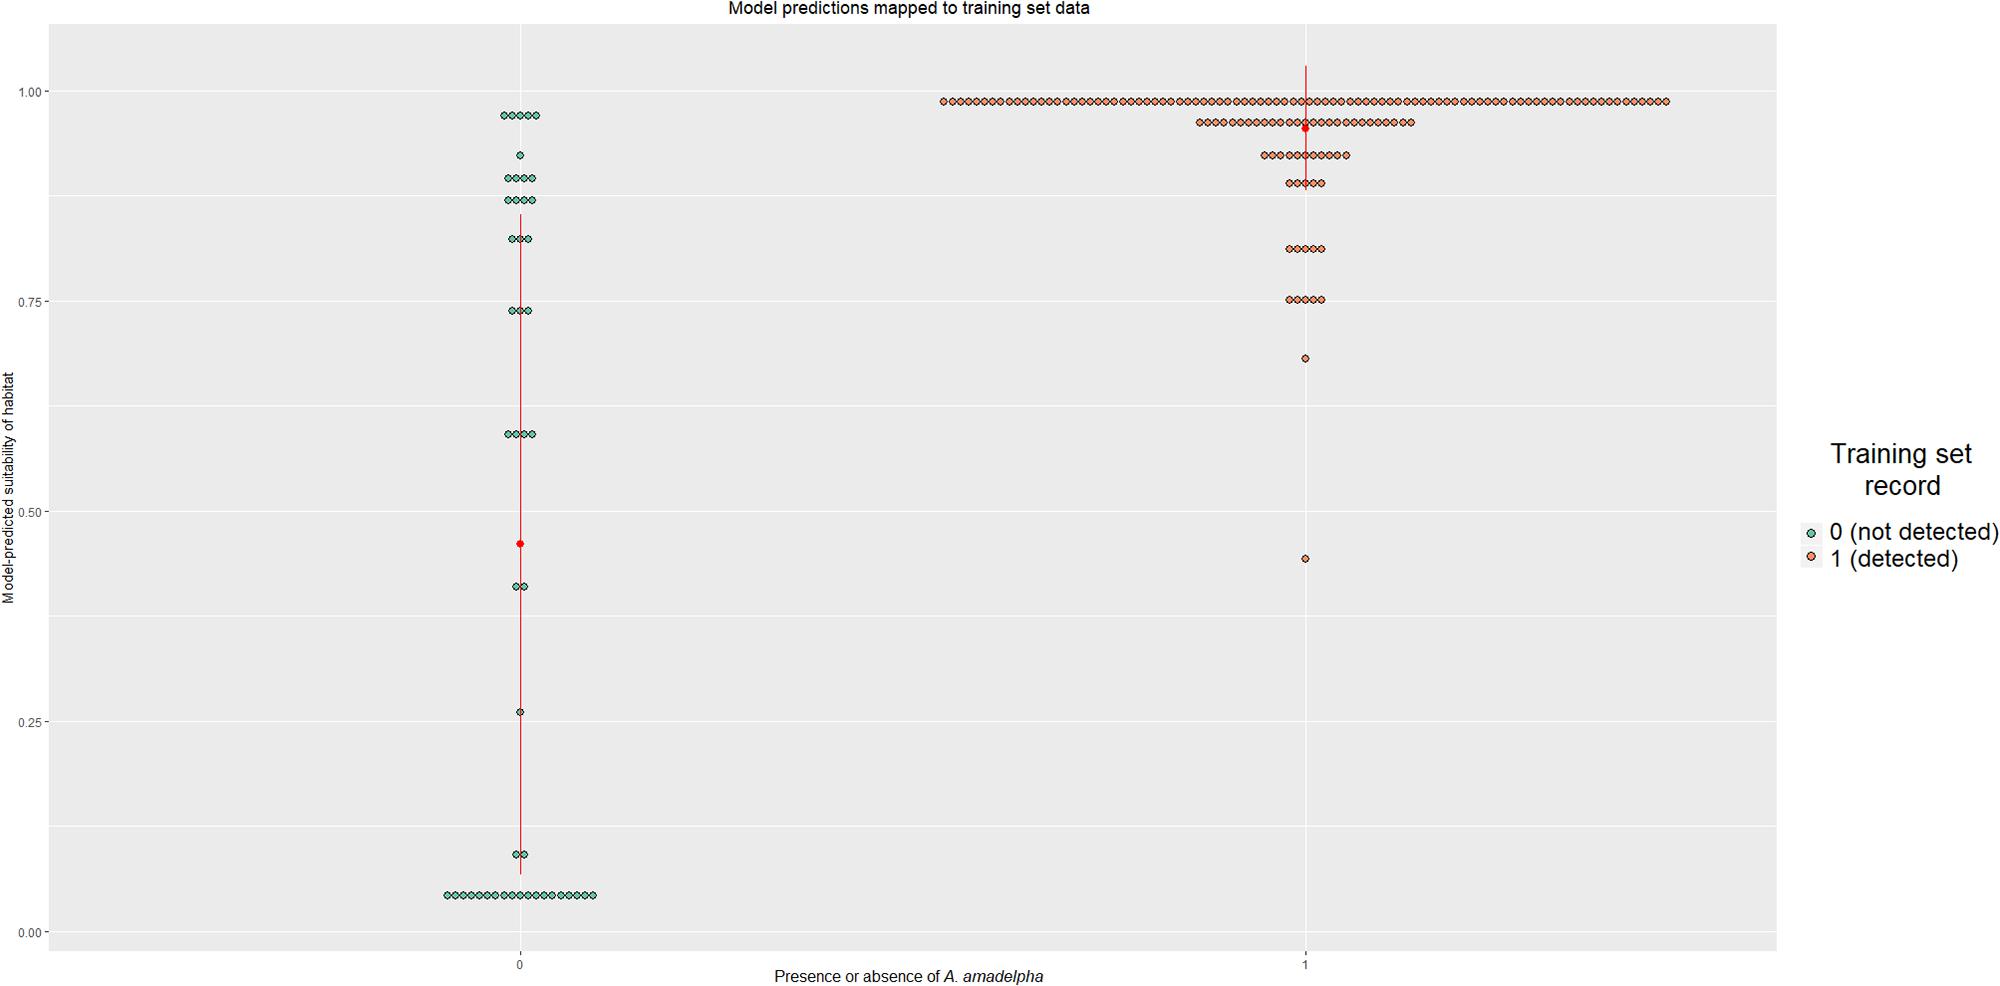
Figure 3. Dotplot showing the spread of model predictions compared to known observations of A. amadelpha presence or absence. The category mean is indicated by a red dot; the vertical lines extending from the mean indicate the standard deviation of that category.
To construct confidence intervals for a given predictor, we bootstrapped the model 100 times, which required us to resample the training data with replacement (note that this differs from the specification of bag fraction during model training, which necessitates subsampling without replacement) (Efron, 1979; Hillis and Bull, 1993). Next, we simulated dropping up to five different variables to evaluate change in predictive deviance; due to the negligible (-1%) change in deviance, we chose not to simplify the model, and retained all 7 predictors for further analyses. We applied our model to the withheld test data (83 observations) and recorded all evaluation metrics. Finally, we tested for spatial autocorrelation within the data to ensure the independence of the response variable (Moran’s I coefficient = 0.088).
Degree heating weeks is a metric that measures cumulative regional heat stress, quantified as the number of weeks in a 12 weeks period during which sea surface temperatures exceed a 1°C increase over the summer mean; a threshold of 4 DHW has been identified as a trigger for probable coral bleaching events (Liu et al., 2008). We applied our model to forecast the change in invasion vulnerability across Hawaii’s coastline given a 25% increase in annual DHW. All other predictors were held constant to isolate the effect of this change. This conservative change was based on the dire projections communicated in the fifth Intergovernmental Panel on Climate Change report, which predicts a global average sea surface temperature change of up to +2.0°C relative to the mean temperatures observed from 1986 to 2005 (IPCC, 2014). A temperature increase of this magnitude will catastrophically destabilize marine ecosystems on a global scale, making them more vulnerable to colonization by invasive species such as A. amadelpha. Regional increases of up to 4 DHW are no longer unimaginably improbable given these grave predictions.
All code is available in the Supplementary Material (Av_code.R). Data will be archived at Dryad. We used R statistical software (R Core Team, 2017) and ESRI ArcGIS v.10.4 (ESRI, 2017) to perform all data analyses. Our BRTs were specified using the “dismo” package version 1.1–4 (Hijmans et al., 2017) and visualized using the “ggBRT” package (Jouffray et al., 2019).
Results
Model Performance
Our initial area under the curve (AUC) statistic (0.99) indicated possible overfitting of the model to the training data. However, our cross-validated AUC (0.94) indicated high predictive accuracy during this initial training stage. Our cross-validated standard error was 2.1% and the model explained 62% of the validation data deviance. When applied to the testing data set, AUC slightly increased (0.96), with an average of 87% of presences and absences identified correctly by the model. The model explained 63% of the deviance within the testing data set, demonstrating its predictive capability when applied to novel data. Further model performance details may be found in Table 2.
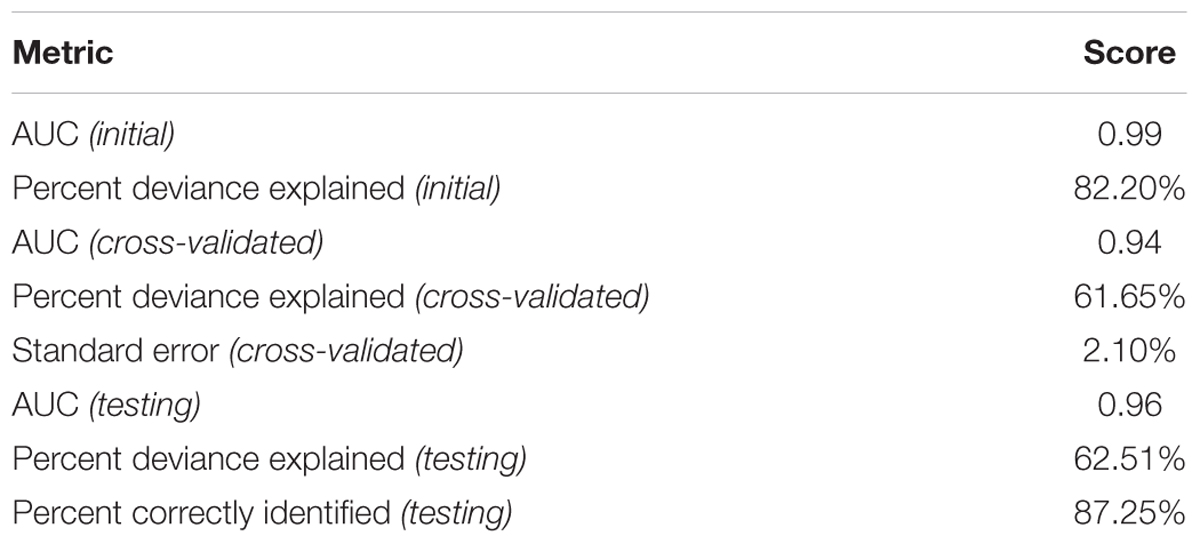
Table 2. Model performance metrics.
Influential Environmental Covariates
Our model indicated that seven variables that exhibit some influence on the probability of A. amadelpha occurrence across Hawaii. These predictor variables include percentage of shoreline development (30%), maximum DHW (26%), fishing pressure (14%), mean current velocity at the seafloor (11%), shipping traffic (9%), seafloor slope (6%), and nutrient flux (3%). Our model scaled the relative influence of each predictor based on the total number of covariates in the final model to identify the most important predictor variables; this delineation is indicated by a dashed red line (Figure 4). The model identified shoreline development, thermal intensity and exposure (i.e., DHW), and fishing pressure as the most influential predictors of A. amadelpha occurrence.
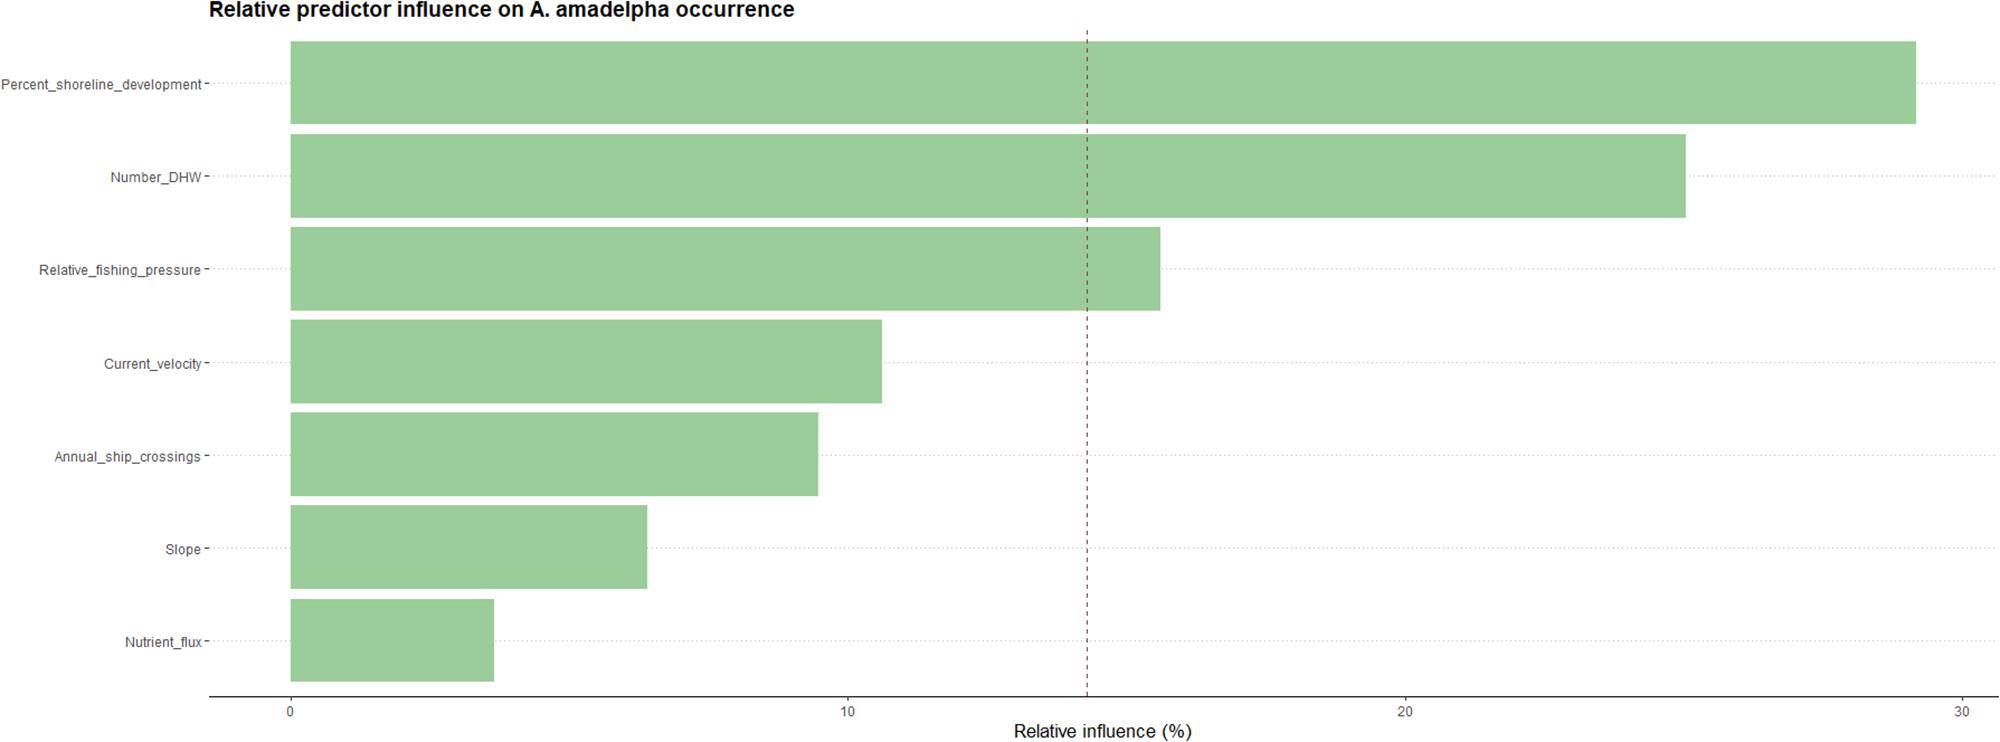
Figure 4. Relative influence of each predictor on A. amadelpha occurrence. The red dashed line indicates the most influential predictors after scaling (i.e., influence percentage divided by number of predictors).
To visualize the effect of each predictor on the probability of A. amadelpha occurrence, we bootstrapped our predictions and generated partial dependence plots with confidence intervals (Figure 5). Our model indicated the importance of coastal development in determining the probability of A. amadelpha occurrence. Our plot shows that regions of the coastline that experienced a minimal amount of recent development (5–10% from 2005 to 2010) may be more prone to colonization. Additionally, we note higher vulnerability for invasion in flat regions exposed to minimal seafloor current, at least 400 ship crossings annually, moderate fishing pressure, and at least 5 DHW. Nutrient flux was identified as the least influential covariate, and our plot shows only a mild increase in regional vulnerability when exposed to greater nutrient inputs. The confidence intervals show some model uncertainty regarding higher levels of fishing or shoreline development, but are tightest around certain spikes in the data, highlighting the important effect of certain thresholds for these predictors in relation to increased vulnerability for A. amadelpha incursion.
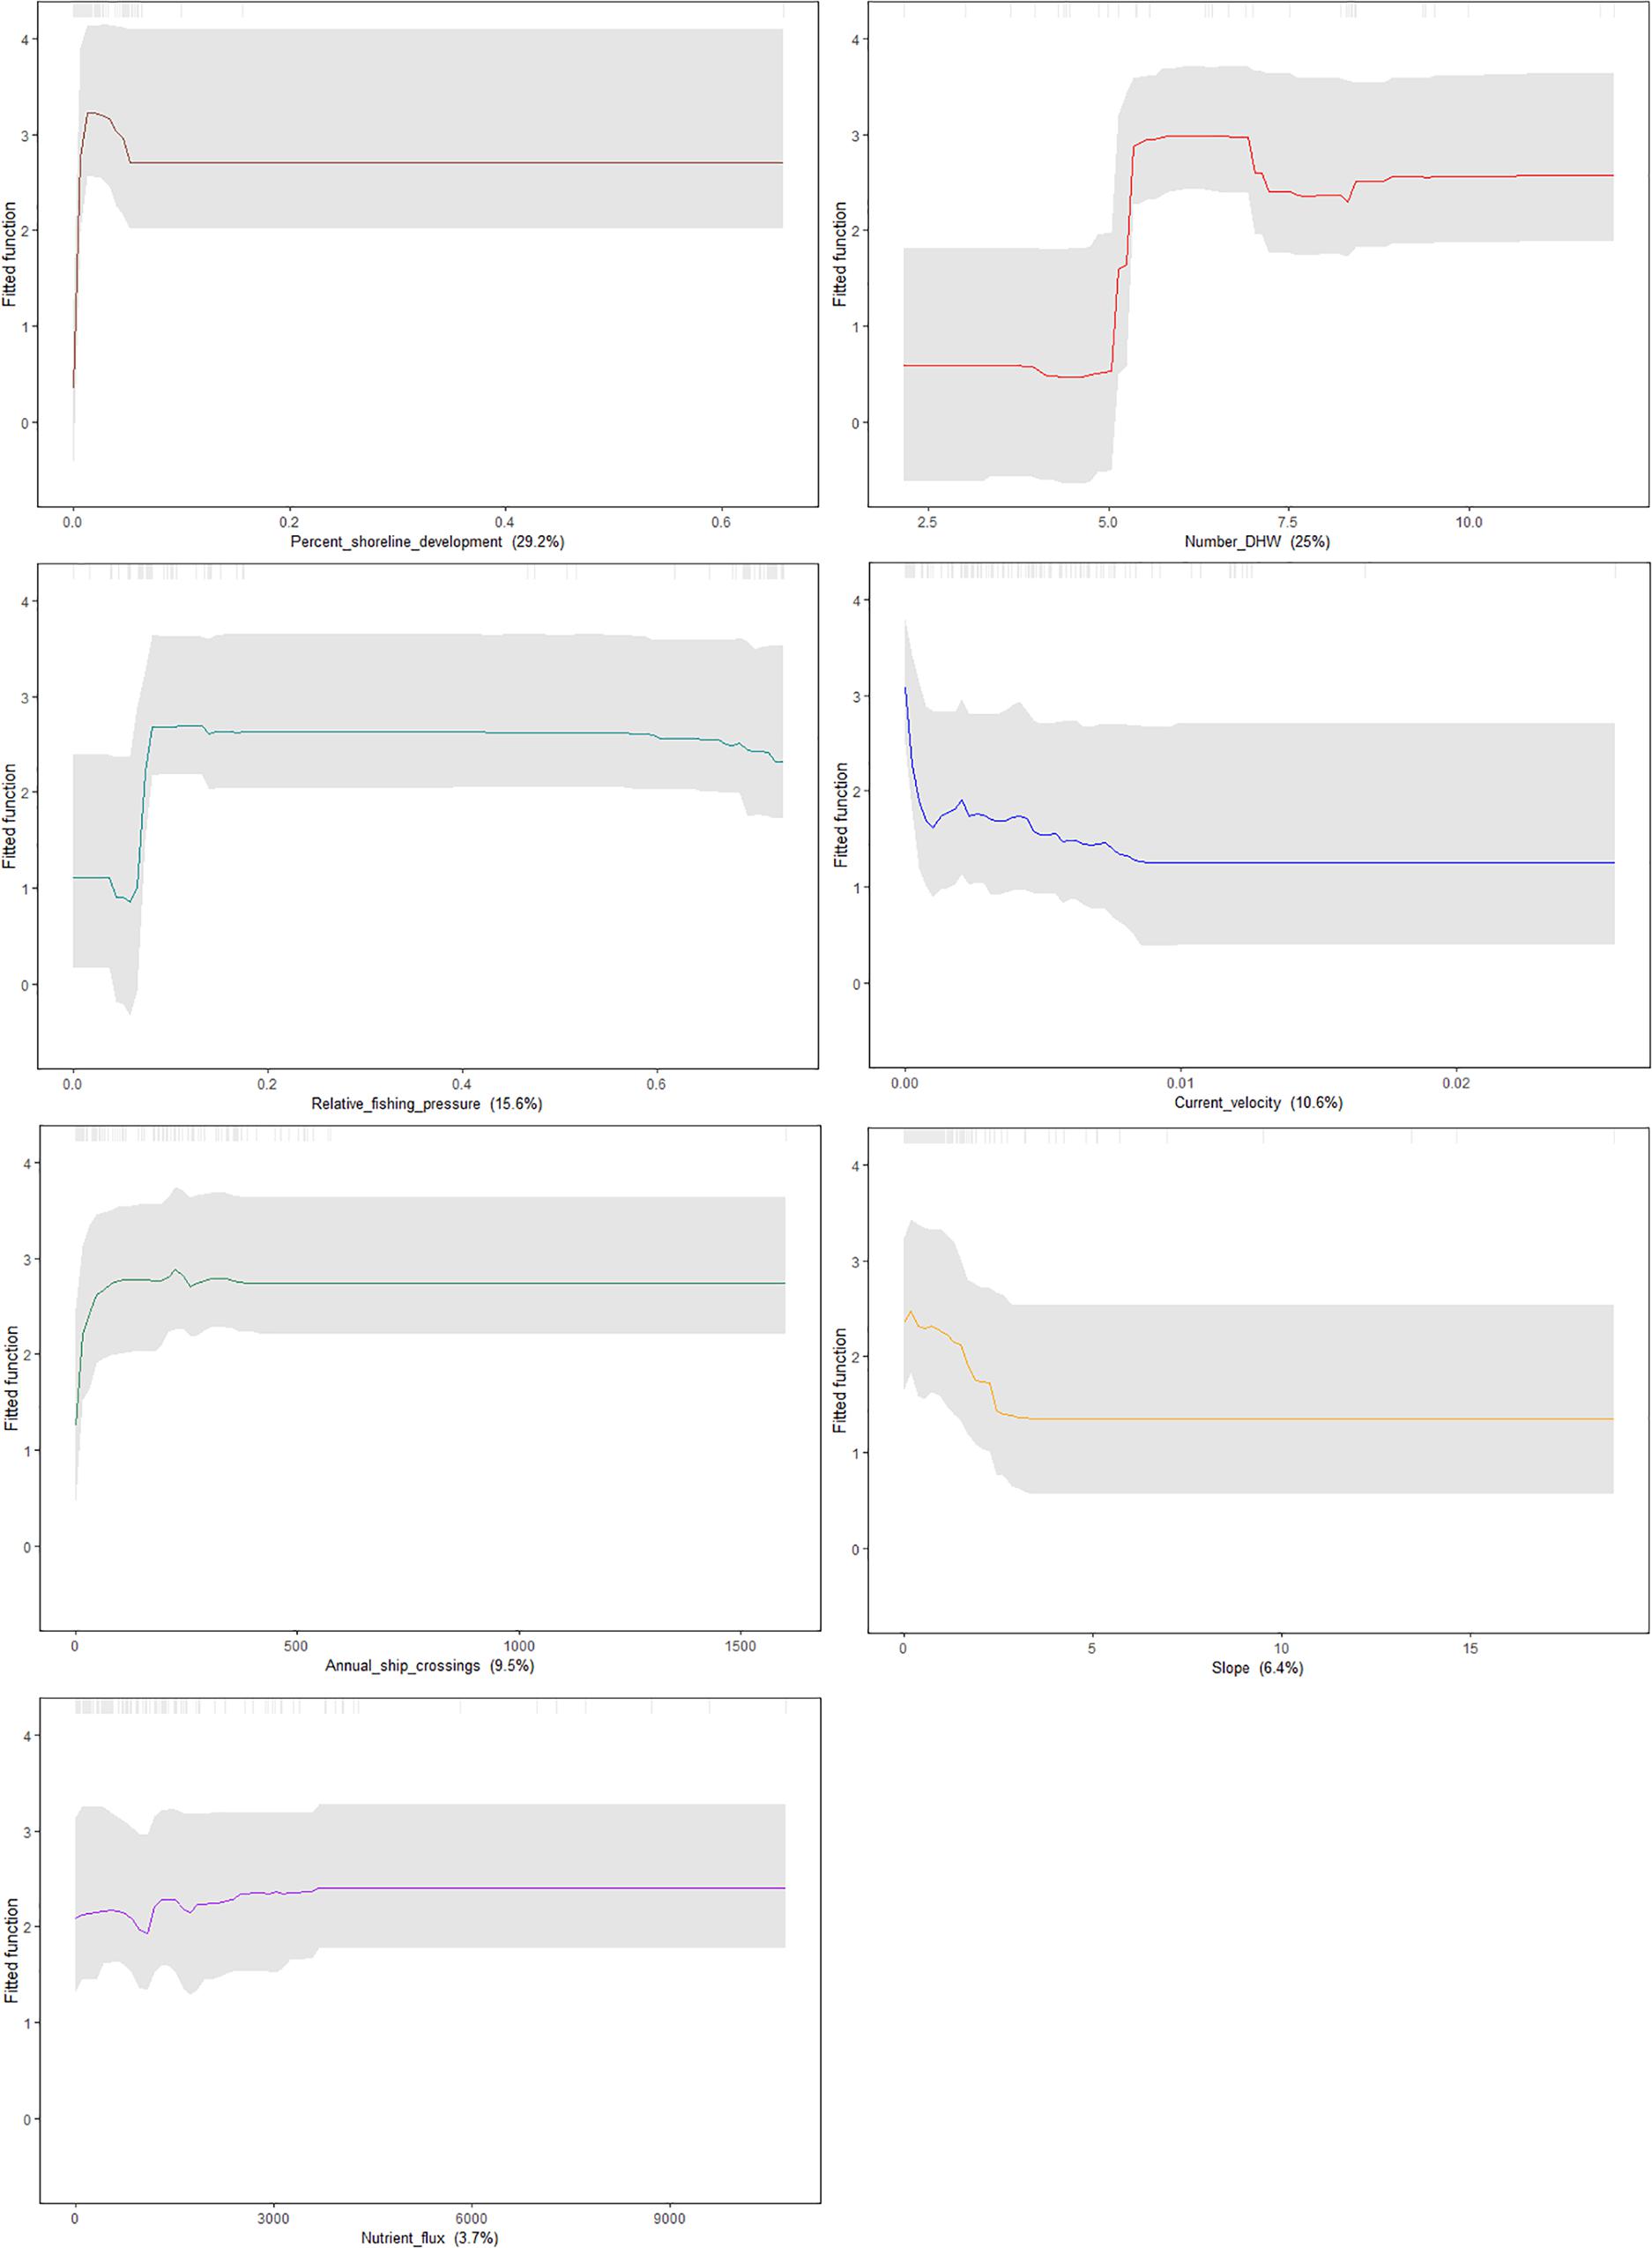
Figure 5. Partial dependence plots showing the marginal influence of each predictor (denoted in parentheses below each plot) on the probability of occurrence of A. amadelpha. Confidence intervals were generated by bootstrapping the model predictions 100 times and are signified by gray dashed lines.
Areas Highlighted as Hotspots
Areas around Oahu, identified by our model as most susceptible to A. amadelpha invasion include north Oahu, eastern Oahu, and much of the Honolulu metro area (Figure 6, inset A). Patches of these coastlines have been surveyed and are already invaded by A. amadelpha (Figure 2). We extended our model to identify environmentally suitable regions at risk for invasion across the surrounding MHI. Our results indicate that managers should concentrate surveys for A. amadelpha along the southern and western coasts of Maui Nui, western and eastern Hawaii, northern and eastern Kauai, and south Niihau (Figure 6). Model predictions extend approximately 1–2 km offshore and encompass the shoreline to the mesophotic zone (0–90 m). The model indicated that approximately one quarter (423 km2) of the modeled area (1,691 km2) is highly suitable A. amadelpha habitat (𝜃 ≥ 0.89, or third quantile cutoff value).
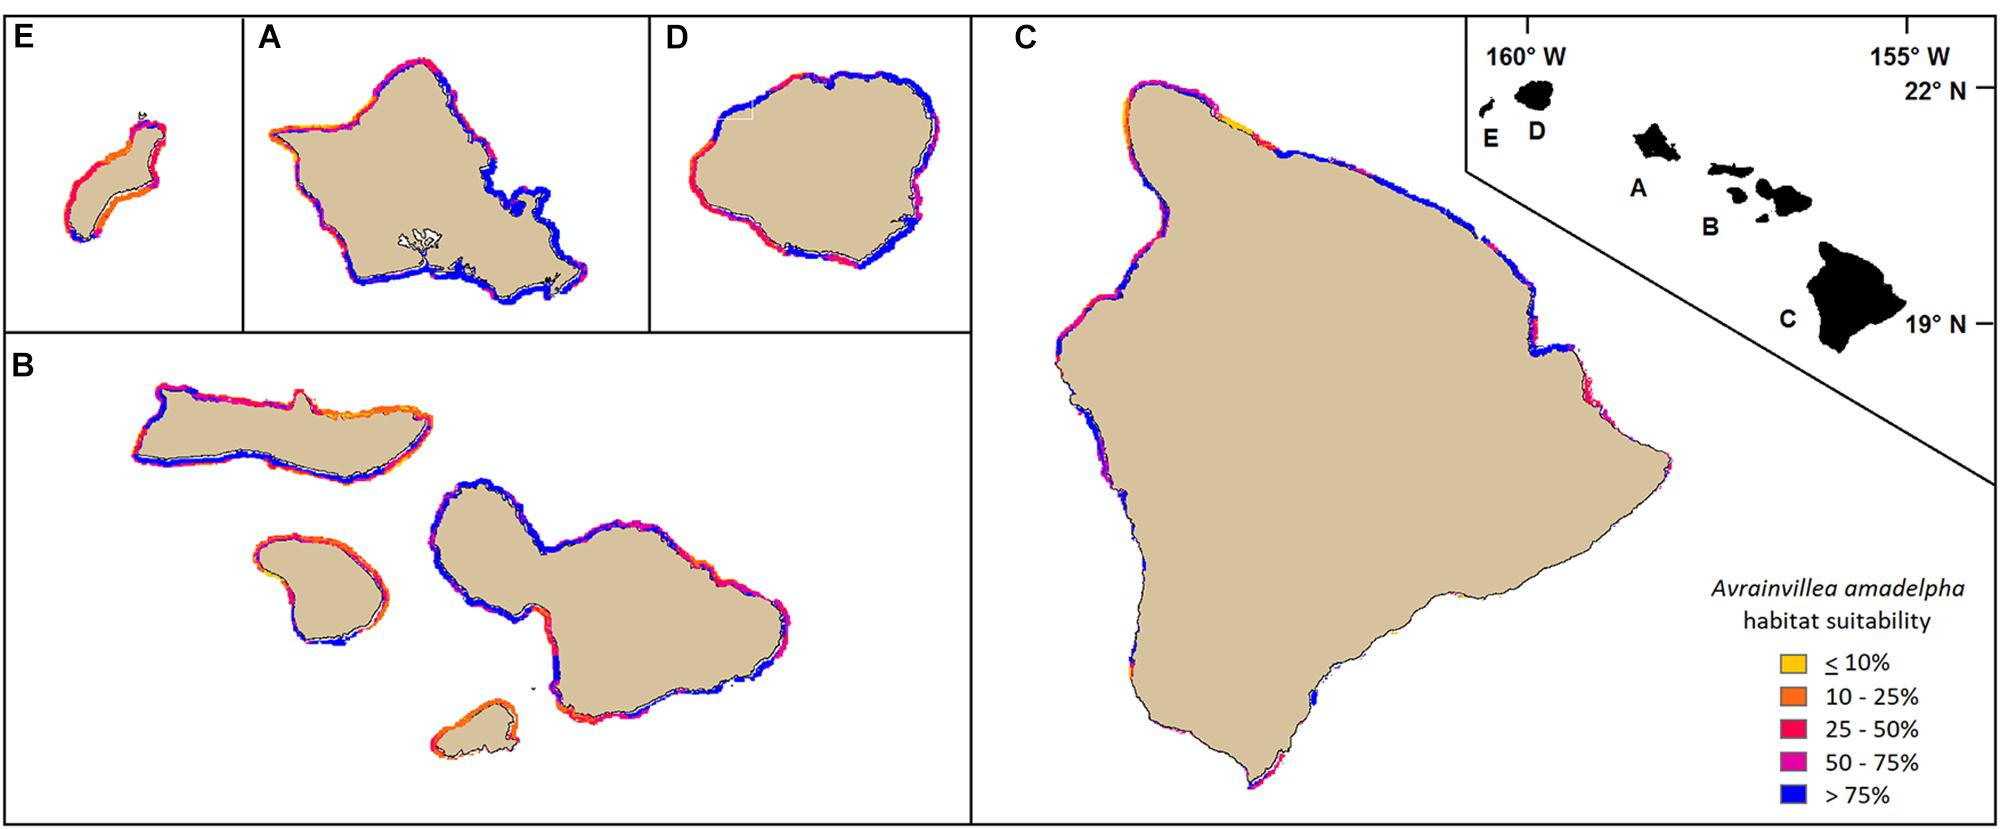
Figure 6. Mapped model predictions around the MHI (A: Oahu, B: Maui Nui, C: Hawaii, D: Kauai, E: Niihau) represented at 250 m raster resolution. Yellow or orange pixels indicate habitat less suitable for A. amadelpha invasion; red and purple pixels indicate regions identified as highly at risk for invasion.
Discussion
This is the first study to predictively model and map the present-day and potential distribution of invasive leather mudweed across Oahu and extrapolate results to surrounding islands in the event of potential future climate conditions. We highlight this approach as one possible management tool for prioritizing management and conservation efforts and in the face of changing anthropogenic and environmental drivers and future climate conditions.
Marine Habitat Susceptibility: Oceanographic and Topographic Factors
Shallow (0–30 m) marine regions identified as most susceptible to A. amadelpha colonization are relatively flat and experience minimal annual mean current flux. In other words: regions that meet or exceed the mean predicted present day occurrence probability of 63%, annual benthic current velocity = 0.01 m/s and mean slope = 1.4°. Littler et al. (2004) hypothesized that A. amadelpha mounds in Belize maximize productivity when they occur in protected, calm, and shallow embayments. We expect that relatively low seafloor current flux may indicate a lower mass of sunlight-blocking suspended matter. Peyton (2009) noted that A. amadelpha hosts epiphytes in its canopy that may act as “sunscreen” during periods of high light exposure, which suggests some level of high light intolerance in this alga.
In the mesophotic zone, A. amadelpha is most likely to colonize similarly flat, calm regions (annual seafloor current velocity = 0.01 m/s, mean slope = 3.7° for regions that meet or exceed the mean occurrence probability of 77%). Our analyses do not clearly reveal any distinct differences in the habitat preferences of A. amadelpha across depth gradients relating specifically to oceanographic drivers. If A. amadelpha continues to proliferate across the MHI, additional observations to the data set and subsequent updating of the model may tease out depth-specific differences in the settlement patterns of this invader.
Marine Habitat Susceptibility: Anthropogenic Factors
Our model suggested that anthropogenic stresses on land and in the sea may increase the possibility of A. amadelpha invasion. Regions adjacent to moderate, recent coastal development (about 10% more development from 2005 to 2010) or exposed to at least 400 ship crossings annually were identified as more susceptible to colonization by the invasive alga. Shoreline development did not appear to drive colonization patterns beyond the threshold of 10% relative construction. This metric includes sediment dispersal in the calculation of the relative value, and we theorize that sediment influx may negatively impact A. amadelpha metabolism beyond some minimal to moderate level, which may be why the trend flattens beyond the aforementioned threshold. Shipping traffic also shows some effect on habitat preference up to a certain point, but this relationship is clearly not linear, and further study may be warranted which contrasts ports known to contain A. amadelpha with those that are presently uninvaded.
The model also suggests that regions exposed to moderate fishing pressure are more prone to A. amadelpha invasion. Prior survey data (K. Peyton, Hawaii Conservation Conference; unpublished data) shows some correlation with the removal of herbivorous fish and urchins and the subsequent appearance of A. amadelpha. Though phase shifts may occur across overfished reefs (e.g., Hughes et al., 2007), researchers are uncertain about the role of grazing pressure in controlling the spread of an unpalatable invader like A. amadelpha (Van Heukelem, 2016). However, fishing catch was one of the factors that best explains the presence of A. amadelpha, which argues that the role of reduced herbivory must also be considered. Although herbivorous coral reef fish populations around Oahu are generally low (Williams et al., 2016), and the influence of reduced herbivory on the increase of A. amadelpha is unknown, the correlation between fishing pressure and spread of this alien invasive merits further study. We note that the partial dependency plot for fishing pressure (Figure 5) shows some reduction in probability of A. amadelpha occurrence for those regions exposed most intensely to fishing effort. We posit that this drop in occurrence probability as fishing stress intensifies may be akin to the same “Goldilocks”-type trend we observe in relation to coastal development and A. amadelpha occurrence: a little bit of stress- not too much, not too little- is just right for opening the door to this invader.
Invasion Risk Under a Changing Climate
Our model also indicated some influence of DHW on the susceptibility of habitat to A. amadelpha colonization. Eakin et al. (2010) note that thresholds of 8 and 12 DHW indicate high and very high risks of bleaching-related coral mortality, respectively. Our model indicated that regions experiencing at least 5 DHW during 2013–2016 were more suitable for A. amadelpha invasion. Cox et al. (2017) speculate that recent warming events in 2015 caused a die-back in abundant native intertidal macroalgae, facilitating the rapid spread of leather mudweed in this intertidal environment. They observed an opportunistic increase in abundance of A. amadelpha following the reduction in brown algae (Padina sanctae-crucis and Dictyota spp.), which dominate multiple intertidal sites around Oahu (Cox et al., 2017). This invasion notably followed a period of unseasonably warm, calm seas and a series of severe bleaching events from 2014 to 2017. The impact of warmer ocean temperatures and the resulting die-back of native macroalgae may also increase the success of more thermally resistant invasive species. We hypothesize that reefs destabilized from repeated heat stress are more susceptible to incursion of invasive species like A. amadelpha. More ecophysiological research is needed on the thermal tolerance and growth response of A. amadelpha.
In addition to using our model to highlight important stressors and the most vulnerable coastal regions island-wide based on present-day climatological conditions, we used our framework to forecast how reef vulnerability might change following a 25% increase in statewide maximum DHW. With all other predictors held constant (i.e., held at present-day values), our model predicted changes in habitat suitability per 250 m pixel ranging from decreases of up to 25% to increases as high as 61%. The west coast of Oahu and much of the southern coast experienced little to no increases, or even slight decreases, in overall vulnerability to A. amadelpha invasion. Portions of the northern and eastern coasts and patches of the Honolulu metro area displayed the most dramatic increases in vulnerability around Oahu (Figure 7, inset A). Across the other MHI, we observed increased vulnerability around the southern and western shores of Kauai and Maui Nui, and around northwestern and eastern Hawaii, including Hilo Bay (Figure 7).
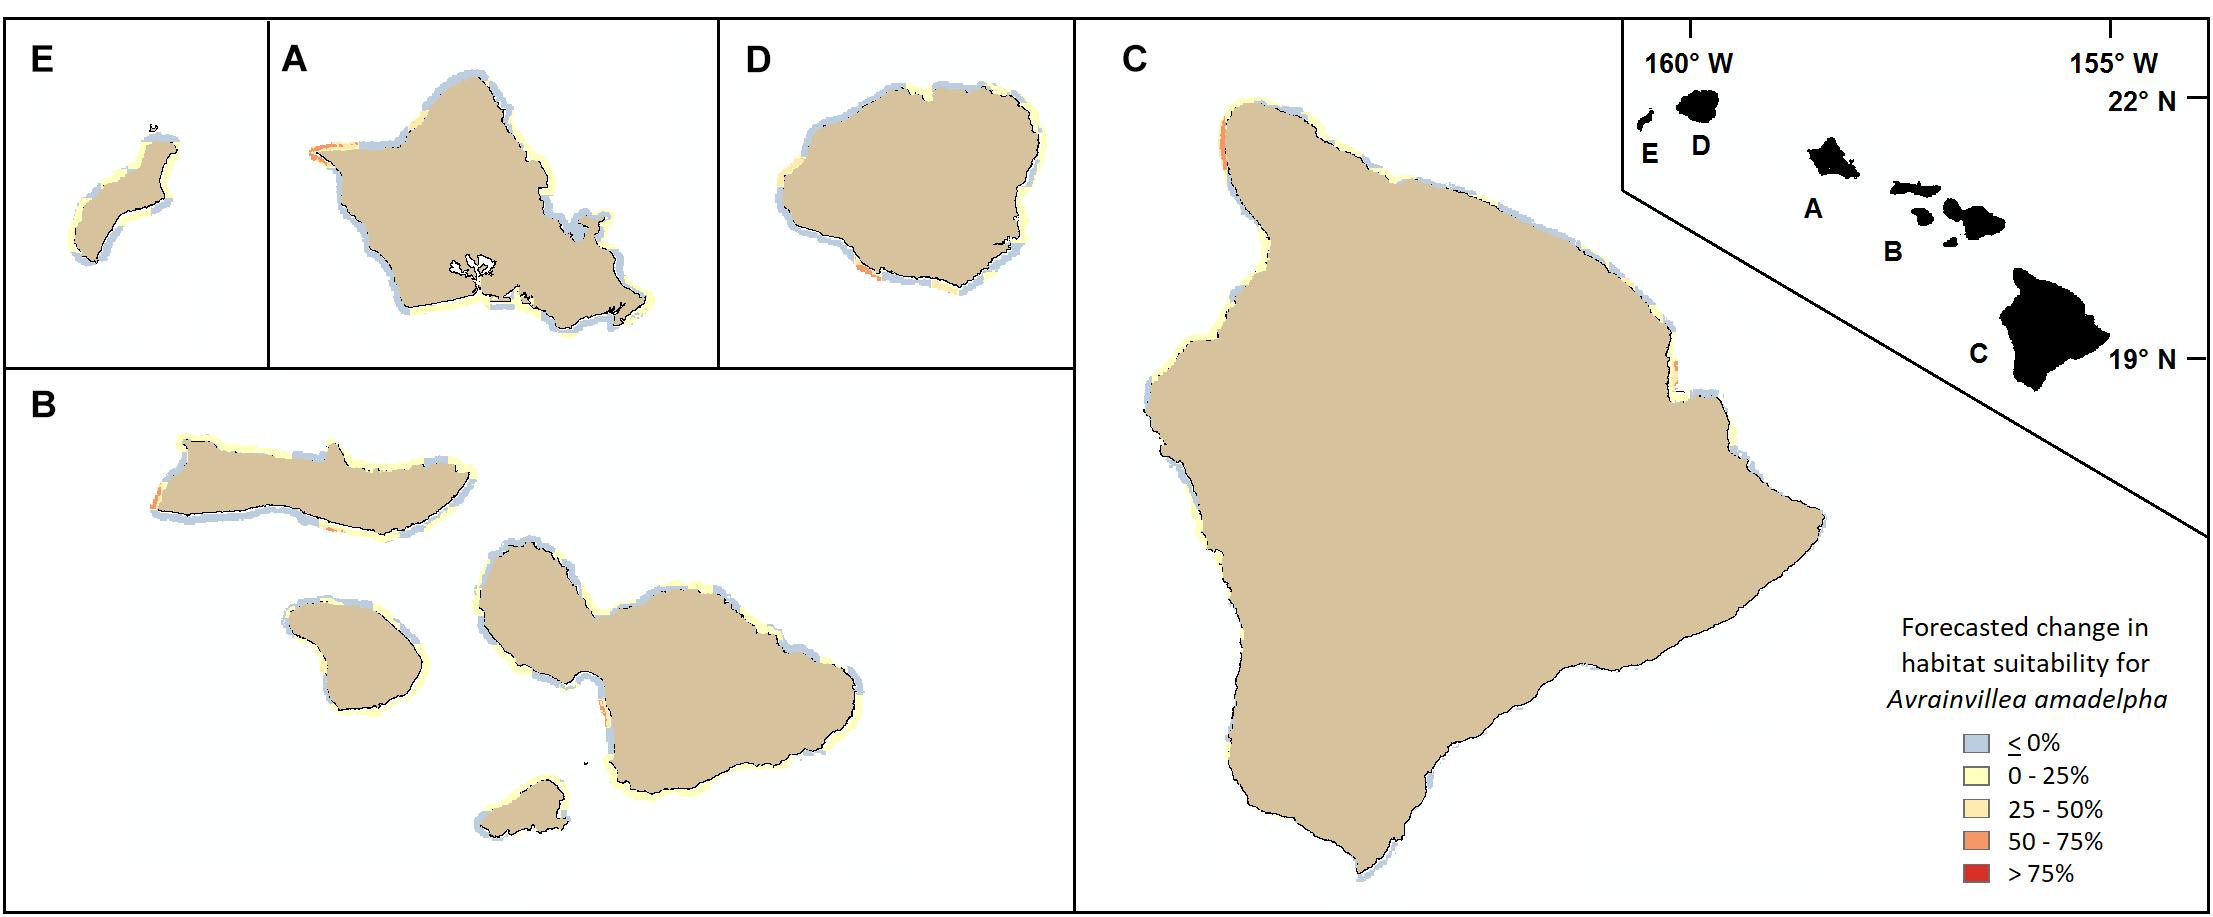
Figure 7. Forecasted changes in habitat vulnerability subsequent to a theoretical 25% increase in maximum DHW across all coasts of the MHI (A: Oahu, B: Maui Nui, C: Hawaii, D: Kauai, E: Niihau). Blue or yellow tones indicate slight decreases or no changes in susceptibility to invasion, while orange and red colors indicate increases in vulnerability compared to present day predictions.
Implications for Management
Our analyses did not reveal any obvious differences in A. amadelpha colonization patterns along a depth gradient. We caution that the absence of a clear difference between the shallow and mesophotic populations of the alga do not guarantee the effectiveness of a uniform management approach when dealing with the removal of this invader. We note that A. amadelpha is expensive, time-consuming, and- in the case of the mesophotic populations- potentially impossible to entirely eliminate for a given region. The aim of this study is specifically to guide management efforts during ongoing monitoring by identifying the portions of the coastline around the state that are most vulnerable to invasion in the near-term based on certain environmental characteristics.
We suggest that managers used the maps we have generated here to prioritize regions of concern. These maps may serve as early warnings for regions that provide recreation for residents and tourists, serve as important sustenance fisheries, or maintain inherent value due to their cultural significance. State agencies that monitor, protect, and preserve valuable natural resources across the land and sea, particularly in the face of a changing climate, must also contend with limited manpower and financial support. We hope that these maps may simplify and expedite the decision-making process of managers regarding monitoring and testing efforts to mitigate damage due to the incursion of invasive species.
Conclusion
Our model pinpointed one-quarter of the coastline of the MHI as particularly susceptible to A. amadelpha invasion (Figure 5). Our model indicates that A. amadelpha is a “Goldilocks”-style opportunist that favors regions exposed to a moderate amount of stress, particularly in the form of fishing pressure, coastal development, and warming seas.
Data Availability
The cleaned data sheet and R code used for these analyses are included in the Supplementary Material. Requests for additional raw data files and products may be submitted to the corresponding author.
Author Contributions
LV: study design. RW and HS: data sources. LV and OW: coding. LV, RT, RW, and HS: analysis. LV: wrote the first draft of the manuscript. All authors wrote subsections, contributed edits to revisions, and approved the submitted version of the manuscript.
Funding
Funding for this research was provided by the University of Hawaii Sea Grant College Program grant number NA14OAR4170071. Submersible and/or technical diving surveys were funded in part by grants from the National Oceanic and Atmospheric Administration’s (NOAA) National Undersea Research Program’s Hawaii Undersea Research Laboratory, Coral Reef Conservation Program, and Office of Ocean Exploration. Our project in Hawaii’s Intertidal surveys was funded by the Sea Grant (Grant Numbers R/IC-1 and #E/ET-63PD).
Conflict of Interest Statement
The authors declare that the research was conducted in the absence of any commercial or financial relationships that could be construed as a potential conflict of interest.
Acknowledgments
The authors thank M. Winston, B. Neilson, K. Tejchma, and C. Kelley for their assistance in acquiring critical observational data.
Supplementary Material
The Supplementary Material for this article can be found online at: https://www.frontiersin.org/articles/10.3389/fmars.2019.00402/full#supplementary-material
Footnotes
References
Aronson, R. B., and Precht, W. F. (2001). “White-band disease and the changing face of caribbean coral reefs.” in The Ecology and Etiology of Newly Emerging Marine Diseases, ed. J.W. Porter (Dordrecht: Springer), 25–38. doi: 10.1007/978-94-017-3284-0_2
Brandt, M. E., Smith, T. B., Correa, A. M., and Vega-Thurber, R. (2013). Disturbance driven colony fragmentation as a driver of a coral disease outbreak. PLoS One 8:e57164. doi: 10.1371/journal.pone.0057164
Brostoff, W. N. (1989). Avrainvillea amadelpha (Codiales, Chlorophyta) from Oahu, Hawaii. Pacif. Sci. 43, 166–169.
Bruno, J. F., Sweatman, H., Precht, W. F., Selig, E. R., and Schutte, V. G. (2009). Assessing evidence of phase shifts from coral to macroalgal dominance on coral reefs. Ecology 90, 1478–1484. doi: 10.1890/08-1781.1
Casey, J. M., Ainsworth, T. D., Choat, J. H., and Connolly, S. R. (2014). Farming behaviour of reef fishes increases the prevalence of coral disease associated microbes and black band disease. Proc. R. Soc. B. 281:20141032. doi: 10.1098/rspb.2014.1032
Cox, T. E., Spalding, H. L., and Foster, M. S. (2017). Spatial and temporal variation of diverse inter-tidal algal assemblages in Southwest Oahu. Mar. Ecol. 38:12429.
Dancey, C., and Reidy, J. (2004). Statistics Without Maths for Psychology. Harlow: Pearson Education Limited.
Eakin, C. M., Morgan, J. A., Heron, S. F., Smith, T. B., Liu, G., Alvarez-Filip, L., et al. (2010). Caribbean corals in crisis: record thermal stress, bleaching, and mortality in 2005. PLoS One 5:e13969. doi: 10.1371/journal.pone.0013969
Efron, B. (1979). Bootstrap methods: another look at the jackknife. Ann. Statist. 7, 1–26. doi: 10.1214/aos/1176344552
Elith, J., and Leathwick, J. (2017). Boosted Regression Trees for Ecological Modeling. R Documentation. Available at: https://cran.r-project.org/web/packages/dismo/vignettes/brt.pdf
Elith, J., Leathwick, J. R., and Hastie, T. (2008). A working guide to boosted regression trees. J. Anim. Ecol. 77, 802–813. doi: 10.1111/j.1365-2656.2008.01390.x
Falinski, K. (2016). Predicting Sediment Export into Tropical Coastal Ecosystems to Support Ridge to Reef Management. Ph.D. thesis, University of Hawaii at Manoa, Honolulu, HI.
Friedlander, A. M., Donovan, M. K., Stamoulis, K. A., Williams, I. D., Brown, E. K., Conklin, E. J., et al. (2017). Human-induced gradients of reef fish declines in the Hawaiian Archipelago viewed through the lens of traditional management boundaries. Aquat. Conserv. 28, 146–157. doi: 10.1002/aqc.2832
Friedman, J. H. (2001). Greedy function approximation: a gradient boosting machine. Ann. Statist. 29, 1189–1232.
Friedman, J. H., and Meulman, J. J. (2003). Multiple additive regression trees with application in epidemiology. Statist. Med. 22, 1365–1381. doi: 10.1002/sim.1501
Guisan, A., Thuiller, W., and Zimmermann, N. E. (2017). Habitat Suitability and Distribution Models:with Applications in R. Cambridge: Cambridge University Press.
Hastie, T., Tibshirani, R., and Friedman, J. H. (2001). The Elements of Statistical Learning: Data Mining,Inference, and Prediction. New York, NY: Springer-Verlag.
Hijmans, R. J., Phillips, S., Leathwick, J., Elith, J., and Hijmans, M. R. J. (2017). Package ‘dismo’. Circles 9:1.
Hillis, D. M., and Bull, J. J. (1993). An empirical test of bootstrapping as a method for assessing confidence in phylogenetic analysis. Syst. Biol. 42, 182–192. doi: 10.1093/sysbio/42.2.182
Hosmer, D., and Lemeshow, S. (2004). Applied Logistic Regression. New Jersey, NJ: John Wiley and Sons, Incorporated.
Hughes, T. P., Rodrigues, M. J., Bellwood, D. R., Ceccarelli, D., Hoegh-Guldberg, O., McCook, L., et al. (2007). Phase shifts, herbivory, and the resilience of coral reefs to climate change. Curr. Biol. 17, 360–365. doi: 10.1016/j.cub.2006.12.049
IPCC (2014). In Climate Change 2014: Synthesis Report. Contribution of Working Groups I, II and III to the Fifth Assessment Report of the Intergovernmental Panel on Climate Change, eds R. K. Pachauri and L. A. Meyer (Geneva: IPCC), 151.
Jouffray, J. B., Wedding, L. M., Norström, A. V., Donovan, M. K., Williams, G. J., Crowder, L. B., et al. (2019). Parsing human and biophysical drivers of coral reef regimes. Proc. R. Soc. B 286:20182544. doi: 10.1098/rspb.2018.2544
Kittinger, J. N., Bambico, T. M., Minton, D., Miller, A., Mejia, M., Kalei, N., et al. (2016). Restoring ecosystems, restoring community: socioeconomic and cultural dimensions of a community-based coral reef restoration project. Reg. Environ. Change 16, 301–313. doi: 10.1007/s10113-013-0572-x
Langston, R. C., and Spalding, H. L. (2017). A survey of fishes associated with Hawaiian deep-water Halimeda kanaloana (Bryopsidales: Halimedaceae) and Avrainvillea sp. (Bryopsidales: Udoteaceae) meadows. PeerJ. 5:e3307. doi: 10.7717/peerj.3307
Lecky, J. H. (2016). Ecosystem Vulnerability and Mapping Cumulative Impacts on Hawaiian Reefs. Ph.D. thesis, University of Hawaii at Manoa, Honolulu, HI.
Littler, M. M., and Littler, D. S. (1984). Models of tropical reef biogenesis: the contribution of algae. Prog. Phycol. Res. 3, 323–363.
Littler, M. M., Littler, D. S., and Brooks, B. L. (2004). Extraordinary mound building forms of Avrainvillea (Bryopsidales, Chlorophyta): their experimental taxonomy, comparative functional morphology and ecological strategies. Atoll Res. Bull. 515, 1–26. doi: 10.5479/si.00775630.515.1
Liu, G., Matrosova, L. E., Penland, C., Gledhill, D. K., Eakin, C. M., Webb, R. S., et al. (2008). “NOAA Coral Reef Watch Coral Bleaching Outlook System,” in Proceedings of the 11th International Coral Reef Symposium 2008, (Davie, FL: Nova Southeastern University National Coral Reef Institute), 956–960.
Liu, G., Rauenzahn, J. L., Heron, S. F., Eakin, C. M., Skirving, W. J., Christensen, T. R. L., et al. (2013). NOAA Coral Reef Watch 50 km Satellite Sea Surface Temperature-Based Decision Support System for Coral Bleaching Management. NOAA Technical Report NESDIS 143. College Park, MD: NOAA/NESDIS.
Longenecker, K. R., Bolick, H., and Kawamoto, R. (2011). Macrofaunal Invertebrate Communities on Hawaii’s Shallow Coral-reef Flats: Changes Associated with the Removal of an Invasive Alien Alga. Hawaii, HI: Bishop Museum Press.
MacManus, J. W., and Polsenberg, J. F. (2004). Coral–algal phase shifts on coral reefs: ecological and environmental aspects. Prog. Oceanogr. 60, 263–279. doi: 10.1016/j.pocean.2004.02.014
Martinez, J. A., Wolanski, E., and Richmond, R. A. (2009). The Effects of an Alien Invasive Alga on Sediment Retention and Resuspension in Coastal Hawaiian Waters and the Influence of Community based Restoration. Abstract Presented at the American Meteorological Society Fifth Education and Science Forum Session 4A, Coastal Areas, Wetlands and Oceans. Available at: https://ams.confex.com/ams/5EDUSCIFORUM/webprogram/Paper165411.html (accessed March 1, 2018).
McCook, L. J. (1999). Macroalgae, nutrients and phase shifts on coral reefs: scientific issues and management consequences for the Great Barrier Reef. Coral Reefs 18, 357–367. doi: 10.1007/s003380050213
Peyton, K. A. (2009). Aquatic invasive species impacts in Hawaiian soft sediment habitats. Ph.D. thesis, University of Hawaii at Manoa, Honolulu, HI.
Porter, J. W., Dustan, P., Jaap, W. C., Patterson, K. L., Kosmynin, V., Meier, O. W., et al. (2001). “Patterns of spread of coral disease in the Florida Keys,” in The Ecology and Etiology of Newly Emerging Marine Diseases, ed. J. W. Porter (Dordrecht: Springer), 1–24.
Pyle, R. L., Boland, R., Bolick, H., Bowen, B. W., Bradley, C. J., Kane, C., et al. (2016). A comprehensive investigation of mesophotic coral ecosystems in the Hawaiian Archipelago. PeerJ. 4:e2475. doi: 10.7717/peerj.2475
R Core Team. (2017). R: A Language and Environment for Statistical Computing. Vienna: R Foundation for Statistical Computing.
Redding, J. E., Myers-Miller, R. L., Baker, D. M., Fogel, M., Raymundo, L. J., and Kim, K. (2013). Link between sewage-derived nitrogen pollution and coral disease severity in Guam. Mar. Pollut. Bull. 73, 57–63. doi: 10.1016/j.marpolbul.2013.06.002
Rodgers, K. U., Cox, E., and Newtson, C. (2003). Effects of mechanical fracturing and experimental trampling on Hawaiian corals. Environ. Manag. 31, 0377–0384.
Rogers, C. S., and Miller, J. (2006). Permanent ‘phase shifts’ or reversible declines in coral cover? Lack of recovery of two coral reefs in St. John, US Virgin Islands. Mar. Ecol. Prog. Ser. 306, 103–114. doi: 10.3354/meps306103
Sansone, F. J., Spalding, H. L., and Smith, C. M. (2017). Sediment Biogeochemistry of Mesophotic Meadows of Calcifying Macroalgae. Aquat. Geochem. 23, 141–164. doi: 10.1007/s10498-017-9315-9
Schaffelke, B., Smith, J. E., and Hewitt, C. L. (2006). Introduced macroalgae–a growing concern. J. Appl. Phycol. 18, 529–541. doi: 10.1007/s10811-006-9074-2
Smith, J. E., Hunter, C. L., and Smith, C. M. (2002). Distribution and reproductive characteristics of nonindigenous and invasive marine algae in the Hawaiian Islands. Pacif. Sci. 56, 299–315. doi: 10.1353/psc.2002.0030
Spalding, H. L. (2012). Ecology of mesophotic macroalgae and Halimeda kanaloana meadows in the main Hawaiian Islands. Ph.D. thesis, University of Hawaii at Manoa, Honolulu, HI.
Stamoulis, K. A., Friedlander, A. M., Meyer, C. G., Fernandez-Silva, I., and Toonen, R. J. (2017). Coral reef grazer-benthos dynamics complicated by invasive algae in a small marine reserve. Sci. Rep. 7:43819. doi: 10.1038/srep43819
Stimson, J., Larned, S., and McDermid, K. (1996). Seasonal growth of the coral reef macroalga Dictyosphaeria cavernosa (Forskål) Børgesen and the effects of nutrient availability, temperature and herbivory on growth rate. J. Exp. Mar. Biol. Ecol. 196, 53–77. doi: 10.1016/0022-0981(95)00123-9
Takesue, R. K., and Storlazzi, C. D. (2017). Sources and dispersal of land-based runoff from small Hawaiian drainages to a coral reef: insights from geochemical signatures. Estuar. Coast. Shelf Sci. 188, 69–80. doi: 10.1016/j.ecss.2017.02.013
Van Heukelem, L. (2016). Does the initial diet of hatchery-reared Tripneustes gratilla impact their effectiveness as a biocontrol for invasive seaweeds. Ph.D. thesis, University of Hawaii at Manoa, Honolulu, HI.
Vega-Thurber, R. L., Burkepile, D. E., Fuchs, C., Shantz, A. A., McMinds, R., and Zaneveld, J. R. (2014). Chronic nutrient enrichment increases prevalence and severity of coral disease and bleaching. Glob. Change Biol. 70, 544–554. doi: 10.1111/gcb.12450
Wade, R. M., and Sherwood, A. R. (2018). Updating Plakobranchus cf. ianthobapsus (Gastropoda, Sacoglossa) host use: diverse algal-animal interactions revealed by NGS with implications for invasive species management. Mol. Phylogenet. Evol. 128, 172–181. doi: 10.1016/j.ympev.2018.07.010
Walters, L. J., and Smith, C. M. (1994). Rapid rhizoid production in Halimeda discoidea fragments – a mechanism for survival after separation from adult thalli. J. Exp. Mar. Biol. Ecol. 175, 105–120. doi: 10.1016/0022-0981(94)90178-3
Wedding, L. M., Lecky, J. H., Gove, J., Walecka, H., Donovan, M. K., Williams, G. J., et al. (2018). Advancing the integration of spatial data to map human and natural drivers on coral reefs. PLoS One 13:e0189792. doi: 10.1371/journal.pone.0189792
Westbrook, C. E., Ringang, R. R., Cantero, S. M. A., and Toonen, R. J. (2015). Survivorship and feeding preferences among size classes of outplanted sea urchins, Tripneustes gratilla, and possible use as biocontrol for invasive alien algae. PeerJ. 3:e1235. doi: 10.7717/peerj.1235
Keywords: biodiversity management, boosted regression trees, invasive species, macroalgae, mesophotic, species distribution model
Citation: Veazey L, Williams O, Wade R, Toonen R and Spalding HL (2019) Present-Day Distribution and Potential Spread of the Invasive Green Alga Avrainvillea amadelpha Around the Main Hawaiian Islands. Front. Mar. Sci. 6:402. doi: 10.3389/fmars.2019.00402
Received: 10 April 2019; Accepted: 27 June 2019;
Published: 26 July 2019.
Edited by:
Vianney Denis, National Taiwan University, TaiwanReviewed by:
Jean-Baptiste Jouffray, Stockholm University, SwedenJack H. Laverick, University of Southern Denmark, Denmark
Copyright © 2019 Veazey, Williams, Wade, Toonen and Spalding. This is an open-access article distributed under the terms of the Creative Commons Attribution License (CC BY). The use, distribution or reproduction in other forums is permitted, provided the original author(s) and the copyright owner(s) are credited and that the original publication in this journal is cited, in accordance with accepted academic practice. No use, distribution or reproduction is permitted which does not comply with these terms.
*Correspondence: Lindsay Veazey, bGluZHNheXZAaGF3YWlpLmVkdQ==