 Samara M. Haver1,2*
 Michelle E. H. Fournet3
 Robert P. Dziak4
 Christine Gabriele5
 Jason Gedamke6Leila T. Hatch7
 Joseph Haxel1
 Scott A. Heppell2
 Megan F. McKenna8
 David K. Mellinger1
 Sofie M. Van Parijs9
- 1Cooperative Institute for Marine Resources Studies, NOAA Pacific Marine Environmental Laboratory and Oregon State University, Hatfield Marine Science Center, Newport, OR, United States
- 2Department of Fisheries and Wildlife, Oregon State University, Corvallis, OR, United States
- 3Bioacoustics Research Program, Cornell Lab of Ornithology, Cornell University, Ithaca, NY, United States
- 4NOAA Pacific Marine Environmental Laboratory, Hatfield Marine Science Center, Newport, OR, United States
- 5Glacier Bay National Park and Preserve, Gustavus, AK, United States
- 6Office of Science and Technology, NOAA Fisheries, Silver Spring, MD, United States
- 7Gerry E. Studds Stellwagen Bank National Marine Sanctuary, NOAA Office of National Marine Sanctuaries, Scituate, MA, United States
- 8National Park Service, Natural Sounds and Night Skies Division, Fort Collins, CO, United States
- 9NOAA Northeast Fisheries Science Center, Woods Hole, MA, United States
Passive acoustic sensors provide a cost-effective tool for monitoring marine environments. Documenting acoustic conditions among habitats can provide insights into temporal changes in ecosystem composition and anthropogenic impacts. Agencies tasked with safeguarding marine protected areas, such as the U.S. National Park Service and U.S. National Oceanic and Atmospheric Administration’s Office of National Marine Sanctuaries, are increasingly interested in using long-term monitoring of underwater sounds as a means of tracking species diversity and ecosystem health. In this study, low-frequency passive acoustic recordings were collected fall 2014 – spring 2018, using standardized instrumentation, from four marine protected areas across geographically disparate regions of the U.S. Economic Exclusive Zone: Northwest Atlantic, Northeast Pacific, South Pacific, and Caribbean. Recordings were analyzed for differences in seasonal conditions and to identify acoustic metrics useful for resource assessment across all sites. In addition to comparing ambient sound levels, a species common to all four sites, the humpback whale (Megaptera novaeangliae), was used to compare biological sound detection. Ambient sound levels varied across the sites and were driven by differences in animal vocalization rates, anthropogenic activity, and weather. The highest sound levels [dBRMS (50 Hz–1.5 kHz) re 1 μPa] were recorded in the Northwest Atlantic in Stellwagen Bank National Marine Sanctuary (Stellwagen) during the boreal winter–spring resulting from bioacoustic activity, vessel traffic, and high wind speeds. The lowest sound levels [dBRMS (50 Hz–1.5 kHz) re 1 μPa] were recorded in the Northeast Pacific adjacent to a vessel-restricted area of Glacier Bay National Park and Preserve (Glacier Bay) during the boreal summer. Humpback whales were detected seasonally in the southern latitude sites, and throughout the deployment periods in the northern latitude sites. Temporal trends in band and spectrum sound levels in Glacier Bay and the National Park of American Samoa were primarily driven by biological sound sources, while trends in Stellwagen and the Buck Island Reef National Monument were primarily driven by anthropogenic sources. These results highlight the variability of ambient sound conditions in marine protected areas in U.S. waters, and the utility of long-term soundscape monitoring for condition assessment in support of resource management.
Introduction
Sound is a critical component of the marine environment. Most, if not all, marine species use sound as a means of interacting with and interpreting their environment (Knowlton et al., 2016). Across taxa, acoustic cues are used in the marine environment to facilitate biological and ecological processes such as breeding, predator-prey interactions, navigation and habitat selection. For example, soniferous fish chorus during spawning seasons (Rowe and Hutchings, 2006), spiny lobsters emit “rasps” when confronted with predators (Patek et al., 2009), echolocating whales and dolphins use ultrasonic sounds to find and capture prey (Richardson et al., 1995), and larval reef species use acoustic cues to determine adequate settlement locations (Montgomery et al., 2006). Combined, these activities contribute to the acoustic diversity of a given marine environment, with animals creating and relying on unique acoustic signatures which can be compared within and between habitats. Characterizing these acoustic signals, as well as the ambient conditions that contain other sound components, is relevant for understanding an acoustic environment and for long-term assessment and management of ecosystem health in the marine environment.
The sources and acoustic characteristics of all biotic and abiotic ambient sounds present in a particular location and time are collectively defined as the “soundscape” (Pijanowski et al., 2011; International Organization for Standardization [ISO], 2017). Natural drivers such as climate and tectonics, as well as anthropogenic drivers such as economics and management, influence the presence and levels of sound sources within a soundscape (McKenna et al., 2012; Krause and Farina, 2016). Establishing baselines that document acoustic conditions over time and among different areas will facilitate ecosystem heath assessments by revealing the presence of vocalizing animals, anthropogenic activities, and environmental changes. Synthesis of these data allow for description and comparison of acoustic conditions that can be used to evaluate and adapt resource management strategies.
The value of passive acoustics for long-term monitoring was recently recognized within the Global Ocean Observing System (GOOS) committee, with the designation of “ocean sound” as an Essential Ocean Variable (EOV) (Tyack, 2017, 2018), as well as by the European Marine Strategy Framework Directive (European Union, 2008; Tasker et al., 2010). The U.S.’s Ocean Noise Reference Station (NRS) network, including sites presented in this study, was provided within EOV documentation as an example of a passive acoustic array that supports many of the global “ocean sound” observing objectives (Tyack, 2018). The NRS network was established in 2014 by the U.S.’s National Oceanic and Atmospheric Administration (NOAA) and National Parks Service (NPS) to document baseline low-frequency (10 Hz–2 kHz) sound levels and multi-year trends in ocean ambient sound within and near to the U.S. Exclusive Economic Zone (Haver et al., 2018). Composed of 12 identical calibrated autonomous passive acoustic instruments, the NRS Network includes placement of sensors within sanctuaries and national parks. The long-term acoustic data collected via the NRS network meet the GOOS steering committee’s call for comparable measurements of ocean sound levels and sources over time to define the effects of changes on individuals, populations, and ecosystems.
The NPS has used passive acoustic monitoring (PAM) to inform management of noise in terrestrial parks for many years, and more recently has extended monitoring efforts to underwater environments. Soundscapes within U.S. National Parks are considered to be resources based on intrinsic value as well as the values to wildlife and human visitors (National Park Service and U.S. Department of the Interior, 2006). Monitoring sources and levels of underwater ambient sound in parks is critical for identifying noise sources inappropriate to a park setting and understanding how noise interferes with visitor experience and affects a variety of marine wildlife. Similarly, NOAA’s Office of National Marine Sanctuaries (ONMS) implements place-based efforts to conserve designated marine areas. NOAA’s Ocean Noise Strategy (Gedamke et al., 2016) highlighted the importance of protecting the acoustic conditions of key marine habitats within NOAA’s jurisdiction, including within U.S. National Marine Sanctuaries (Hatch et al., 2016). However, NOAA does not directly manage noise sources or levels within sanctuaries (Hatch and Fristrup, 2009).
The long-term monitoring focus of the NRS facilitates standardized assessments of acoustic status and trends within a low-frequency band (10 Hz–2 kHz) that contains both considerable biological activity and a main contributor to chronic background noise in many marine environments, namely vessels (Southall et al., 2017). The frequency overlap between the acoustic signature of vessels and vocalizations that support critical life functions in marine mammals (particularly baleen whales), sonic fishes, and marine invertebrates can result in “masking,” when the perception of one sound by an animal is affected by the presence of another sound (Richardson et al., 1995; Clark et al., 2009). Loss or reduction in efficiency of information transfer due to masking can have consequences for marine animals that rely on sound to carry out basic life functions (e.g., foraging, navigation, communication with conspecifics) (Erbe et al., 2016b). Masking is not the only potential effect of increased noise; individual- and population-level effects such as stress (Rolland et al., 2012) and displacement (Small et al., 2017) can also occur.
In this study, we use data from the NRS network to provide baseline information on soundscapes in the relatively shallow waters (33–79 m) of three marine protected areas managed by the NPS (Glacier Bay National Park and Preserve, National Park of American Samoa, Buck Island Reef National Monument), and one U.S. National Marine Sanctuary (Stellwagen Bank). We extracted standardized acoustic metrics from the long-term data to understand biological activity, natural physical events, and anthropogenic activities across these locations. Specifically, we examined hypotheses that ambient sound levels within each site would differ by location (latitude and longitude) in accordance with season, vessel management schema (e.g., restrictions), physical environment of the site, and relative human population size in the nearest port (i.e., urban or remote) as a proxy for vessel traffic. We also identified a species common to all sites, the humpback whale (Megaptera novaeangliae), and analyzed recordings for occurrence of humpback whale vocalizations (i.e., song and non-song calls) as a proxy to assess low-frequency soniferous wildlife between diverse sites. Collectively, these metrics that describe each soundscape establish current baseline conditions and inform the management of these protected places.
Materials and Methods
Site Selection
Here, we compare low-frequency (10 Hz–2 kHz) sound levels in shallow water (33–79 m) soundscapes within four sites managed by either the U.S. NPS or ONMS. The presence of biological and anthropogenic activity and weather events all contribute to the measured sound levels at each site, and in some cases one source may dominate the soundscape. Further, the oceanographic conditions of each deployment site (including depth, temperature profile, complex bathymetry, and bottom type) affect how sound propagates to the monitoring site. Sites in secluded regions are only exposed to local sources, whereas exposed sites receive sound from both local and regional sources. The comparisons of the four soundscapes presented in this manuscript are based on data collected at a single hydrophone per area. Each deployment site was selected to be generally representative of each region. These analyses also aim to highlight how environmental differences are relevant to and may require attention in soundscape management.
Each site was chosen to capture conditions across a diversity of biological, anthropogenic, and oceanographic conditions (Table 1 and Figure 1). The Stellwagen Bank National Marine Sanctuary (Stellwagen), managed by ONMS, is located in the temperate Northwest Atlantic, offshore of the urban port of Boston, MA. This monitoring site at a depth of 79 m is located near the mid-latitude eastern border of Stellwagen on a gravel bottom. Stellwagen is a biologically rich area that is an important feeding ground for many species of marine mammals as well as some of the largest commercial fisheries in the United States (Hatch and Wright, 2007; Hatch et al., 2008). The National Park of American Samoa (American Samoa), managed by NPS, is located in the remote, equatorial South Pacific region, with little commercial vessel traffic present. The monitoring site is located in a sandy bottom habitat at a depth of 33 m near offshore reefs. Baleen whales migrate through the region (Robbins et al., 2011; Storlazzi et al., 2017). The Buck Island Reef National Monument (Virgin Islands) is located within the U.S. Virgin Islands in the tropical Southwest Atlantic in close proximity to many other Caribbean port cities and popular tourist destinations. The monitoring site is located along a steep shelf edge in 40 m of water on a sandy bottom (Figure 2), acoustically exposing the site to regional shipping traffic and migrating whales as well as local vessel traffic and soniferous fish. The Beardslee Island complex within Glacier Bay National Park and Preserve (Glacier Bay) is within a remote area of Southeast Alaska. Seasonally managed cruise ships, tour boats, and other small vessels transit the bay near the monitoring site, which is at a depth of 62 m (National Park Service, 2006), but the park is acoustically isolated from regional vessel traffic. Glacier Bay is a glacially carved estuary with one of the highest deglaciation and sedimentation rates in the world, resulting in a dynamic and relatively young ecosystem (Etherington et al., 2007). The region supports high marine biological diversity including species of birds, marine mammals, fishes, and invertebrates.
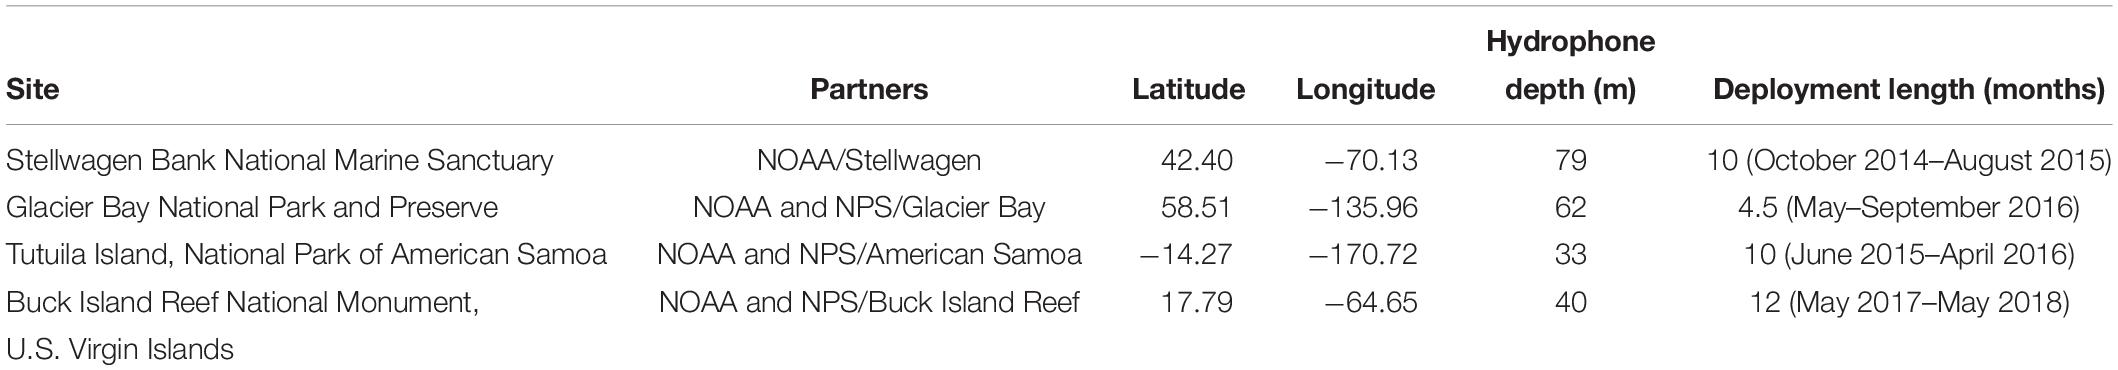
Table 1. Hydrophone deployment site details.
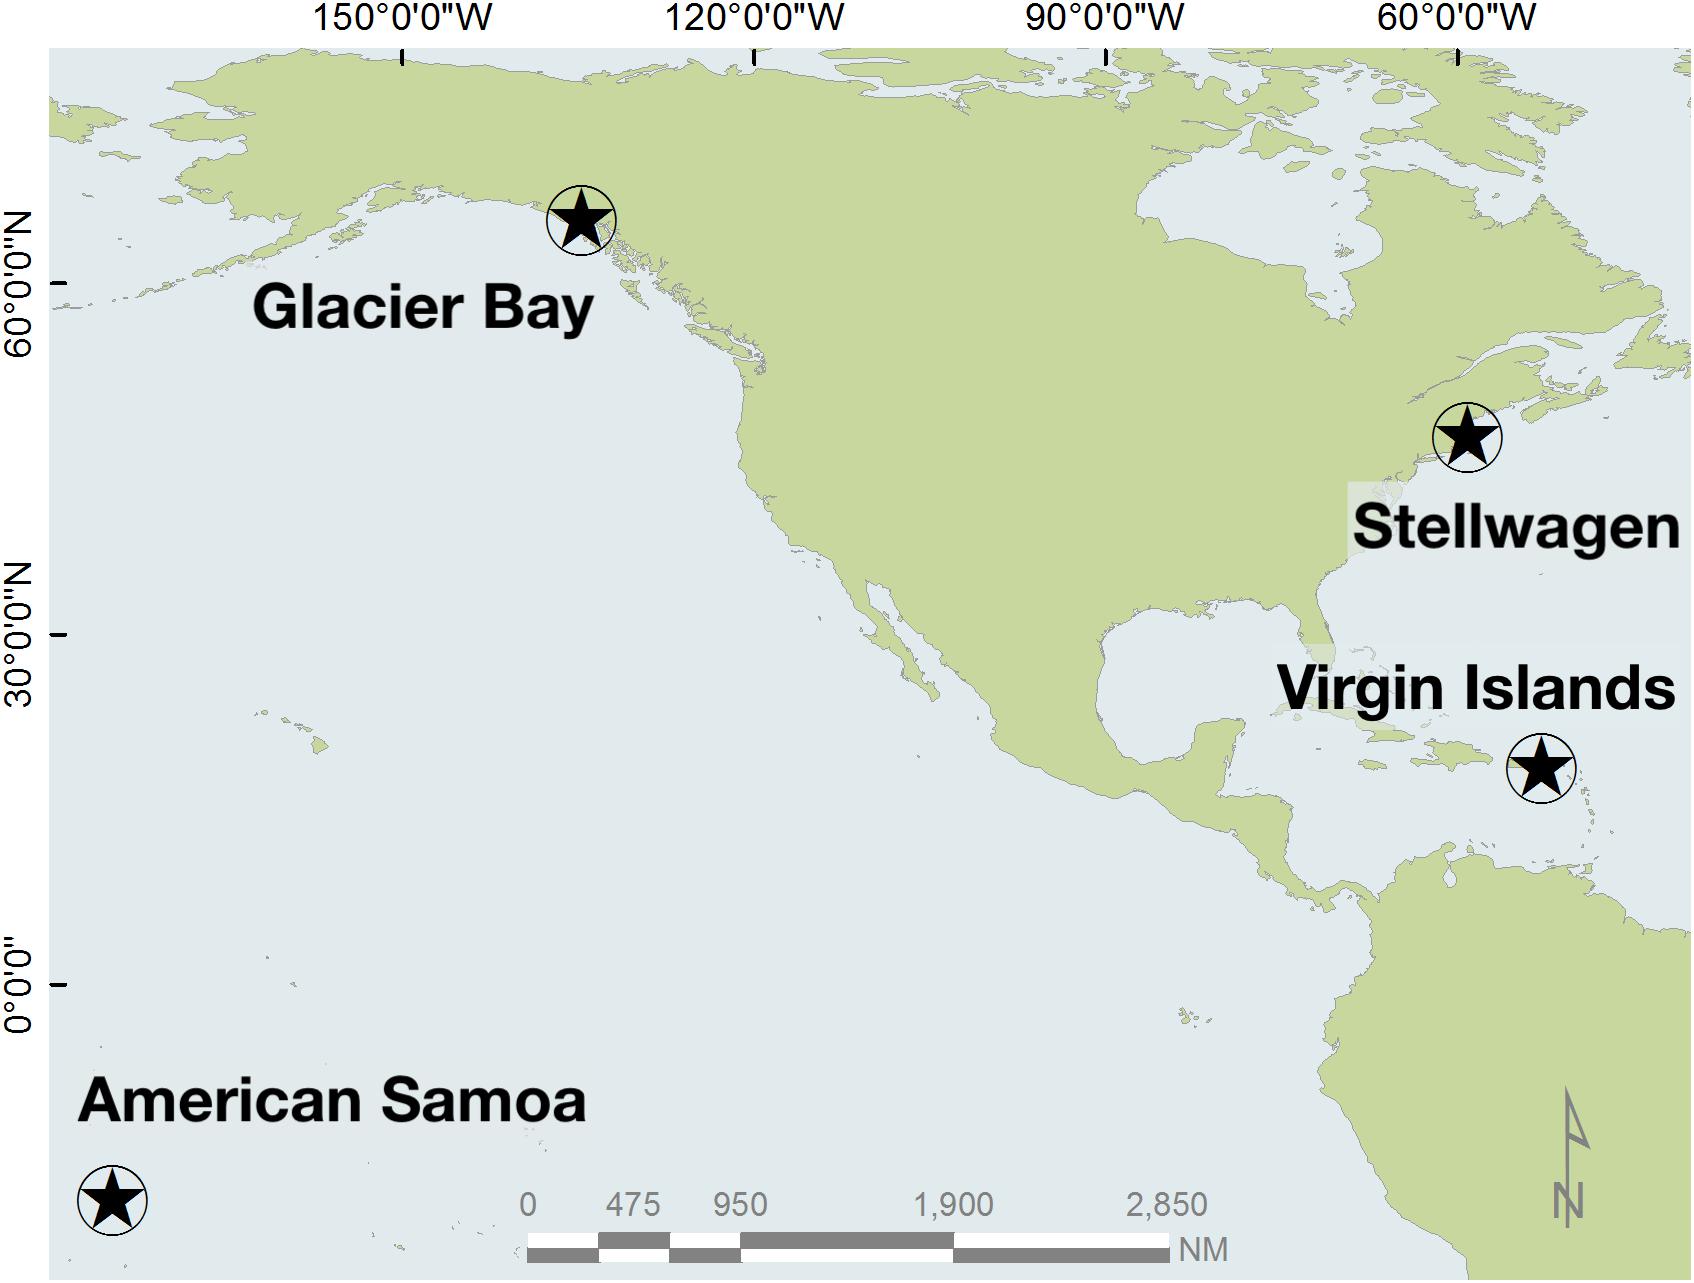
Figure 1. Map of recording sites: the National Park of American Samoa (American Samoa), the Glacier Bay National Park (Glacier Bay), the Stellwagen Bank National Marine Sanctuary (Stellwagen), and the Buck Island Reef National Monument (Virgin Islands).
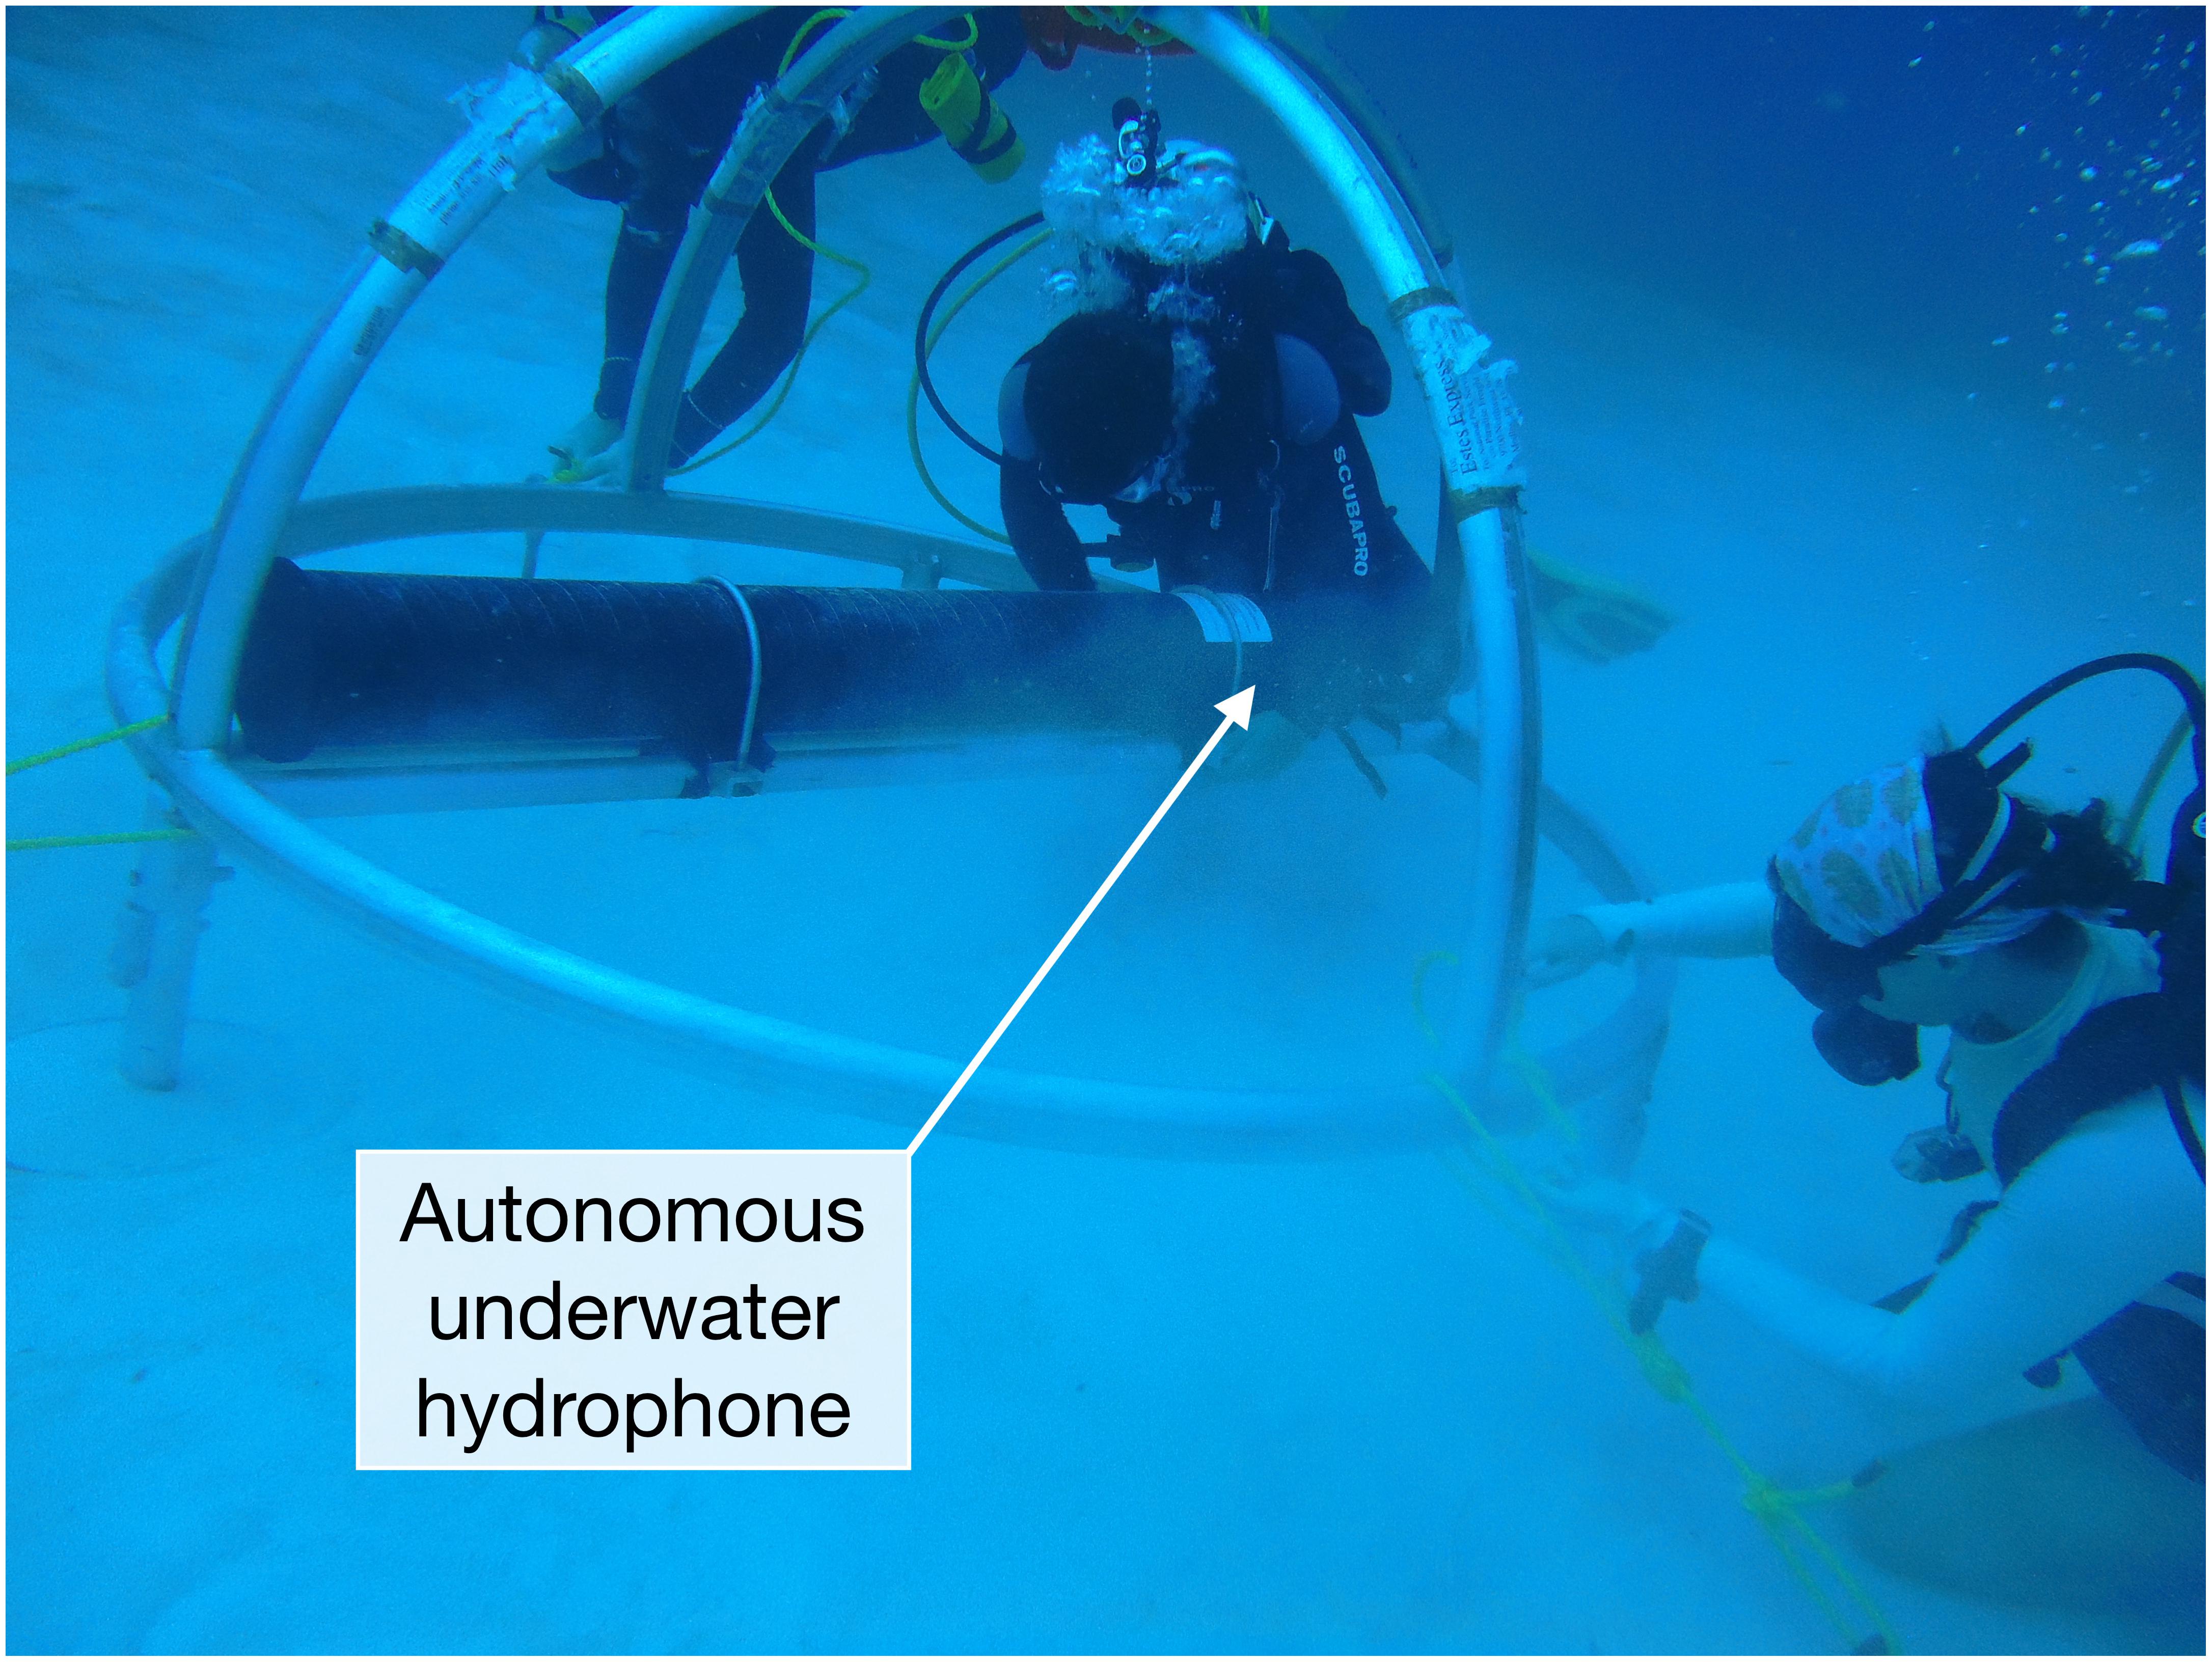
Figure 2. Divers deploying the Virgin Islands instrument. The instruments for all of the moorings used here consist of an acoustic data logging system housed in a composite pressure case and secured to a bottom-mounted metal frame (Photograph: Clayton Pollock/NPS, Virgin Islands).
The distinct biological, physical, and human activity patterns, as well as the environments of these protected areas drive the differences between the soundscapes. Across sites, we expected the lowest sound levels would be recorded during the boreal summer in Glacier Bay, a remote location where the number of vessels is regulated by daily (maximum of two cruise ships, three tour vessels, and thirty-one smaller vessels) and seasonal quotas, and the course and speed (13–20 kt depending on time of year) of vessels is often regulated in areas important to marine mammals (McKenna et al., 2017). We predicted biological sources would likely be the primary contributors to the Glacier Bay soundscape. Similarly, American Samoa, a remote site, was also predicted to be dominated by biological sources. We expected the highest sound levels would be recorded during the winter in the most urban site (Stellwagen) when wind, vessels, and biological sources would all likely contribute to the soundscape. Given that the Virgin Islands site is exposed to unmanaged local and regional vessel traffic and is in a biologically rich environment, we predicted that this site would experience relatively higher sound levels with contributions from both anthropogenic and biological sources. Further, this region is exposed to seasonal hurricanes which have the potential to significantly elevate sound levels during transient storm events.
Time periods sampled at each site varied within a three-and-a-half-year span (Table 1). The shortest recording was four and a half months in Glacier Bay (boreal summer season), while the longest was a full continuous year in Virgin Islands. In both Stellwagen and American Samoa, ten months of continuously recorded data were available for analysis (Figure 3). Although the temporal sampling periods of the sites were not entirely concurrent, simultaneous recordings were not necessary for the baseline measurements determined in this study.
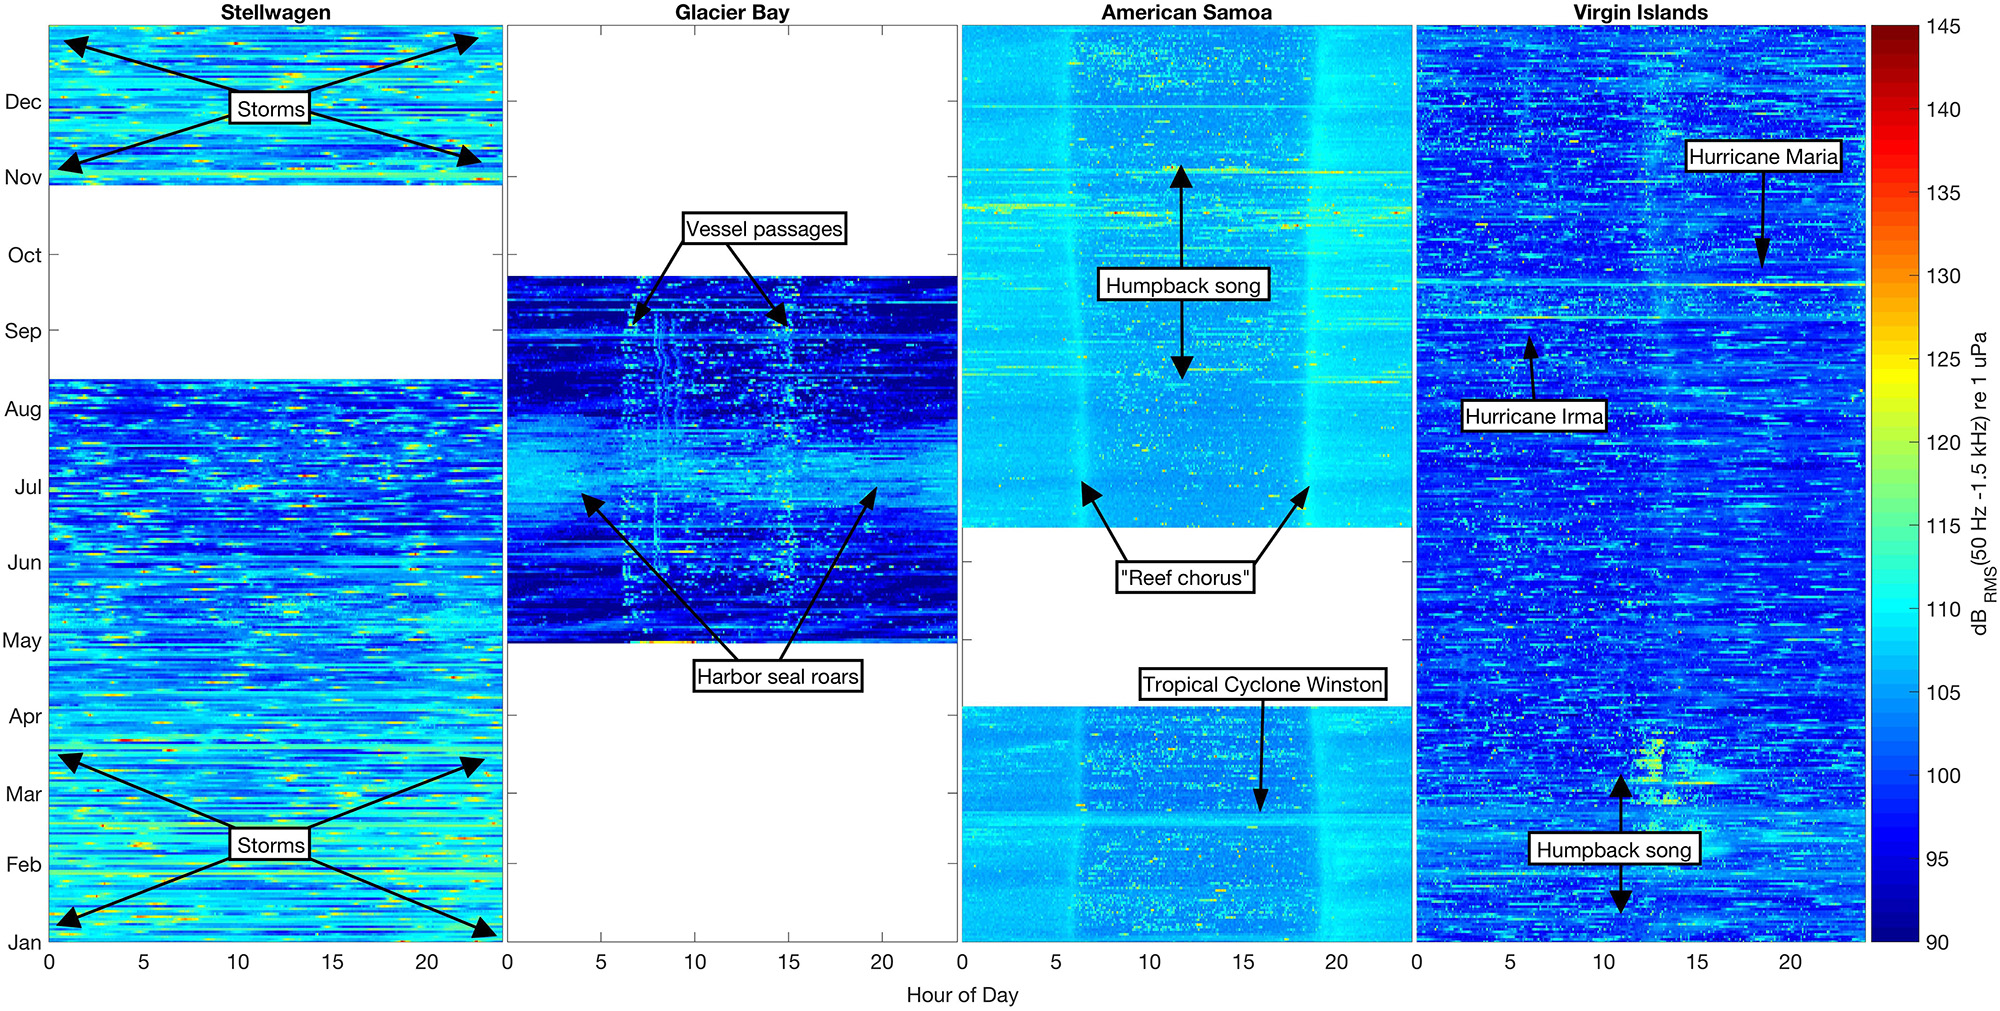
Figure 3. Sound levels in the 50 Hz–1.5 kHz band (dBRMS re 1 μPa) at four shallow-water mooring sites calculated in 5-min bins for all available data. Color (blue–yellow–red) indicates sound level intensity in each bin, with the lowest levels (90 dB) dark blue and the highest (145 dB) bright red. Each NRS site is plotted by month (January–December) and hour of day (0–24).
Instrumentation
Each NRS instrument contains a single passive model ITC-1032 (International Transducer Corp., Santa Barbara, CA, United States) acoustic archival autonomous underwater hydrophone (AUH) (Fox et al., 2001) with a sensitivity of -192 dB re 1 V/μ Pa and a flat frequency response (±1 dB) between 10 Hz and 2 kHz. Signals incoming to the AUH are conditioned by a pre-amplifier and a pre-whitening filter to maximize the dynamic range of the 16-bit acoustic data logging system. Each AUH was programed to record acoustic data continuously at a sample rate of 5 kHz with a (2 kHz low-pass cutoff) frequency (Haver et al., 2018). The AUH is designed such that there is no gap between the end of one recorded sound file and the start of the next.
Sounds at frequencies below 10 Hz were excluded to decrease the likelihood that the differences in bottom material and mooring depths of each hydrophone would limit sound propagation, as well as to avoid possible low-frequency current-generated flow noise on the mooring that might otherwise be difficult to distinguish from other sounds of interest and fall outside the flat frequency response of the hydrophone. Recordings were also manually reviewed for diurnal tidal flow noise contamination above 10 Hz, but such noise was not determined to be a strong driver of ambient sound levels.
Sound Level Metrics
To quantify ocean ambient sound levels at all sites, long-term spectral averages (LTSAs) of 10 Hz–2 kHz data were calculated from original data files (.DAT binary format) with custom MATLABTM (version 2018b, Mathworks, Inc.) software and results were summarized in 1 Hz/5 min bins. The 50 Hz–1.5 kHz band and 500 Hz frequency were selected for band sound level measurements (dBRMS re 1 μPa) to assess temporal trends in ambient sound in the overlapping frequency range of humpback whale vocalizations, vessel noise, and environmental sounds (Hildebrand, 2009; Fournet et al., 2018a). Deployment-long variations in the band levels were investigated with percentile values (10th, 50th, and 90th percentiles). The 10th percentile sound level is the value at which sound is quieter than this level 10% of the time, so it represents a value close to the noise floor; the 50th percentile is the median sound level; and the 90th percentile is the value at which sound exceeds this level 10% of the time, so it represents a typical high-noise condition.
In addition to the band measurements, spectral probability density plots (SPD; Merchant et al., 2013) were calculated to identify the empirical probability density (EPD) of the occurrence of power spectral density (PSD) sound levels in 1 Hz/5 min spectral bins (dB re 1 μPa2/Hz) at each site over the duration of the deployment. EPD values provide insight on how likely a sound level will occur within each frequency bin; rare events will have lower EPD and more commonly occurring sound levels will have a higher EPD. These metrics reveal the variation of sound levels within a specific frequency band and can highlight particular sources, and can also indicate the presence and temporal variation of the potential biological, natural physical, and anthropogenic drivers at the site.
Relationship of Physical Environment to Ambient Sound Levels
Wind is an important component of a soundscape (Wenz, 1962). To assess the extent to which wind speed conditions affect sound levels, wind speed measurements in Stellwagen (lighted buoy 44013) were retrieved from the NOAA National Data Buoy Center database (National Data Buoy Center, 1971), divided into 10 cm/s bins, and correlated with time-aligned sound levels. Wind speed measurements for American Samoa and Virgin Islands were sought, but ultimately not obtained due to lack of proximate data and/or insufficient temporal density. Records of major hurricanes and tropical storm events that occurred during the acoustic recording time period were obtained from the database maintained by the NOAA National Hurricane Center (Landsea and Franklin, 2013). Wind speed data were available for Glacier Bay, but were not included because analysis spanned only the boreal summer months (May–September) during which winds speeds contributed to ambient sound levels in only a minor way (Fournet et al., 2018a).
Contributions of Humpback Whale Vocalizations to Ambient Sound Levels
To assess spatio-temporal presence of low-frequency soniferous wildlife between diverse sites, we identified a common species, the humpback whale (M. novaeangliae), and analyzed recordings for occurrence of humpback whale vocalizations. Humpback whales are an ideal proxy for the study of soniferous and acoustically sensitive species as they are predictably present at all study sites, their vocal behavior in these regions is relatively well described, and the lower frequencies of their vocal range overlaps with important sonic species in each environment (e.g., sonic fishes, marine invertebrates, pinnipeds, and other cetaceans) which may also be affected by changes in ambient sound (Cerchio et al., 2001; Au et al., 2006; Stimpert et al., 2011; Fournet et al., 2015, 2018a; Cholewiak et al., 2018; Gabriele et al., 2018).
Humpback whales are acoustically active throughout their somewhat predictable migratory range. Humpback whales migrate between high latitude foraging grounds, including two of our monitoring sites (Glacier Bay, Stellwagen), in spring, summer, and fall months to low-latitude breeding grounds, including our other two sites (American Samoa, Virgin Islands), in winter months. Humpback whales across age and sex classes produce a suite of low-frequency vocalizations (50–5000 Hz) known as non-song calls or simply “calls” (Dunlop et al., 2007; Fournet et al., 2015) throughout the migratory corridor. Song, a longer more highly structured sequence of vocalizations that are hierarchically organized and produced only by male humpback whales, is produced predominantly on breeding grounds, but can also be detected throughout the migratory range (Gabriele and Frankel, 2002a,b; Stimpert et al., 2012). Migratory consistencies coupled with well-described acoustic behavior for all age-sex classes of humpback whales may permit us to extrapolate success rates in detecting humpback whale vocalizations to other biological sound sources in a given region and season.
To assess presence or absence of humpback whale vocalizations (songs or calls), original data files (.DAT binary format) were converted to WAVE audio file format (.wav) using custom MatlabTM routines. An automated detector, the generalized automated detection and classification system (DCS; Baumgartner and Mussoline, 2011), was used to identify humpback whale vocalizations via a multivariate discrimination analysis (comparing pitch tracks drawn through high energy tonal sounds) for acoustic data in Stellwagen, Virgin Islands, and American Samoa. A daily time scale was selected to tally presence or absence, and all DCS results were manually verified at a daily resolution to remove any false positives. To evaluate possible missed detections in DCS, entire days without any detected humpback whale vocalizations that occurred between entire days with positive detections were manually checked with Raven Pro 1.5 (Cornell Lab of Ornithology) interactive sound analysis software. For Glacier Bay, one hour of acoustic data per day was randomly subset and manually reviewed with Raven Pro 1.5 by an experienced observer (MF) for the presence of humpback whale calls. If calls were not identified on the initially selected recording, additional hours from the same day were randomly selected and reviewed until either a call was identified or all hours in a day were reviewed. As part of ongoing collaborative work in Glacier Bay, the annotation of daily humpback whale acoustic presence or absence was underway prior to the inception of this study, and obviated the need for automated detection.
Results
Variation in Ambient Sound Levels
We found unique seasonal, diel, and spectral ambient sound level patterns across the four sites. The variability in band sound levels [dBRMS (50 Hz–1.5 kHz) re 1 μPa] revealed how each environment was influenced by biological, environmental, and anthropogenic sound sources (Figure 3). Band sound levels were lower in Stellwagen during the summer months (June–August) compared to November–May, probably due to lower winds during the summer. There were no deployment-long diel trends in band sound levels recorded in Stellwagen, though there were numerous high-level transient events likely due to vessel passages (Figure 3). Compared to the variability of band sound levels in Stellwagen, band sound levels were relatively stable in Glacier Bay (boreal summer), American Samoa, and Virgin Islands, with source-driven daily weekly changes (Figure 3). In Glacier Bay, bioacoustic signaling is the source of increased band sound levels from late June to late July. A diel pattern is evident in the summer data from Glacier Bay (summer). Band sound levels increased twice per day, in the morning around 0600-0800 and in the afternoon around 1500, primarily due to timing of day-trip tourism vessels entering and exiting park waters. The seasonal band sound level variations observed in American Samoa (August–November) are related to humpback whale vocalizations, while the short-term band sound level increase in February is due to an isolated weather event. A distinct diel pattern of band sound levels was also observed in American Samoa throughout the recording time period; band sound levels were lower during daylight hours (compared to nighttime), with the highest daily levels recorded during crepuscular time periods. This diel pattern is likely due to bioacoustic signaling (e.g., urchins, shrimp, fish). A 29-day lunar cycle in sound levels (Kaplan et al., 2018) is also evident in American Samoa, with quieter periods throughout the day near full moons. Similar to patterns observed in American Samoa, seasonal band sound level variations observed in Virgin Islands were likely related to humpback whale vocalizations in February-March and short-term weather events in September. There were no deployment-long diel trends in band sound levels recorded in Virgin Islands.
Variability in sound spectrum levels across frequencies was investigated by calculating SPD plots (Figure 4). These metrics reveal distinct peaks in acoustic energy as well as the variation within a specific frequency band, and provide further insight into the biological, natural physical, and anthropogenic drivers at the site. In addition to frequency-specific SPD values, an overall SPD is calculated for each site to represent the overall probability of sound level consistency over time. Between the four sites, Stellwagen had the lowest overall SPD meaning it experiences the highest level of variability in sound levels across the measured frequency band, while the American Samoa site had the highest SPD meaning it has comparably stable acoustic conditions (Figure 4, upper-right corner of each panel).
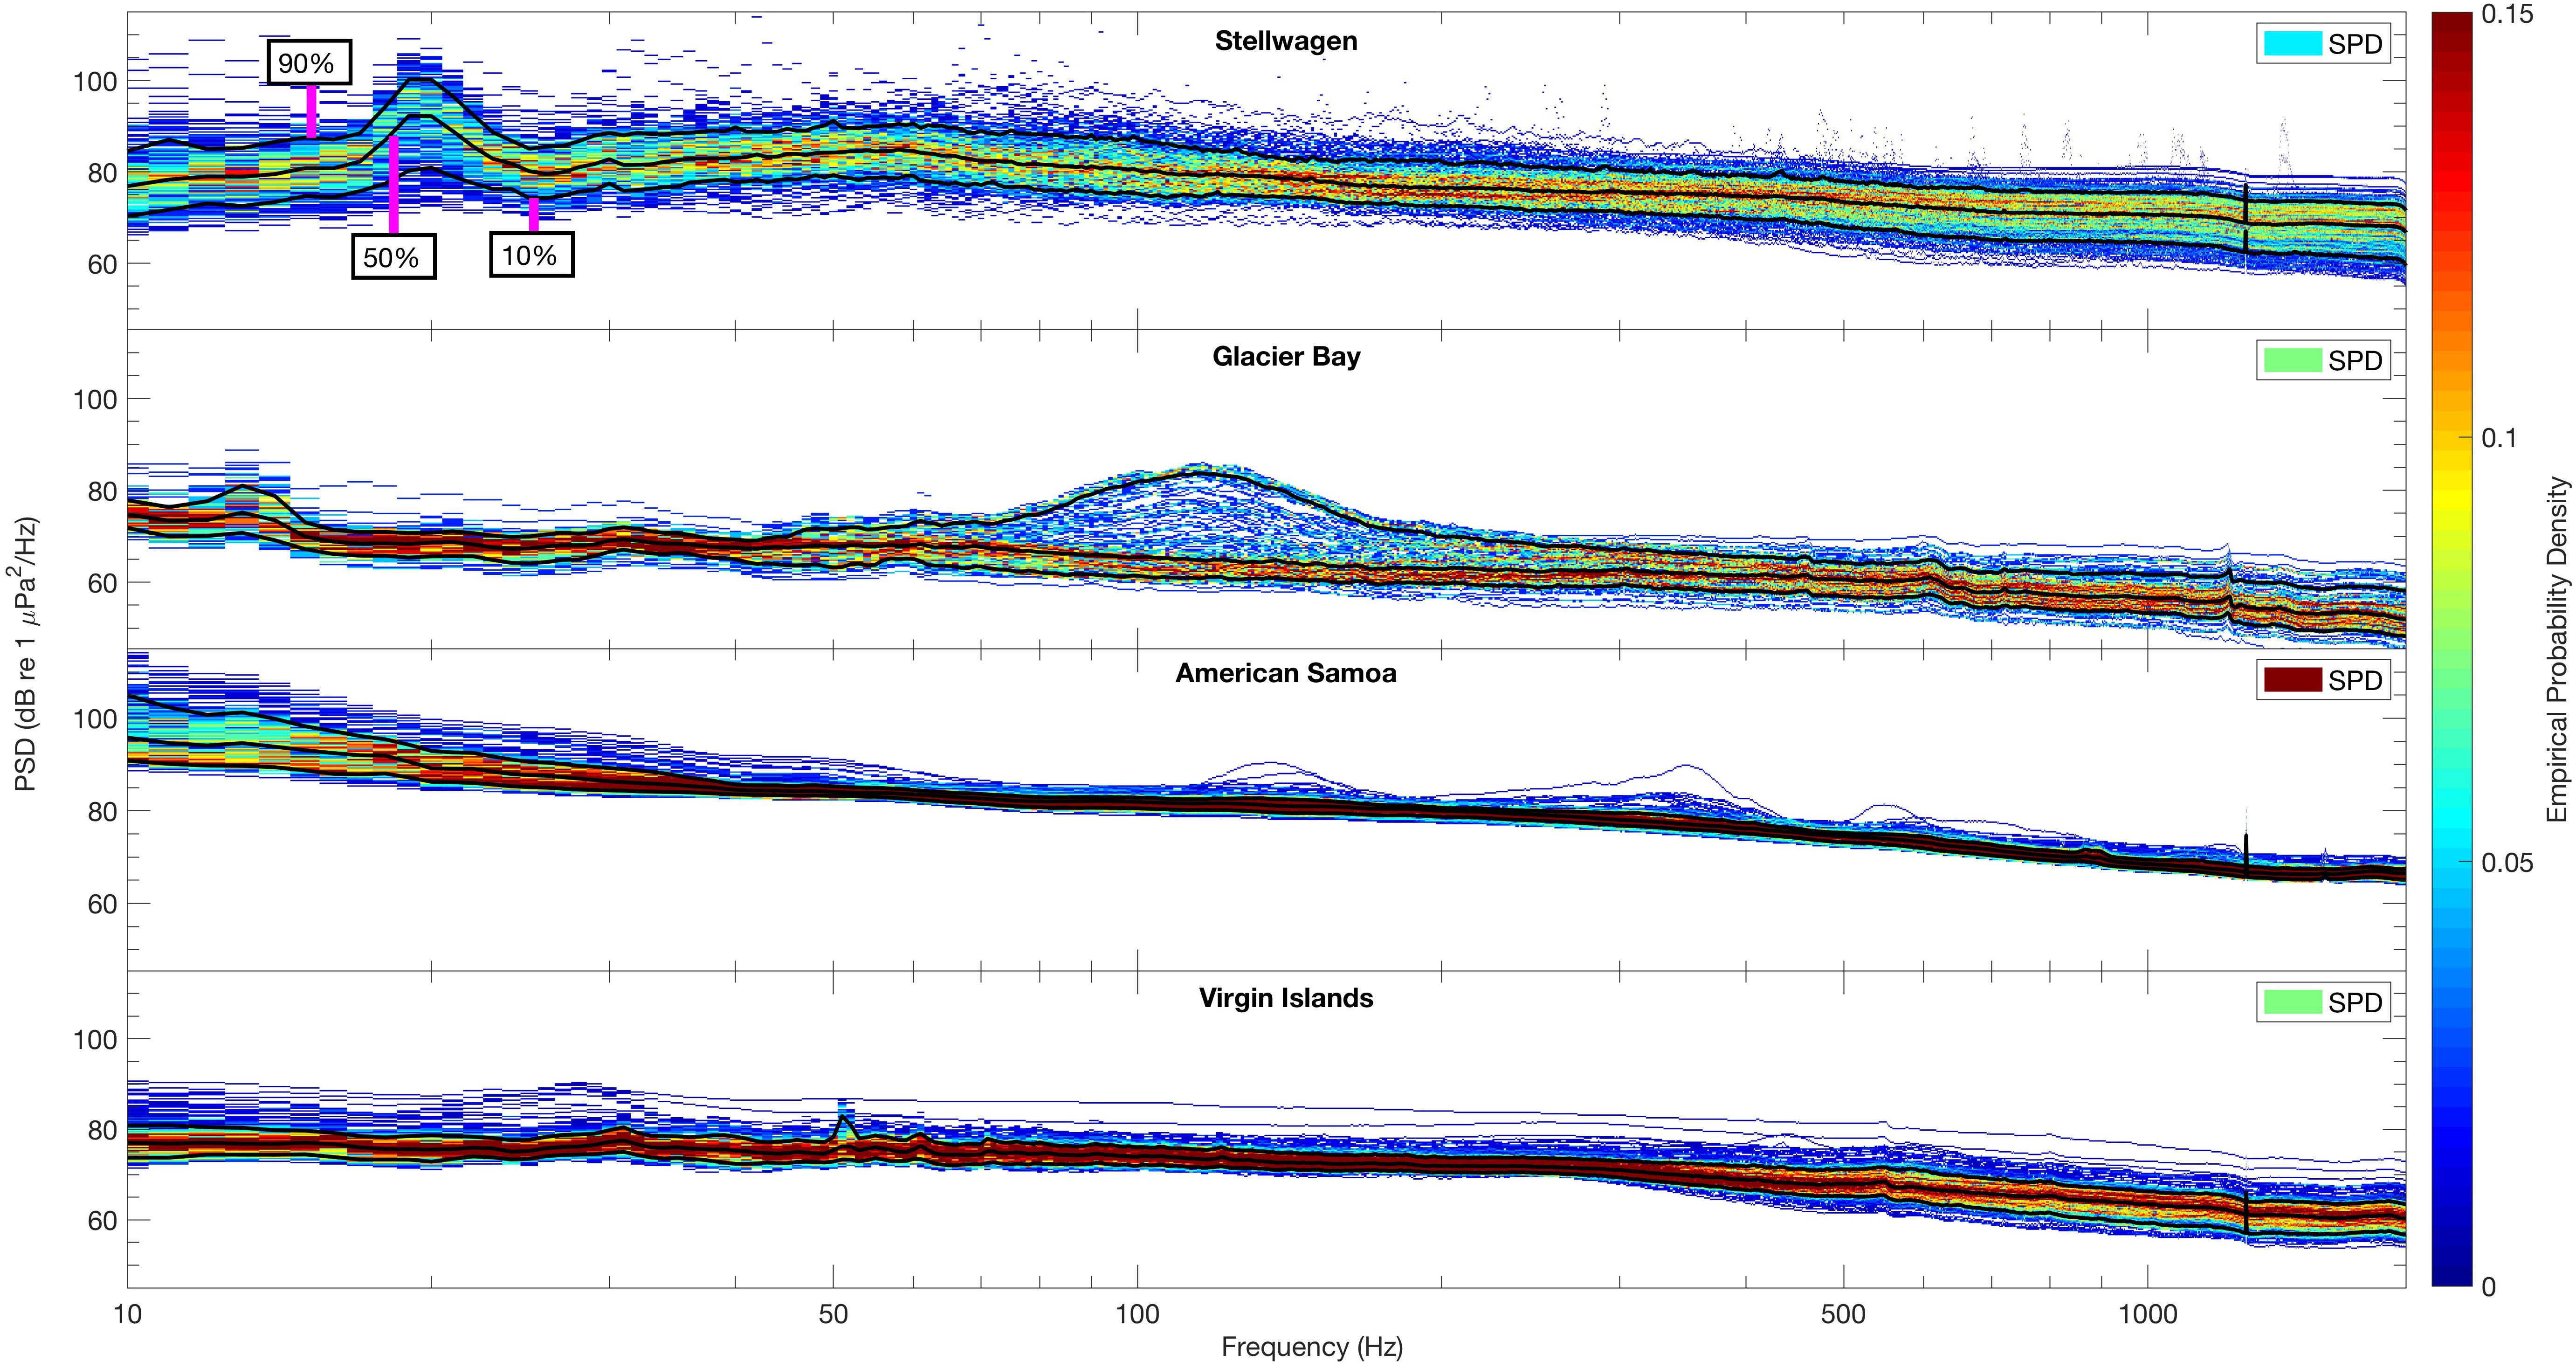
Figure 4. Spectral probability density (SPD; Merchant et al., 2013) plots of the distribution of sound levels (10 Hz–2 kHz) across sites for all available data (see Table 1). Solid black lines indicate percentile levels [90th, 50th (median), 10th] of power spectral densities (PSD, dB re 1 μPa2/Hz). PSD sound levels of each frequency band determine the empirical probability density (EPD), indicated by z-axis color bar range of blue (lower probability) to red (higher probability). An overall SPD is also calculated for each site (upper right corner of each panel) indicating the overall probability of temporal sound level constancy.
In Stellwagen, the site in the North Atlantic, the 90th, 50th (median), and 10th percentiles of PSD (dB re 1 μPa2/Hz) sound levels all peaked at ∼20 Hz. The range of intensities of recorded PSD sound levels, ∼70 to ∼105 dB re 1 μPa2/Hz, indicates higher energy levels within the 20 Hz frequency band, relative to other frequencies. In Glacier Bay, the site in Southeast Alaska, the highest PSD levels (90th percentile) were recorded between ∼90–150 Hz, likely due to the seasonal breeding roars of male harbor seals. The EPD indicates that this peak is related to a short-term increase of sound energy within that frequency band as PSD levels were less likely to be above ∼70 dB re 1 μPa2/Hz and more likely (median and below) to be between ∼60–70 dB re 1 μPa2/Hz (Figure 4, Glacier Bay). PSD levels were less variable across all measured frequencies in American Samoa (the south Pacific site) and Virgin Islands (the Caribbean site), in comparison to Glacier Bay and Stellwagen, indicating fewer spatio-temporal differences in sound levels throughout the data collection time periods. Further, these two sites did not show any distinct spectral peaks in acoustic energy. Across all sites, the highest PSD sound levels were recorded in Stellwagen at ∼20 Hz and in American Samoa between 10 and 20 Hz, and the lowest PSD sound levels were recorded at frequencies >1 kHz in Glacier Bay (Figure 4).
Natural Physical Drivers of Ambient Sound Levels
Wind noise and surface agitation during high-wind events (e.g., hurricanes, storms) increased ambient sound levels in Stellwagen, Virgin Islands, and American Samoa. In Stellwagen, these events occurred regularly throughout the winter and spring, and an increase in hourly mean wind speed was highly correlated (R2 = 0.956, df = 206, p ≤ 0.05) with an increase in hourly mean 500 Hz sound levels. In Virgin Islands, two category five hurricane events, Hurricanes Irma and Maria, traveled through the U.S. Virgin Islands and brought unusually high wind conditions to St. Croix on September 6th and 20th (respectively) 2017. In American Samoa, a category five tropical cyclone, Winston, traveled through the South Pacific in February 2016, increasing RMS sound levels (Figure 3). Wind speed measurements for Virgin Islands and American Samoa (NOAA water level observation network stations CHSV3 and NSTP6) were not available for correlation with sound levels due to system malfunctions during and immediately after these high-wind events. High wind speed weather events are rare in Glacier Bay during the boreal summer when acoustic data were collected and thus likely had a negligible effect on ambient sound levels (Fournet et al., 2018a).
Humpback Whale Acoustic Presence
Humpback whale acoustic activity was observed throughout the entire deployment period in Glacier Bay (Figure 5), with calls detected every day (April 30–September 22). In Stellwagen, vocalizations were detected on all weeks except for the time period from January 31 to March 24. Humpback whale vocalizations were observed seasonally in American Samoa and Virgin Islands. In American Samoa vocalizations were detected during the austral spring months (July–November), and in Virgin Islands vocalizations were detected during boreal winter months (January–April) (Figure 5).
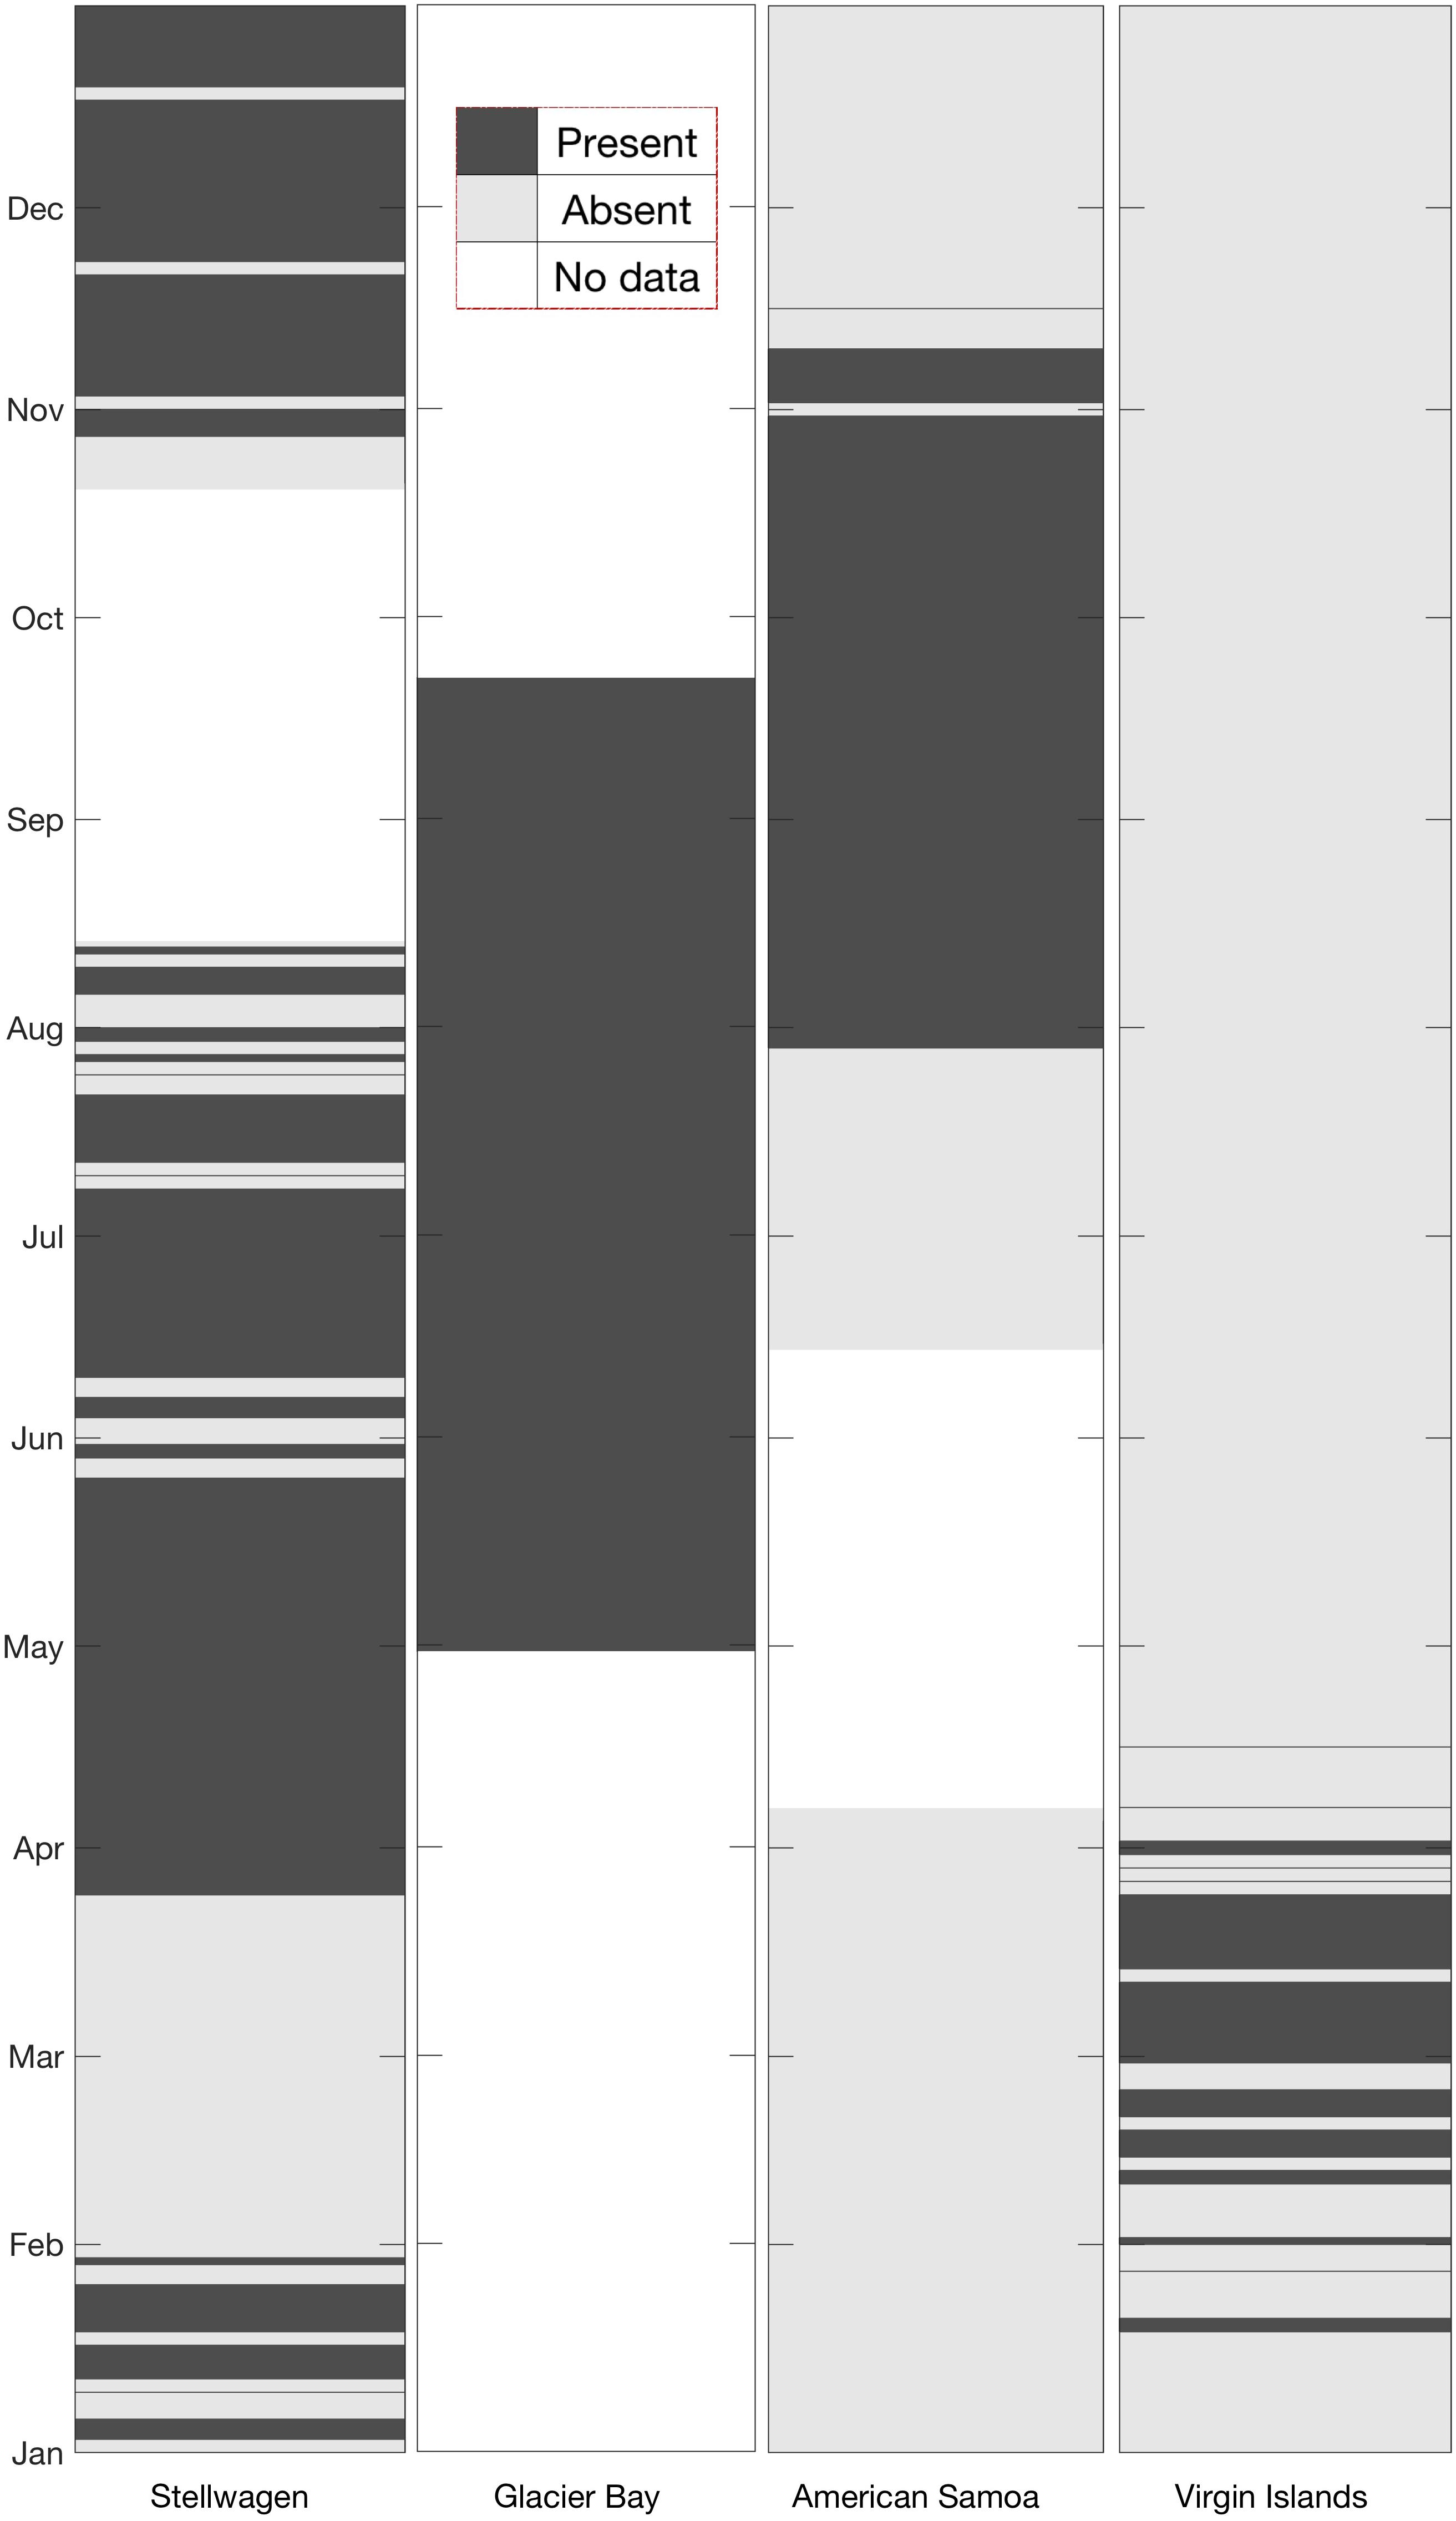
Figure 5. Site-by-site comparison of monthly presence (dark gray shading) or absence (light gray shading) of humpback whale vocalizations. All available data were analyzed for the presence/absence of humpback whale vocalizations. White sections indicate data gaps at each site.
Daily median 500 Hz sound levels (Figure 6) were compared to the verified daily presence and absence of humpback whale vocalizations to determine if there was a relationship between the measured sound levels and the presence/absence of humpback whale vocalizations. In Stellwagen, Virgin Islands, and American Samoa, daily median 500 Hz sound levels (dB re 1 μPa2/Hz) were distributed across lower intensities on days with true positive detections of humpback whale vocalizations, indicating that other sound sources likely contribute to the higher measured sound levels. The mean difference between the means of all daily median 500 Hz sound levels in the absence and presence conditions of humpback whale vocalizations was largest in Stellwagen (difference of 3.57 dB) followed by Virgin Islands (1.15 dB) (i.e., mean sound levels were higher on days humpback whales were not acoustically detected). In contrast, in American Samoa the mean of the daily median 500 Hz sound levels was 0.83 dB higher on days when humpback whale vocalizations were present compared to days that humpback whale vocalizations were not detected. Differences could not be evaluated for Glacier Bay because humpback whale calls were present throughout the recording time period.
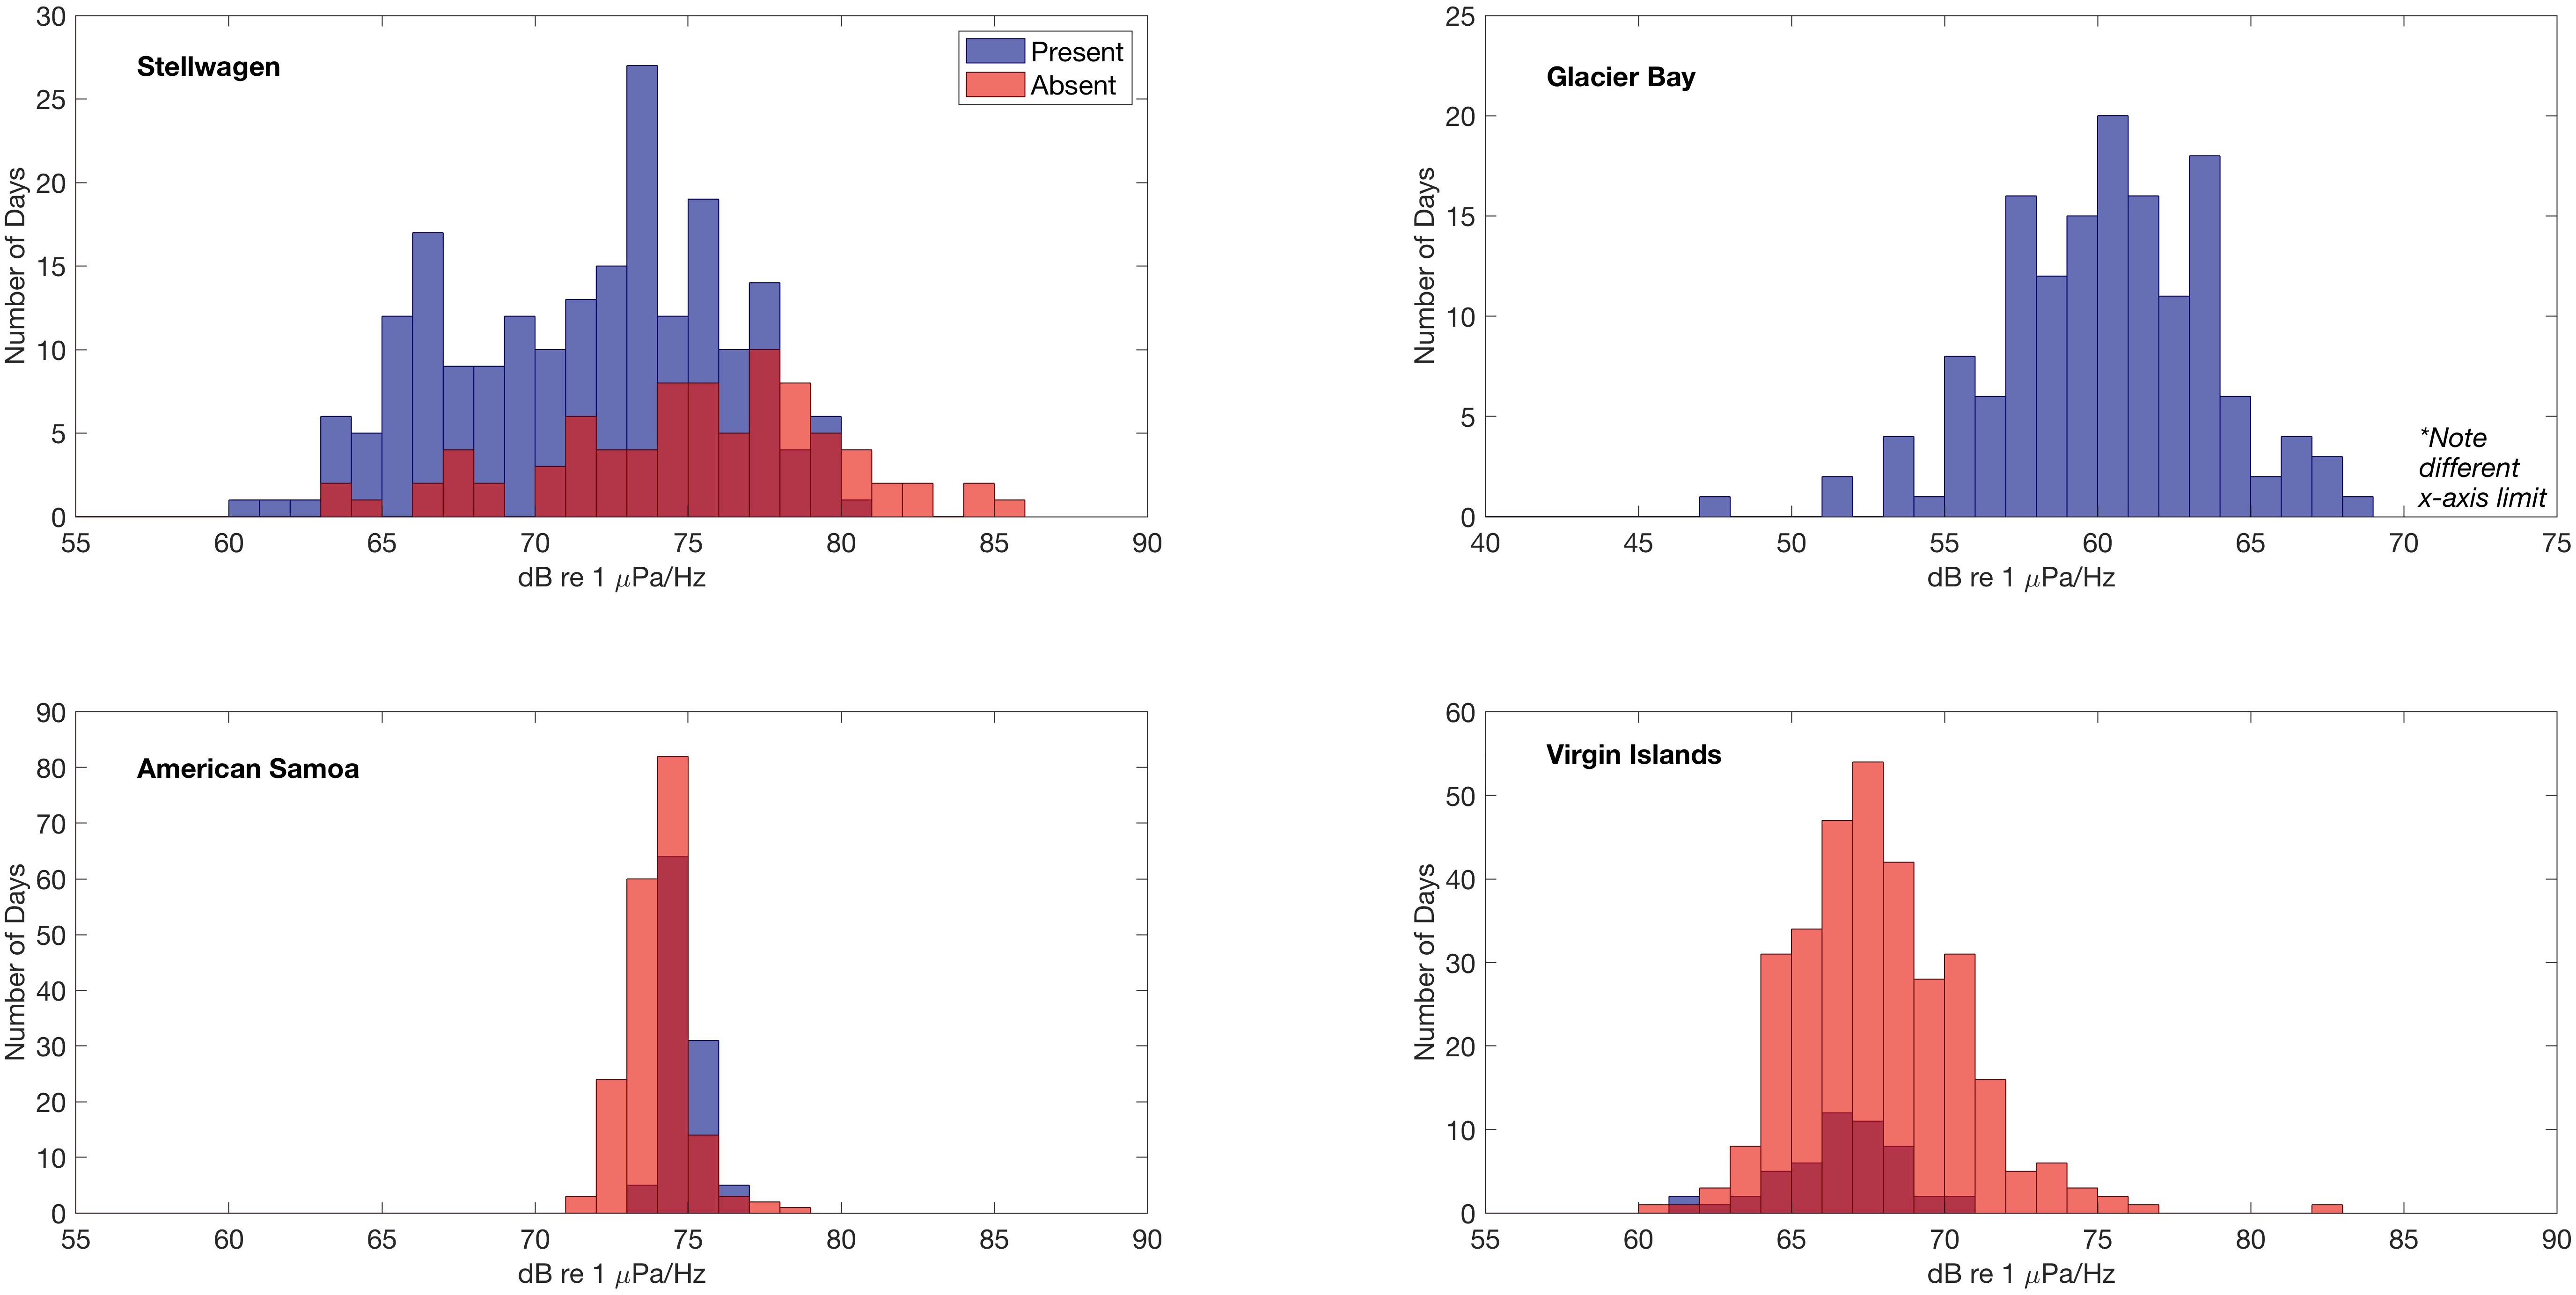
Figure 6. Relationship between the distribution of daily median 500 Hz power spectral density sound levels (dB re 1 μPa2/Hz) and detection of humpback whale vocalizations at each site. Histograms of sound levels (1 dB bin width) are plotted for two conditions, when humpback whale vocalizations are present (blue) or absent (red). In Glacier Bay, humpback whale vocalizations were detected on all days and thus no absent (red) condition is plotted.
Discussion
Here, we compare the low frequency soundscapes of four U.S. marine protected areas to document seasonal and daily variations in ambient underwater sound levels as well as daily presence of humpback whale vocalizations during the recorded periods. As predicted, sound levels were not consistent across the four sites; observed variability of both band levels [dBRMS (50 Hz–1.5 kHz) re 1 μPa] and PSD (dB re 1 μPa2/Hz) among and within the sites was driven by differences in biological activity, weather, and proximate anthropogenic activity, primarily vessel traffic. The contributions of these various sound sources to each soundscape varied widely across the four areas due to distinctions among soundscape drivers (e.g., management, climate, species richness). The most persistent and loudest sound sources were different at each site, and as a result, sound levels and trends were different across the four sites.
Sound Levels Reveal Dominant Sources
The metrics for evaluating the soundscapes identified in this study are not only relevant to tracking conditions over time and across sites, but also indicate biotic and abiotic low-frequency sound sources that distinguish each unique soundscape. The Beardslee Island Complex within Glacier Bay, the northernmost site in this comparison, is located in a high-latitude temperate area of the Pacific Ocean. Glacier Bay is a seasonal (boreal summer) feeding ground for humpback whales, where the whales produce an assortment of calls that are comparatively quieter than song (Fournet et al., 2018b). In the area monitored in Glacier Bay, boreal summer RMS sound levels showed a short seasonal trend, increasing during late June through late July, which was attributed to the seasonal breeding roars of male harbor seals (Phoca vitulina; Matthews et al., 2017; McKenna et al., 2017; Fournet et al., 2018a) (Figures 3, 4). A diel pattern was also evident in the data recorded in Glacier Bay resulting from daylight-driven vessel passages. Glacier Bay is a fjord that terminates at the face of several tidewater glaciers. As a result, ships must enter and exit from the mouth of the bay. During the boreal summer data collection period, the acoustic signatures of these vessel passages (i.e., into the bay each morning traveling toward the glaciers, and looping back out each afternoon to exit the bay) are clearly reflected in the band sound levels (Figure 3). Moreover, the hydrophone site is in a protected interior environment sheltered from the open ocean. The highly managed vessel activity and isolated hydrophone location is unusual across the protected sites in this comparison and is reflected in the lower overall band sound levels recorded during months with mild weather conditions.
American Samoa is located in a low-latitude remote location in the South Pacific Ocean (Figure 1) where the weather is relatively consistent year-round. Although fully exposed to the open ocean, American Samoa is thousands of miles away from any major shipping port (i.e., in Eastern Australia, Northern New Zealand, or Hawai’i), limiting the influence of large vessel noise on sound levels. In American Samoa, minimal seasonal ambient sound level variation was observed across the low-frequencies measured in this analysis (Figures 3, 4). However, 10–20 Hz PSD sound levels at this site were among the highest recorded PSD sound levels across all sites, likely due to an abundance of biological sound sources near the receiver. In American Samoa, a clear diel trend of low-frequency sound levels is evident in the recordings; band sound levels [dBRMS (50 Hz–1.5 kHz) re 1 μPa] are lowest during the day and peak at dawn and dusk. This difference is likely related to the activities of reef animals, such as the crepuscular feeding behavior of sea urchins, a ubiquitous species in tropical reef environments (Castle and Kibblewhite, 1975; Radford et al., 2008b). Sea urchins feed by scraping algea via a ventral beak-like mouth, and the skeleton of each sea urchin acts as a Helmholtz resonator, magnifying the scraping sounds from each individual (800 Hz–2 kHz, depending on body size) into a “reef chorus” that may also include sounds from other animals such as fish or shrimp (Radford et al., 2008a). Whilst a low frequency limit is applied in this study (<2 kHz), this frequency band captures the lower end of the dominant frequencies (120 Hz–4 kHz, Richardson et al., 1995) of humpback whale song components. Ambient sound levels at American Samoa were among the highest recorded, and humpback whale vocalizations were detected daily throughout the expected seasonal time period for Southern Hemisphere humpback whales (Robbins et al., 2011). On days with humpback whale vocalizations present, the mean of the daily median 500 Hz sound levels was 0.83 dB higher compared to days that humpback whale vocalizations were not detected (Figure 6). Thus, peaks in band sound levels in August until November were likely driven, at least partially, by presence of humpback whale vocalizations (Figure 3).
In Virgin Islands and Stellwagen, the two sites located in the Atlantic, no diel pattern of band sound levels was observed (Figure 3). This is likely related to the high amount of continuous anthropogenic activity in the North Atlantic (Kaluza et al., 2010); both Virgin Islands and Stellwagen were exposed to year-round adjacent and regional vessel noise. However, ambient sound levels in Virgin Islands were lower and less variable compared to Stellwagen (Figure 4). An illustrative example of this difference is that humpback whale vocalizations are visible in the band sound level plots of Virgin Islands, but not in Stellwagen (Figure 3), although humpback whale vocalizations were detected and known to occur in both areas (Stanistreet et al., 2013; Heenehan et al., 2019). This inconsistency suggests that ambient sound levels, combined with other influencing factors (e.g., distance between conspecifics, number of individuals), are likely a contributing factor in the success or failure in detecting humpback whale vocalizations and other biological sources in a given region and season. Further, in both Stellwagen and Virgin Islands, the mean of daily median 500 Hz sound levels was higher when humpback whale vocalizations were not detected than when they were, and the difference is larger in Stellwagen compared to Virgin Islands (∼3.5 dB and ∼1.1 dB, respectively) (Figure 6). Different local weather also explains the lower sound levels in Virgin Islands compared to Stellwagen. Specifically, Virgin Islands is located in a low-latitude Caribbean climate zone with warm temperatures year-round. Hurricanes were the only major ephemeral weather event to increase ambient sound levels in Virgin Islands. Short-term wind-speed increases during hurricane events are reflected in increased band sound levels (Figure 3).
In Stellwagen, ambient sound levels during June-August were lower than levels observed during November–May (September–October had no data). Stellwagen is the only site located near the continental U.S., and is the closest site to a major U.S. port (Boston, MA). Consequently, various classes of vessels transit the sanctuary year-round (in fluctuating seasonal numbers by class) contributing to low-frequency sound levels (Hatch et al., 2008). Additionally, from late fall through early spring, mixing of cold Arctic air and warm jet stream water creates powerful storms along the northeast coast of the continental U.S., bringing high wind speeds to Stellwagen. Surface winds increase sea state which is positively correlated with ambient sound levels (Wenz, 1962). Sound levels in the 500 Hz frequency band were strongly correlated with windspeed; This finding is consistent with other studies of shallow water acoustic habitats (Haxel et al., 2013). The combination of seasonal weather patterns and vessel passages in Stellwagen likely increased ambient sound levels.
Vessel Noise
The duration and density of vessel traffic that contributes to the soundscape of each site is determined by factors such as the size of the nearest port, the management schema of vessel traffic in park or sanctuary waters, and the physical environment around the site. Sound generated from sources outside the borderlines of U.S. National Marine Sanctuaries and Parks can propagate into protected waters. For example, while a protected area, Stellwagen has a soundscape that includes regional Massachusetts Bay traffic as well as ocean-going vessels transiting the shipping lane through the sanctuary to and from the Port of Boston, MA (see Supplementary Figure S1 for map). In comparison, Virgin Islands does not contain major local shipping lanes and the closest port city is over ten times smaller than Boston, MA; however, regionally this area has vessel traffic in many directions transiting in the Caribbean Sea and to and from the Panama Canal (NOAA Office for Coastal Management, 2015, 2017). Though a correlation of vessel density and sound levels throughout the listening time periods was beyond the scope of this study, annual U.S. government-compiled vessel density datasets such as MarineCadstre.gov (Bureau of Ocean Energy Management [BOEM], and National Oceanic and Atmospheric Administration [NOAA], 2019) may be valuable to future multi-year comparisons of localized changes in levels of sound and vessel activity in highly trafficked regions. MarineCadastre vessel density data are not currently available for the Pacific Islands region or Alaskan waters.
Both American Samoa and Glacier Bay are remote from any major shipping routes and port cities; however, the soundscapes of these two marine protected areas are not identical. Differences in the geographically isolated soundscapes of American Samoa and Glacier Bay can be partially attributed to environment (American Samoa is exposed to remote open ocean, while the Beardslee Island Complex within Glacier Bay is sheltered interior waters) and management (Glacier Bay actively manages vessel traffic transiting within the Beardslee Island complex area while American Samoa has no such management) (Gabriele et al., 2018). Large, distant vessel traffic results in a chronic source of sound in Stellwagen and Virgin Islands and transient, closer sources in American Samoa and Glacier Bay. While the higher populations in the nearest port city are likely related to increased anthropogenic noise levels in a soundscape, the environment (e.g., bathymetry, pressure, temperature; see Urick, 1983) can also facilitate propagation of low-frequency sound energy from more distant sources.
Assessing Acoustic Habitat Conditions Using Passive Acoustic Monitoring
Understanding the past, current and potential future conditions of a habitat is required to ensure appropriate and effective conservation and management efforts. Previously, methods aimed at documenting underwater species presence and diversity have relied on visual surveys (e.g., via remote platforms or direct underwater observation) or invasive methods (e.g., traps, trawls) (Costello et al., 2017). While these methods can cover relatively large spatial areas, they are resource-intensive, making it difficult to capture long-term seasonal changes in key protected areas, particularly during inclement weather or in remote regions. By deploying fixed PAM recorders in ecosystems of interest, researchers maximize temporal data collection that would otherwise be logistically impractical (Merchant et al., 2015). For instance, during and immediately following hurricanes Irma and Maria in the Caribbean, PAM, as undertaken during the current study, allowed for ecosystem monitoring in Virgin Islands that would not have been possible otherwise. PAM can add value to visual surveys by providing cost-effective long-term data collection encompassing a wide range of species, weather events, and human activities (Sousa-Lima, 2013). Furthermore, continuing advances in data processing and interpretation constantly improve upon the efficiency of PAM to provide useful information. The future applications for PAM are vast, and researchers are constantly evolving PAM tools to collect and process data more efficiently. For example, the introduction of cabled systems allows for real-time monitoring capabilities which could expedite regulatory action when biologically important metrics are exceeded (Ryan et al., 2016; Gabriele et al., 2018).
We measured almost a year of humpback whale vocal activity in one foraging ground (Stellwagen) and an entire summer foraging season in another (Glacier Bay), as well as almost a year in two lower-latitude environments (American Samoa, Virgin Islands) where humpback whales are presumed to be engaged in breeding or migratory activity (Figure 5). Bioacoustic activity from other soniferous species were detected within these long-term datasets, and future studies could examine these and additional PAM data to further investigate and monitor these bioacoustic sources. For example, to our knowledge, very little is known about the composition and sensitivity to sound of the species that make up the reef chorus in American Samoa. These data highlight times of high acoustic activity to direct potential future habitat monitoring and investigations of other bioacoustic contributors to the soundscape (e.g., fish, shrimp).
There are limitations to PAM; it is impossible to determine the presence of a silent or masked animal. Higher levels of ambient sound from any source may interfere with animal communication space and mask vocalizations. For example, measuring the highest sound levels on days with no humpback whale vocalizations detected and comparing them to levels on days with humpback whale vocalizations detections may indicate possible masking impacts to animals (Figure 6). Not only does noise from vessels and other anthropogenic sources overlap with the frequency range of humpback whale vocalizations (Clark et al., 2009; Gabriele et al., 2018), but many weather-related sounds also fall into this range (e.g., wind, rain; Wenz, 1962). These chronic sources of broadband abiotic sound may limit the capacity of a humpback whale to exercise resilience against ambient noise (e.g., modulating the pitch, duration, or intensity of vocalizations). Ongoing and future research efforts may benefit from coupling soundscape monitoring with other methods (e.g., visual surveys) to identify potential places and times to quantify possible effects. Further, advanced analytical techniques many be able to parse the components of a soundscape more effectively (Lin et al., 2017a,b; Seger et al., 2018) and quantify the degree to which signals may be masked in different ambient conditions (Helble et al., 2013).
Conclusion
This study contributes to a growing body of knowledge documenting ambient conditions in underwater soundscapes (Erbe et al., 2016a). Soundscape monitoring can eventually lead to more informed and efficient management of marine protected areas by documenting current (and potentially changing) conditions. For example, identifying the times and locations in which soniferous species (e.g., humpback whales) overlap with anthropogenic sources and other abiotic sounds can inform decision makers regarding when, where, and how acoustic conditions in marine habitats necessitate further protection (Hatch and Fristrup, 2009; Hatch et al., 2016; Merchant et al., 2018).
To understand how best to protect ecosystems and maintain diversity, it is essential to establish baseline soundscape conditions and associated metrics that adequately capture the conditions at a site. A soundscape may include a richness of sonic animals, heavy human use, dynamic environmental conditions, or numerous combinations therein. Each of the aforementioned sources creates a significantly different acoustic habitat, and, depending on the use and conservation priorities of an area, may need customized acoustic management (e.g., Erbe et al., 2012; Williams et al., 2015). For example, at sites where human uses are relatively quiet and marine animals dominate the soundscape (e.g., American Samoa), management needs may differ from sites where resident or seasonally predictable acoustically active animals are central to the ecosystem, but anthropogenic sources dominate the soundscape (e.g., Stellwagen). The management of vessel transits by the National Park Service in Glacier Bay National Park and Preserve provide an example of how policies to mitigate anthropogenic sound can be successfully incorporated into regulatory planning for a marine protected area (McKenna et al., 2017). Furthermore, soundscapes within marine protected areas may also be influenced by sources beyond their boundaries, some of which may have propagated from great distances (Hatch and Fristrup, 2009). Documenting the status and trends of animal and human use, as well as weather and environmental conditions, can inform the need for and balance of management plans to protect acoustic habitats within soundscapes, as well as provide a basis for evaluating changes over time.
Comparing the acoustic conditions of geographically diverse ocean environments is complicated. By utilizing calibrated instruments deployed within a three-and-a-half-year time period, we have established baseline levels and metrics for monitoring the soundscapes of four widespread marine protected areas. Together with methods to document other EOVs (e.g., water sampling, remote sensing), continued soundscape monitoring will facilitate detection of changes over time (including anthropogenic sources), recommendations of potential management priorities, and evaluations of the efficacy of actions aimed at either protecting an individual species, suite of species, or soundscape as a stand-alone resource of intrinsic value.
Data Availability
The datasets generated for this study are available on request to the corresponding author.
Author Contributions
RD, JG, LH, JH, MM, DM, and SVP conceived and designed the Noise Reference Station Network and contributed data from Stellwagen, American Samoa, and Virgin Islands. MF and CG contributed data from Glacier Bay. SH designed the current study with input from all authors, prepared the figures, and drafted the manuscript. SH and MF processed and analyzed the data with support from CG, LH, JH, MM, DM, and SVP. MF, SVP, MM, LH, and CG provided the initial critical revisions. All authors edited the manuscript.
Funding
This work was supported by the NOAA’s Pacific Marine Environmental Laboratory of the Office of Oceanic and Atmospheric Research, the National Marine Fisheries Service, the Office of National Marine Sanctuaries, and Dr. Nancy Foster Scholarship Program (SH), as well as the National Park Service. Publication of this manuscript was supported, in part, by the James R. Sedell Graduate Award in Fisheries and Wildlife. Additional resources were provided by Oregon State University and the Hatfield Marine Science Center.
Conflict of Interest Statement
The authors declare that the research was conducted in the absence of any commercial or financial relationships that could be construed as a potential conflict of interest.
Acknowledgments
The authors thank their collaborators: Julianne Bonnell, Erik Brown, Danielle Cholewiak, Michael Craig, Genevieve Davis, Eva DiDonato, Matt Fowler, Burt Fuiava, Nathaniel Hanna Halloway, Zandy Hillis-StarrBrian Kahn, Holger Klinck, T.K. Andy Lau, Eric Matzen, Ian Moffitt, Leanna Matthews, Haru Matsumoto, Christian Meinig, Sharon Nieukirk, Susan Parks, Clayton Pollock, Lauren Roche, Jenni Stanley, Alex Turpin, Carrie Wall, Sarah Weiss, and Tracy Ziegler. This is NOAA/PMEL contribution #4973.
Supplementary Material
The Supplementary Material for this article can be found online at: https://www.frontiersin.org/articles/10.3389/fmars.2019.00500/full#supplementary-material
FIGURE S1 | Density maps of Automatic Identification System (AIS) vessel track lines of all vessel types (100 m grid cell resolution) in 2015–2017 in the Atlantic Ocean compiled with the MarineCadastre.gov National Viewer (BOEM and NOAA). Detail maps show vessel activity near the hydrophones (red markers indicate location) in Stellwagen Bank National Marine Sanctuary and Buck Island Reef National Monument. AIS data are not currently available via the Marine Cadastre for the Pacific Islands region or Alaskan waters.
References
Au, W. W. L., Pack, A. A., Lammers, M. O., Herman, L. M., Deakos, M. H., and Andrews, K. (2006). Acoustic properties of humpback whale songs. J. Acoust. Soc. Am. 120, 1103–1110. doi: 10.1121/1.2211547
Baumgartner, M. F., and Mussoline, S. E. (2011). A generalized baleen whale call detection and classification system. J. Acoust. Soc. Am. 129, 2889–2902. doi: 10.1121/1.3562166
Bureau of Ocean Energy Management [BOEM], and National Oceanic and Atmospheric Administration [NOAA] (2019). MarineCadastre.gov. Available at: https://www.marinecadastre.gov/data/ (accessed March 31, 2019).
Castle, M. J., and Kibblewhite, A. C. (1975). The contribution of the sea urchin to ambient sea noise. J. Acoust. Soc. Am. 58, S122–S122. doi: 10.1121/1.2001916
Cerchio, S., Jacobsen, J. K., and Norris, T. F. (2001). Temporal and geographical variation in songs of humpback whales, Megaptera novaeangliae: synchronous change in Hawaiian and Mexican breeding assemblages. Anim. Behav. 62, 313–329. doi: 10.1006/anbe.2001.1747
Cholewiak, D. M., Cerchio, S., Jacobsen, J. K., Urbán-R, J., and Clark, C. W. (2018). Songbird dynamics under the sea: acoustic interactions between humpback whales suggest song mediates male interactions. R. Soc. Open Sci. 5, 1–14. doi: 10.1098/rsos.171298
Clark, C. W., Ellison, W. T., Southall, B. L., Hatch, L. T., Van Parijs, S. M., Frankel, A. S., et al. (2009). Acoustic masking in marine ecosystems: intuitions, analysis, and implications. Mar. Ecol. Prog. Ser. 395, 201–222. doi: 10.3354/meps08402
Costello, M. J., Basher, Z., McLeod, L., Asaad, I., Claus, S., Vandepitte, L., et al. (2017). “Methods for the study of marine biodiversity,” in The GEO Handbook on Biodiversity Observation Networks, eds M. Walters and R. Scholes (Cham: Springer International Publishing), 129–163.
Dunlop, R. A., Noad, M. J., Cato, D. H., and Stokes, D. (2007). The social vocalization repertoire of east Australian migrating humpback whales (Megaptera novaeangliae). J. Acoust. Soc. Am. 122, 2893–2905. doi: 10.1121/1.2783115
Erbe, C., MacGillivray, A., and Williams, R. (2012). Mapping cumulative noise from shipping to inform marine spatial planning. J. Acoust. Soc. Am. 132, EL423–EL428. doi: 10.1121/1.4758779
Erbe, C., McCauley, R., and Gavrilov, A. (2016a). “Characterizing marine soundscapes,” in The Effects of Noise on Aquatic Life II, eds A. Popper and A. Hawkins (New York, NY: Springer Science), 265–271. doi: 10.1007/978-1-4939-2981-8
Erbe, C., Reichmuth, C., Cunningham, K., Lucke, K., and Dooling, R. (2016b). Communication masking in marine mammals: a review and research strategy. Mar. Pollut. Bull. 103, 15–38. doi: 10.1016/j.marpolbul.2015.12.007
Etherington, L. L., Hooge, P. N., Hooge, E. R., and Hill, D. F. (2007). Oceanography of Glacier Bay, Alaska: implications for biological patterns in a glacial fjord estuary. Estuar. Coasts 30, 927–944. doi: 10.1007/BF02841386
Fournet, M. E. H., Matthews, L. P., Gabriele, C. M., Haver, S. M., Mellinger, D. K., and Klinck, H. (2018a). Humpback whales (Megaptera novaeangliae) alter calling behavior in response to natural sounds and vessel noise. Mar. Ecol. Prog. Ser. 607, 251–268. doi: 10.3354/meps12784
Fournet, M. E. H., Matthews, L. P., Gabriele, C. M., Mellinger, D. K., and Klinck, H. (2018b). Source levels of foraging humpback whale calls. J. Acoust. Soc. Am. 143, EL105–EL111. doi: 10.1121/1.5023599
Fournet, M. E. H., Szabo, A., and Mellinger, D. K. (2015). Repertoire and classification of non-song calls in Southeast Alaskan humpback whales (Megaptera novaeangliae). J. Acoust. Soc. Am. 137, 1–10. doi: 10.1121/1.4904504
Fox, C. G., Matsumoto, H., and Lau, T.-K. A. (2001). Monitoring Pacific Ocean seismicity from an autonomous hydrophone array. J. Geophys. Res. 106, 4183–4206. doi: 10.1029/2000JB900404
Gabriele, C. M., and Frankel, A. S. (2002a). Surprising Humpback Whale Songs in Glacier Bay National Park. Alaska Park Sci. 17–21.
Gabriele, C. M., and Frankel, A. S. (2002b). The occurrence and significance of Humpback whale songs in Glacier Bay, Southeastern Alaska. Arct. Res. United States 16, 42–42.
Gabriele, C. M., Ponirakis, D. W., Clark, C. W., Womble, J. N., and Vanselow, P. B. S. (2018). Underwater acoustic ecology metrics in an Alaska marine protected area reveal marine mammal communication masking and management alternatives. Front. Mar. Sci. 5:270. doi: 10.3389/fmars.2018.00270
Gedamke, J., Harrison, J., Hatch, L., Angliss, R., Barlow, J., Berchok, C., et al. (2016). Ocean Noise Strategy Roadmap. 144. Available at: http://cetsound.noaa.gov/road-map (accessed May 1, 2019).
Hatch, L., Wahle, C., Gedamke, J., Harrison, J., Laws, B., Moore, S., et al. (2016). Can you hear me here? Managing acoustic habitat in US waters. Endanger. Species Res. 30, 171–186. doi: 10.3354/esr00722
Hatch, L. T., Clark, C. W., Merrick, R., Van Parijs, S. M., Ponirakis, D., Schwehr, K., et al. (2008). Characterizing the relative contributions of large vessels to total ocean noise fields: a case study using the Gerry E. Studds Stellwagen Bank National Marine Sanctuary. Environ. Manage. 42, 735–752. doi: 10.1007/s00267-008-9169-4
Hatch, L. T., and Fristrup, K. M. (2009). No barrier at the boundaries: implementing regional frameworks for noise management in protected natural areas. Mar. Ecol. Prog. Ser. 395, 223–244. doi: 10.3354/meps07945
Hatch, L. T., and Wright, A. J. (2007). A brief review of anthropogenic sound in the oceans. Int. J. Comp. Psychol. 20, 121–133. doi: 10.1201/9780849387975.ch11
Haver, S. M., Gedamke, J., Hatch, L. T., Dziak, R. P., Van Parijs, S., McKenna, M. F., et al. (2018). Monitoring long-term soundscape trends in U.S. Waters: the NOAA/NPS Ocean noise reference station network. Mar. Policy 90, 6–13. doi: 10.1016/j.marpol.2018.01.023
Haxel, J. H., Dziak, R. P., and Matsumoto, H. (2013). Observations of shallow water marine ambient sound: the low frequency underwater soundscape of the central Oregon coast. J. Acoust. Soc. Am. 133, 2586–2596. doi: 10.1121/1.4796132
Heenehan, H., Stanistreet, J. E., Corkeron, P. J., Bouveret, L., Chalifour, J., Davis, G. E., et al. (2019). Caribbean Sea soundscapes: monitoring humpback whales, biological sounds, geological events, and anthropogenic impacts of vessel noise. Front. Mar. Sci. 6:347. doi: 10.3389/FMARS.2019.00347
Helble, T., D’Spain, G. L., Hildebrand, J., Campbell, G. S., Campbell, R. L., and Heaney, K. D. (2013). Site specific probability of passive acoustic detection of humpback whale calls from single fixed hydrophones. J. Acoust. Soc. Am. 134, 2556–2570. doi: 10.1121/1.4816581
Hildebrand, J. A. (2009). Anthropogenic and natural sources of ambient noise in the ocean. Mar. Ecol. Prog. Ser. 395, 5–20. doi: 10.3354/meps08353
International Organization for Standardization [ISO] (2017). Underwater Acoustics—Terminology. Standard ISO/DIS 18405.2:2017, prepared by Technical Committee ISO/TC 43, Acoustics, Subcommittee SC 3, Underwater Acoustics. Geneva: International Organization for Standardization.
Kaluza, P., Kölzsch, A., Gastner, M. T., and Blasius, B. (2010). The complex network of global cargo ship movements. J. R. Soc. Interface 7, 1093–1103. doi: 10.1098/rsif.2009.0495
Kaplan, M. B., Lammers, M. O., Zang, E., and Aran Mooney, T. (2018). Acoustic and biological trends on coral reefs off Maui, Hawaii. Coral Reefs 37, 121–133. doi: 10.1007/s00338-017-1638-x
Knowlton, C. W., Morin, H., Scowcroft, G., and Vigness-Raposa, K. (2016). Discovery of Sound in the Sea Book I: Importance of Sound In the Sea. 1.01. Kingston, RI: University of Rhode Island Research Foundation.
Krause, B., and Farina, A. (2016). Using ecoacoustic methods to survey the impacts of climate change on biodiversity. Biol. Conserv. 195, 245–254. doi: 10.1016/j.biocon.2016.01.013
Landsea, C. W., and Franklin, J. L. (2013). Atlantic Hurricane database uncertainty and presentation of a new database format. Mon. Weather Rev. 141, 3576–3592. doi: 10.1175/MWR-D-12-00254.1
Lin, T. H., Fang, S. H., and Tsao, Y. (2017a). Improving biodiversity assessment via unsupervised separation of biological sounds from long-duration recordings. Sci. Rep. 7, 1–10. doi: 10.1038/s41598-017-04790-7
Lin, T.-H., Tsao, Y., Wang, Y.-H., Yen, H.-W., and Lu, S.-S. (2017b). “Computing biodiversity change via a soundscape monitoring network,” in Proceedings of the 2017 Pacific Neighborhood Consortium Annual Conference and Joint Meetings (PNC), (Tainan), 128–133. doi: 10.23919/PNC.2017.8203533
Matthews, L. P., Parks, S. E., Fournet, M. E. H., Gabriele, C. M., Womble, J. N., and Klinck, H. (2017). Source levels and call parameters of harbor seal breeding vocalizations near a terrestrial haulout site in Glacier Bay National Park and Preserve. J. Acoust. Soc. Am. 141, EL274–EL280. doi: 10.1121/1.4978299
McKenna, M. F., Gabriele, C., and Kipple, B. (2017). Effects of marine vessel management on the underwater acoustic environment of Glacier Bay National Park, AK. Ocean Coast. Manag. 139, 102–112. doi: 10.1016/j.ocecoaman.2017.01.015
McKenna, M. F., Katz, S. L., Wiggins, S. M., Ross, D., and Hildebrand, J. A. (2012). A quieting ocean: unintended consequence of a fluctuating economy. J. Acoust. Soc. Am. 132, EL169–EL175. doi: 10.1121/1.4740225
Merchant, N. D., Barton, T. R., Thompson, P. M., Pirotta, E., Dakin, D. T., and Dorocicz, J. (2013). Spectral probability density as a tool for ambient noise analysis. J. Acoust. Soc. Am. 133, EL262–EL267. doi: 10.1121/1.4794934
Merchant, N. D., Faulkner, R. C., and Martinez, R. (2018). Marine noise budgets in practice. Conserv. Lett. 11, 1–8. doi: 10.1111/conl.12420
Merchant, N. D., Fristrup, K. M., Johnson, M. P., Tyack, P. L., Witt, M. J., Blondel, P., et al. (2015). Measuring acoustic habitats. Methods Ecol. Evol. 6, 257–265. doi: 10.1111/2041-210X.12330
Montgomery, J. C., Jeffs, A., Simpson, S. D., Meekan, M., and Tindle, C. (2006). Sound as an orientation cue for the pelagic larvae of reef fishes and decapod crustaceans. Adv. Mar. Biol. 51, 143–196. doi: 10.1016/S0065-2881(06)51003-X
National Data Buoy Center (1971). Meteorological and Oceanographic Data Collected from the National Data Buoy Center Coastal-Marine Automated Network (C-MAN) and moored (weather) buoys. Available at: https://www.ndbc.noaa.gov/ (accessed October 24, 2018).
National Park Service (2006). Glacier Bay National Park, Vessel Management Plan Regulations; Final Rule. 69327–69358. Available at: https://www.federalregister.gov/documents/2006/11/30/E6-19968/glacier-bay-national-park-vessel-management-plan-regulations (accessed February 1, 2019).
National Park Service and U.S. Department of the Interior (2006). Management Policies: The Guide to Managing the National Park System. 1–165. Available at: http://www.nps.gov/policy/mp/policies.html (accessed January 18, 2019).
NOAA Office for Coastal Management (2015). 2015 AIS Vessel Transit Counts. Available at: https://inport.nmfs.noaa.gov/inport/item/54958 (accessed March 31, 2019).
NOAA Office for Coastal Management (2017). 2017 Vessel Transit Counts. Available at: https://inport.nmfs.noaa.gov/inport/item/55365 (accessed March 31, 2019).
Patek, S. N., Shipp, L. E., and Staaterman, E. R. (2009). The acoustics and acoustic behavior of the California spiny lobster (Panulirus interruptus). J. Acoust. Soc. Am. 125, 3434–3443. doi: 10.1121/1.3097760
Pijanowski, B. C., Villanueva-Rivera, L. J., Dumyahn, S. L., Farina, A., Krause, B. L., Napoletano, B. M., et al. (2011). Soundscape ecology: the science of sound in the landscape. Bioscience 61, 203–216. doi: 10.1525/bio.2011.61.3.6
Radford, C. A., Jeffs, A., Tindle, C., and Montgomery, J. C. (2008a). Resonating sea urchin skeletons create coastal choruses. Mar. Ecol. Prog. Ser. 362, 37–43. doi: 10.3354/meps07444
Radford, C. A., Jeffs, A. G., Tindle, C. T., and Montgomery, J. C. (2008b). Temporal patterns in ambient noise of biological origin from a shallow water temperate reef. Oecologia 156, 921–929. doi: 10.1007/s00442-008-1041-y
Richardson, W. J., Greene, C. R., Malme, C. I., and Thomson, D. H. (1995). Marine Mammals and Noise. San Diego, CA: Academic Press.
Robbins, J., Dalla Rosa, L., Allen, J. M., Mattila, D. K., Secchi, E. R., Friedlaender, A. S., et al. (2011). Return movement of a humpback whale between the Antarctic Peninsula and American Samoa: a seasonal migration record. Endanger. Species Res. 13, 117–121. doi: 10.3354/esr00328
Rolland, R. M., Parks, S. E., Hunt, K. E., Castellote, M., Corkeron, P. J., Nowacek, D. P., et al. (2012). Evidence that ship noise increases stress in right whales. Proc. R. Soc. B Biol. Sci. 279, 2363–2368. doi: 10.1098/rspb.2011.2429
Rowe, S., and Hutchings, J. A. (2006). Sound production by Atlantic Cod during spawning. Trans. Am. Fish. Soc. 135, 529–538. doi: 10.1577/T04-061.1
Ryan, J., Cline, D., Dawe, C., Mcgill, P., Zhang, Y., Joseph, J., et al. (2016). “New passive acoustic monitoring in monterey bay national marine sanctuary: exploring natural and anthropogenic sounds in a deep soundscape,” in Proceedings of the OCEANS 2016 MTS/IEEE Monterey, (Monterey, CA).
Seger, K. D., Al-Badrawi, M. H., Miksis-Olds, J. L., Kirsch, N. J., and Lyons, A. P. (2018). An empirical mode decomposition-based detection and classification approach for marine mammal vocal signals. J. Acoust. Soc. Am. 144, 3181–3190. doi: 10.1121/1.5067389
Small, R., Brost, B., Hooten, M., Castellote, M., and Mondragon, J. (2017). Potential for spatial displacement of cook inlet beluga whales by anthropogenic noise in critical habitat. Endanger. Species Res. 32, 43–57. doi: 10.3354/esr00786
Sousa-Lima, R. (2013). A review and inventory of fixed autonomous recorders for passive acoustic monitoring of marine mammals. Aquat. Mamm. 39, 23–53. doi: 10.1578/AM.39.1.2013.23
Southall, B. L., Scholik-Schlomer, A. R., Hatch, L., Bergmann, T., Jasny, M., Metcalf, K., et al. (2017). “Underwater noise from large commercial ships-international collaboration for noise reduction,” in Encyclopedia of Maritime and Offshore Engineering, eds J. Carlton, P. Jukes, and Y. S. Choo (Chichester: John Wiley & Sons, Ltd.), 1–9. doi: 10.1002/9781118476406.emoe056
Stanistreet, J. E., Risch, D., and Van Parijs, S. M. (2013). Passive acoustic tracking of singing humpback whales (Megaptera novaeangliae) on a northwest Atlantic feeding ground. PLoS One 8:e61263. doi: 10.1371/journal.pone.0061263
Stimpert, A. K., Au, W. W. L., Parks, S. E., Hurst, T., and Wiley, D. N. (2011). Common humpback whale (Megaptera novaeangliae) sound types for passive acoustic monitoring. J. Acoust. Soc. Am. 129, 476–482. doi: 10.1121/1.3504708
Stimpert, A. K., Peavey, L. E., Friedlaender, A. S., and Nowacek, D. P. (2012). Humpback Whale song and foraging behavior on an antarctic feeding ground. PLoS One 7:e51214. doi: 10.1371/journal.pone.0051214
Storlazzi, C. D., Cheriton, O. M., Rosenberger, K. J., Logan, J. B., and Clark, T. B. (2017). Coastal Circulation and Water-Column Properties in the National Park of American Samoa, February–July 2015: U.S. Geological Survey Open-File Report 2017–1060. Reston, VA: United States Geological Survey.
Tasker, M. L., Amundin, M., André, M., Hawkins, A., Lang, W., Merck, T., et al. (2010). Marine Strategy Framework Directive Task Group 11 Report: Underwater noise and other forms of energy. Luxembourg: Office for Official Publications of the European Communities.
Tyack, P. L. (2017). Developing an essential ocean variable for the acoustic environment. J. Acoust. Soc. Am. 141, 3525–3525. doi: 10.1121/1.4987432
Wenz, G. M. (1962). Acoustic ambient noise in the ocean: spectra and sources. J. Acoust. Soc. Am. 34, 1936–1956. doi: 10.1121/1.1909155
Keywords: passive acoustic monitoring, soundscape, acoustic environment, ecoacoustics, ocean noise management, marine protected areas
Citation: Haver SM, Fournet MEH, Dziak RP, Gabriele C, Gedamke J, Hatch LT, Haxel J, Heppell SA, McKenna MF, Mellinger DK and Van Parijs SM (2019) Comparing the Underwater Soundscapes of Four U.S. National Parks and Marine Sanctuaries. Front. Mar. Sci. 6:500. doi: 10.3389/fmars.2019.00500
Received: 15 May 2019; Accepted: 25 July 2019;
Published: 09 August 2019.
Edited by:
Stelios Katsanevakis, University of the Aegean, GreeceReviewed by:
Nienke Van Geel, Scottish Association For Marine Science, United KingdomJosé Lino Vieira De Oliveira Costa, University of Lisbon, Portugal
Copyright © 2019 Haver, Fournet, Dziak, Gabriele, Gedamke, Hatch, Haxel, Heppell, McKenna, Mellinger and Van Parijs. This is an open-access article distributed under the terms of the Creative Commons Attribution License (CC BY). The use, distribution or reproduction in other forums is permitted, provided the original author(s) and the copyright owner(s) are credited and that the original publication in this journal is cited, in accordance with accepted academic practice. No use, distribution or reproduction is permitted which does not comply with these terms.
*Correspondence: Samara M. Haver, c2FtYXJhLmhhdmVyQG9yZWdvbnN0YXRlLmVkdQ==