 Eurico J. D’Sa
 Ishan D. Joshi
 Bingqing Liu
 Dong S. Ko
 Christopher L. Osburn
 Thomas S. Bianchi
- 1Department of Oceanography and Coastal Sciences, Louisiana State University, Baton Rouge, LA, United States
- 2Marine Physical Laboratory, Scripps Institution of Oceanography, University of California, San Diego, San Diego, CA, United States
- 3Oceanography Division, Naval Research Laboratory, Stennis Space Center, Bay Saint Louis, MS, United States
- 4Department of Marine Earth and Atmospheric Sciences, North Carolina State University, Raleigh, NC, United States
- 5Department of Geological Sciences, University of Florida, Gainesville, FL, United States
Hurricanes are increasingly being recognized as important episodic drivers in ocean biogeochemical cycling; however, spatiotemporal response of their impacts on coastal and estuarine ecosystems are limited. Hurricane Michael, which made landfall just west of Apalachicola Bay (ApB) on October 10, 2018 as a Category 5 hurricane with sustained winds of 250 km h–1, caused widespread damage to the northwest Florida coast, and adverse effects on oyster reefs and water quality in ApB due to winds and coastal flooding associated with a strong storm surge. The impact of wind forcing and retreating storm surges on coastal and shelf biogeochemical properties remains, however, largely unknown. In this study, we use a combination of pre-hurricane field observations, ocean-color satellite imagery and the outputs (salinity, currents, sea surface height, and temperature) of a nested high-resolution three-dimensional hydrodynamic model (NCOM) to examine the biogeochemical response of ApB and the surrounding shelf waters to Hurricane Michael. MODIS-derived optical proxies (e.g., absorption of colored dissolved organic matter or CDOM and particle backscattering coefficients) of dissolved and particulate organic carbon (DOC and POC) were derived for a series of clear-sky imagery (prior to and following the hurricane) using a combination of estuarine-tuned semi-analytic and empirical algorithms. Following the hurricane, spatiotemporal distribution of both DOC and POC in ApB and the nearshore coastal waters showed a strong response to storm surge, increasing river discharge, currents, and wind field. Average flux estimates of organic carbon exported from ApB between October 5–21, 2018 to the coastal ocean were much greater for DOC (0.86 × 10⁶ kg C d–1) than POC (0.21 × 10⁶ kg C d–1) and increased with increasing river discharge and the wind field. A bio-optical inversion algorithm applied to Sentinel-3A OLCI imagery of 13 October, 2018 immediately following the hurricane’s passage, showed a strong, week-long biological response with spatially distinct phytoplankton blooms of Karenia brevis and Emiliania Huxleyi, as detected by satellite imagery of pigments, an approach that could revolutionize our understanding of environmental impacts on phytoplankton. This study revealed spatiotemporal changes in estuarine and coastal ocean biogeochemistry reflective of a systematic regional ecosystem response to Hurricane Michael.
Introduction
Projections of increased intensity of hurricanes in a warming climate remains a major concern in terms of threats to human lives in expanding coastal communities and its economic consequences (Emanuel, 2005). Hurricanes also impact the natural cycles of local waters such as increases in primary production (Lin et al., 2003; McKinnon et al., 2003; Babin et al., 2004). This enhanced primary production has been attributed to increases in the mixed-layer depth, decreases in sea-surface temperature (SST), breakdown in water column stratification, and upwelling (Williams et al., 2001; Davis and Yan, 2004; Black and Dickey, 2008). Consequently, an increase in the intensity and frequency of hurricanes could potentially have dramatic regional effects on coastal biogeochemical cycles. Moreover, enhanced hurricane activity, coupled with higher precipitation events (Emanuel, 2013, 2017), could result in greater storm surge flooding, higher discharge from rivers and coastal watersheds, and increased nutrient, particulate and dissolved organic carbon (POC and DOC) loading, potentially driving large-scale changes in coastal ecosystems (Paerl et al., 1998; McKinnon et al., 2003; Liu et al., 2019a). For example, in 2001, Hurricane Irene caused major increases in freshwater discharges and DOC concentrations in the Neuse River which resulted in roughly 19 times more export of DOC to the Neuse River Estuary than pre-storm conditions (Brown et al., 2014). To date, the extents of these impacts are not well understood since access to these impacted regions are relatively restricted in conditions immediately following a hurricane. As such, remote sensing and hydrodynamic modeling have provided greater insights on the impact of hurricanes on oceanic and shelf waters (Babin et al., 2004; Davis and Yan, 2004; Walker et al., 2005; Lohrenz et al., 2008; Zamudio and Hogan, 2008; D’Sa et al., 2011; Farfan et al., 2014).
Ocean-color satellite remote sensing offers the capability for synoptic monitoring of the marine environment over large spatial scales, at frequent intervals, and during severe weather conditions. Most ocean-color studies have shown greater chlorophyll a concentrations (Chl a, an indicator of phytoplankton biomass) in oceanic, shelf and coastal waters following hurricane events (Babin et al., 2004; Yuan et al., 2004; Miller et al., 2006; Hanshaw et al., 2008). The passage of numerous hurricanes on both east and west coasts of Mexico and the US east coast resulted in distinct increases surface Chl a (Davis and Yan, 2004; Farfan et al., 2014). Satellite studies in the northern Gulf of Mexico (nGoM) have reported changes in Chl a that have been linked to a decrease in SST (Walker et al., 2005). While phytoplankton community responses to hurricane passage are important to estuarine food web dynamics (Paerl et al., 2001), their effects on phytoplankton composition using satellite ocean color have been limited. However, taxonomic changes in the phytoplankton community were recently observed in Galveston Bay (using satellite ocean color) after the passage of Hurricane Harvey (Liu et al., 2019a).
Hurricanes can enhance the delivery of DOC and POC to estuaries and coastal waters (Avery et al., 2004; Brown et al., 2014; Paerl et al., 2018). Ocean color estimates of DOC, based on robust relationships observed between DOC and CDOM (colored dissolved organic matter; an optically active constituent and proxy for DOC) have been largely made in river-dominated coastal waters (Fichot and Benner, 2011; Mannino et al., 2015; Le et al., 2016; Osburn et al., 2016; Joshi et al., 2017). Thus, numerous estimates of CDOM concentrations in coastal and shelf waters have been made with satellite ocean color using empirical algorithms that relate CDOM absorption coefficients to remote sensing reflectance band ratios (D’Sa and Miller, 2003; D’Sa et al., 2006; D’Sa, 2008; Mannino et al., 2008, 2014; Tehrani et al., 2013; Joshi and D’Sa, 2015; Joshi et al., 2017; Liu et al., 2019b). Similar approaches have been developed for POC, that include a direct empirical relationship between POC and a reflectance band ratio or two-step algorithms relating reflectance to backscattering coefficient and then to POC (Stramski et al., 1999; Gardner et al., 2006; Stramski et al., 2008). More recently, a multiple regression algorithm, relating POC to multiple reflectance bands of the MODIS-Aqua satellite sensor, was reported for Louisiana shelf/slope waters (Le et al., 2016). However, there are limitations with empirical band ratio algorithms because they are generally optimized for specific regions or seasons. In contrast, semi-analytic algorithms, based on radiative transfer theory (Gordon et al., 1988; Lee et al., 2002), allow for the estimation of inherent optical properties (IOPs), such as absorption and backscattering coefficients in oceanic and shelf waters directly from ocean-color data. The applicability of these semi-analytic approaches to optically complex coastal and estuarine waters would facilitate the estimation of IOPs, such as CDOM absorption and particle backscattering coefficients, the two optical proxies for DOC and POC, respectively.
Semi-analytic approaches such as the quasi-analytic algorithm or QAA (Lee et al., 2002) are based on the radiative transfer theory that relate spectral remote sensing reflectance Rrs (obtained just above sea water) to optical properties such as the total spectral absorption a (due to water itself, CDOM and non-algal particles), and backscattering bb coefficients (m–1) of the medium. More recently, a semi-analytical approach, based on the QAA, namely QAA-V, was tuned for the turbid coastal waters, and performed more effectively in estuarine waters (Joshi and D’Sa, 2018). The application of QAA-V to atmospherically corrected Rrs from ocean color sensors such as VIIRS-NPP or MODIS-Aqua allows the determination of total absorption and backscattering coefficients in estuarine waters - directly from satellite data. Additional information from field (e.g., slope of CDOM spectra) and satellite observations is often used to retrieve absorption by CDOM and non-algal particles (D’Sa et al., 2018). The QAA-V in conjunction with field derived relationships between absorption/backscattering coefficients and DOC/POC concentrations have been used to derive DOC and POC maps of Galveston Bay (D’Sa et al., 2018). Optical inversion algorithms such as the non-negative linear square (NNLS) algorithm have been developed to estimate phytoplankton pigment composition from satellite ocean color data (Moisan et al., 2017). The NNLS algorithm for example uses information on the in vivo spectral absorption coefficients of phytoplankton and pigments in combination with standard MODIS Chl a product to obtain phytoplankton pigment maps of northeastern US shelf waters (Moisan et al., 2017). A similar technique based on in vitro absorption properties of algal pigments and satellite-estimated Chl a, from a Red to NIR band ratio empirical algorithm, has also generated pigment composition maps in Galveston Bay, using the Sentinel-3A OLCI data with higher spectral and spatial resolution (Liu et al., 2019a). Ocean color remote sensing is however, often limited by cloud cover especially during and after hurricanes and numerical modeling approaches, in combination with ocean color, have allowed for a better understanding of the physical-biogeochemical interactions associated with hurricane passages in the coastal ocean (Chen et al., 2009; D’Sa et al., 2011).
The nGoM has been impacted by hurricanes with increasing frequency and intensity that have affected many coastal ecosystems in the region (Turner et al., 2006; Keim et al., 2007). Most recently, Hurricane Michael made its track along the northeastern Gulf of Mexico (neGoM), before making landfall as a Category 5 hurricane on October 10, 2018, just west of Apalachicola Bay (ApB), a shallow, sub-tropical, bar-built, and river-dominated estuary on the Florida Panhandle. It then moved rapidly inland depositing large amounts of precipitation before weakening to a tropical storm over Georgia. A storm surge of ∼2.5 m was recorded in ApB which sustained severe damage due to the storm surge and intense winds. In this study, we used a combination of field observations collected prior to the hurricane, the outputs of a high-resolution numerical ocean model and satellite ocean color data, to examine the physical and biogeochemical response in ApB and the surrounding northwest Florida shelf waters to this event. An ocean color semi-analytic algorithm (QAA-V) was used to obtain absorption and backscattering coefficients from MODIS-Aqua imagery and then combined with empirical relationships based on pre-hurricane field data to estimate DOC and POC concentrations throughout ApB and surrounding coastal waters. The outputs of a numerical hydrodynamic model (NCOM) were then used in combination with satellite estimates of DOC and POC to calculate estuarine organic carbon fluxes to the coastal ocean. Finally, an inversion approach was applied to cloud free Sentinel-3A OLCI imagery to assess the phytoplankton response in northwest Florida shelf waters following the hurricane passage.
Materials and Methods
Study Area
The path of Hurricane Michael through the nGoM and its landfall as a strong Category 5 hurricane strongly impacted the north Florida shelf and coastal waters including ApB, an elongated shallow estuary with an average depth ∼ 3 m and area of ∼540 km2 (Figure 1). ApB, a highly productive estuary is designated as a National Estuarine Research Reserve, is well known for its oyster harvest that in the past accounted for ∼10% of the nation’s oyster production (Wilber, 1992; Havens et al., 2013). A major source of freshwater to the bay, Apalachicola River (AR) is the third largest river in the northern GOM with the greatest discharge of any Florida river, and a drainage basin of ca. 48,500 km2 that extends into Georgia (Livingston, 2014). Another source of freshwater to the bay, albeit considerably smaller, is from the blackwater Carrabelle River (Figure 1). Water exchange between the relatively fresh bay and saline Gulf waters occur through a few passes (Indian Pass, West Pass, East Pass, and Sikes Cut) located between several barrier islands that separate the bay from the Gulf waters (Figure 1). The neGoM region impacted by the hurricane considered in this study includes the northwest Florida shelf, which is broadly sloping south of Big Bend and tapers narrower northwest of Cape San Blas (Figure 1). Shelf waters are generally stratified from April to November due to seasonally weaker winds and surface heat gain (He and Weisberg, 2002); eddies associated with the Loop Current, located adjacent to the shelf edge (Walker et al., 2011), can also impact the hydrodynamics of this region.
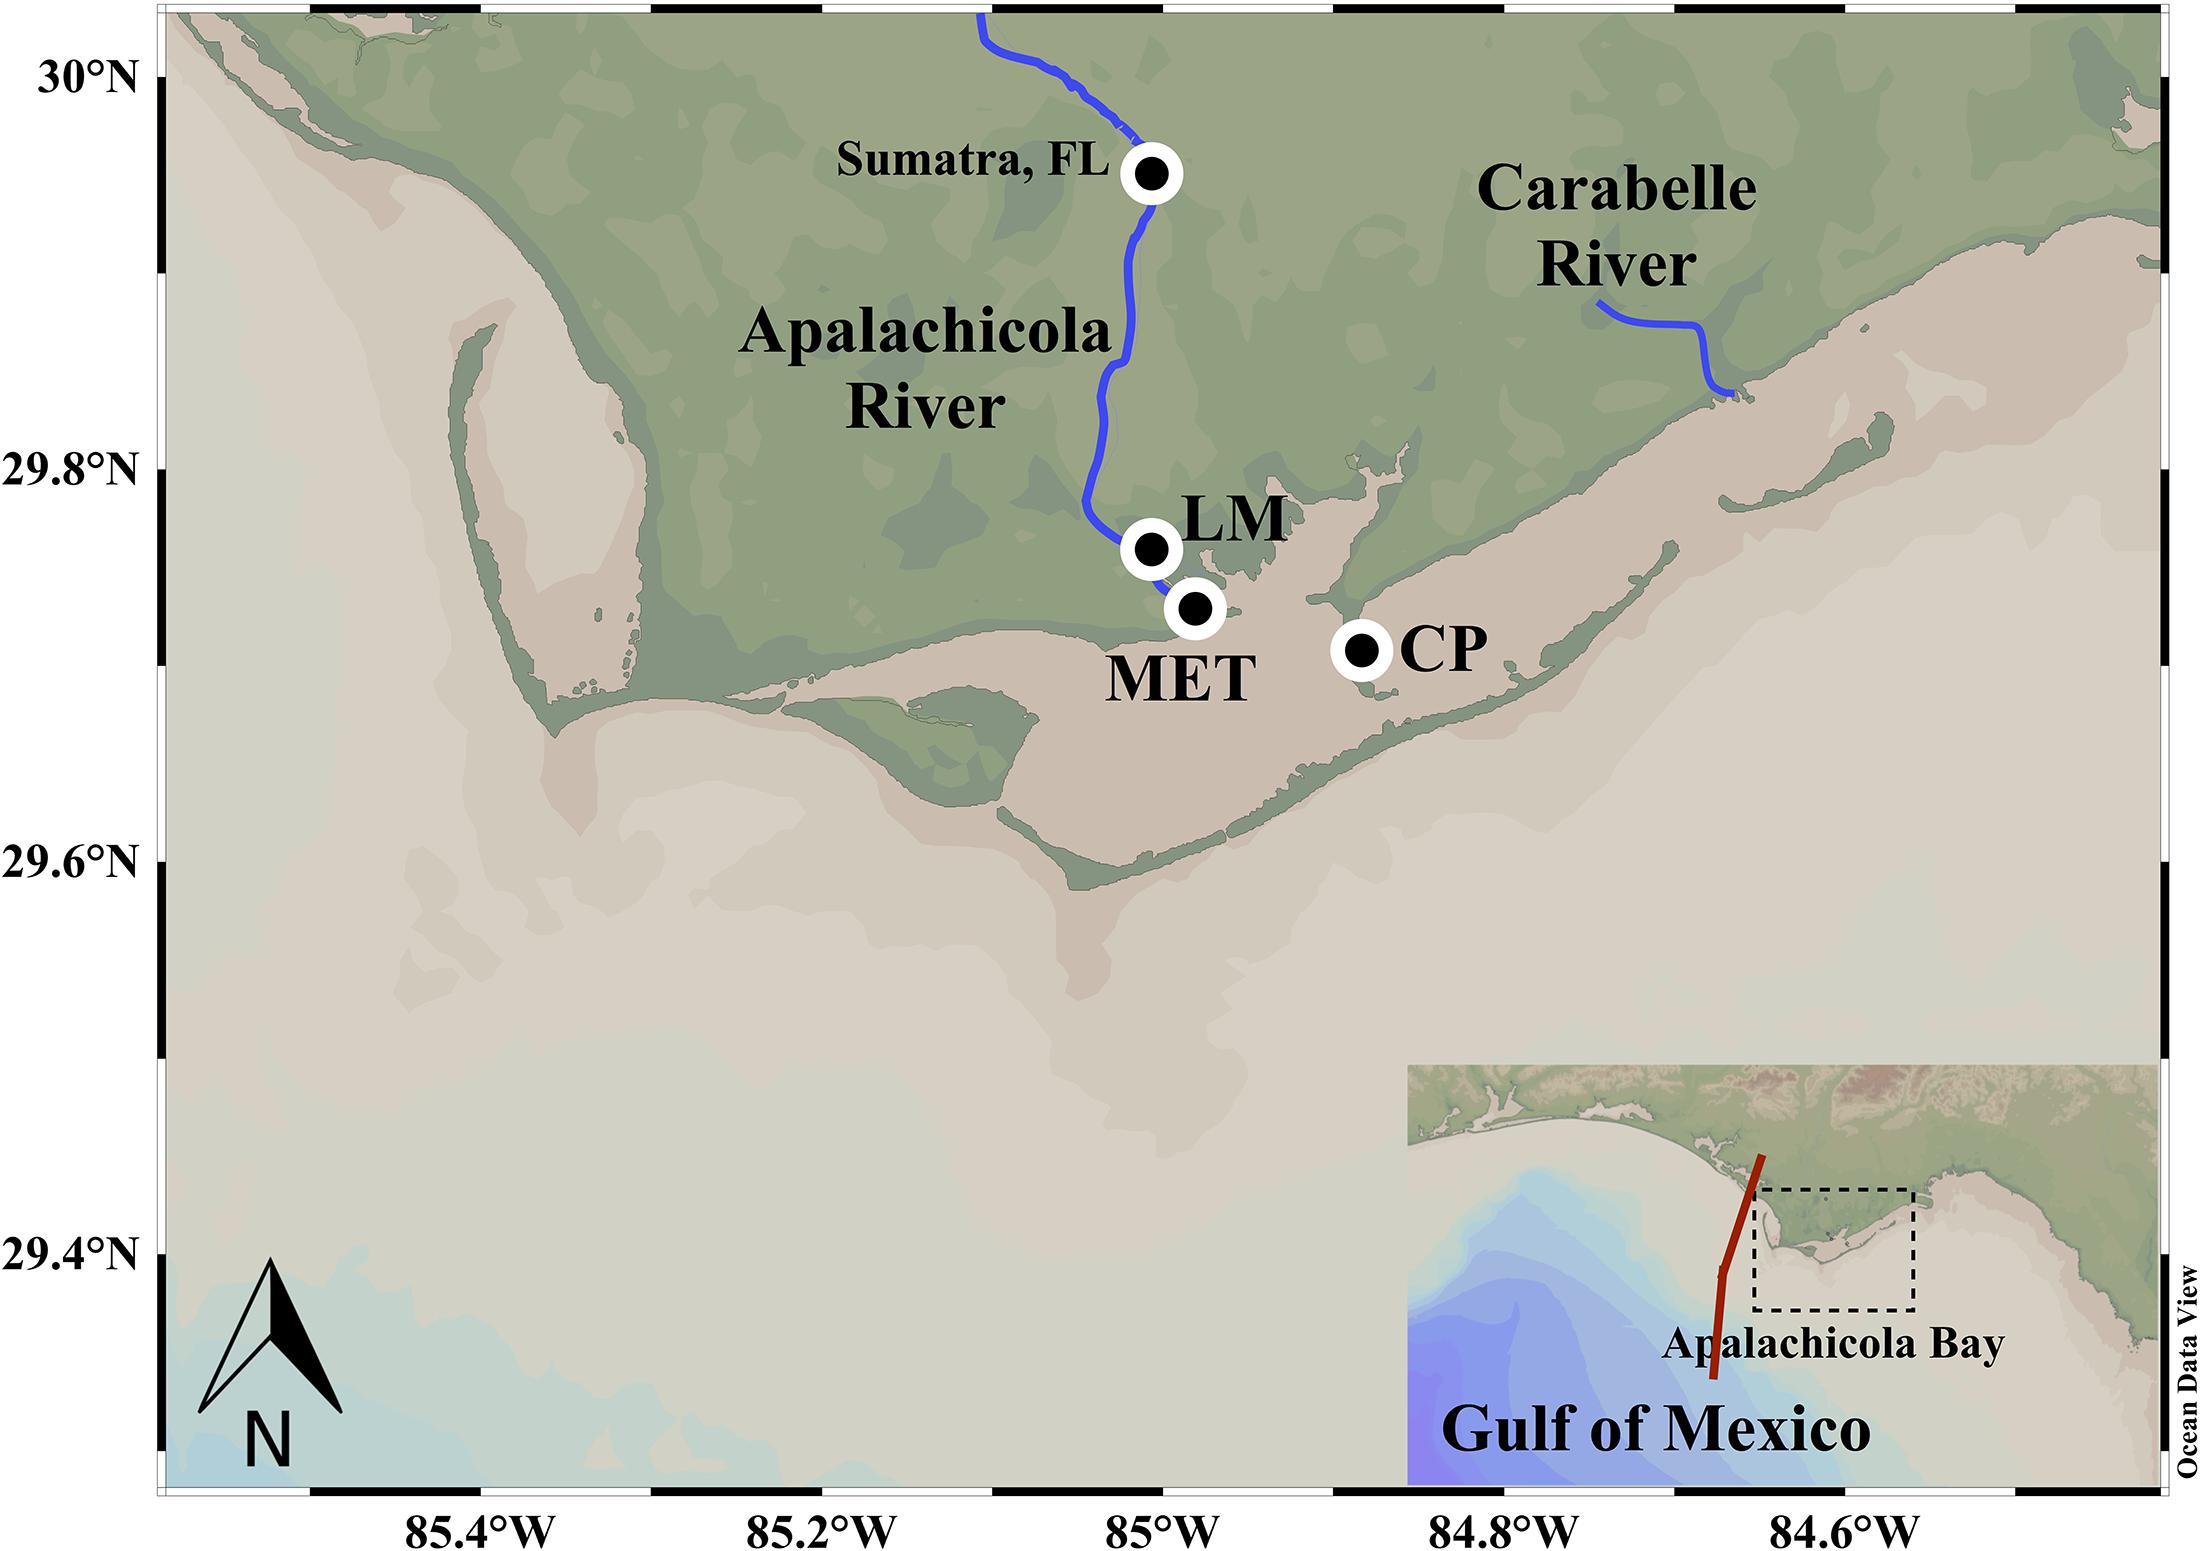
Figure 1. Study area. Apalachicola Bay (ApB) and the surrounding shelf waters with the main Apalachicola River and the smaller Carabelle River flowing into the bay. Circles denote the location of the river stage station (Sumatra, FL, United States), meteorological station (LM) and the water quality monitoring station at Cat Point (CP) in ApB. Inset shows the northeast Gulf of Mexico region comprising ApB showing track of hurricane Michael (red line).
Optical and Hydrological Measurements
Surface water samples were collected in ApB during three field surveys in March 2015, November 2015, and July 2016 and processed for spectral CDOM and particulate absorption measurements (Joshi et al., 2017). Briefly, for CDOM spectral absorption measurements, water samples were filtered through 0.2-μm pre-rinsed Nuclepore filters on the same day and stored in acid cleaned, pre-combusted amber bottles with Teflon-lined caps at 4°C in the dark, and processed within a week for CDOM spectral absorption on a dual beam Perkin-Elmer Lambda 850 spectrophotometer. CDOM absorption coefficients were measured at 412 nm (ag412), as methods described in Joshi and D’Sa (2015). For determinations of light absorption by suspended particulate matter, particles were collected on a 25 mm diameter Whatman GF/F filter and stored in liquid nitrogen until measurement. Particulate (total – ap and non-algal – aNAP) absorption were measured on a Perkin-Elmer Lambda 850 spectrophotometer fitted with a 15-cm diameter integrating sphere (Naik and D’Sa, 2012). Sub-surface water particulate backscattering coefficients at 532 nm (bbp532) were measured with a Wetlabs Eco triplet sensor (D’Sa et al., 2006). Above-water remote sensing reflectance (Rrs0+, sr–1) were derived from above-water measurements of water-surface, sky, and reference plate radiances, using a GER 1500 512iHR spectroradiometer under clear sky conditions (Mobley, 1999; additional details in Joshi et al., 2017). A total of 425 measurements of in-situ phytoplankton absorption spectra aphy(λ) and Chl a concentrations between 2006 to 2016 were also obtained from the NASA SeaBASS archive. Daily AR discharge data were obtained from USGS station near Sumatra, while the wind and pressure data were obtained from the Apalachicola National Estuarine Research reserve at the East Bay station (Figures 1, 2).
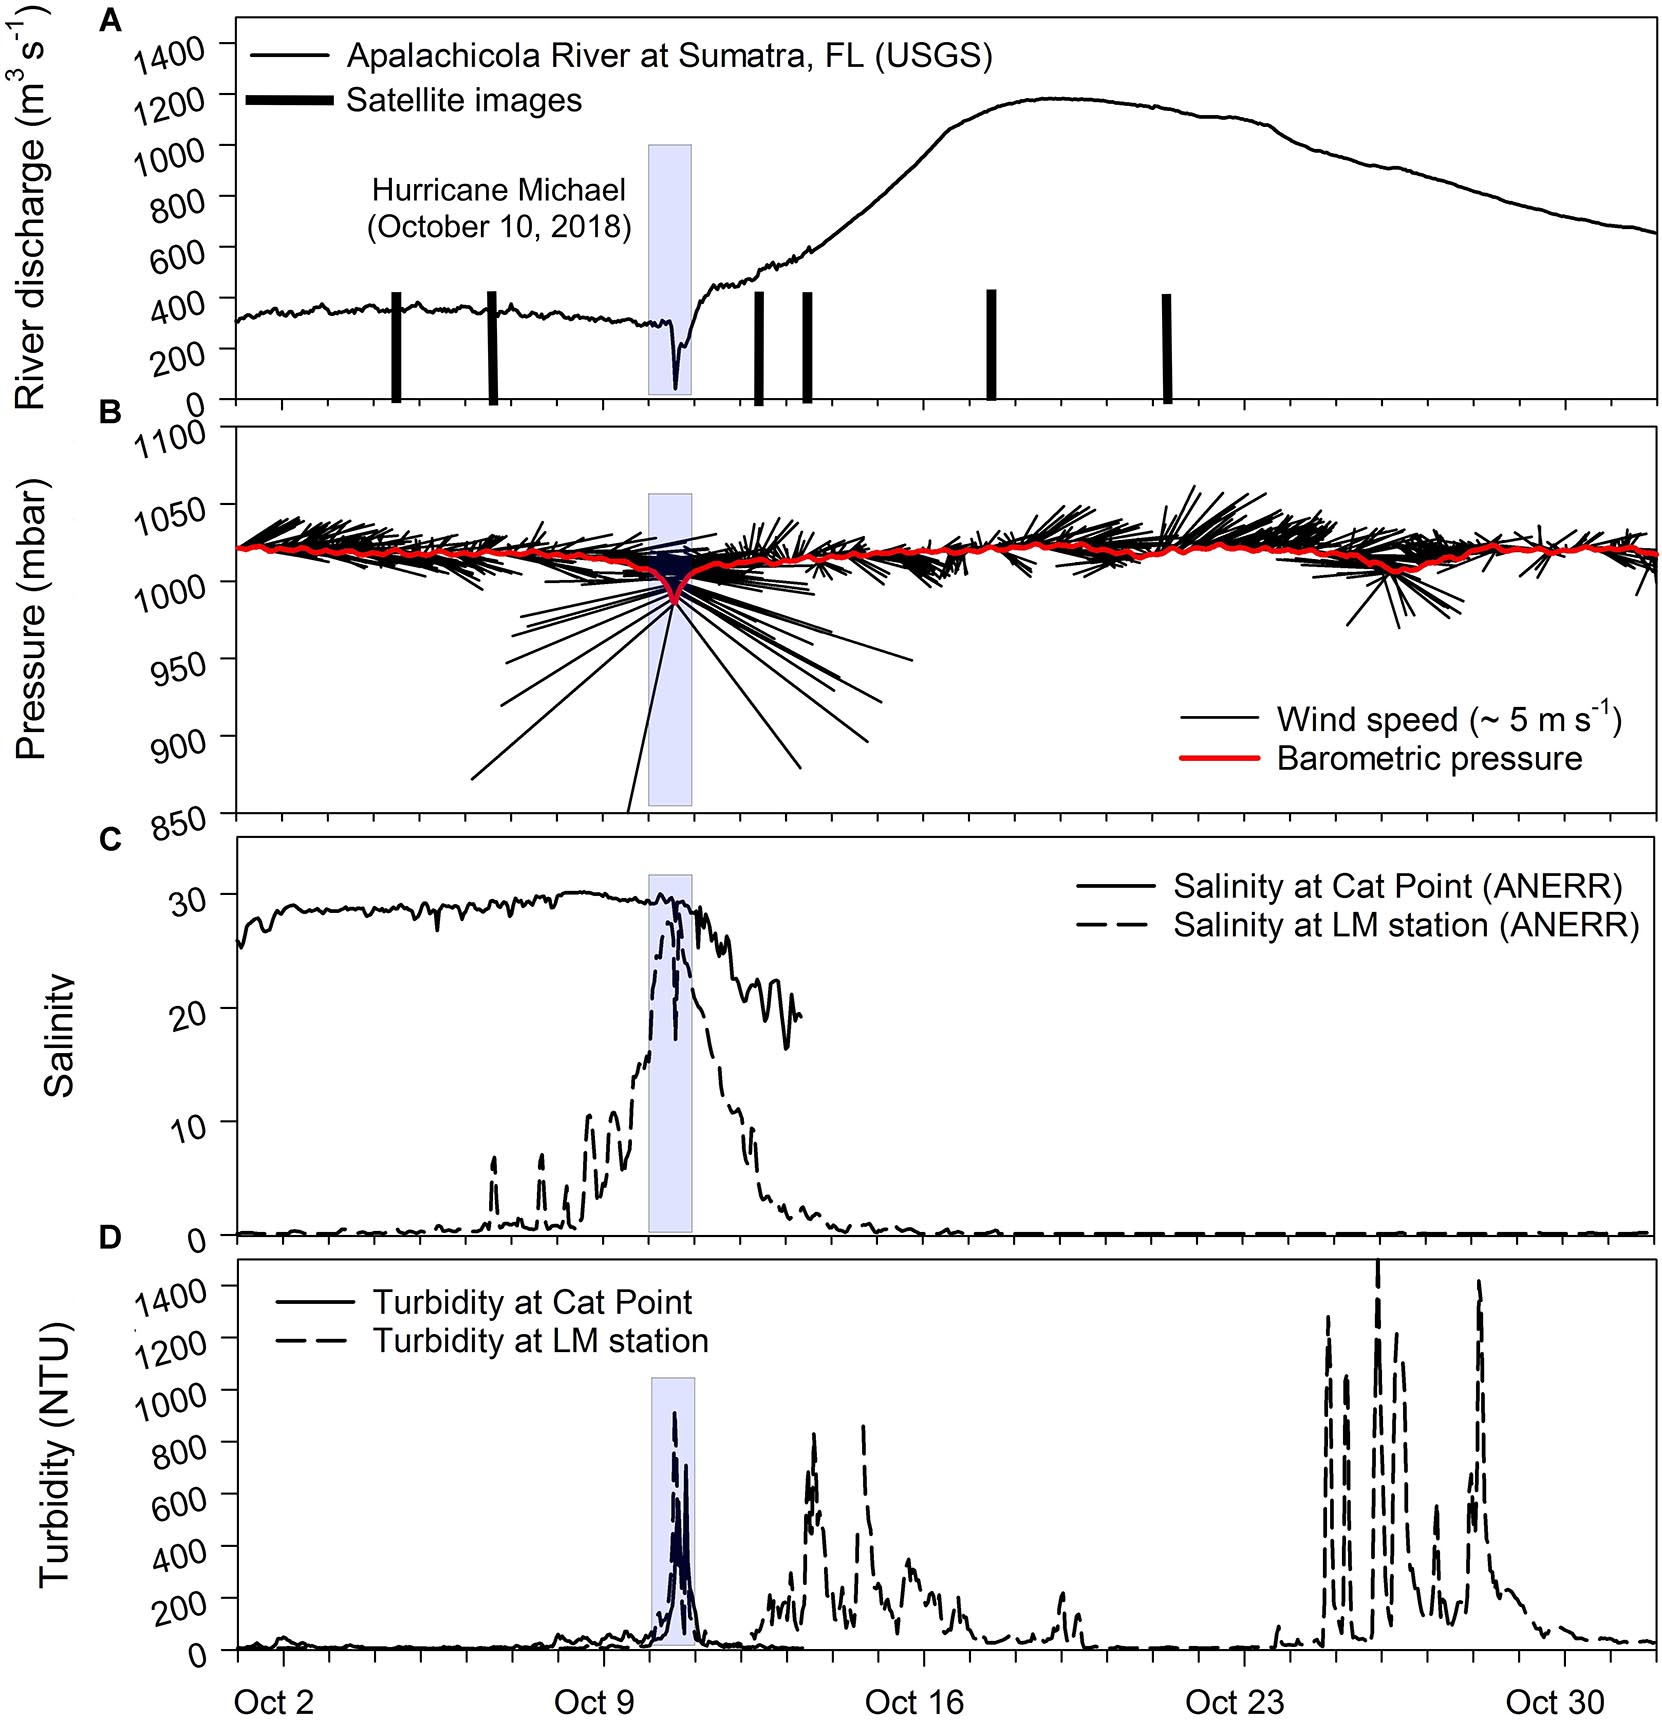
Figure 2. Time-series measurements during October 2018. (A) Apalachicola River discharge (m3s–1) with vertical black bars denoting availability of mostly cloud free MODIS imagery on 4, 6, 12, 13, 17, and 21, October 2018. (B) air pressure and wind vectors (wind speed and direction from true north) with light blue bar on 10 October 2018 representing the Hurricane Michael landfall, (C) salinity at Cat Point (CP; solid line) and LM station (LM; dashed line), and (D) turbidity at CP and LM stations for the period 1–31 October 2018.
Chemical Measurements
Samples for DOC were filtered through pre-combusted (450°C for 6 h), pre-rinsed Whatman GF/F filters and stored in acid cleaned, pre-combusted amber bottles with Teflon-lined caps. DOC was measured on an OI Analytical 1030D TOC analyzer using wet chemical oxidation (sodium persulfate) - modified for seawater analyses (Osburn and St-Jean, 2007). Milli-Q laboratory water (18.2 MΩ; <10 μg C L–1 TOC) was used to prepare standards and reagents and as a blank. Calibration of the instrument was achieved daily using solutions of caffeine (0–20 mg C L–1); reproducibility was <5% RSD (relative standard deviation). Routine measurement of Hansell Certified Reference Material (CRM) DOC standards with each analytical run resulted in DOC values of 0.54 ± 0.07 mg C L–1.
Particulate organic carbon concentration was measured on particles retained on the GF/F filters used to filter DOC. Each filter was packed into a solvent-rinsed air-dried tin capsule and combusted in a Thermo Flash 1112 elemental analyzer. The resulting CO2 was quantified based on standards of acetanilide; reproducibility was <5% RSD.
NCOM Ocean Circulation Model and Flux Calculations
The Navy Coastal Ocean Model (NCOM), based on the Princeton Ocean Model (POM) uses a nested modeling approach (Ko et al., 2008) with a high-resolution (∼250 m) estuarine model for ApB (Figure 3c). This model is nested within a lower 1.5 km resolution neGoM regional model (Figure 3b) that connects the deep Gulf to the coast - and then to ApB (Joshi et al., 2017). The estuarine model is driven by realistic tides and real-time river flows and to a lesser extent by winds, evaporation and rainfall which are from a high-resolution regional weather forecast model, the coupled ocean/atmosphere mesoscale prediction system (COAMPS). In this study, we examined the ApB and neGoM model results of sea level, surface currents, salinity, and temperature for the month of October 2018. Specifically, we used cloud-free ocean color satellite imagery obtained on 4, 6, 12, 13, 17, and 21 October to estimate DOC and POC concentrations (Figures 4, 5) and corresponding model outputs to examine physical linkages to DOC and POC distributions (Figures 6, 7) and calculate their fluxes (Figure 8) in the study area. Volume fluxes of water in-or-out of the bay were obtained from the NCOM ocean model by integrating hourly flows (current, in m s–1, times vertical cross-section, in m2) around all the bay passes (Joshi et al., 2017). Hourly DOC and POC flux rates over multiple tidal cycles were then computed by multiplying the satellite-derived DOC and POC concentrations by the volume of water transported through the passes. Similarly, the neGOM regional NCOM model (Figure 9a) was used along with satellite imagery (Figures 9b, 10a) to examine larger scale linkages in the shelf waters.
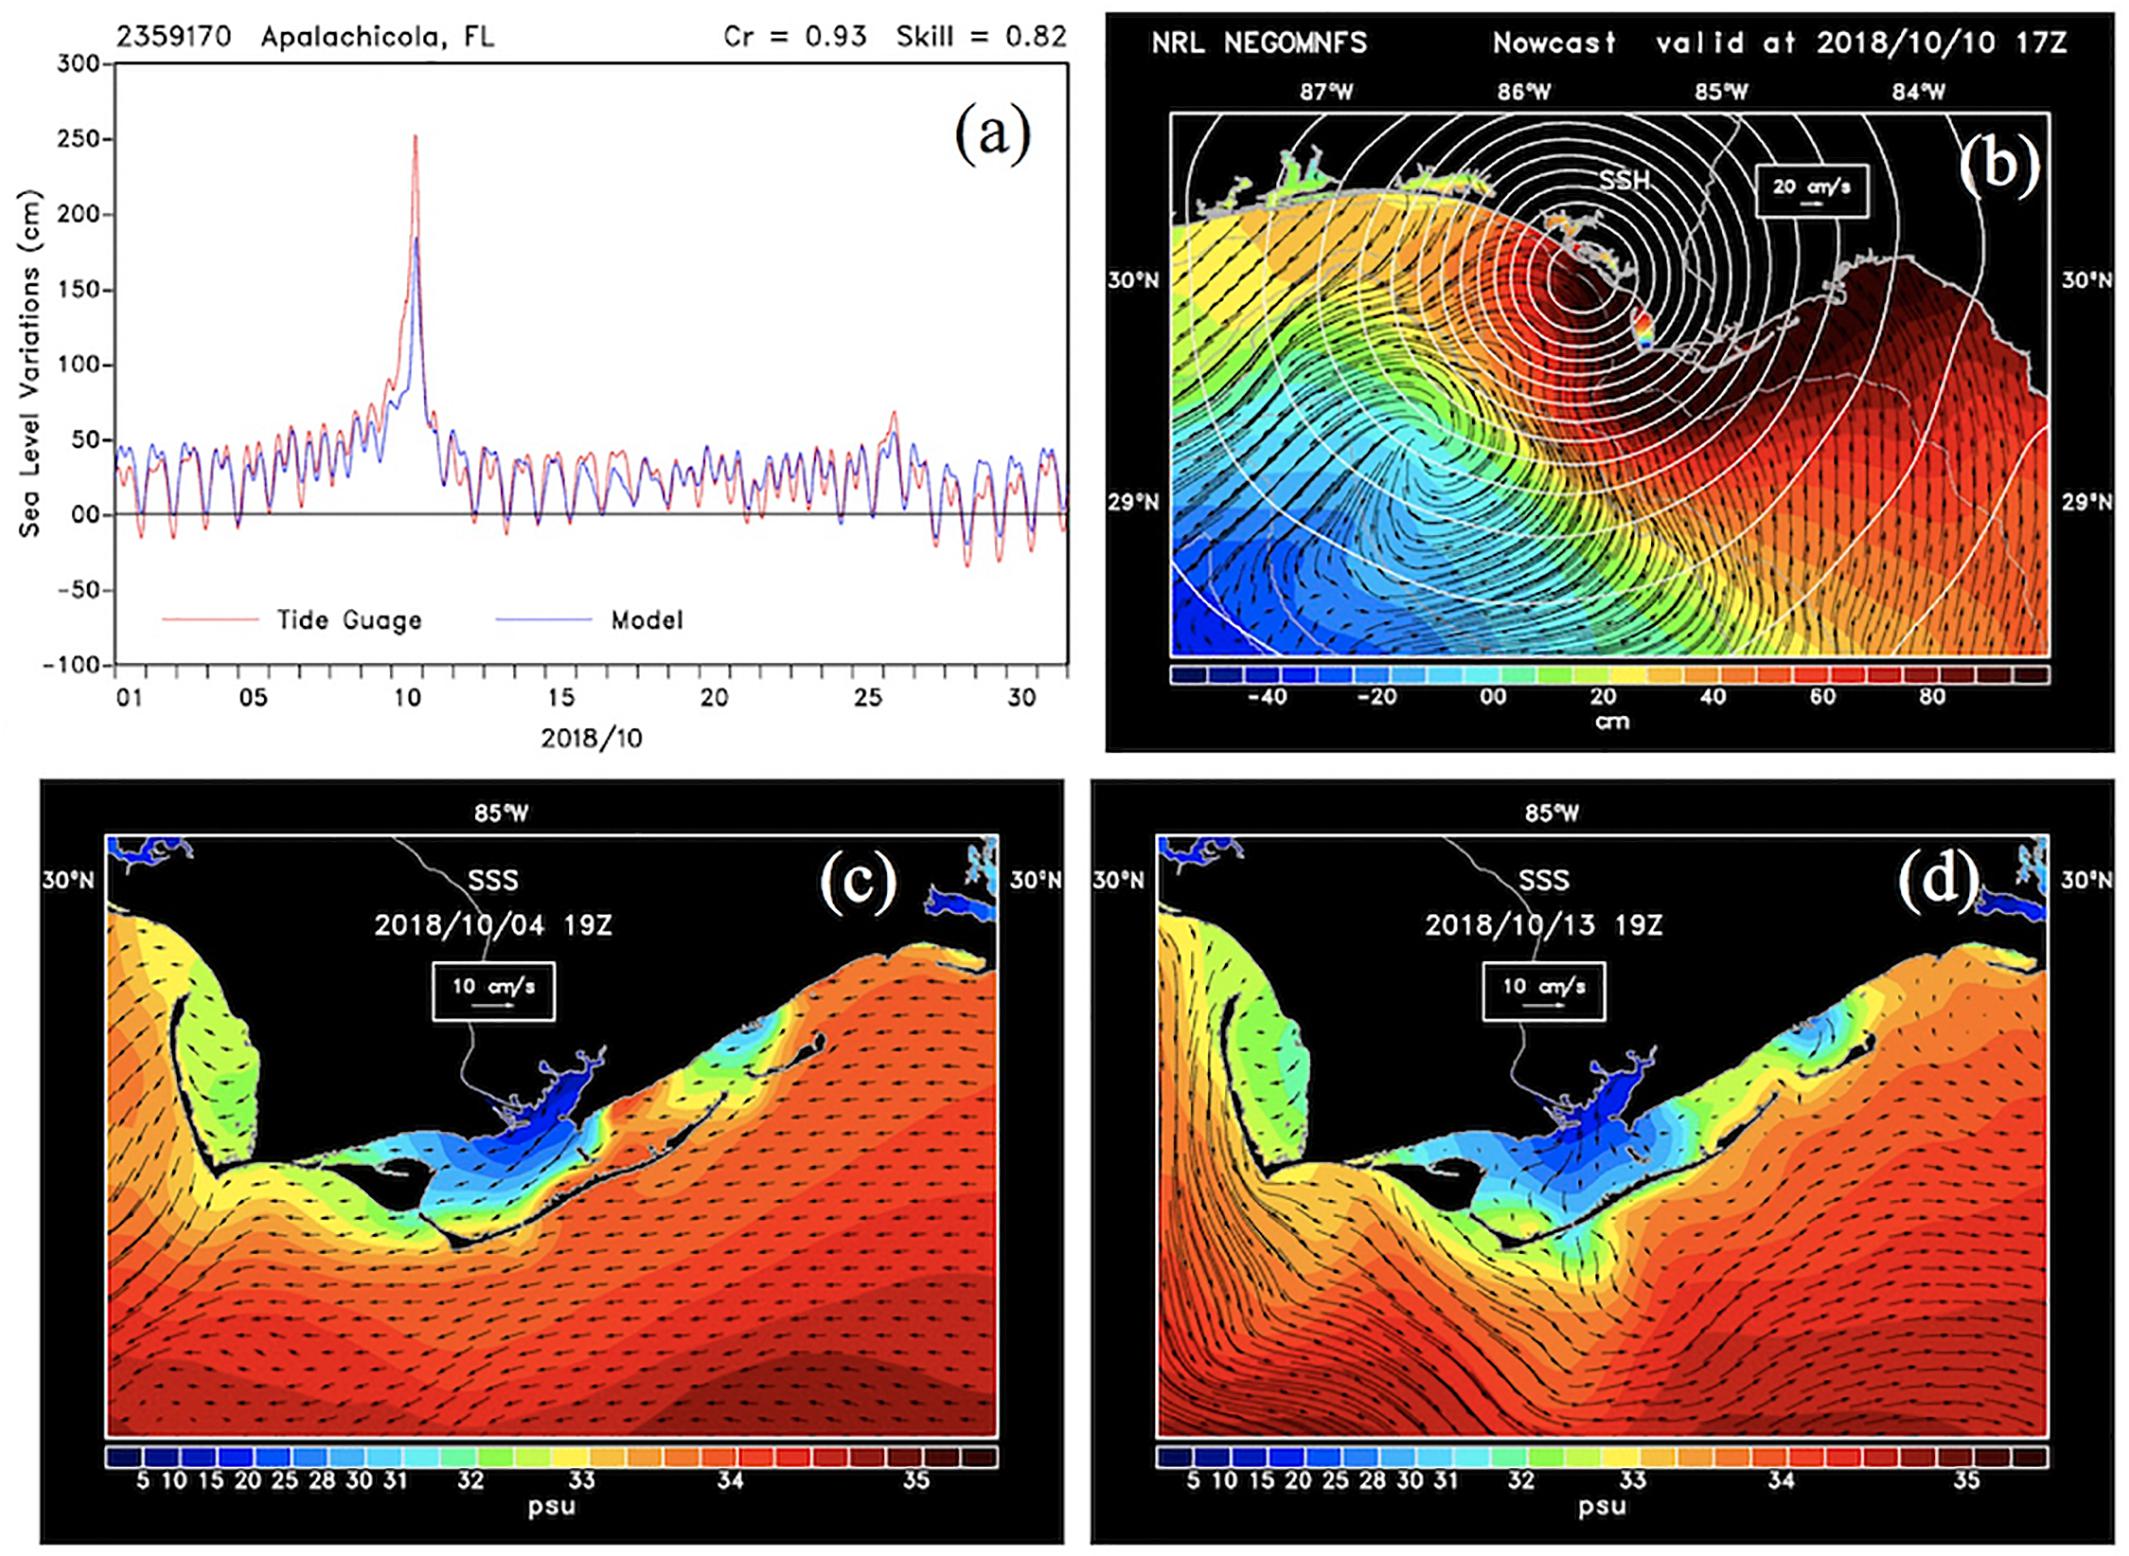
Figure 3. NCOM model outputs. (a) Sea level variations from model simulations and the NOAA National Ocean Service (NOS) tide gauge station located in Apalachicola, Florida; (b) model simulation of surface elevation superimposed by surface currents and air pressure for October 10, 2018 during Hurricane Michael landfall just east of ApB. (c,d) Sea surface salinity (SSS) and superimposed by de-tided surface currents on October 4 and 13, 2018.
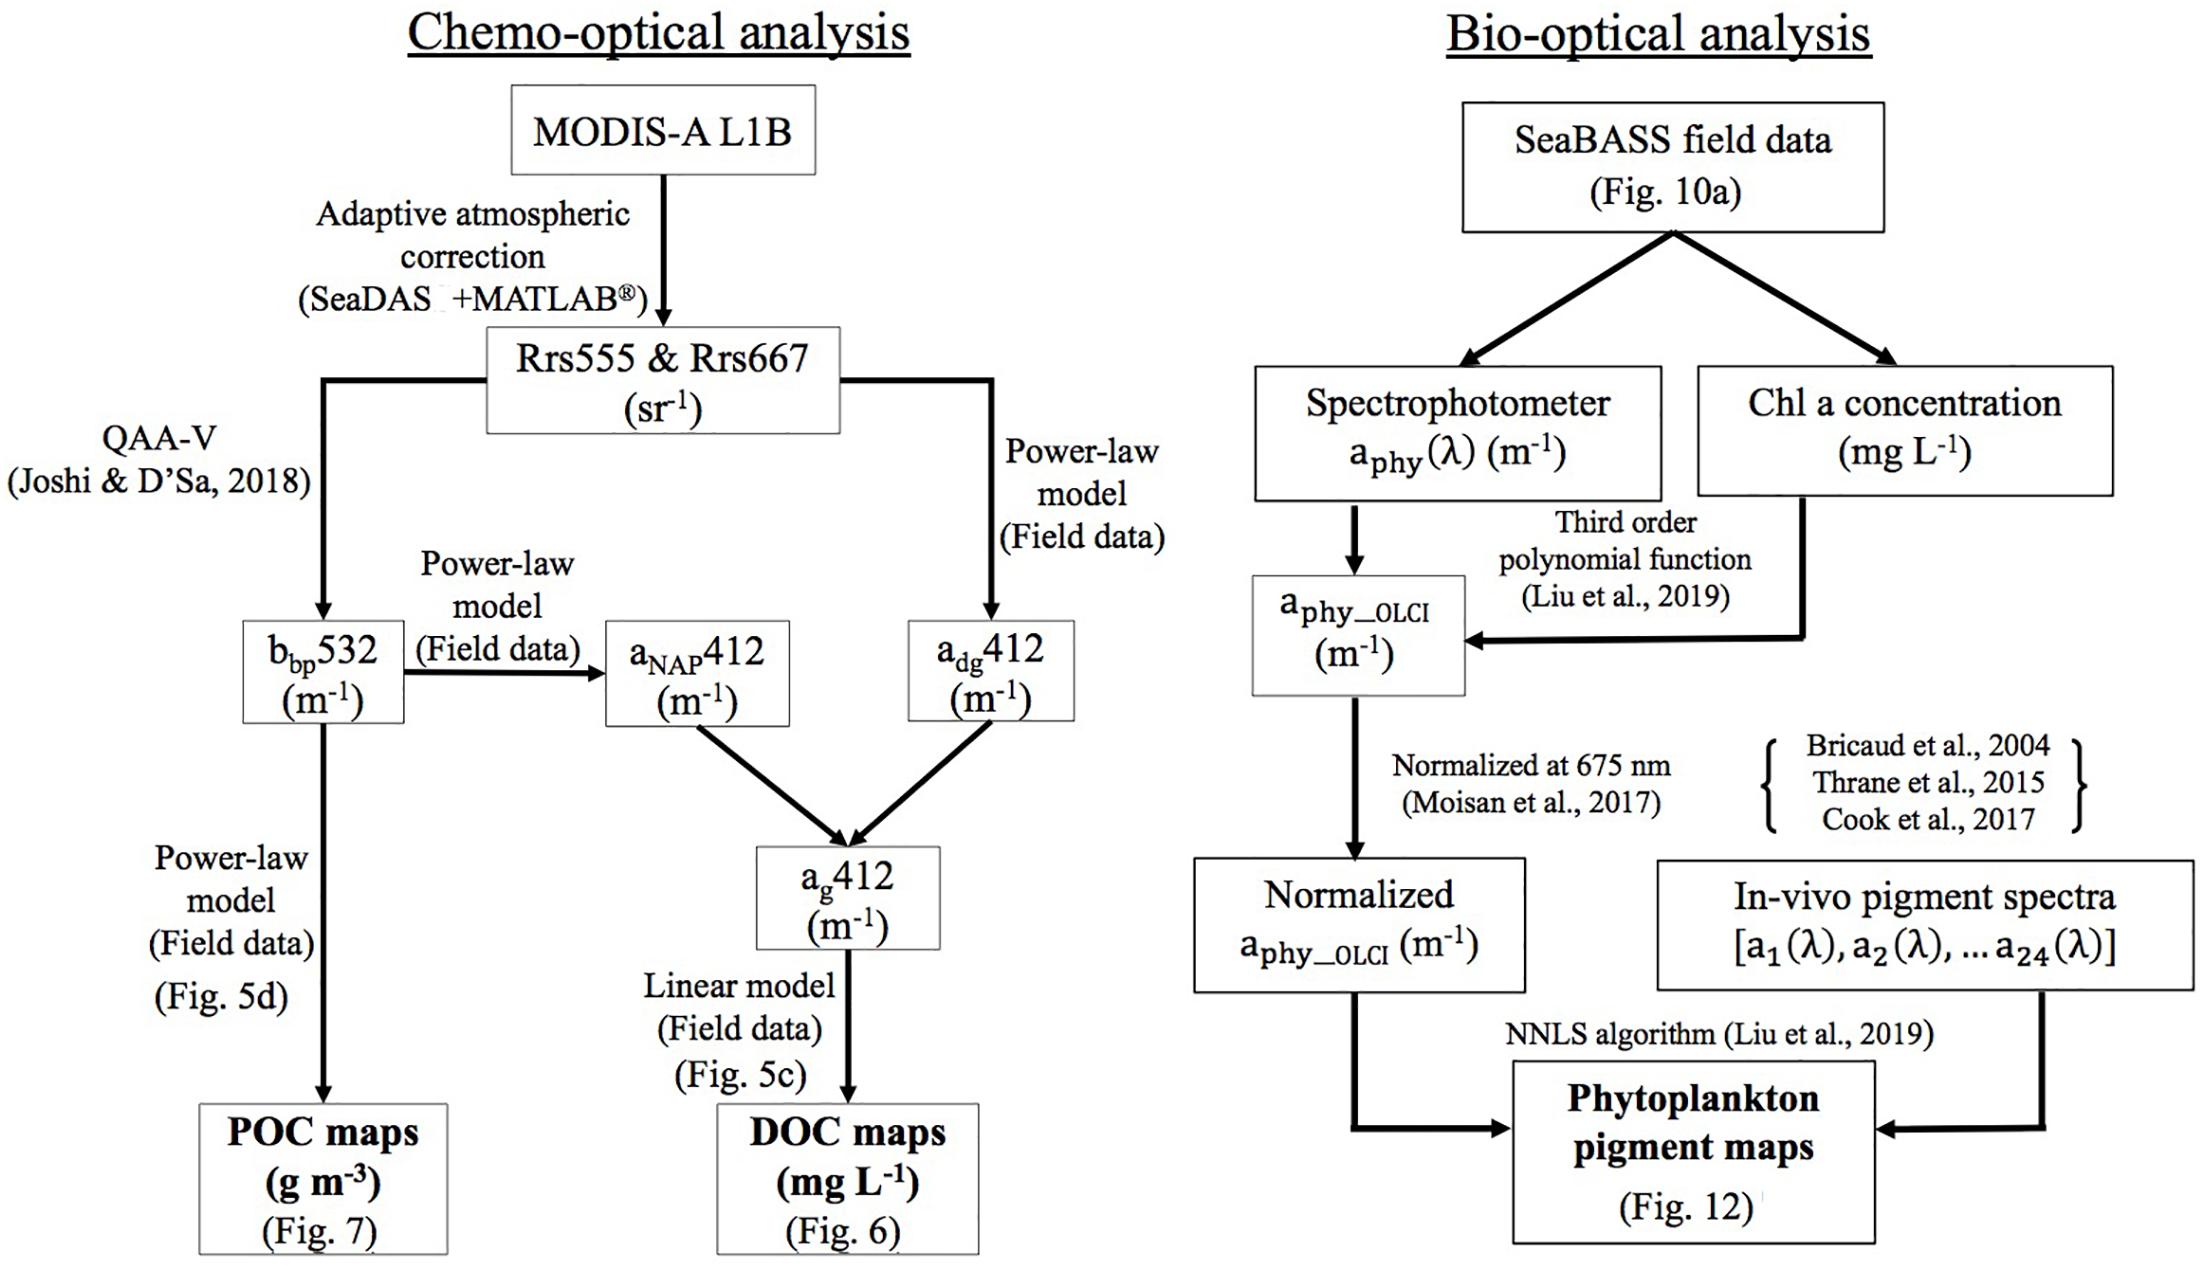
Figure 4. Schematic diagrams. Processing pathways (left panel: chemo-optical analysis) for generation of DOC and POC maps of ApB from MODIS imagery and (right panel: bio-optical analysis) for generation of Chl a and phytoplankton pigment maps of the northwest Florida shelf waters from Sentinel-3 OLCI imagery.
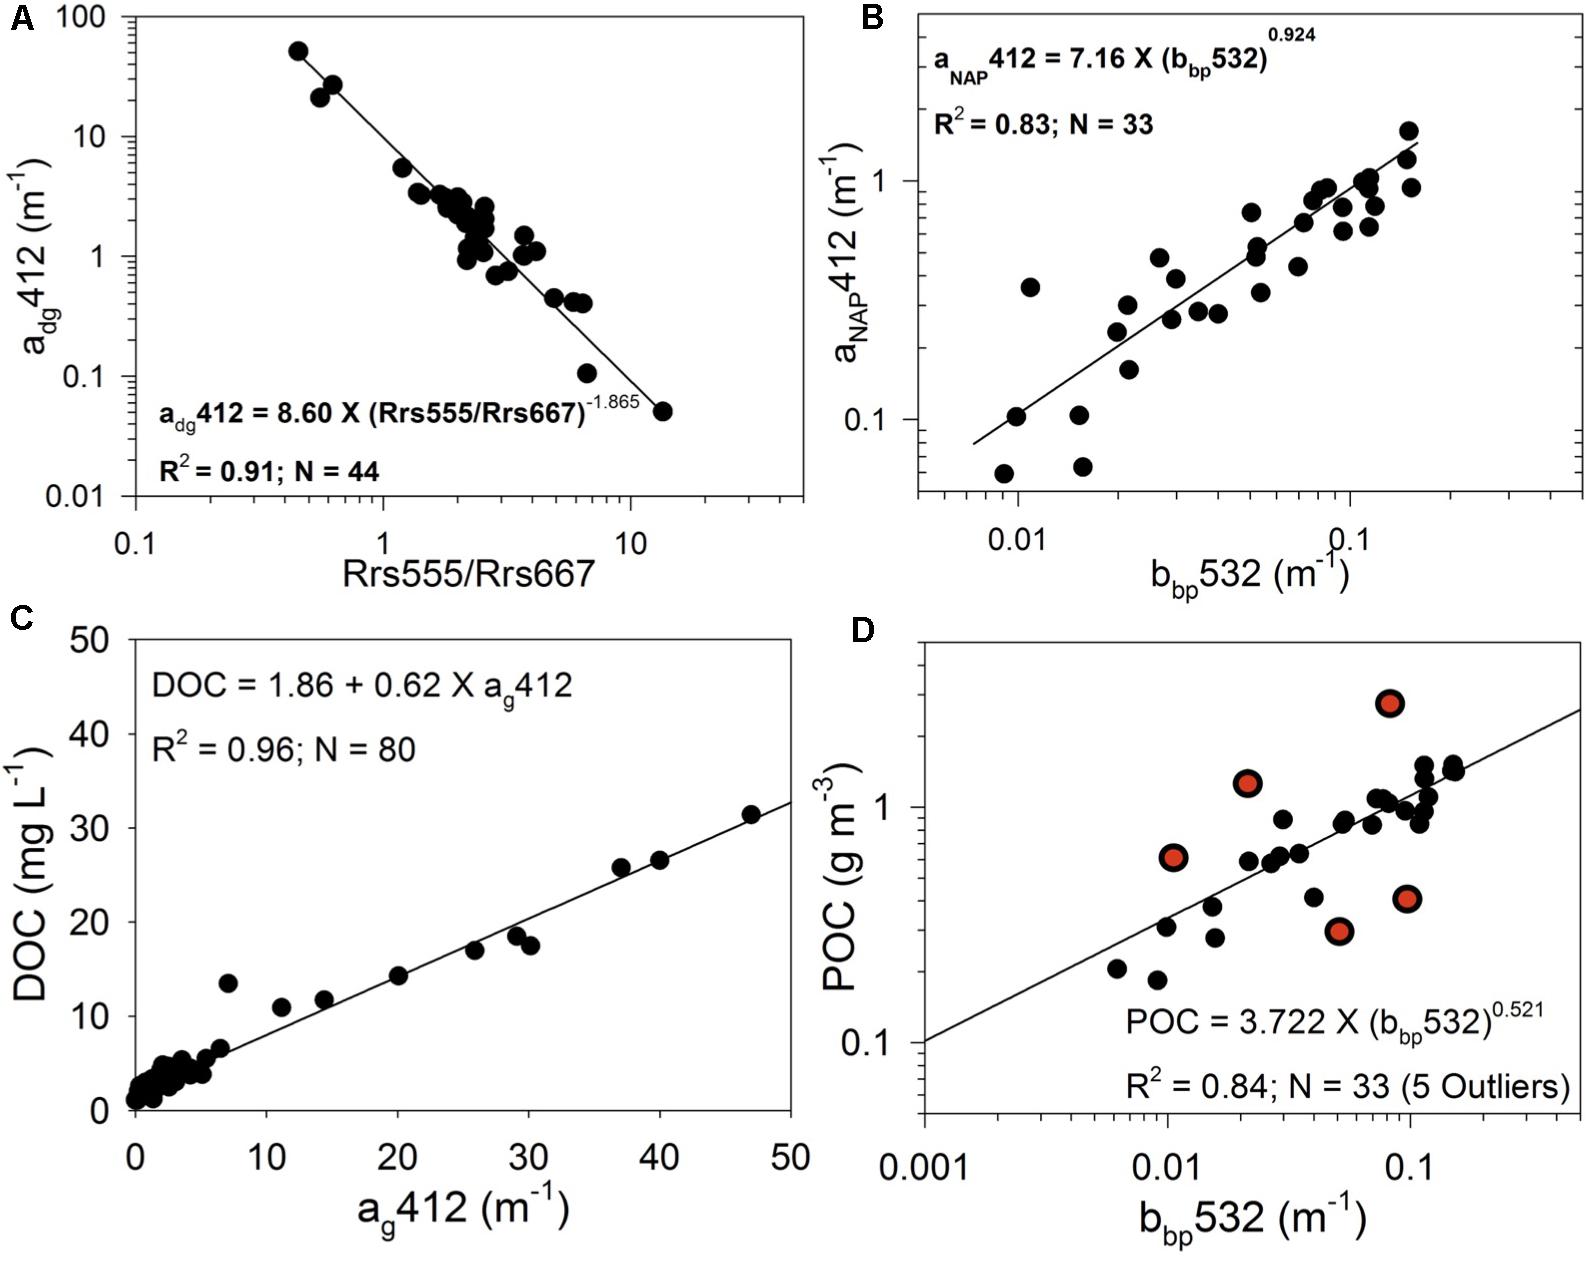
Figure 5. in situ chemo-optical relationships. (A) MODIS-Aqua remote sensing reflectance band ratio (Rrs555/Rrs667) vs. adg412 nm; (B) particle backscattering at 532 nm (bbp532) vs. aNAP412 nm; (C) ag412 vs. DOC; and (D) bbp532 vs. POC.
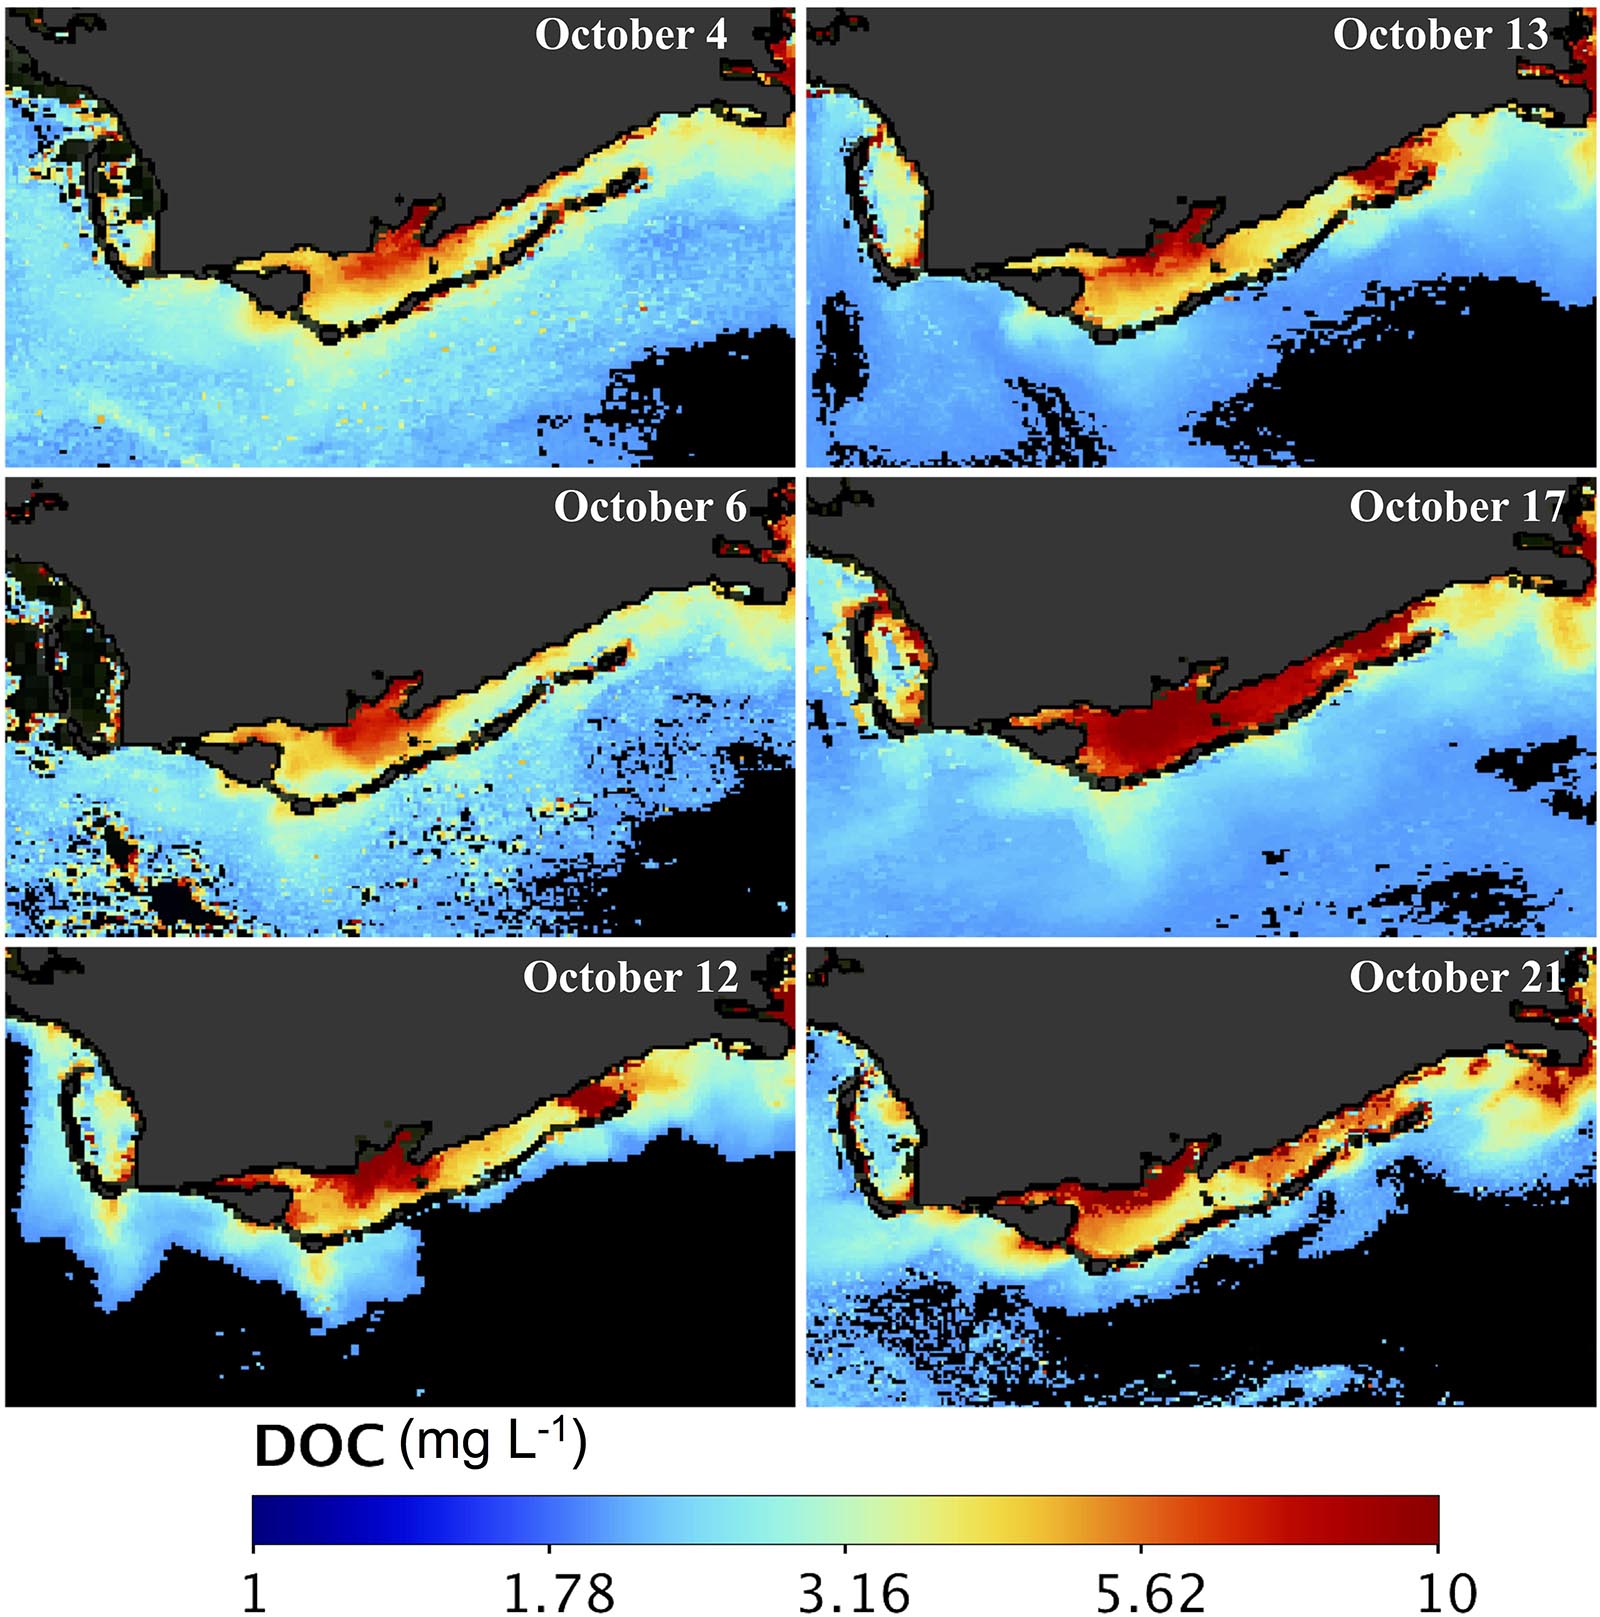
Figure 6. DOC maps of Apalachicola Bay. MODIS-derived DOC maps (mg L–1) for October 4, 6, 12, 13, 17, and 21, 2018.
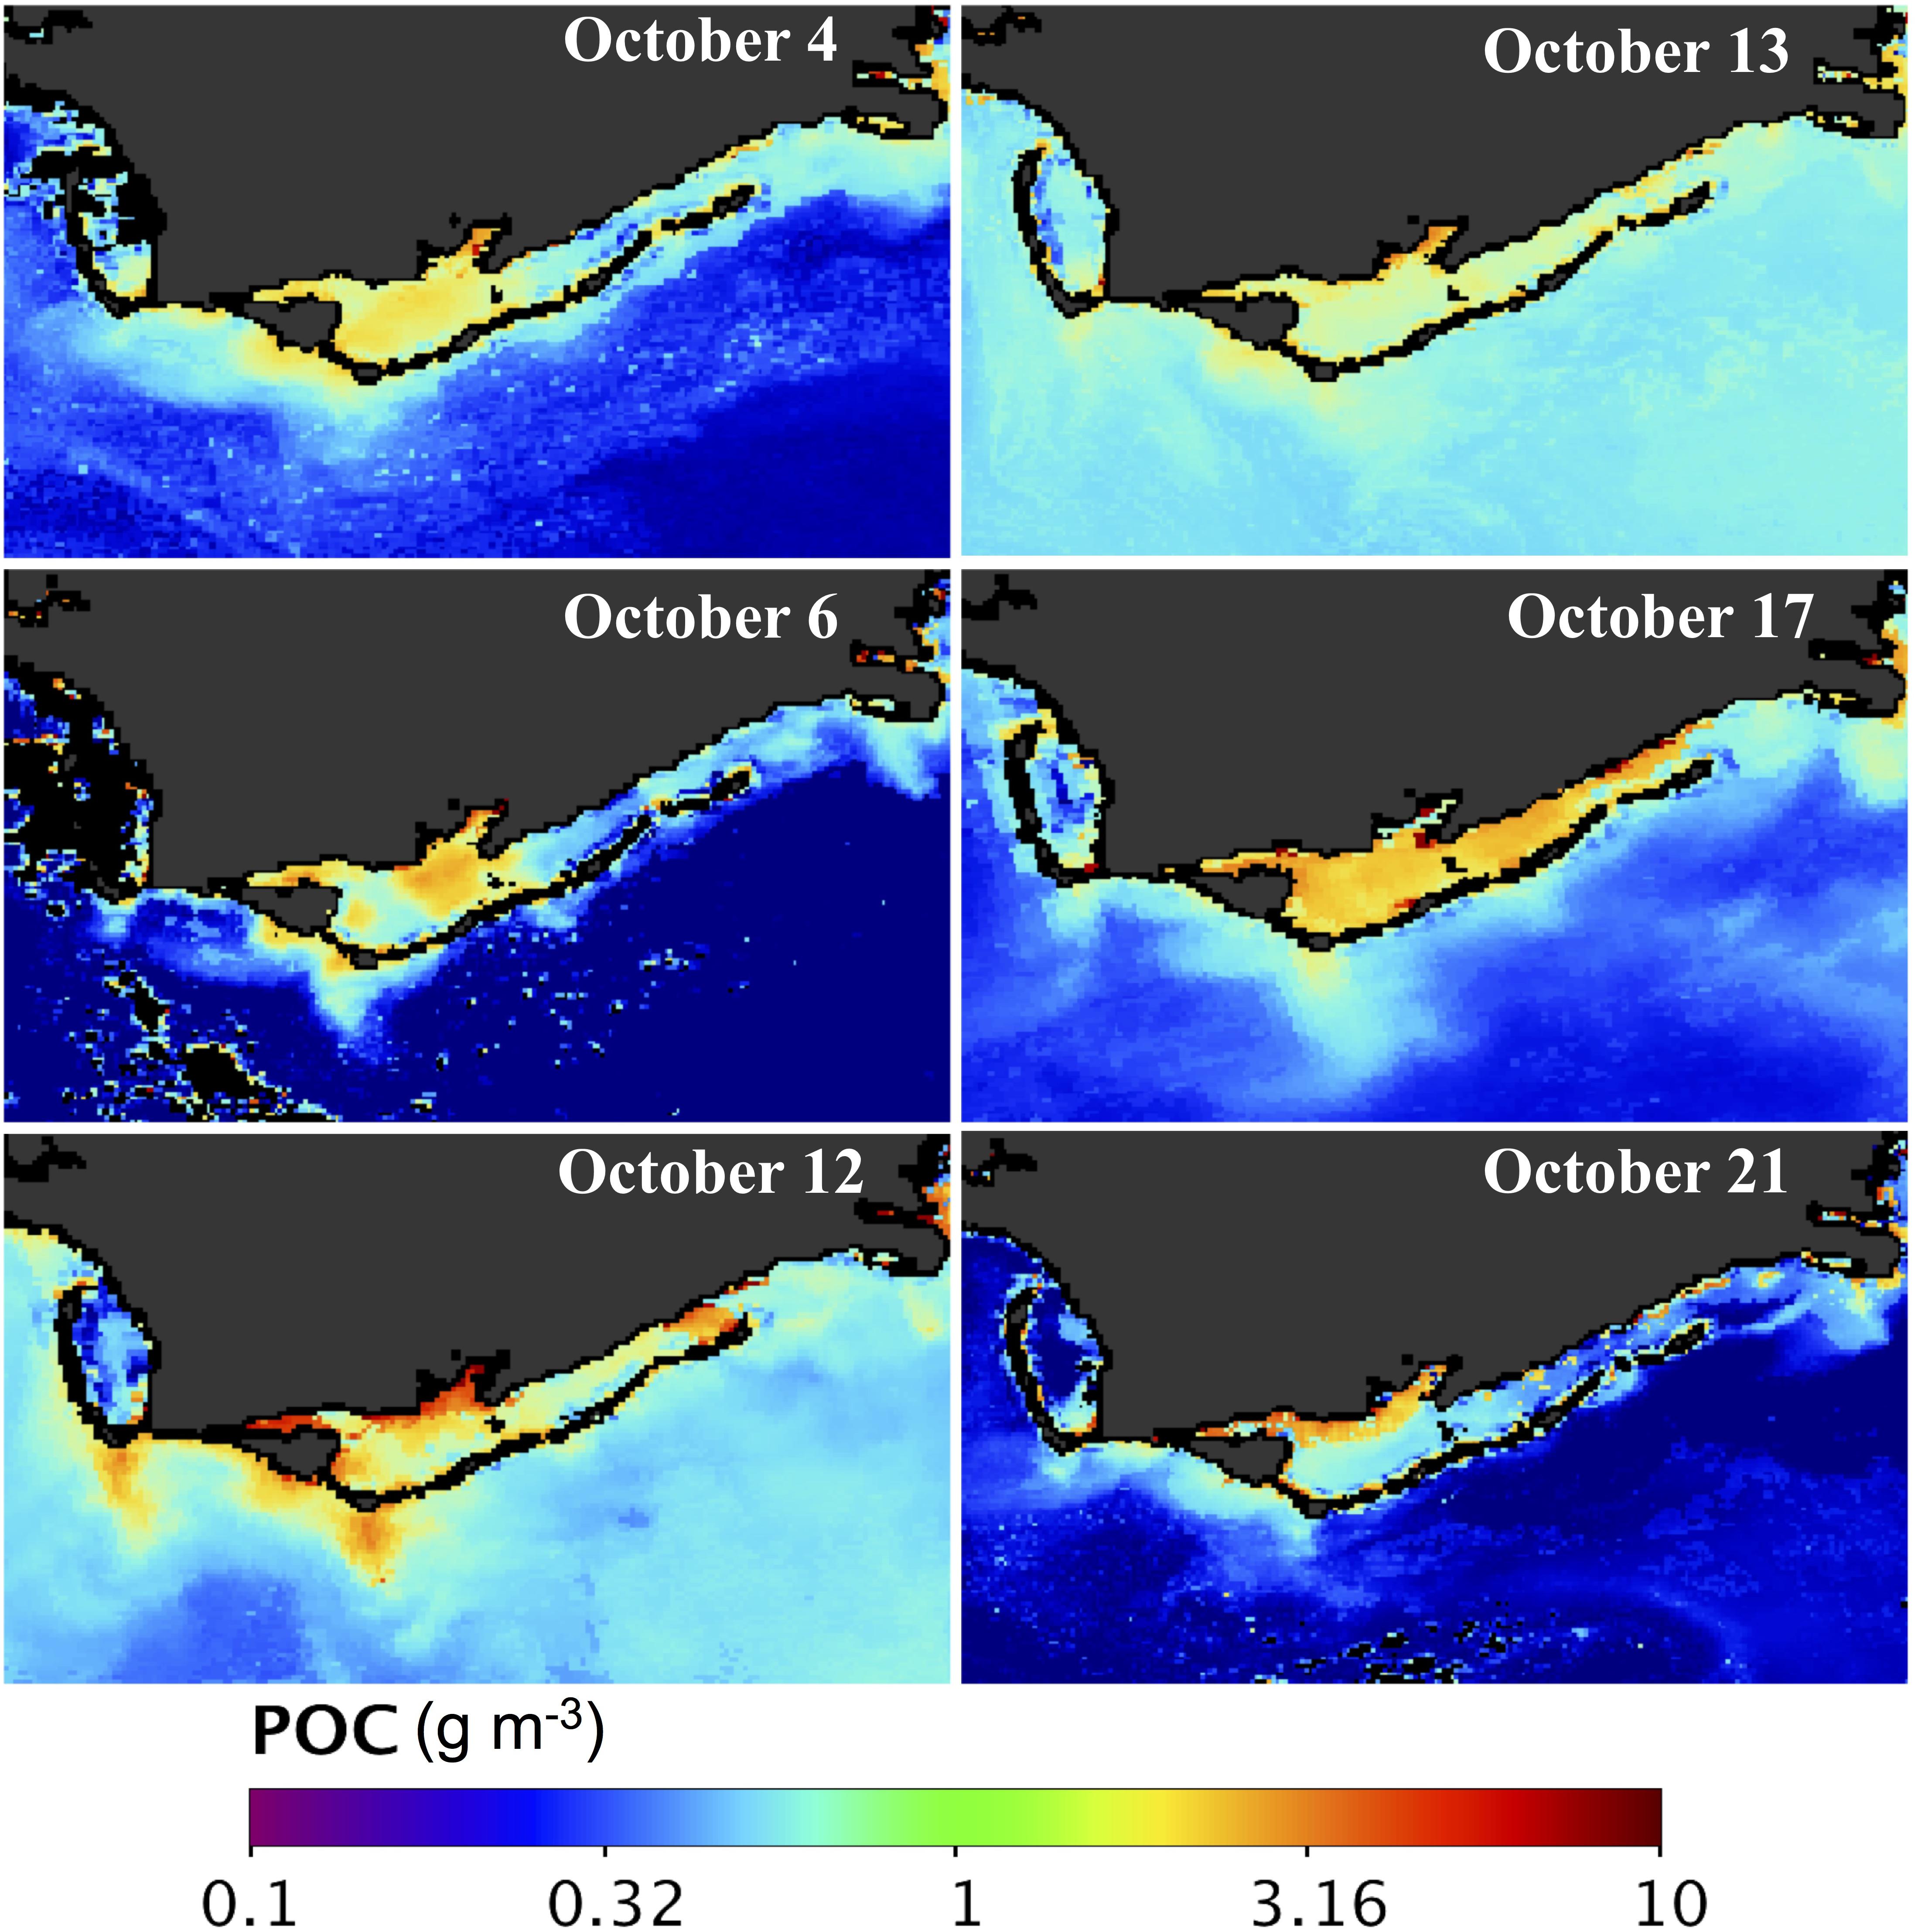
Figure 7. POC maps of Apalachicola Bay. MODIS-derived POC maps (g m–3) for October 4, 6, 12, 13, 17, and 21, 2018.
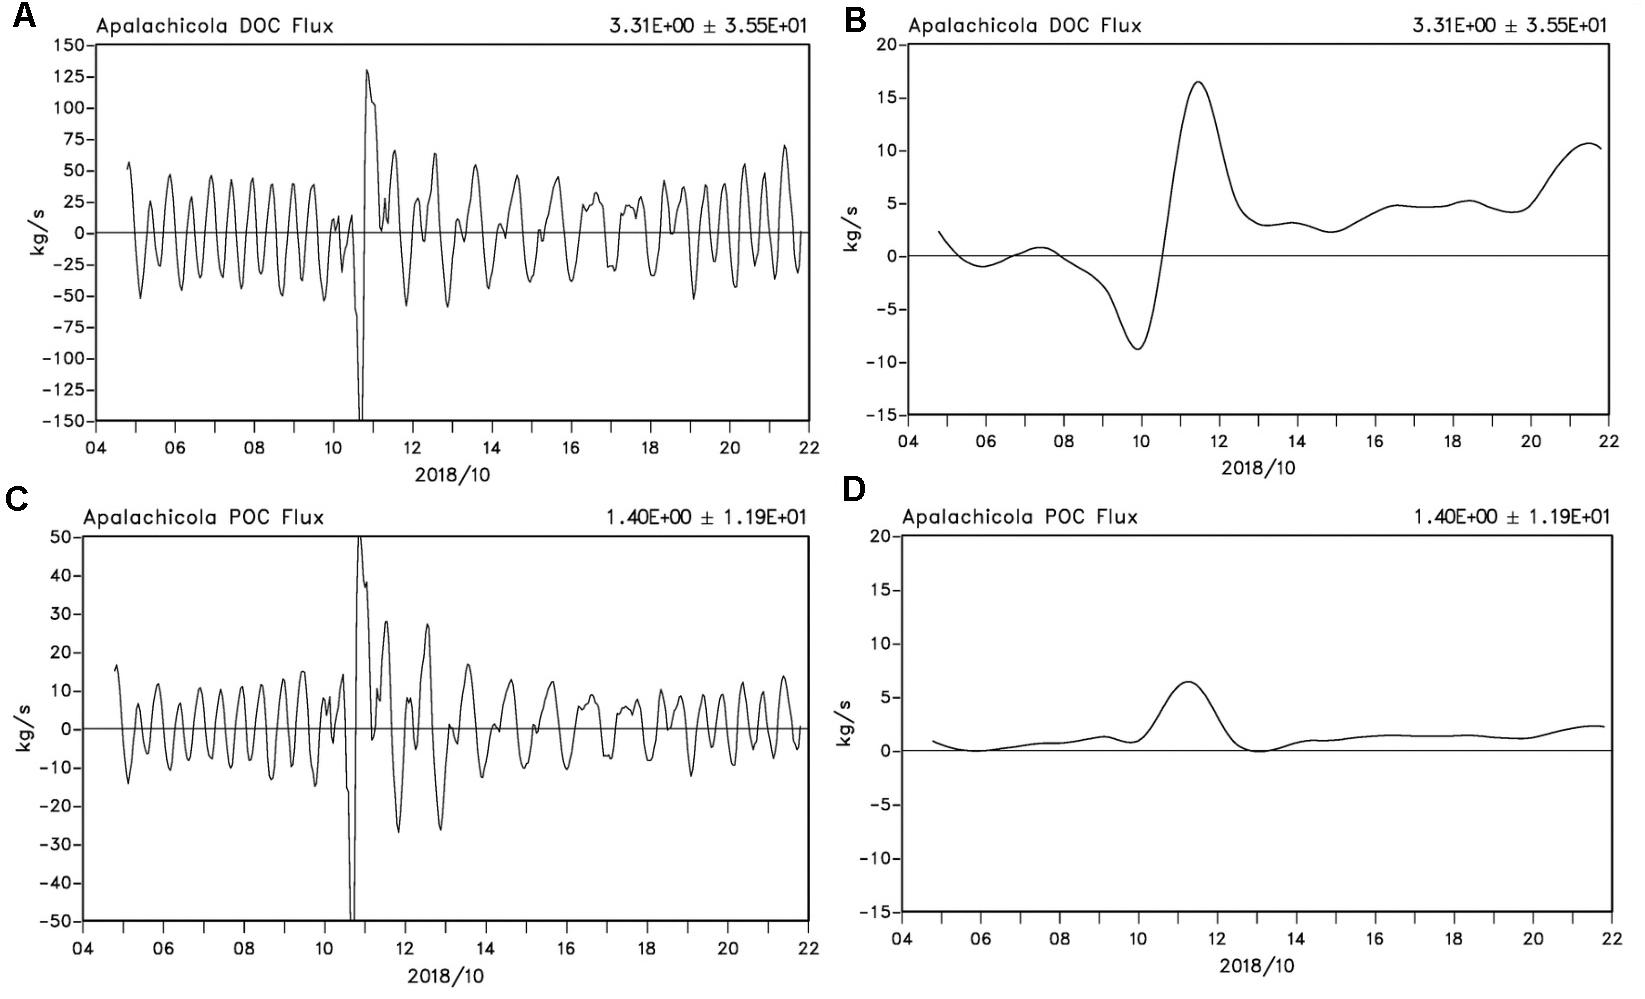
Figure 8. Fluxes of DOC and POC from Apalachicola Bay. Hourly and de-tided fluxes (kg s–1) of DOC (A,B) and POC (C,D) integrated through the all bay passes (positive – out of the bay and negative into the bay) between October 5 and 21, 2018.
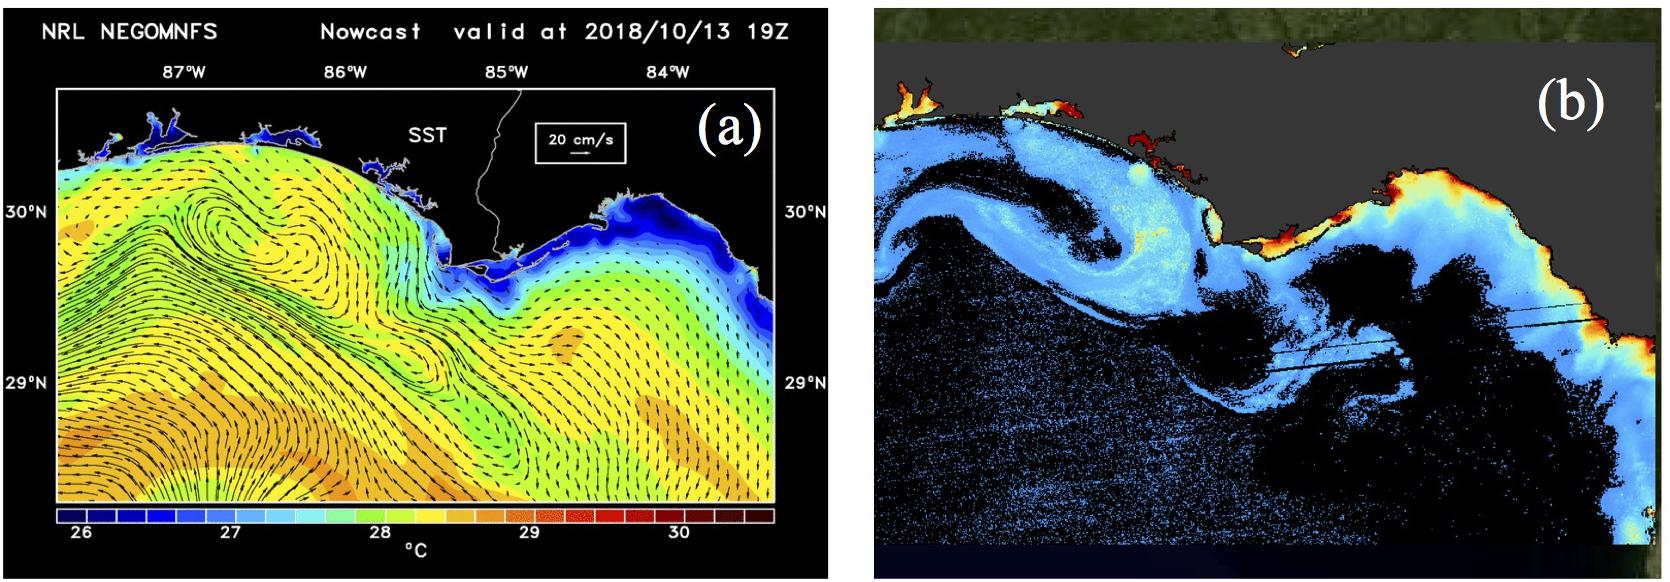
Figure 9. Shelf SST, currents and DOC for 13 October 2018. (a) NCOM model derived sea surface temperature (SST) superimposed with de-tided currents; (b) MODIS-derived DOC map.
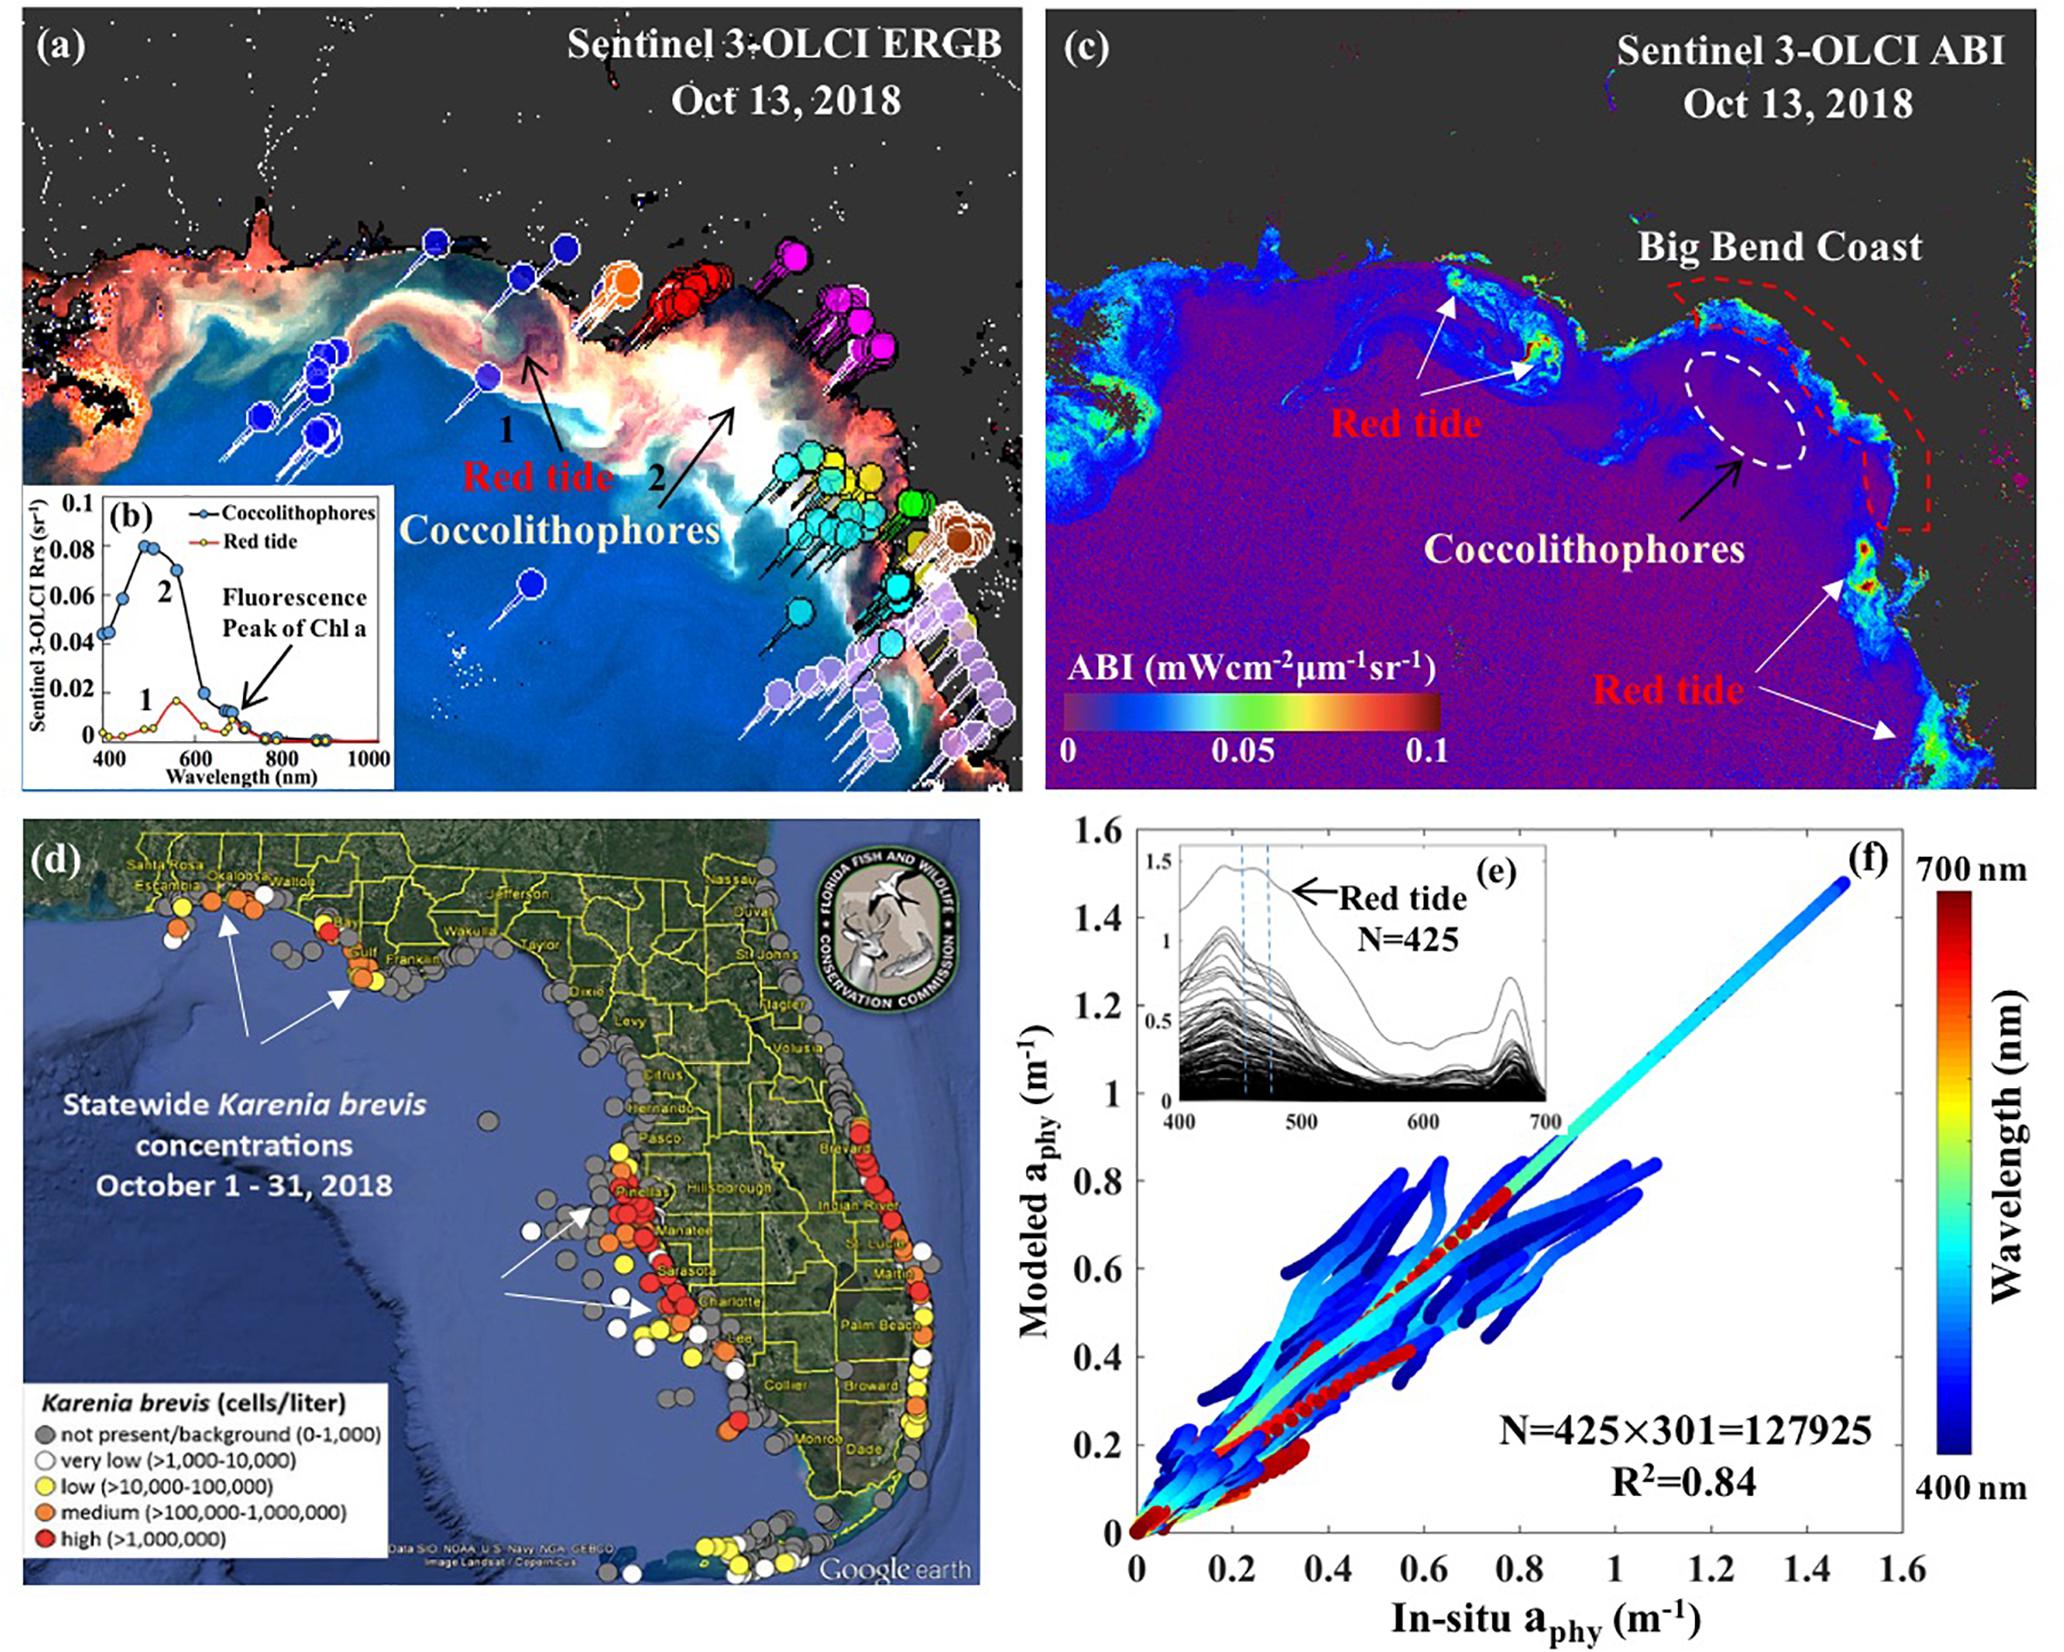
Figure 10. Sentinel-3A OLCI imagery and field absorption spectra. (a) OLCI enhanced RGB imagery (ERGB) of 13 Oct 2018 with arrows indicating dark features associated with high absorption due to red tide and bright features related to coccolithophore bloom. (b-inset) OLCI-derived Rrs spectra corresponding to red tide and coccolithophore bloom locations in the imagery. (c) OLCI algal bloom index (ABI) of 13 Oct 2018 with white arrows indicating waters in bloom status. (d) Statewide map of archived status of red tide Karenia brevis in October, 2018 acquired from Florida Fish and Wildlife Conservation Commission (FWC) with colors circles representing the cell concentrations of K. brevis. (e) 425 aphy(λ) spectra acquired from NASA SeaBASS archive with locations shown as colored pins in (a); blue dotted lines drawn to show spectra in the range 450–470 nm. (f) Comparison between modeled and in-situ measured aphy(λ) for all data across all wavelength with color representing wavelength.
Ocean Color Satellite Data and Processing
MODIS-Aqua ocean color satellite data were downloaded from the NASA Ocean Biology Processing Group (OBPG) website before and after Hurricane Michael for low cloud cover or clear-sky days on 4, 6, 12, 13, 17, and 21 October, 2018. Data were processed to remove atmospheric effects using an adaptive atmospheric correction scheme that optimizes the selection of one of the three standard atmospheric correction methods (NIR, MUMM and SWIR; Joshi et al., 2017 and references there in; Joshi and D’Sa, in review) in optically complex coastal waters to obtain remote sensing reflectance (Rrs_MODIS, sr–1). Rrs_MODIS were then processed using the QAA-V semi-analytic algorithm (Joshi and D’Sa, 2018) to obtain estimates of a and bb; where, a is the additive sum of contributions by pure water (aw), phytoplankton (aphy), detrital or non-algal particles (aNAP) and CDOM ag absorption (a = aw + ag + aNAP + aphy); and total spectral backscattering coefficient (bb) is the sum due to contributions by pure water and particle backscattering (bb = bbw + bbp), respectively. Additional information on spectral shapes of the absorption and scattering coefficients allowed for estimates of the relative contributions by constituents such as phytoplankton and CDOM plus non-algal particles (NAP) (adg = ag + aNAP) to total absorption and scattering coefficients. A combination of empirical relationships using field measurements and Rrs_MODIS band ratios were then used obtain estimates of DOC and POC in ApB (Figure 4; chemo-optical analysis).
Sentinel-3 OLCI full resolution mode (300 m) cloud-free images for October 13 and 17, 2018 over neGoM were obtained from the European Organization for Meteorological Satellites (EUMETSAT) and pre-processed using the Sentinel-3 Toolbox Kit Module (S3TBX) version 5.0.1 in Sentinel Application Platform (SNAP). The OLCI data were then atmospherically corrected using the Case-2 Regional Coast Color (C2RCC) module to obtain remote sensing reflectance (Rrs_OLCI, sr–1). The Sentinel-3 OLCI data were then used to estimate Chl a (Figure 11) and phytoplankton pigment compositions (Figure 12) using the OLCI Case2R neural net standard algorithm and the NNLS inversion algorithm.
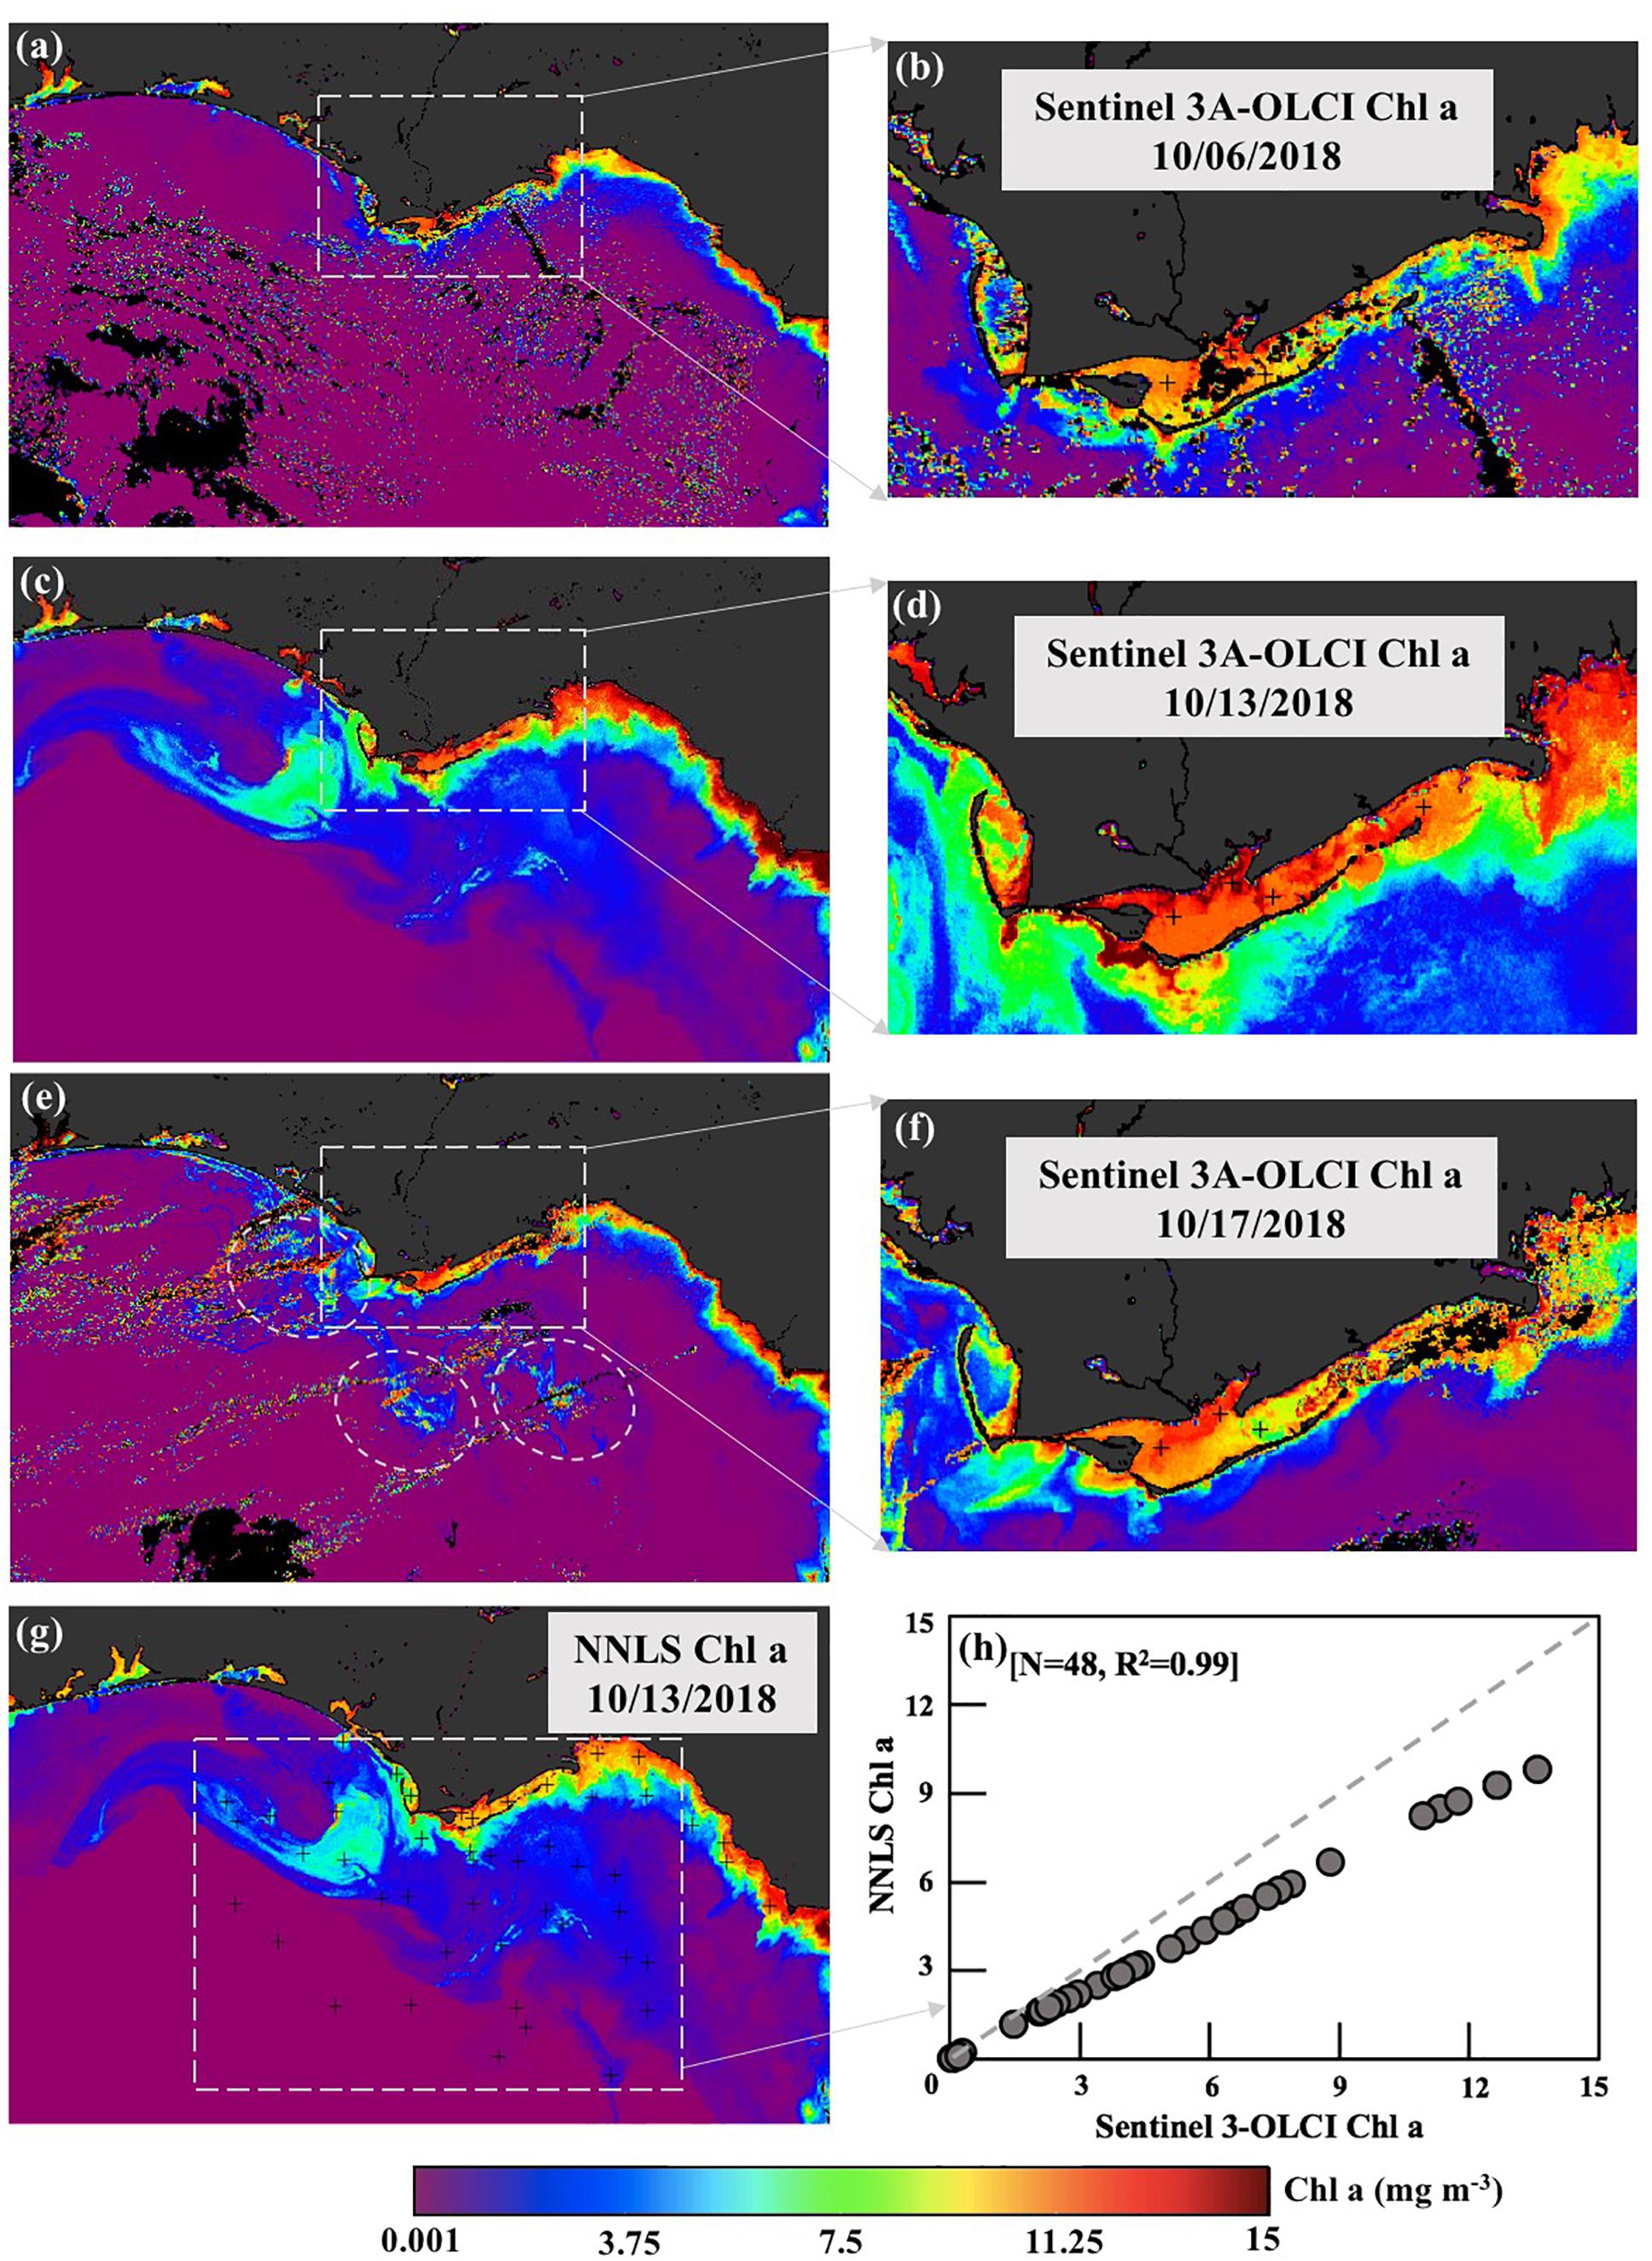
Figure 11. Sentinel-3A OLCI-derived Chl a maps. (a,c,e) Chl a standard product of shelf waters for 06, 13, and 17 October 2018 with corresponding maps (b,d,f) of ApB and nearshore coastal waters. (g) Total Chl derived from the NNLS inversion algorithm for October 13, 2018; (h) comparison of OLCI-derived Chl a standard product vs. NNLS-derived Chl a for October 13, 2018.
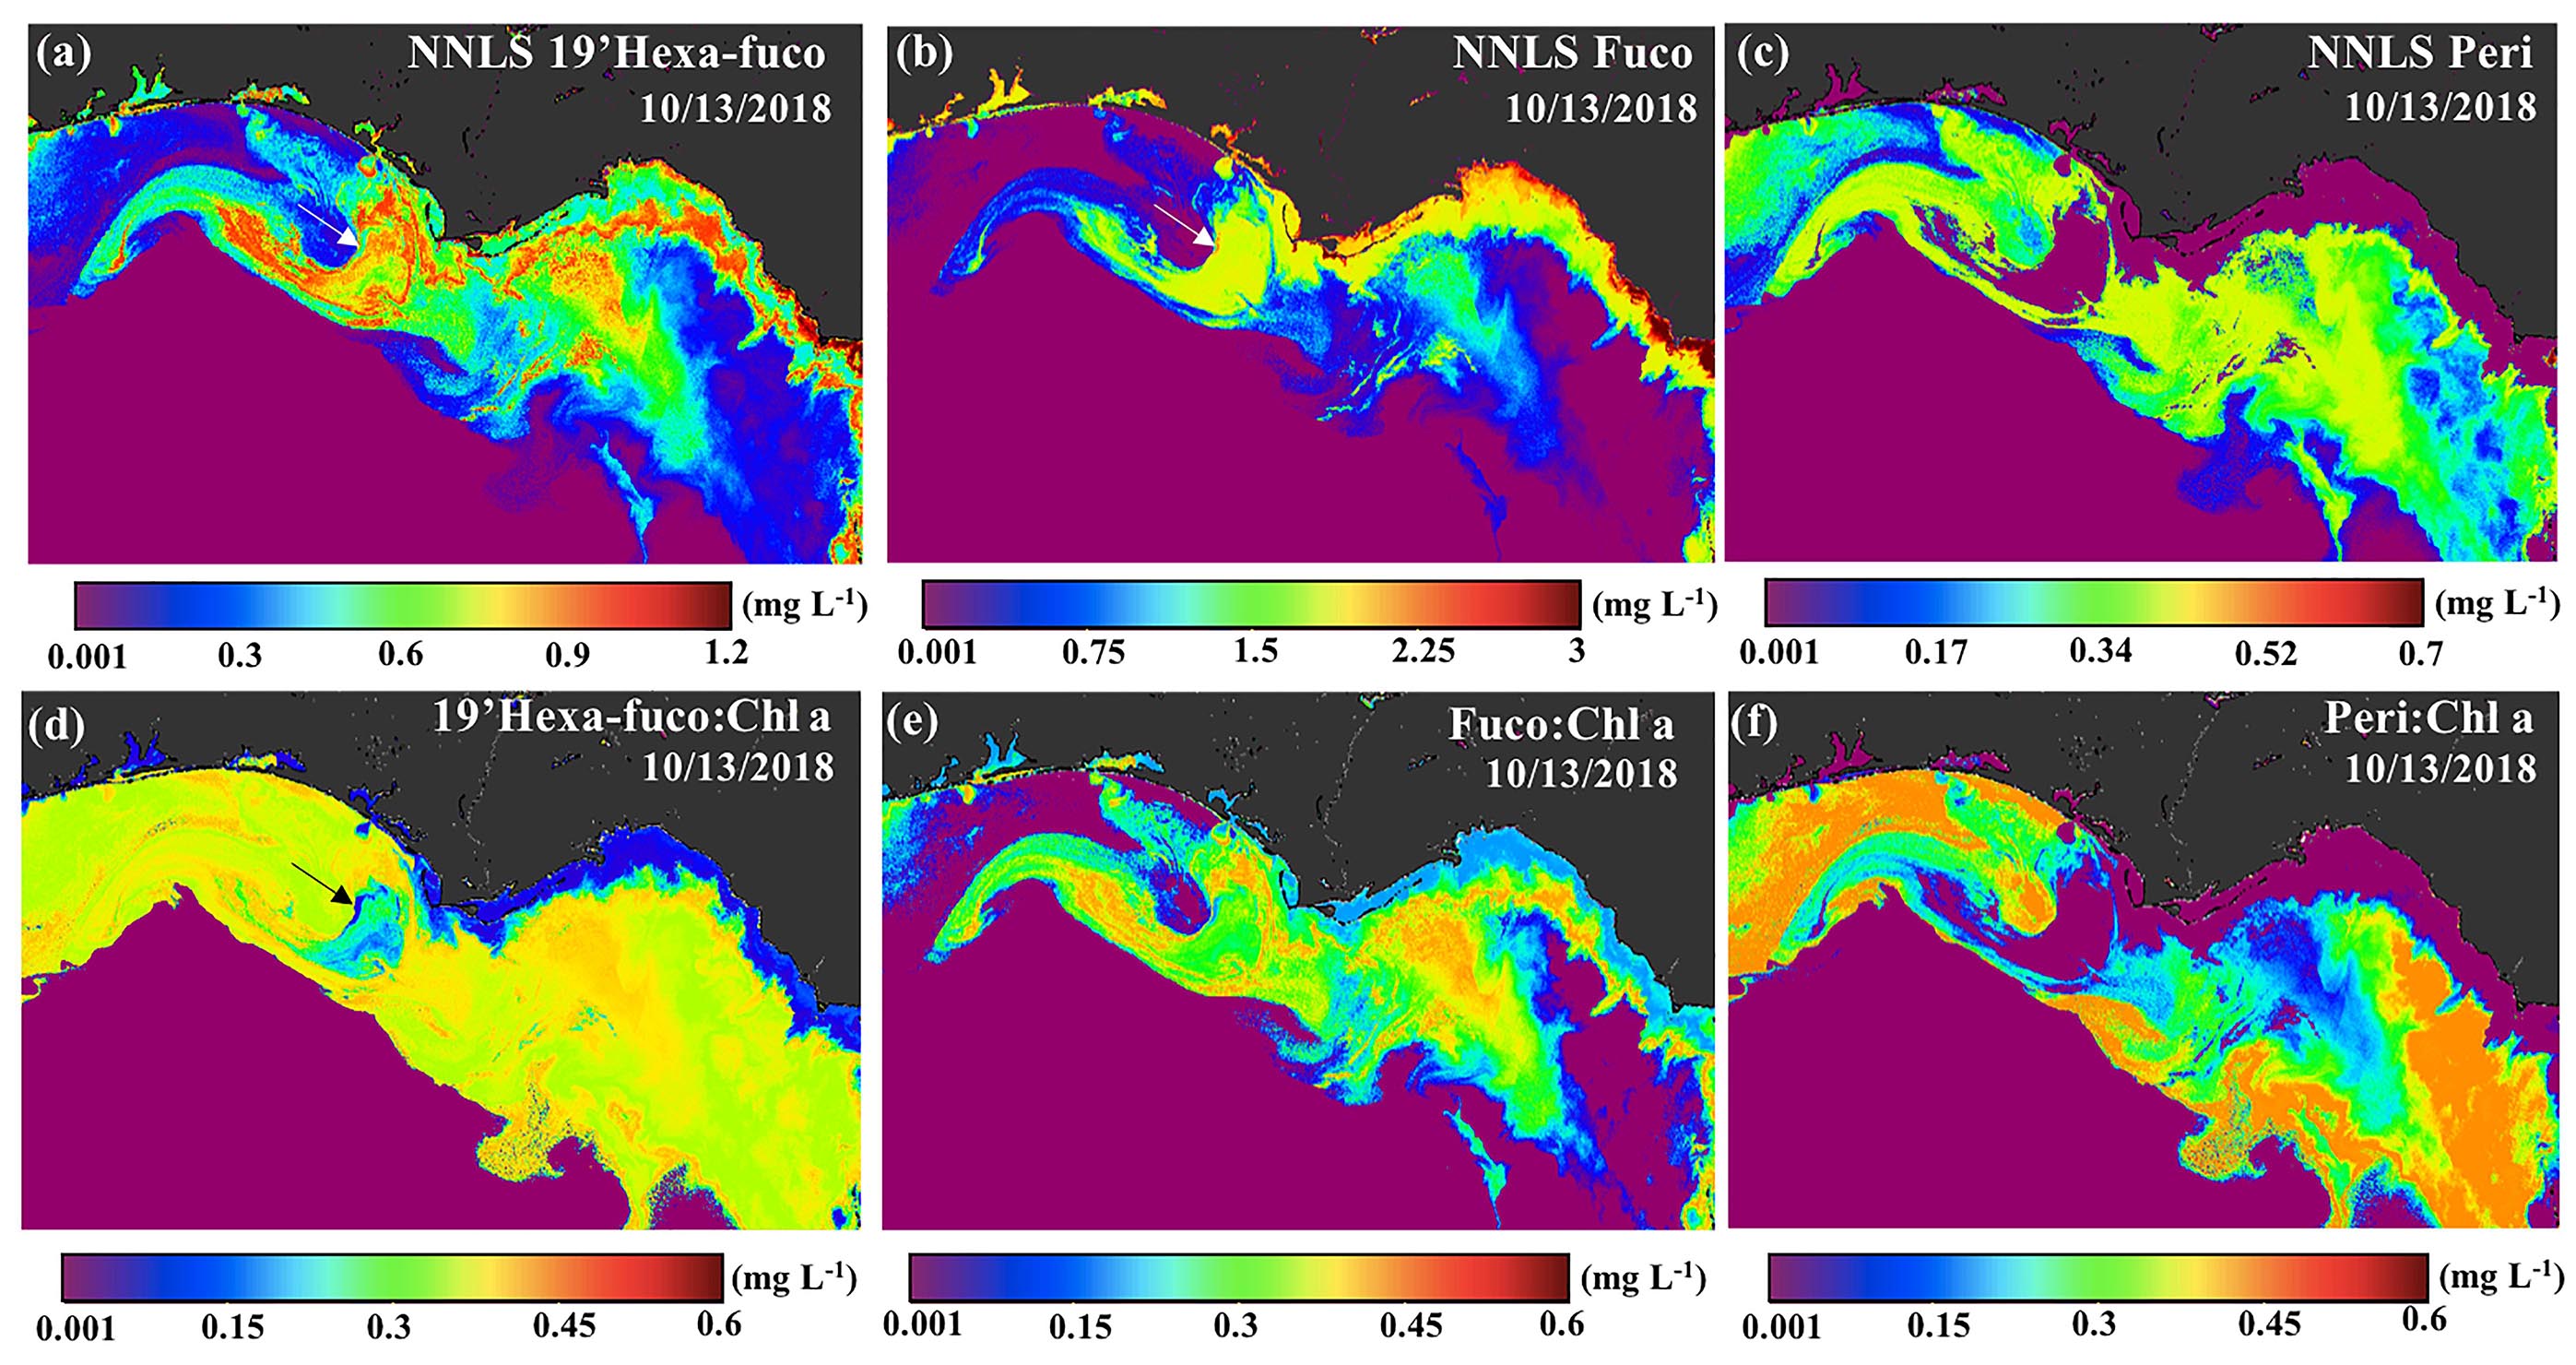
Figure 12. Sentinel-3A OLCI-derived maps of diagnostic pigments and ratios for October 13, 2018. Pigment maps of (a) 19′hexa-fuco, (b) fuco, (c) peri, (d) 19′hexa-fuco:Chl a, (e) fuco:Chl a, (f) peri:Chl a.
Phytoplankton Pigment Composition From Sentinel-3A OLCI
Phytoplankton pigment compositions were estimated using the NNLS inversion algorithm (Liu et al., 2019a) with a focus on the neGoM shelf waters (Figure 4; bio-optical analysis). Our goal was to obtain spatiotemporal distributions of some pigment ratios specific to algal-bloom species using a previously developed technique to study a hurricane-induced phytoplankton bloom event which appeared to be comprised of mixed algal blooms dominated by different species as indicated by the contrasting colors observed in post-hurricane enhanced high spatial resolution true color Sentinel-3A OLCI imagery (ERGB; band 6 – 560 nm, band 4 – 490 nm and band 3 – 442.5 nm) of the shelf waters (Figure 10a). Thus, Sentinel-3A OLCI pigment maps for October 13, 2018 were generated using the bio-optical analysis processing pathway (Figure 4) in a series of steps. Firstly, a total of 425 in-situ measurements including phytoplankton absorption spectra aphy(λ) and Chl a concentrations acquired from SeaBASS during 2006–2012 (Figure 10a; location shown by pins) were interpolated at 1 nm interval from 400 to 700 nm (Figure 10e), and modeled as a third order function of in-situ Chl a concentrations (Liu et al., 2019a) to obtain the wavelength-dependent coefficients. We then further applied these coefficients to Sentinel-3A OLCI Chl a to generate satellite-derived phytoplankton absorption spectrum (aphy_OLCI) at each pixel (1851 × 1038). Since ∼80% variations in the shape and magnitude of in vivo aphy(λ) by phytoplankton cells are attributed to the pigment composition (Ciotti et al., 2002), their concentrations were estimated by reconstructing aphy_OLCI spectra using mass-specific absorption spectra of different pigments based on non-negative least square (NNLS) inversion algorithm (Liu et al., 2019a). In addition, pigment packaging effect is another import factor influencing the absorption spectra of phytoplankton; thus, aphy(λ) was normalized at 675 to minimize pigment packaging effects (Moisan et al., 2017) before spectrum reconstruction. A total of 22 mass-specific pigment spectra obtained from different published sources were included in this study. In vivo mass-specific absorption spectra of 14 pigments including Chl a, Chl b, divinyl (DV)-Chl a, DV-Chl b, Chl c, peridinin (peri), fucoxanthin (fuco), 19′hexanoyloxyfucoxanthin (19′hexa-fuco), 19′butanoyloxyfucoxanthin (19′buta-fuco), alloxanthin, diadinoxanthin (diadino), zeaxanthin, and α-carotenoid and β-carotenoid (β-caro) were obtained from Bricaud et al. (2004). Furthermore, total Chl a consists of active intact Chl a plus breakdown products called “pheopigments,” mostly pheophytin, which modify aphy(λ) between 400 and 435 nm – due to a shift in the maximal absorption of pheophytin-a toward shorter wavelengths (Kiefer and SooHoo, 1982). Generally, healthy phytoplankton have mostly active Chl a, but a fraction of pheopigments increases with increasing senescence of algal cells (Mitchell and Kiefer, 1988; Bianchi and Canuel, 2011). Thus, spectra of pheophytins-a and -b were also included in the NNLS inversion algorithm (Thrane et al., 2015) due to the algal blooms detected in the enhanced RGB image (Figure 10a). Further, the in vitro (ethanol extracted) absorption spectra of 5 other chloroplast carotenoids including violaxanthin, lutein, neoxanthin, diatoxanthin, and dinoxanthin were obtained from Thrane et al. (2015). However, since the absorption peaks of these in vitro spectra have a slight shift (Bidigare et al., 1990) in comparison to those measured using the filter pad technique (Roesler et al., 2018), the absorption spectra from pure pigments in vitro are not the best illustration of the pigment absorption spectra contained in phytoplankton cellular complexes in vivo (Lutz et al., 2001). Therefore, the absorption maxima of these 5 in vitro absorption spectra were shifted to longer wavelength by +10 nm to in vivo positions (Bidigare et al., 1990; Kirk, 1994). The mass-specific absorption spectra of phycoerythrin and phycocyanin (Cook et al., 2017), were also included in the NNLS inversion algorithm to generate phytoplankton pigments maps (Figure 12).
Results
Hydrodynamic Conditions in ApB
Apalachicola River discharge was slightly elevated in late summer and fall in comparison to typical flows before the Hurricane Michael made landfall on October 10, 2018 (Figure 2A). The hurricane storm surge (Figure 3a) appeared to have temporarily backed-up the flow from the AR up to about 30 km upstream – as indicated by the sharp drop recorded at the gage station at Sumatra, Florida. Precipitation associated with Hurricane Michael as it made landfall rapidly spread inland into Florida and Georgia, which resulted in increased discharge from the AR. After peaking around October 19, discharge gradually decreased but was still elevated by the end of October. Fall 2018 was an active season along the US southeast coast, with tropical storm Gordon (September 5), Hurricane Florence (September 14), in addition to Hurricane Michael impacting the region (NOAA National Ocean Service); so other precipitation events likely contributed to the more elevated levels in AR discharge later in October.
Prior to the hurricane, winds were light and from the east (Figure 2B). As the hurricane approached and made landfall, winds increased in intensity, with stronger northerly winds associated with a low pressure reading of ∼990 mbar - recorded at the ApB station. For the rest of the month, winds were variable with periods of strong wind patterns associated with frontal passages. Salinity at Cat Point before and during the hurricane passage remained stable (∼30), but decreased to low values of ∼20 before the sensor stopped recording on October 13. However, the salinity sensor at the river mouth (LM) station, which indicated the presence of freshwater (∼0) before the hurricane, started showing pulses of higher salinity as early as October 6, with salinity increasing as the hurricane approached the Florida coast. The highest salinity (∼30) was recorded on October 10 as Hurricane Michael made landfall and was associated with a strong storm surge recorded at the tide station in ApB (Figure 3a). Salinity decreased gradually as the storm surge water flowed out of bay and returned to pre-hurricane levels by October 14 (Figure 2C). Turbidity in both the bay (Cat Point) and river mouth (LM) showed similar levels before the hurricane (Figure 2D). However, with approaching hurricane, turbidity levels started increasing in ApB likely due to increasing wave and wind mixing. Turbidity at both locations recorded highest levels (∼900 NTU) on October 10 during landfall under extreme high wind conditions; levels decreased rapidly by October 11 at both locations. Thereafter, with only the LM sensor operational, turbidity at the river mouth showed pulses of highly turbid waters associated with increasing river discharge which peaked by October 19. Turbidity decreased to almost background levels at the river mouth by October 21. Large turbidity pulses late into October were likely associated with a frontal passage with strong winds (Figures 2B,D).
A comparison between model and tide-gage sea level at NOAA NOS Apalachicola station (id 2359170) for the month of October 2018 showed the model to simulate realistic sea levels (Figure 3a) with diurnal patterns of sea level variations and westerly surface currents before the hurricane (Figure 3c). Both model simulation and tide gage showed increasing sea levels by October 6 and storm surge at landfall. The model, however, underestimated the peak storm surge (∼2.5 m) measured by the tide gauge likely due to coarser and therefore weaker hurricane winds predicted by COAMPS -used to drive the model. The coastal response to the hurricane was the generation of a storm surge, which appeared to peak on October 10, close to landfall and just west of ApB (Figures 3a,b). The storm surge was greatest to the right (east) of the hurricane track including ApB region with strong wind-driven coastally directed currents; both winds and currents showed decreasing trends eastward along the Florida coast into the Big Bend area. Coastal water levels, however, decreased to low or negative levels to the left (west) of the storm track with southward-directed currents appearing to deliver low salinity waters from the various bays (e.g., St Andrews Bay, Choctawhatchee Bay) - likely delivering large amounts of freshwater, nutrients, and organic matter to the coast. Coastal currents, which were predominantly westward and mild before the hurricane (Figure 3c), were highly variable in both intensity and direction just before, during, and following the hurricane (Figures 3b–d). Three days following the hurricane’s landfall, currents were directed mostly southeastward in the coastal waters around ApB, likely due to relaxation of storm surge and prevailing easterly winds (Figure 2B) that pushed water out of ApB. Model simulation of salinity within the bay showed a strong influence of freshwater discharge from the AR and Carrabelle Rivers before the hurricane (October 4; Figure 3c). Salinity increased substantially during the hurricane due to a storm surge that brought high salinity water into ApB. After the hurricane on October 13 low salinity waters extended well beyond the bay’s barrier islands and into more open Gulf waters (Figure 3d).
Satellite Estimates of DOC and POC From MODIS
The MODIS-derived atmospherically corrected Rrs_MODIS data were used to derive DOC and POC maps of ApB for October 4, 6, 12, 13, 17, and 21, 2018, using the approach described in Figure 4 (chemo-optical analysis). Green and red MODIS bands (Rrs555 and Rrs667) were used as inputs to the QAA-V estuarine-tuned semi-analytic algorithm (Joshi and D’Sa, 2018) to derive satellite estimates of backscattering bbp532. A power-law relationship between bbp532 and POC (Figure 5D):
was derived from field observations. The relationship was then applied to MODIS-derived bbp532 to obtain POC maps of ApB (Figure 7).
Power law relationships between Rrs555/Rrs667 and adg412 (Figure 5A) given by:
and between bbp532 and aNAP412 (Figure 5B) given by:
obtained from in situ measurements in ApB, allowed the determination of ag412 from the relationship:
These relationships were applied to MODIS-derived ratios (Rrs555/Rrs667) and bbp532 to derive satellite maps of ag412. DOC was significantly correlated with CDOM (Figure 5C) as:
Equation 5 was then applied to MODIS-derived ag412 to generate DOC maps of ApB (Figure 6).
With particle backscattering strongly correlated to concentration of suspended particle matter (SPM) in various estuarine and coastal waters (Joshi and D’Sa, 2018), the power law relationships observed in ApB between bbp532 and POC and aNAP412 (Equations. 1, 3) could be attributed to factors such as, mineralization, residence of particles in the estuarine zone as well as the organic matter content of the suspended particle matter being discharged by the river (Bianchi et al., 1997; Abril et al., 2002; Warnken and Santschi, 2004). In contrast, a linear regression between ag412 and DOC reflects the generally conservative mixing observed between the riverine and marine end members for both CDOM and DOC in ApB and other estuaries (Joshi et al., 2017; D’Sa et al., 2018). However, a limitation of these empirical relationships used to derive DOC and POC from ocean color following Hurricane Michael is that the field data used were acquired under non-hurricane conditions. In spite of potential for greater uncertainties in the relationships (e.g., due to wind induced resuspension), it appears reasonable to apply these relationships to hurricane impacted conditions in ApB since these relationships also included riverine-end members where the observed DOC and POC were several orders higher than other stations in the bay during normal conditions (Joshi et al., 2017) (Figures 5C,D).
DOC and POC Distributions and Fluxes From ApB
Maps of DOC and POC, derived from MODIS using a combination of semi-analytic and empirical algorithms (Figures 4, 5), indicated strong geochemical responses to Hurricane Michael (Figures 6, 7). Surface distribution of both DOC and POC prior to the hurricane (October 4, 6; Figures 6, 7) indicated elevated levels in eastern ApB mainly due to the AR discharge with higher levels near the river mouth and decreasing seaward with elevated levels outside West Pass. The central and eastern bays showed low levels of DOC and POC concentrations. Two and three days following the hurricane passage (October 12, 13), elevated levels of DOC were observed throughout ApB with southward oriented plumes of DOC extending outside ApB. POC distribution patterns were similar to DOC, with some spatial differences and comparatively lower concentrations. A substantial increase in both DOC and POC concentrations was observed throughout ApB on October 17. By October 21, DOC concentrations were still high throughout the bay, while POC concentrations were elevated only close to the AR (Figures 6, 7).
DOC and POC fluxes which were calculated from water volume fluxes through all the passes and satellite-derived DOC and POC concentrations between October 4 to 21 (with daily values interpolated from the satellite data) show large variations dominated by tidal cycles (Figures 8A,C) with DOC fluxes almost a factor of three greater than the POC fluxes. However, a large pulse (positive denotes out of and negative into the bay) was observed on October 10 as hurricane Michael made landfall just west of ApB. The de-tided DOC flux was low before the hurricane’s passage with a strong pulse of DOC into ApB just before making landfall and quickly reversing, resulting in a peak seaward flux of ∼16 kg s–1 out of the bay as the hurricane moved inland by October 11. Seaward DOC fluxes decreased to ∼5 kg s–1 by October 13 and thereafter showed a generally increasing trend, with a second strong pulse on October 21 associated with a cold front (Figure 8B). POC fluxes in contrast were relatively lower than DOC and exhibited a positive flux out of the bay with a peak flux coinciding with that of DOC fluxes on October 11. Thereafter, with a minimum on October 13, POC fluxes showed a generally increasing trend with a small jump on October 21, similar to the DOC flux. The storm surge related landward DOC flux pulse into ApB (Figure 8C) in contrast to that of POC (no landward flux; Figure 8D) was likely due to the reversal of pre-hurricane coastal DOC plumes into ApB, further illustrating the DOM-rich nature of ApB in comparison to POC. Michael’s winds and waves induced strong mixing, which also increased the concentration of DOC and POC inside ApB. Together with the large runoff from the AR and surrounding wetlands, both DOC and POC fluxes increased after hurricane (Figures 8B,D).
Bio-Physical Response of Shelf Waters to Hurricane Michael
Northward and southward currents to the right and left of the hurricane track at landfall (Figure 3b; NCOM model outputs) transitioned over a period of 3 days to a more complex current pattern that indicated easterly/southeasterly transport of cooler coastal waters. A component of this southeasterly flow veered to the west, likely influenced by a Loop Current eddy at the shelf edge (Figure 9a) as reflected in cyclonic currents – along with the presence of warmer and higher salinity waters (not shown) aligned along the shelf edge. The transport of the coastal waters into the mid-shelf region of the neGoM was clearly apparent in the extended DOC map on October 13, 2018 (Figure 9b). The region in the image east of ApB was due to very high reflectance that appeared to be associated with a coccolithophore bloom (Joshi and D’Sa, in review) with pixels set to black along with oligotrophic waters with low DOC (as the algorithm was optimized for ApB). In addition, the POC levels in the outer shelf were consistently higher on October 12 and 13 compared with October 4, 6, 17 and 21 (Figure 7); this increase in POC values were due to higher bbp532 estimated from the QAA-V that also appeared linked to an extensive algae bloom, possibly Coccolithophore.
Factors that could contribute to the distinct colors observed in the OLCI ERGB imagery in shelf waters, especially southwest and east of ApB after passage of the storm (Figure 10a) include sediment resuspension, CDOM-rich or bloom waters. Thus, an algal bloom index (ABI, mWcm–2μm–1sr–1) which has been used by Florida Fish and Wildlife Conservation Commission (FWC) for routine monitoring of red tide along the Florida Coast is adapted in this study for the Sentinel-3A OLCI atmospheric-corrected normalized water leaving radiance (Lwn at band 8–665 nm, band 10–681 nm and band 12–754 nm); the ABI which is based on the MODIS normalized fluorescence line height (nFLH) product, was further modified to reduce the contaminations from CDOM-rich waters and suspended sediments according to Hu and Feng (2016) as:
The Sentinel-3 OLCI-derived ABI imagery indicated that most areas along the Florida Coast with high ABI ∼0.08–0.09 (white arrows; Figure 10c) coincided with medium (∼10,0000–100,0000 cells L–1) to high (>100,0000 cells L–1) concentrations of Karenia brevis reported in the statewide red tide status map from FWC for the month of October 2018 (white arrows; Figure 10d). For example, dark-reddish color in ERGB image (arrow 1; Figure 10a) with Chl a concentrations reaching ∼10.5 mg L–1 (Figure 11a) in the areas southwest of ApB was likely due to the presence of a red tide bloom (K. brevis); these type of waters have been associated with strong light absorption by K. brevis cells (Hu and Feng, 2016). Corresponding reflectance spectral profiles in the red tide area (arrow 1; Figure 10a) showed overall low reflectance but a strong fluorescence signal (red line; Figure 10b). However, along the Big Bend Coast of Florida stretching from Apalachee Bay (Wakulla County) to Anclote Key (Pasco County), ABI showed moderate levels ∼0.055 (red circle; Figure 10c) while K. brevis cell concentrations were very low (0–1000 cells L–1) or not present (Figure 10d). It likely indicates that other species dominated the phytoplankton community along the Big Bend Coast, such as nitrate-assimilating diatom, which generally show dominance in the nutrient-rich river plume waters or during strong upwelling events (Qian et al., 2003; Chakraborty and Lohrenz, 2015); such events associated with Hurricane Michael (Figure 9a) likely contributed to elevated phytoplankton biomass along the coast and shelf waters (Figures 11a,c). However, the extremely bright milky-white color (arrow 2, Figure 10a) could be attributed to the coccolithophore Emiliania huxleyi, with its high reflectance across the visible spectrum induced by their detached coccoliths (Brown and Yoder, 1994). The E. huxleyi bloom area displayed relatively lower Chl a (∼3.5 mg L–1; Figure 11c) but much higher reflectance compared to the K. brevis bloom (Figure 10b). This coccolithophore bloom area (white circle; Figure 10c) which was completely masked in the modified ABI due to its high reflectance at 560 nm as well as the reflectance threshold method (Figure 9b; Joshi and D’Sa, in review) suggests the potential of these techniques to differentiate between highly reflective and absorbing bloom waters.
A sequence of cloud-free Sentinel-3 OLCI derived Chl a imagery obtained before (October 06), and immediately following the hurricane (October 13) indicated a relatively large increase in Chl a in the shelf waters (∼3.1 to ∼7.5 mg m–3) before decreasing to lower values (∼0.5 to ∼4.1 mg m–3) by October 17, 2018 (Figures 11a,c,e). This increase was mainly associated with large scale algae blooms (Figure 11c) which nearly dissipated within a week (Figure 11e). Within ApB, Chl a values which were elevated before the hurricane (∼9.5 mg m–3 on October 06) increased to ∼14.2 mg m–3 on October 13 before decreasing to ∼11.1 mg m–3 by October 17, 2018 (Figures 11b,d,f); these satellite estimates, however, have not been previously validated for these estuarine waters.
The Pigment Inversion Algorithm Performance
The inversion model used an extensive set of field bio-optical data [aphy(λ) spectra and Chl a, N = 425; Figure 10e] obtained in the neGoM ranging from coastal ocean to estuaries including CDOM, sediment-rich and red-tide waters (Figure 10a-pin locations) to optimize regional tuning and obtain robust parameterization of Chl a-aphy(λ) relationship for the neGoM waters. The aphy(λ) showed large variations in magnitude (0.01 – 1.497 m–1 at 440 nm and 0.008 – 1.253 m–1 at 675 nm) while Chl a varied from ∼0.12 mg m–3 in offshore waters to an average of ∼12.67 mg m–3 in the various neGOM estuaries across different seasons; however, extremely high values reaching ∼77 mg m–3 were observed in red tide bloom waters. The aphy(λ) spectra obtained in red-tide area displayed a small peak in the range of 450–470 nm (blue dotted lines; Figure 10e), likely attributed to the presence of fucoxanthin; in contrast, at lower Chl a levels corresponding to pico-phytoplankton dominated groups, aphy(λ) were steep were 450–470 nm range but lifted ∼ 490 nm, probably due to the absorption of zeaxanthin. The modeled aphy(λ) agreed well with the spectrophotometrically measured aphy(λ) for all data across the whole spectra (R2 = 0.84, Figure 10f). The vector coefficients were further applied to Sentinel-3A OLCI Chl a maps to generate 301 sentinel-3A OLCI aphy images (aphy_OLCI), representing aphy values at each wavelength (400–700 nm at 1 nm interval). However, since the parameterization for Chl a-aphy correlation is optimized for the neGOM, it could show limitations when applied to other areas wherein phytoplankton communities show large seasonal and taxonomic differences, or where the algal blooms are not associated with red tide species, K. brevis; thus uncertainties could be introduced in satellite-derived aphy. The aphy_OLCI(λ) was then spectrally decomposed into 22 mass-specific pigment spectra at each pixel using NNLS technique to obtain the concentrations of 22 pigments. The NNLS-inversed Chl a (Figure 11g) exhibited exactly the same spatial patterns with Sentinel-3A OLCI Chl a product but showing slightly lower values (R2 = 0.99; Figure 11h). In this study, the limitation is the lack of HPLC measurements during the study period, and thus, parameters associated with uncertainties (e.g., MAE, RMSE, and R2) for the estimated pigments cannot be calculated at this time. However, the modeled aphy(λ) (Figure 10f) and NNLS-inversed Chl a (Figure 11g) showed acceptable range for predicting pigment compositions compared to Moisan et al. (2017) and Liu et al. (2019a), in which a similar NNLS-algorithm has been used and validated for estimation of phytoplankton pigments.
Satellite-Derived Pigment Distributions in Shelf Waters Following Hurricane Michael
Most photosynthetic type-1 dinoflagellates contain a chloroplast with peridinin as the major carotenoid; however, fucoxanthin and/or fucoxanthin derivatives such as 19′hexa-noyloxyfucoxanthin (19′hexa-fuco) can also replace peridinin as the major carotenoid in the genus Karenia (5 species, 8 strains) - type-2 dinoflagellates (Jeffrey and Vesk, 1997). Fucoxanthin, a carotenoid largely used to trace diatoms (Bianchi and Canuel, 2011), was found to be the major carotenoid in K. brevis, K. mikimotoi, and K. selliformis (Zapata et al., 2012). HPLC analysis of a K. brevis culture, obtained in Galveston Bay and Florida Coast (Örnólfsdóttir et al., 2003), showed Chl a, Chl c3, Chl c1c2, fuco, 19’buta-fuco, 19’hexa-fuco, diadino, gyro, and β-carotenoid (β-caro) – with no peridinin detected. Further HPLC analyses are clearly needed to examine for regional differences in pigment composition of Karenia spp.
In this study, the NNLS-inversed 19′hexa-fuco, fuco, and peri (Figures 12a–c) showed differences in distribution patterns and magnitude from estuarine to coastal waters and bloom areas. Values of 19′hexa-fuco (range of 0.001–0.9 mg L–1) were obviously higher in the bloom areas in the midshelf waters than estuarine waters, which is consistent with Chakraborty and Lohrenz (2015) that haptophytes (coccolithophores) were more prevalent at midshelf resulting in an order of magnitude higher ratio of 19′hexa-fuco to total accessory pigment than inner shelf waters. In contrast, fucoxanthin displayed the same pattern as the Chl a map, decreasing from estuarine to shelf waters (Figures 11a, 12b), which is likely attributed to the presence of diatoms. Diatoms are more abundant prevalent in the N and Si-rich estuarine/shelf waters of the NGoM compared to offshore waters (Qian et al., 2003). In contrast, dinoflagellates, which tend to have higher P demands, will generally increase in abundance with decreasing ratios of N:P and Si:P, resulting in a compositional shift from a diatom-to dinoflagellate-dominated community (Paerl, 1997; Heisler et al., 2008). Along these lines, the carotenoid peridinin, found in Type-I dinoflagellates, exhibited substantially different patterns compared to the distributions of Chl a and fuco (Figure 12c); peri displayed extremely low concentrations in estuarine waters (∼0.001 mg L–1), but elevated in shelf waters. consistent with more P-limited estuarine environments vs. more N-limited oceanic waters (Paerl, 1997). Moreover, extremely low concentration of peri (∼ 0.001 mg L–1) observed in bloom areas, indicated algal blooms were not associated with Type 1 dinoflagellates. Furthermore, the fringing area of the red tide, dark in color (black arrow 1; Figure 10a) with extremely high ABI (Figure 10c) and Chl a (Figure 11a), showed relatively lower values of 19′hexa-fuco (∼0.6 mg L–1, white arrow; Figure 12a), compared to the adjacent coccolithophore-dominated area (∼0.85 mg L–1; Figure 12a). In contrast, values of fuco (∼2.3 mg L–1) at the edge of red tide (white arrow; Figure 12b), were as high, as found in estuarine waters, with the mean value of the red tide dominated area (∼2.0 mg L–1) higher than the coccolithophore dominated area (∼1.5 mg L–1). Although fuco is a common biomarker for diatoms, the absence of 19’hexa-fuco suggests that K. brevis accounted for a major proportion of the phytoplankton community - with minor only contributions from diatoms (black arrow 1; Figure 10a). This supports previous work which showed that K. brevis have higher phosphorus demands than diatoms and are generally found in waters with very low DIN:PO4 (∼4) (Walsh et al., 2006). Some bloom-forming dinoflagellates (e.g., K. brevis) share several of the same pigment markers as bloom-forming haptophytes (e.g., E. huxleyi) (Zapata et al., 2004); thus, specific pigment to Chl a ratios including 19’hexa-fuco (Figure 12d), fuco (Figure 12e), and peri (Figure 12f) could help in discriminating Karenia species from 19′hexa-fuco-containing haptophytes. In the red tide area, fuco:Chl a varied from 0.24 to 0.30 and was lower than in coccolithophore bloom (∼ 0.45). These ratios are within the range of previously reported fuco:Chl a values for K. brevis (0.31) and haptophytes (0.58) (Örnólfsdóttir et al., 2003). Furthermore, 19′hexa-fuco:Chl a ratios had a higher mean value (∼0.4) in coccolithophore bloom (∼0.4) than the red tide area (∼0.15) (Figure 12d), consistent with previous studies (Örnólfsdóttir et al., 2003; Zapata et al., 2004, 2012). More specifically, higher 19’hexa-fuco:Chl a ratios are found in strains of type-6 haptophytes (E. huxleyi) than type-2 dinoflagellate (Karenia species).
Discussion
Effects of Hurricane Michael’s Storm System on DOC and POC Distributions in ApB and Fluxes to the Coastal Ocean
The semi-analytic approach (QAA-V) to estimate the absorption and backscattering coefficients in various coastal and estuarine waters from ocean color satellite data were found to be robust (Joshi and D’Sa, 2018). The use of empirical relationships (D’Sa et al., 2018; Equations 1–5, this study) to further estimate DOC and POC concentrations provides an alternative to solely using empirical algorithms which are more susceptible to regional and seasonal variabilities (Le et al., 2016; Joshi et al., 2017). Thus, a sequence of DOC and POC maps generated using the semi-analytic approach from clear sky MODIS-Aqua imagery of ApB from before and after Hurricane Michael passage just west of ApB allowed us to examine the biogeochemical response of this estuary to an extreme disturbance. The imagery revealed similarities and subtle differences in the distribution patterns of DOC and POC (Figures 6, 7) that appeared to be strongly influenced by the hydrodynamics (river discharge, currents, salinity) associated with the hurricane’s passage. Moderate easterly winds before the hurricane along with westward currents within ApB and the shelf waters (Figures 2C, 3c; October 4) combined with slightly elevated fall river discharge conditions (Figure 2A) resulted in patterns of low DOC and POC distributions in east ApB (due to inflow of marine waters into ApB through the east passes). Higher levels were found in the west bay due to discharge from the AR which produced a strong DOC river plume. In addition, plumes of high DOC and POC outside the West and Indian Passes demonstrate this lateral C transport from the ApB into the adjacent coastal waters (Figures 6, 7).
Although moderate, easterly wind conditions continued on October 6, increasing sea levels (Figure 3a) with pulses of high salinity waters at LM station and increasing turbidity in the water column (Figures 2C,D) indicated the effects of the approaching storm within the bay. Further, areas of low DOC and POC distributions at various locations within the bay were evident due to the intrusion of coastal seawater and indicated the storm’s influence even 4 days before the hurricane made landfall. Two days after Michael’s passage (October 12), strong southerly/southeasterly currents prevailed both inside and outside the bay (not shown). Along with increasing river discharge, this resulted in high levels of both DOC and POC and large plumes emanating from the bay. Hence, net DOC and POC fluxes following the hurricane’s passage increased substantially (Figure 8). Moderate easterly winds on October 13 however, appeared to have dispersed these C plumes outside the bay (Figure 8). Peak river discharge occurred by October 17 (Figure 2A) which, combined with low wind conditions (Figure 2B), resulted in highest DOC and POC concentrations observed throughout the bay, along with elevated fluxes of DOC (∼5 kg s–1) and POC (∼1 kg s–1). Although river discharge levels were still at near peak on October 21, surface distributions of both DOC and POC increased dramatically likely triggered by moderately strong northeasterly winds (Figure 2B) indicating the rapid response of surface distributions of DOC and POC in the bay to the wind field (Figures 6, 7). Nonetheless, fluxes of both DOC and POC from bay to the surrounding coastal waters were similar to those of October 17, with increased fluxes through the Indian and West Passes.
Although the DOC and POC fluxes were diurnal and tidally dominated in and out of all the passes, the de-tided fluxes showed increasing net fluxes out of the bay consistent with the increasing volume of the AR discharge. However, later in the month these fluxes were attributable to increasing wind fields which likely mobilized greater amounts of DOC and POC in the water column (Figures 2A,B, 8). Average DOC flux exported during the 16-day period from October 5–21 was about 11,916 kg C h–1, which was approximately twice that estimated during the fall of 2015 in ApB or 8.73% of the annual DOC flux from ApB using the same ocean color and modeling approach (Joshi et al., 2017). Since POC fluxes have not been previously reported for ApB, similar flux comparisons cannot be made for POC. The integrated export from ApB to the coastal ocean of total organic flux (DOC plus POC) over a 16-day period (between October 5 to 21) was 6.511 × 10⁶ kg C (4.576 × 10⁶ + 1.935 × 10⁶ kg C). This flux was about a quarter of that exported from Galveston Bay to the shelf waters over a 10-day period during/following Hurricane Harvey over the Texas coast in August 2017 (D’Sa et al., 2018). In contrast to Hurricane Michael, which was a fast moving hurricane, Harvey was a slow moving hurricane that caused >500 mm of rainfall in the Houston metropolitan area further demonstrating that each hurricane can have unique characteristics and impacts on the coastal ecosystems.
Hurricane Impact on Phytoplankton Composition in Shelf Waters
The wind field and precipitation associated with Hurricane Michael caused a complex response in the coastal and shelf waters that led to reduced salinity and surface temperatures (as indicated by model outputs–not shown). This was likely due to enhanced water column mixing, upwelling and transport of coastal waters over a large area of the northwest Florida shelf, and elevated levels of organic matter in the shelf waters. Surface currents appeared to transport cooler coastal waters (with elevated DOC; Figure 9b) eastward alongshore and then steered westward by the presence of an eddy at the shelf edge (Figure 9a) that led to a strong biological response with spatially distinct distribution patterns in the shelf waters (Figures 10, 11).
Observations of pigment ratios from the bio-optical inversion algorithm, ERGB image and the reflectance spectra in algal boom areas from Sentinel-3A OLCI and in-situ measured K. brevis cell concentration from FWC jointly suggest that shelf waters southwest of ApB was a mixed algal bloom of K. brevis and E. huxleyi, with fringing area more dominated by K. brevis. The coccolithophore E. huxleyi flourished in shelf waters east side of ApB, broadly extending to K. brevis bloom area. It is widely agreed that red tide of K. brevis near shore in the eastern GOM originate ∼15–65 km offshore in deep shelf waters due to the initial phosphorus-rich nutrients at low DIN/PO4 ratios supplied by benthic sediments and recycled estuarine/ground water (Waters et al., 2015). Accumulated K. brevis seeds at the bottom of the Florida shelf which then upwell inshore by wind and tidal currents, often bloom in the estuarine-coastal surface waters (Hu et al., 2006); these are further enhanced by high dissolved organic nitrate (DON) from a variety of sources including land-based nutrients carried by estuarine waters, decomposing dead fish and nutrient inputs from N2-fixation from Trichodesmium blooms, which generally co-occur with K. brevis blooms on the West Florida shelf (Walsh et al., 2006). In this study, the areas southwest of ApB were strongly influenced by hurricane-induced flux of organic matter out of bays which likely favor those species capable of assimilating organic forms of nutrients (e.g., K. brevis) rather than species more reliant on inorganic nutrients (e.g., diatoms) (Anderson et al., 2008; Heisler et al., 2008). To our knowledge, this is first time synchronous blooms of K. brevis and E. huxleyi were found in mid-shelf waters following Hurricane Michael. E. huxleyi is well-known as one of the more cosmopolitan coccolithophore species, forming extensive blooms from polar to tropical regions, in both open ocean and coastal shelf waters (Holligan et al., 1993). The particularly competitive ability of E. huxleyi at high N:P ratios, observed in cultures (Riegman et al., 2000) and eutrophic coastal waters with high N and P, but low silica (Si) concentrations (Yunev et al., 2007) may in part, explain for its rapid appearance after the passage of Hurricane Michael. Thus, low ratios of Si:N and Si:P could be a possible reason that coccolithophores outcompeted other phytoplankton species, such as diatoms, in this hurricane-impacted nutrient-rich environments.
More interestingly, MODIS ERGB imagery of October 11and 12, 2018 (Supplementary Figure S1) indicated that the K. brevis bloom expanded rapidly into areas dominated by the E. huxleyi bloom especially west of ApB and the area closer to where Hurricane Michael made landfall. Also notable was a small area south of ApB on October 11 (light pink, Supplementary Figure S1) that expanded eastward by October 12 (dark pink/red due to greater absorption) revealing the rapid and intense growth of K. Brevis bloom following the hurricane passage. Previous studies using MODIS images acquired in the western English Channel also observed similar phenomenon of K. mikimotoi development along coccolithophore blooms, which captured both dinoflagellate and coccolithophores blooms spanning across different seasons during 2002–2006 (Garcia-Soto et al., 1995; Garcia-Soto and Pingree, 2009). However, the statewide red tide status map acquired one week before Hurricane Michael (October 1–6, 2018) from FWC detected low concentrations of K. brevis (∼10,000-100,000 cells L–1) adjacent to Dune Lakes in Walton, Panama City Beach and Apalachicola. With NCOM model results indicating plumes of these coastal waters with elevated DOM being transported into the mid-shelf region where satellite imagery detected algal blooms suggest that K. brevis did not initiate from coccolithophore bloom, but were likely transported into the bloom regions where hydrographic and nutrient conditions appears to create ecological preferences for K. brevis on the northwest Florida Coast. In fact, a previous study in this same area (McCulloch et al., 2013) documented the presence of gyroxanthin dinoflagellates (K. brevis) in near-surface and near-bottom shelf waters in this area and further suggested that under light and nutrient conditions typical of summer, K. brevis coastal blooms could originate from concentrated near-bottom populations during upwelling conditions (McCulloch et al., 2013). Upwelling conditions and strong offshore currents during hurricane landfall (Figure 3b) and subsequent transport of these coastal waters to the shelf (Figures 9a,b) strongly suggest that these coastal and estuarine waters with elevated organic nutrients and entrained seed populations of K. brevis conjointly led to a phytoplankton bloom including that of K. brevis (Figures 10a, 11, 12). Previous field measurements of the Florida shelf waters acquired in 2004 and 2005 hurricane season also showed that nutrient loading was an order of magnitude greater than pre-hurricane (Neely et al., 2006); following Hurricane Michael, the coastal plume likely contained high nutrients transported from the estuaries and bays along the northwest Florida coast that likely contributed to the intensive phytoplankton bloom. Further, estuarine CDOM additions in the shelf waters associated with the hurricane (e.g., Figure 9b) could have provided more favorable light-shield environment (Walsh et al., 2003) for the shade-adapted K. brevis. The identification of algal bloom pigment composition from the high spectral and spatial resolution Sentinel-3A OLCI imagery using inversion techniques (e.g., Moisan et al., 2017; Liu et al., 2019a) could revolutionize our understanding of phytoplankton spatiotemporal response to environmental variabilities.
Conclusion
In this study, the biogeochemical responses of ApB and northwest Florida shelf waters were examined following the passage of Hurricane Michael through the neGoM in October 2018. A combination of pre-hurricane field observations, ocean color data from two satellite sensors (MODIS-Aqua and Sentinel-3A OLCI) and the outputs of a high-resolution ocean model (NCOM) provided a robust assessment of the hurricane’s impact on the coastal C cycle. A combination of an estuarine-tuned semi-analytic algorithm (QAA-V) and an empirical algorithm were applied using field and atmospherically corrected ocean color reflectance data to obtain estimates of DOC and POC distributions in ApB before and after the hurricane’s landfall on the Florida coast. Spatial distribution of DOC and POC in ApB and their fluxes to the coastal ocean indicated strong hydrologic and hydrodynamic controls on the dynamics and export of organic matter to the coastal ocean associated with the hurricane such as wind forcing due to frontal passages and increasing river discharge. The integrated export from ApB to the coastal ocean of total organic flux (DOC plus POC) over a 16-day period (between October 5 and 21) was about a quarter of that exported from Galveston Bay to the shelf waters over a 10-day period during/following hurricane Harvey over the Texas coast in August 2017. This difference reflected the different characteristics of the two hurricanes, the two estuaries and the drainage basin impacted by the hurricanes. The implication is that slow-moving storms such as Harvey may saturate coastal watersheds inland mobilize more DOC and POC than fast-moving storms such as Michael.
In the shelf waters, water discoloration in a true color imagery obtained 3 days following the hurricane landfall (October 13) along with high surface Chl a concentrations indicated the presence of distinct algal blooms in the normally oligotrophic offshore waters. Observations of Sentinel-3A OLCI derived pigment ratios from the bio-optical inversion algorithm, and the shape of reflectance spectra in the algal boom areas suggested that shelf waters southwest of ApB was a mixed algal bloom of K. brevis and E. huxleyi, with fringing area mainly dominated by K. brevis; the area east/southeast of ApB, in contrast appeared to be dominated by coccolithophore E. huxleyi. The presence of a cyclonic loop current eddy along the shelf edge likely limited the response of deep waters to the hurricane passage. This study revealed a varied but shorter-term impact on the biogeochemistry and the ecosystem of ApB and surrounding shelf waters during Hurricane Michael. Additional longer-term studies of the hurricane impacts are warranted due to the socio-economic importance of the northwest Florida coast and shelf waters.
Data Availability
The datasets generated for this study are available on request to the corresponding author.
Author Contributions
ED’S, IJ, BL, and DK designed the study and analyzed the data. ED’S, IJ, CO, and TB acquired and processed the pre-hurricane field data. DK developed the ocean model, performed the simulation, and estimated the DOC/POC fluxes. ED’S and BL wrote the manuscript with contribution of all authors.
Funding
Funding for this work was provided by NASA grants 80NSSC18K0177 and NNX14A043G.
Conflict of Interest Statement
The authors declare that the research was conducted in the absence of any commercial or financial relationships that could be construed as a potential conflict of interest.
Acknowledgments
The authors would like to thank NASA Ocean Biology Processing Group (OBPG) for providing access to MODIS data, maintaining SeaDAS software package, and the SeaBASS public repository of in situ oceanographic data. The authors would also like to thank the European Space Agency (ESA) and the European Organization for Meteorological Satellites (EUMETSAT) for providing access to the Sentinel-3 OLCI ocean color data and the Sentinel-3 Toolbox Kit Module (S3TBX) version 5.0.1 in Sentinel Application Platform (SNAP).
Supplementary Material
The Supplementary Material for this article can be found online at: https://www.frontiersin.org/articles/10.3389/fmars.2019.00523/full#supplementary-material
References
Abril, G., Nogueira, M., Etcheber, H., Cabecadas, G., Lemaire, E., and Brogueira, M. J. (2002). Behaviour of organic carbon in ninie contrasting European estuaries. Estuar. Coast. Shelf Sci. 54, 241–262. doi: 10.1006/ecss.2001.0844
Anderson, D. M., Burkholder, J. M., Cochlan, W. P., Glibert, P. M., Gobler, C. J., Heil, C. A., et al. (2008). Harmful algal blooms and eutrophication: examining linkages from selected coastal regions of the United States. Harmful Algae 8, 39–53. doi: 10.1016/j.hal.2008.08.017
Avery, G. B. Jr., Kieber, R. J., and Willey, J. D. (2004). Impact of hurricanes on the flux of rainwater and Cape Fear River water dissolved organic carbon to Long Bay, southeastern United States. Glob. Biogeochem. Cycles 18, 3015–3021.
Babin, S. M., Carton, J. A., Dickey, T. D., and Wiggert, J. D. (2004). Satellite evidence of hurricane-induced phytoplankton blooms in an oceanic desert. J. Geophys. Res. Oceans 109:C03043.
Bianchi, T. S., Baskaran, M., DeLord, J., and Ravichandran, M. (1997). Carbon cycling in a shallow turbid estuary of southeast Texas: the use of plant pigment biomarkers and water quality parameters. Estuaries 20, 404–415.
Bianchi, T. S., and Canuel, E. A. (2011). Chemical Biomarkers in Aquatic Ecosystems. Princeton, NJ: Princeton University Press. 396.
Bidigare, R. R., Ondrusek, M. E., Morrow, J. H., and Kiefer, D. A. (1990). “In-vivo absorption properties of algal pigments,” in Proceedings of SPIE Ocean Optical X. SPIE, Orlando, FL, 290–303.
Black, W. J., and Dickey, T. D. (2008). Observations and analysis of upper ocean responses to tropical storms and hurricanes in the vicinity of Bermuda. J. Geophys. Res. 113:C08009.
Bricaud, A., Claustre, H., Ras, J., and Oubelkheir, K. (2004). Natural variability of phytoplanktonic absorption in oceanic waters: influence of the size structure of algal populations. J. Geophys. Res. Oceans 109:C11010.
Brown, C. W., and Yoder, J. A. (1994). Coccolithophorid blooms in the global ocean. J. Geophys. Res. Oceans 99, 7467–7482.
Brown, M. M., Mulligan, R. P., and Miller, R. L. (2014). Modeling the transport of freshwater and dissolved organic carbon in the Neuse River Estuary, NC, USA following Hurricane Irene (2011). Estuar. Coast. Shelf Sci. 139, 148–158. doi: 10.1016/j.ecss.2014.01.005
Chakraborty, S., and Lohrenz, S. E. (2015). Phytoplankton community structure in the river-influenced continental margin of the northern Gulf of Mexico. Mar. Ecol. Progr. Ser. 521, 31–47. doi: 10.3354/meps11107
Chen, S., Huang, W., Wang, H., and Li, D. (2009). Remote sensing assessment of sediment re-suspension during Hurricane Frances in Apalachicola Bay, USA. Remote Sens. Environ. 113, 2670–2681. doi: 10.1016/j.rse.2009.08.005
Ciotti, A. M., Lewis, M. R., and Cullen, J. J. (2002). Assessment of the relationships between dominant cell size in natural phytoplankton communities and the spectral shape of the absorption coefficient. Limnol. Oceanogr. 47, 404–417. doi: 10.4319/lo.2002.47.2.0404
Cook, J., Hodson, A. J., Taggart, A., Mernild, S. H., and Tranter, M. (2017). A predictive model for the spectral “bioalbedo” of snow. J. Geophys. Res. Oceans 122, 434–454. doi: 10.1002/2016jf003932
Davis, A., and Yan, X.-H. (2004). Hurricane forcing on chlorophyll-a concentration off the northeast coast of the U.S. Geophys. Res. Lett. 31:L17304.
D’Sa, E. J. (2008). Colored dissolved organic matter in coastal waters influenced by the Atchafalaya River, USA: effects of an algal bloom. J. Appl. Remote Sens. 2:023502. doi: 10.1117/1.2838253
D’Sa, E. J., Joshi, I., and Liu, B. (2018). Galveston Bay and coastal ocean optical-geochemical response to Hurricane Harvey from VIIRS ocean color. Geophys. Res. Lett. 45, 10579–10589. doi: 10.1029/2018GL079954
D’Sa, E. J., Korobkin, M., and Ko, D. S. (2011). Effects of Hurricane Ike on the Louisiana–Texas coast from satellite and model data. Remote Sens. Lett. 2, 11–19. doi: 10.1080/01431161.2010.489057
D’Sa, E. J., and Miller, R. L. (2003). Bio-optical properties in waters influenced by the Mississippi River during low flow conditions. Remote Sens. Environ. 84, 538–549. doi: 10.1016/s0034-4257(02)00163-3
D’Sa, E. J., Miller, R. L., and Del Castillo, C. (2006). Bio-optical properties and ocean color algorithms for coastal waters influenced by the Mississippi River during a cold front. Appl. Opt. 45, 7410–7428.
Emanuel, K. (2005). Increasing destructiveness of tropical cyclones over the past 30 years. Nature 436, 686–688. doi: 10.1038/nature03906
Emanuel, K. (2013). Downscaling CMIP5 climate models shows increased tropical cyclone activity over the 21st century. Proc. Natl. Acad. Sci. U.S.A. 110, 12219–12224. doi: 10.1073/pnas.1301293110
Emanuel, K. (2017). Assessing the present and future probability of Hurricane Harvey’s rainfall. Proc. Natl. Acad. Sci. U.S.A. 114, 12681–12684. doi: 10.1073/pnas.1716222114
Farfan, L. M., D’Sa, E. J., and Liu, K. (2014). Tropical cyclone impacts on coastal regions: the case of the Yucatan and the Baja California Peninsulas. Mexico. Estuar. Coast. 37, 1388–1402. doi: 10.1007/s12237-014-9797-2
Fichot, C. G., and Benner, R. (2011). A novel method to estimate DOC concentrations from CDOM absorption coefficients in coastal waters. Geophys. Res. Lett. 38:L03610.
Garcia-Soto, C., Fernandez, E., Pingree, R., and Harbour, D. (1995). Evolution and structure of a shelf coccolithophore bloom in the Western english channel. J. Plankton Res. 17, 2011–2036. doi: 10.1093/plankt/17.11.2011
Garcia-Soto, C., and Pingree, R. D. (2009). Spring and summer blooms of phytoplankton (SeaWiFS/MODIS) along a ferry line in the Bay of Biscay and western English Channel. Contl. Shelf Res. 29, 1111–1122. doi: 10.1016/j.csr.2008.12.012
Gardner, W. D., Mishonov, A. V., and Richardson, M. J. (2006). Global POC concentrations from in-situ and satellite data. Deep Sea Res. II 53, 718–740. doi: 10.1016/j.dsr2.2006.01.029
Gordon, H. R., Brown, O. B., Evans, R. H., Brown, J. W., Smith, R. C., Baker, K. S., et al. (1988). A semianalytic radiance model of ocean color. J. Geophys. Res. Atmos. 93, 10909–10924.
Hanshaw, M. N., Lozier, M. S., and Palter, J. B. (2008). Integrated impact of tropical cyclones on sea surface chlorophyll in the North Atlantic. Geophys. Res. Lett. 35:L01601.
Havens, K., Allen, M., Camp, E., Irani, T., Lindsey, A., Morris, J., et al. (2013). Apalachicola Bay Oyster Situation Report. Gainesville, FL: University of Florida.
He, R. Y., and Weisberg, R. H. (2002). West Florida shelf circulation and temperature budget for the 1999 spring transiton. Cont. Shelf Res. 22, 719–748. doi: 10.1016/s0278-4343(01)00085-1
Heisler, J., Glibert, P. M., Burkholder, J. M., Anderson, D. M., Cochlan, W., Dennison, W. C., et al. (2008). Eutrophication and harmful algal blooms: a scientific consensus. Harmful Algae 8, 3–13. doi: 10.1016/j.hal.2008.08.006
Holligan, P. M., Fernández, E., Aiken, J., Balch, W. M., Boyd, P., Burkill, P. H., et al. (1993). A biogeochemical study of the coccolithophore, Emiliania huxleyi, in the North Atlantic. Glob. Biogeochem. Cycles 7, 879–900.
Hu, C., and Feng, L. (2016). Modified MODIS fluorescence line height data product to improve image interpretation for red tide monitoring in the eastern Gulf of Mexico. J. Appl. Remote Sens. 11:012003. doi: 10.1117/1.jrs.11.012003
Hu, C., Muller-Karger, F. E., and Swarzenski, P. W. (2006). Hurricanes, submarine groundwater discharge, and Florida’s red tides. Geophys. Res. Lett. 33, 1–5.
Jeffrey, S., and Vesk, M. (1997). Introduction to Marine Phytoplankton and their Pigment Signature, Phytoplankton Pigments in Oceanography. Paris: UNESCO Publication, 3784.
Joshi, I. D., and D’Sa, E. J. (2015). Seasonal variation of colored dissolved organic matter in Barataria Bay, Louisiana, using combined Landsat and field data. Remote Sens. 7, 12478–12502. doi: 10.3390/rs70912478
Joshi, I. D., and D’Sa, E. J. (2018). An estuarine tuned Quasi-Analytical Algorithm for VIIRS (QAA-V): assessment and application to satellite estimates of SPM in Galveston Bay following Hurricane Harvey. Biogeosciences 15, 4065–4086. doi: 10.5194/bg-15-4065-2018
Joshi, I. D., D’Sa, E. J., Osburn, C. L., Bianchi, T. S., Ko, D. S., Oviedo-Vargas, D., et al. (2017). Assessing chromophoric dissolved organic matter (CDOM) distribution, stocks, and fluxes in Apalachicola Bay using combined field, VIIRS ocean color, and model observations. Remote Sens. Environ. 191, 359–372. doi: 10.1016/j.rse.2017.01.039
Keim, B. D., Muller, R. A., and Stone, G. E. (2007). Spatiotemporal patterns and return periods of tropical storm and hurricane strikes from Texas to Maine. J. Clim. 20, 3498–3509. doi: 10.1175/jcli4187.1
Kiefer, D. A., and SooHoo, J. B. (1982). Spectral absorption by marine particles of coastal waters of Baja California. Limnol. Oceanogr. 27, 492–499. doi: 10.4319/lo.1982.27.3.0492
Kirk, J. T. (1994). Light and Photosynthesis in Aquatic Ecosystems. Cambridge: Cambridge University Press.
Ko, D. S., Martin, P. J., Rowley, C. D., and Preller, R. H. (2008). A real-time coastal ocean prediction experiment for MREA04. J. Mar. Syst. 69, 17–28. doi: 10.1016/j.jmarsys.2007.02.022
Le, C., Lehrter, J. C., Hu, C., MacIntyre, H., and Beck, M. W. (2016). Satellite observation of particulate organic carbon dynamics on the Louisiana continental shelf. J. Geophys. Res. Oceans 122, 555–569. doi: 10.1002/2016JC012275
Lee, Z., Carder, K. L., and Arnone, R. A. (2002). Deriving inherent optical properties from water color: a multiband quasi-analytical algorithm for optically deep waters. Appl. Opt. 41, 5755–5772.
Lin, I., Liu, W. T., Wu, C.-C., Wong, G. T. F., Hu, C., Chen, Z., et al. (2003). New evidence for enhanced ocean primary production triggered by tropical cyclone. Geophys. Res. Lett. 30:1718. doi: 10.1029/2003GL017141
Liu, B., D’Sa, E. J., and Joshi, I. D. (2019a). Floodwater Impact on Galveston Bay phytoplankton taxonomy, pigment composition and photo-physiological state following Hurricane Harvey from field and ocean color (Sentinel-3A OLCI) observations. Biogeosciences 16, 1975–2001. doi: 10.5194/bg-16-1-2018
Liu, B., D’Sa, E. J., and Joshi, I. D. (2019b). Multi-decadal trends and influences on dissolved organic carbon distribution in the Barataria Basin, Louisiana from in-situ and Landsat/MODIS observations. Rem. Sens. Environ. 228, 183–202. doi: 10.1016/j.rse.2019.04.023
Livingston, R. J. (2014). Climate Change and Coastal Ecosystems: Long-Term Effects of Climate and Nutrient Loading on Trophic Organization, Boca Raton, FL: CRC Press, 572.
Lohrenz, S. E., Cai, W.-J., Chen, X., and Tuel, M. (2008). Satellite assessment of bio-optical properties of northern Gulf of Mexico coastal waters following Hurricanes Katrina and Rita. Sensors 8, 4135–4150. doi: 10.3390/s8074135
Lutz, V. A., Sathyendaranath, S., Head, E. J. H., and Li, W. K. W. (2001). Changes in the in vivo absorption and fluorescence excitation spectra with growth irradiance in three species of phytoplankton. J. Plankton Res. 23, 555–569. doi: 10.1093/plankt/23.6.555
Mannino, A., Novak, M. G., Hooker, S. B., Hyde, K., and Aurin, D. (2014). Algorithm development and validation of CDOM properties for estuarine and continental shelf waters along the northeastern U.S. coast. Remote Sens. Environ. 152, 576–602. doi: 10.1016/j.rse.2014.06.027
Mannino, A., Russ, M. E., and Hooker, S. B. (2008). Algorithm development and validation for satellite-derived distributions of DOC and CDOM in the US Middle Atlantic Bight. J. Geophys. Res. Oceans 113
Mannino, A., Signorini, S. R., Novak, M. G., Wilkin, J., Friedrichs, M. A. M., and Najjar, R. G. (2015). Dissolved organic carbon fluxes in the Middle Atlantic Bight: an integrated approach based on satellite data and ocean model products. J. Geophys. Res. Biogeosci. 121, 312–336. doi: 10.1002/2015JG003031
McCulloch, A. A., Kamykowski, D., Morrison, J. M., Thomas, C. J., and Pridgen, K. G. (2013). A physical and biological context for karenia brevis seed populations on the northwest Florida shelf during July 2009. Cont. Shelf Res. 63, 94–111. doi: 10.1016/j.csr.2013.05.001
McKinnon, A. D., Meekan, M. G., Carleton, J. H., Furnas, M. J., Duggan, S., and Skirving, W. (2003). Rapid changes in shelf waters and pelagic communities on the southern Northwest Shelf, Australia, following a tropical cyclone. Cont. Shelf Res. 23, 93–111. doi: 10.1016/s0278-4343(02)00148-6
Miller, W. D., Harding, L. W., and Adolf, J. E. (2006). Hurricane Isabel generated an unusual fall bloom in Chesapeake Bay. Geophys. Res. Lett. 33:L06612.
Mitchell, B. G., and Kiefer, D. A. (1988). Chlorophyll α specific absorption and fluorescence excitation spectra for light-limited phytoplankton. Deep Sea Res. Part A Oceanogr. Res. Pap. 35, 639–663. doi: 10.1016/0198-0149(88)90024-6
Mobley, C. D. (1999). Estimation of the remote-sensing reflectance from above-surface measurements. Appl. Opt. 38, 7442–7455. doi: 10.1364/ao.38.007442
Moisan, T. A., Rufty, K. M., Moisan, J. R., and Linkswiler, M. A. (2017). Satellite observations of phytoplankton functional type spatial distributions, phenology, diversity, and ecotones. Front. Mar. Sci. 4:189. doi: 10.3389/fmars.2017.00189
Naik, P., and D’Sa, E. J. (2012). Phytoplankton light absorption of cultures and natural samples: comparisons using two spectrophotometers. Opt. Express 20, 4871–4886. doi: 10.1364/OE.20.004871
Neely, M., Heil, C., Murasko, S., Dziemiela, K., Faltin, E., Garrett, M., et al. (2006). “HAB’s and Hurricanes in Florida,” in Proceedings of the 2006 AGU Fall Meeting Abstracts, San Francisco, CA.
Örnólfsdóttir, E. B., Pinckney, J. L., and Tester, P. A. (2003). Quantification of the relative abundance of the toxic dinoflagellate, Karenia brevis (dinophyta), using unique photopigments 1. J. Phycol. 39, 449–457. doi: 10.1046/j.1529-8817.2003.01219.x
Osburn, C. L., Boyd, T. J., Montgomery, M. T., Bianchi, T. S., Coffin, R. B., and Paerl, H. W. (2016). Optical proxies for terrestrial dissolved organic matter in Estuaries and Coastal waters. Front. Mar. Sci. 2:127. doi: 10.3389/fmars.2015.00127
Osburn, C. L., and St-Jean, G. (2007). The use of wet chemical oxidation with high-amplification isotope ratio mass spectrometry (WCO-IRMS) to measure stable isotope values of dissolved organic carbon in seawater. Limnol. Oceanogr. Methods 5, 296–308. doi: 10.4319/lom.2007.5.296
Paerl, H. W. (1997). Coastal eutrophication and harmful algal blooms: importance of atmospheric deposition and groundwater as “new” nitrogen and other nutrient sources. Limnol. Oceanogr. 42, 1154–1165. doi: 10.4319/lo.1997.42.5_part_2.1154
Paerl, H. W., Bales, J. D., Ausley, L. W., Buzzelli, C. P., Crowder, L. B., Eby, L. A., et al. (2001). Ecosystem impacts of three sequential hurricanes (Dennis, Floyd, and Irene) on the United States’ largest lagoonal estuary, Pamlico Sound, NC. Proc. Natl. Acad. Sci. U.S.A. 98, 5655–5660. doi: 10.1073/pnas.101097398
Paerl, H. W., Crosswell, J. R., Van Dam, B., Hall, N. S., Rossignol, K. L., Osburn, C. L., et al. (2018). Two decades of tropical cyclone impacts on North Carolina’s estuarine carbon, nutrient and phytoplankton dynamics: implications for biogeochemical cycling and water quality in a stormier world. Biogeochemistry 141, 307–332. doi: 10.1007/s10533-018-0438-x
Paerl, H. W., Pinckney, J. L., Fear, J. M., and Peierls, B. L. (1998). Ecosystem responses to internal and watershed organic matter loading: consequences for hypoxia in the eutrophying Neuse River Estuary, North Carolina, USA. Mar. Ecol. Progr. Ser. 166, 17–25. doi: 10.3354/meps166017
Qian, Y., Jochens, A. E., Kennicutt, M. C. II, and Biggs, D. C. (2003). Spatial and temporal variability of phytoplankton biomass and community structure over the continental margin of the northeast Gulf of Mexico based on pigment analysis. Cont. Shelf Res. 23, 1–17. doi: 10.1016/s0278-4343(02)00173-5
Riegman, R., Stolte, W., Noordeloos, A. A., and Slezak, D. (2000). Nutrient uptake and alkaline phosphatase (EC 3: 1: 3: 1) activity of Emiliania huxleyi (Prymnesiophyceae) during growth under N and P limitation in continuous cultures. J. Phycol. 36, 87–96. doi: 10.1046/j.1529-8817.2000.99023.x
Roesler, C., Stramski, D., D’Sa, E. J., Rottgers, R., and Reynolds, R. A. (2018). “Spectrophotometric measurements of particulate absorption using filter pads,” in IOCCG Protocol Series - Ocean Optics and Biogeochemistry Protocols for Satellite Ocean Colour Sensor Validation, eds A. R. Neeleycpesnm and A. Manninocpesnm, (Dartmouth, NS: IOCCG).
Stramski, D., Reynolds, R. A., Babin, M., Kaczmarek, S., Lewis, M. R., Ruttgers, R., et al. (2008). Relationships between the surface concentration of particulate organic carbon and optical properties in the eastern South Pacific and eastern Atlantic Oceans. Biogeosciences 5, 171–201. doi: 10.5194/bg-5-171-2008
Stramski, D., Reynolds, R. A., Kahru, M., and Mitchell, G. (1999). Estimation of particulate organic carbon in the ocean from satellite remote sensing. Science 285, 239–242. doi: 10.1126/science.285.5425.239
Tehrani, N. C., D’Sa, E. J., Osburn, C. L., Bianchi, T. S., and Schaeffer, B. A. (2013). Chromophoric dissolved organic matter and dissolved organic carbon from sea-viewing wide field-of-view sensor (SeaWiFS), moderate resolution imaging spectroradiometer (MODIS) and MERIS sensors: case study for the northern Gulf of Mexico. Remote Sens. 5, 1439–1464. doi: 10.3390/rs5031439
Thrane, J.-E., Kyle, M., Striebel, M., Haande, S., Grung, M., Rohrlack, T., et al. (2015). Spectrophotometric analysis of pigments: a critical assessment of a high-throughput method for analysis of algal pigment mixtures by spectral deconvolution. PLoS One 10:e0137645. doi: 10.1371/journal.pone.0137645
Turner, R. E., Baustian, J. J., Swenson, E. M., and Spicer, J. S. (2006). Wetland sedimentation from Hurricanes Katrina and Rita. Science 314, 449–452. doi: 10.1126/science.1129116
Walker, N. D., Leben, R. B., and Balasubramanian, S. (2005). Hurricane forced upwelling and chlorophyll a enhancement within cold-core cyclones in the Gulf of Mexico. Geophys. Res. Lett. 32:L18610.
Walker, N. D., Pilley, C. T., Raghunathan, V. V., D’Sa, E. J., Leben, R. R., Hoffmann, N. G., et al. (2011). Impacts of loop current frontal cyclonic eddies and wind forcing on the 2010 Gulf of Mexio spill. Geophys. Monog. Ser. 195, 103–116. doi: 10.1029/2011gm001120
Walsh, J. J., Jolliff, J., Darrow, B., Lenes, J., Milroy, S., Remsen, A., et al. (2006). Red tides in the Gulf of Mexico: where, when, and why? J. Geophys. Res. Oceans 111, 1–46.
Walsh, J. J., Weisberg, R. H., Dieterle, D. A., He, R., Darrow, B. P., Jolliff, J. K., et al. (2003). Phytoplankton response to intrusions of slope water on the West Florida Shelf: models and observations. J. Geophys. Res. Oceans 108:3190.
Warnken, K. W., and Santschi, P. H. (2004). Biogeochemical behavior of organic carbon in the Trinity River downstream of a large reservoir lake in Texas, USA. Sci. Total Environ. 329, 131–144. doi: 10.1016/j.scitotenv.2004.02.017
Waters, L. G., Wolcott, T. G., Kamykowski, D., and Sinclair, G. (2015). Deep-water seed populations for red tide blooms in the Gulf of Mexico. Mar. Ecol. Progr. Ser. 529, 1–16. doi: 10.3354/meps11272
Wilber, D. H. (1992). Associations between freshwater inflows and oyster productivity in Apalachicola Bay, Florida. Estuar. Coast. Shelf Sci. 35, 179–190. doi: 10.1016/s0272-7714(05)80112-x
Williams, W., Beardsley, R., Irish, J., Smith, P., and Limeburner, R. (2001). The response of georges bank to the passage of Hurricane Edouard. Deep Sea Res. Part II 48, 179–197. doi: 10.1016/s0967-0645(00)00118-1
Yuan, J., Miller, R. L., Powell, R. T., and Dagg, M. J. (2004). Storm-induced injection of the Mississippi River plume into the open Gulf of Mexico. Geophys. Res. Lett. 31:L09312.
Yunev, O. A., Carstensen, J., Moncheva, S., Khaliulin, A., Ærtebjerg, G., and Nixon, S. (2007). Nutrient and phytoplankton trends on the western Black Sea shelf in response to cultural eutrophication and climate changes. Estuar. Coast. Shelf Sci. 74, 63–76. doi: 10.1016/j.ecss.2007.03.030
Zamudio, L., and Hogan, P. J. (2008). Nesting the Gulf of Mexico in Atlantic HYCOM: oceanographic processes generated by Hurricane Ivan. Ocean Modell. 21, 106–125. doi: 10.1016/j.ocemod.2007.12.002
Zapata, M., Fraga, S., Rodríguez, F., and Garrido, J. L. (2012). Pigment-based chloroplast types in dinoflagellates. Mar. Ecol. Progr. Ser. 465, 33–52. doi: 10.3354/meps09879
Keywords: hurricane, MODIS, OLCI, CDOM, DOC, POC, phytoplankton, NCOM
Citation: D’Sa EJ, Joshi ID, Liu B, Ko DS, Osburn CL and Bianchi TS (2019) Biogeochemical Response of Apalachicola Bay and the Shelf Waters to Hurricane Michael Using Ocean Color Semi-Analytic/Inversion and Hydrodynamic Models. Front. Mar. Sci. 6:523. doi: 10.3389/fmars.2019.00523
Received: 29 May 2019; Accepted: 12 August 2019;
Published: 28 August 2019.
Edited by:
Toshi Nagata, The University of Tokyo, JapanReviewed by:
Qian P. Li, Chinese Academy of Sciences, ChinaYouhei Yamashita, Hokkaido University, Japan
Copyright © 2019 D’Sa, Joshi, Liu, Ko, Osburn and Bianchi. This is an open-access article distributed under the terms of the Creative Commons Attribution License (CC BY). The use, distribution or reproduction in other forums is permitted, provided the original author(s) and the copyright owner(s) are credited and that the original publication in this journal is cited, in accordance with accepted academic practice. No use, distribution or reproduction is permitted which does not comply with these terms.
*Correspondence: Eurico J. D’Sa, ZWpkc2FAbHN1LmVkdQ==